
Abstract
Peripheral milling process productivity or quality can be improved by controlling either cutting force or contour error. While each means for improvement is often addressed individually, efforts to control both aspects simultaneously are less common in the literature. This article describes an approach to control both the contour error and force using an adaptive robust controller. The axes dynamic behavior and tool deflection are considered as the two major sources of error expressly considered in the control design and are embedded in a global task coordinate frame representation of contour error. The adaptive control component maintains high-performance control of both force and contour error in the presence of significant model error or external disturbances. The control approach is implemented on a three-axis machine tool for validation. Experimental results indicate that significant improvements to both contour error and force regulation have been achieved.
Keywords
Introduction
The use of computer numerical control (CNC) in machining operations enables machine tools to produce a variety of part shapes including complex curves and surfaces. Any deviation of the finished part from the desired shape is termed form error. Form error reduces quality and in extreme cases can require a part to be scrapped. Form error in a peripheral milling operation stems primarily from contour error, tool deflection, and external disturbances. Contour error (CE) is geometric tool position error mainly caused by imperfections in the machine construction and discrepancies in axes behavior and loading. Cutting forces also have an effect on the productivity of a machining operation. Large fluctuations in cutting force can cause tool chatter, accelerate tool wear or even cause breakage. Actively controlling the cutting force and compensating for sources of CE is therefore an attractive means for improving machining productivity.
Traditional attempts at reducing CE focus on improving axis tracking error, which indirectly reduces the CE. This approach cannot account for discrepancies between axis behavior due to uneven wear, loading, or tool and workpiece deflection 1 during operation. More advanced approaches for reducing CE, such as those discussed in Ramesh et al., 2 overcome most of these difficulties by considering axis coupling. The coupled approach was first introduced by the cross-coupled controller (CCC) of Koren and Lo, 3 and Rahaman et al. 4 which is suitable for transfer function methods and systems with slowly varying uncertainties. A linear state space approach to CE control was developed by Chiu and Tomizuka 5 by reformulating the problem in a local task coordinate frame defined at the desired position of the tool, but approximations used in this approach cause its accuracy to vary with path curvature. Furthermore, CE improvements have been achieved by refining the local task coordinate frame approach 6 and by utilizing neural-network-based feedback and feed-forward control. 7 Control of CE for nonlinear plants has recently been addressed by the equivalent error approach of Chen and Wu, 8 and with a similar approach 9 that defines a global task coordinate frame (GTCF) that calculates the contour error exactly to its first-order approximation. The GTCF approach transforms the CE description into a two-state system with one state describing the contour error and the other state defining the location along the desired contour. To produce the best possible results, the GTCF approach will be used in this work.
Most attempts to control CE ignore the effects of tool deflection, which can be a significant source of error in machining applications. Attempts to correct for tool deflection typically modify the tool path before cutting according to predictions from previously identified deflection or forces10–13 or modify the pre-finish path 14 to setup a final pass that exhibits constant cutting force and deflection. The approach used in this study embeds the tool deflection and axis dynamics in a single system for online control of both sources of CE. The GTCF system clearly describes the CE, but produces a nonlinear and strongly coupled dynamic system. Linear control of CE has been presented in Chiu and Tomizuka 5 and Chen and Lin 15 but can perform poorly or lose stability in the presence of disturbances and nonlinearities such as model error, inconsistencies in the base material, and tool deflection. Robust techniques such as sliding mode control 16 or fuzzy control 17 can guarantee stability, but often fail to produce high-performance control. Fuzzy control is used with the GTCF in Ngo and Shin, 18 but no tool deflection or force control was considered. Lee et al. 19 and Wang et al. 20 presented robust controllers with a CCC approach for finding CE, but no consideration was given to tool deflection or cutting force. Contour errors due to transmission compliance are addressed in Uchiyama et al., 21 but again tool deflection and cutting force are ignored.
Control of machining force via feedrate adjustment is well established in Landers and colleagues22–24 and Shin and colleagues25–27 which show that the force system is mildly nonlinear with parameters that are likely to change significantly during operation such as depth of cut (DOC), tool wear, and process temperature. This variation necessitates the use of robust control to ensure stability or adaptive control to improve performance. The combined control of force and contour error (FCE) is less commonly addressed, but especially useful since CE control alone can introduce force variations. Luo et al. 7 apply a neural network approach to control of FCE, but the CE component is limited to feed-forward improvements. Later, Tang et al. 28 presented a hierarchical approach for FCE that operates with a linearized system model. Neither case considered the effects of tool deflection.
Significant improvements to peripheral milling counter error can be achieved using the most accurate description of contour error (i.e. the GTCF) in combination with a highly capable nonlinear controller while also considering tool deflection compensation and force control. To the authors’ knowledge, this approach to solving the contour error problem has not yet been analyzed in the literature. In this work, the adaptive robust control (ARC) method introduced in Yao and colleagues29–31 will be used to control the combined FCE system with consideration for tool deflection. The ARC approach utilizes known bounds on parametric uncertainty and external disturbances to provide robust and high-performance model-based control of nonlinear systems. The control system design and implementation are described, and experimental results are provided.
Experimental setup
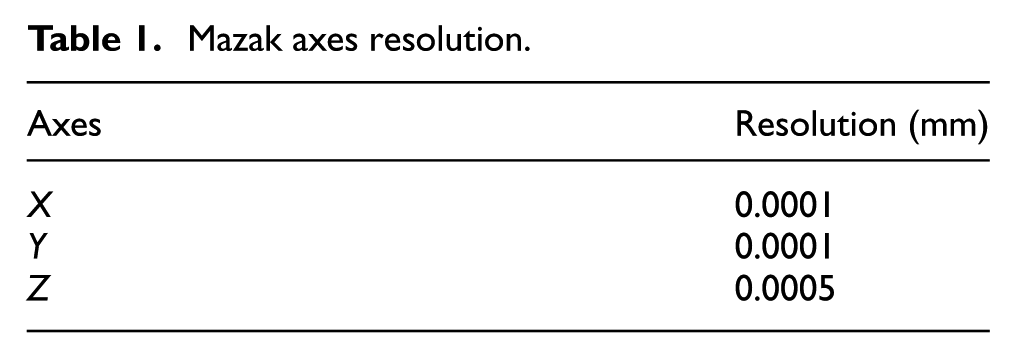
The combined FCE control experiments were implemented with a Mazak VQC-15/40 vertical machining center that has been modified to accept control from an in-house developed open architecture controller (OAC).26,32 The Mazak has three axes and a spindle with the command resolution capabilities shown in Table 1. Each axis is driven by a 32-bit position controller using an AC servo motor and a relative rotary encoder with a resolution of 5000 pulse/rev. Position and spindle speed commands are received from the OAC at 0.00355 s intervals (∼282 Hz). The OAC is composed of three major components: a user interface, a real-time computer, and a data bus interface. The user interface is implemented on a non-real-time Windows computer for high-level control and data storage. The real-time computer—a National Instruments (NI) PXI-8176 computer running LabVIEW-RT—accepts high-level commands from the user interface, calculates position and spindle values, and then communicates with the Mazak via the data bus interface. The data bus interface is implemented on an Altera Field-Programmable Gate Array development board. All Programmable Logic Controller and emergency stop functionality existing on the Mazak mill are left intact. This arrangement (illustrated in Figure 1) provides complete control over the machining center to enable the use of custom control algorithms.
Mazak axes resolution.
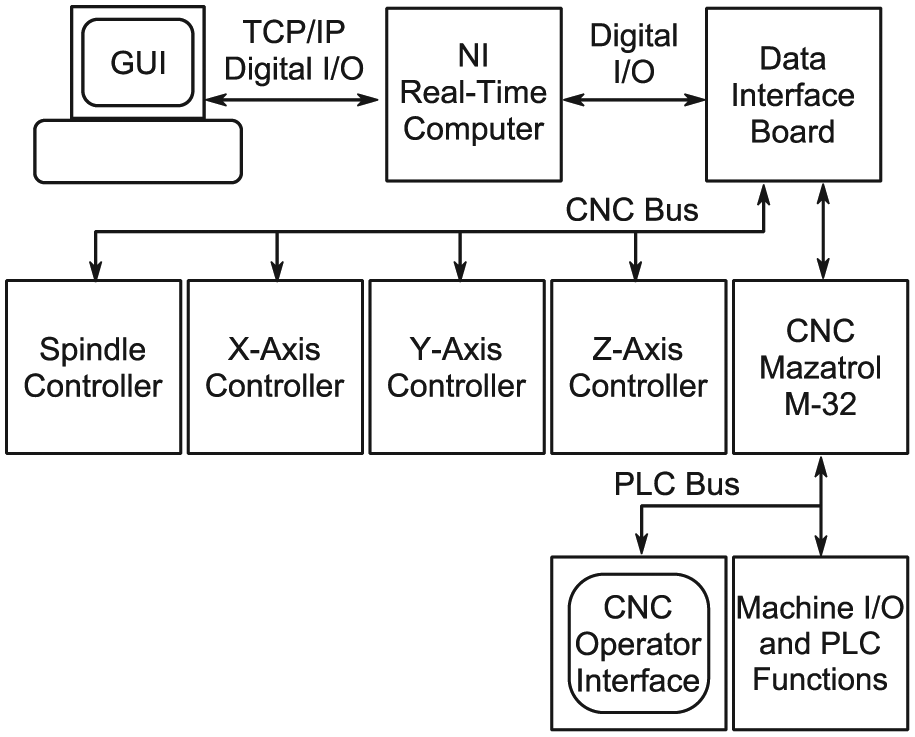
OAC arrangement.
The Mazak spindle power is measured with a Load Controls, Inc. PH-3A power cell. Cutting forces were measured during identification runs with a Kistler 9257B dynamometer mounted on the work table and a 5004 dual mode amplifier. Both measurement sources were sampled by the NI computer at the Mazak operation frequency. Offline measurements of the finished part contours were performed on a Brown & Sharpe microxcel pfx coordinate measuring machine (CMM).
The experimental contour was a circular boss, which is 2.54 mm tall cut on the top face of the workpiece.The workpiece is a 76.2 × 102 × 130 mm block of 7075 aluminum mounted to the work table with the 76.2 × 102 mm face on top as shown in Figure 2. A two-flute 19.1 mm diameter end mill with a 30° helix angle rotating at 3000 r/min was used for all operations. The contour begins at the 90° position with an arc-shaped lead-in move and rotates in the clockwise direction (climb milling) until a complete circle has been cut, followed by an arc-shaped lead-out. The offline CMM measurements were aligned relative to the features shown in Figure 3.
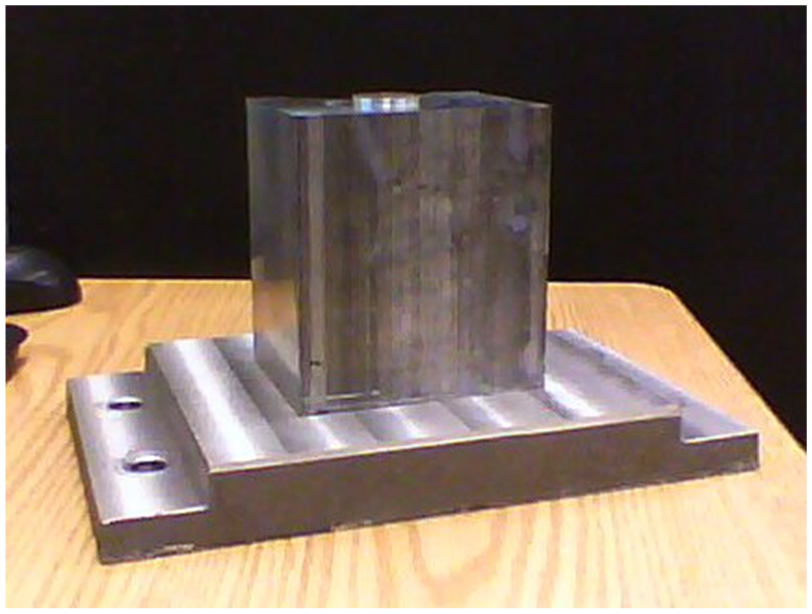
Experimental workpiece with the attached mounting base plate.
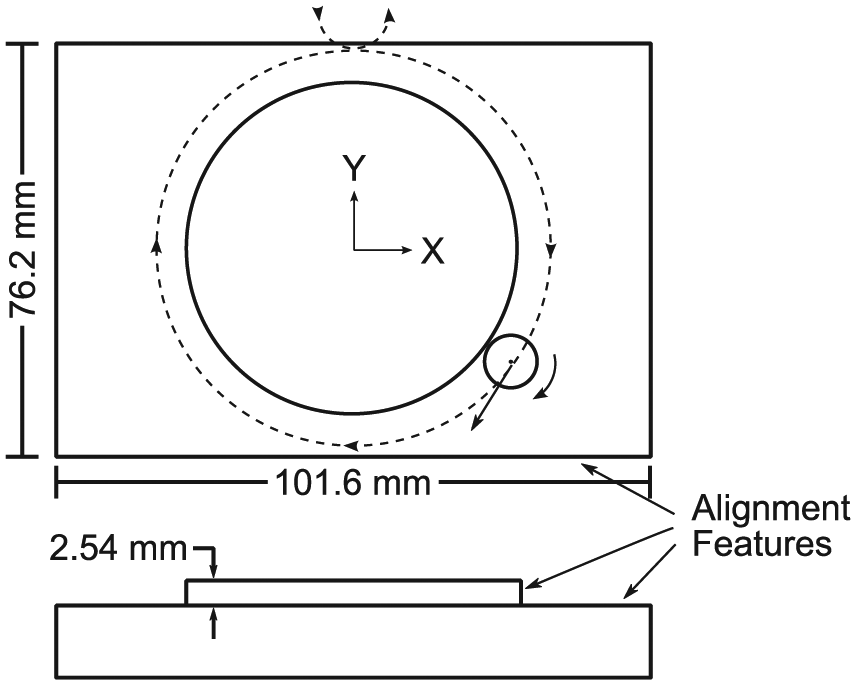
Circular cut arrangement (the tool path is indicated by dotted line).
System modeling
Three aspects of the system must be modeled for control: axes positions, cutting force, and tool deflection.
Axes position models
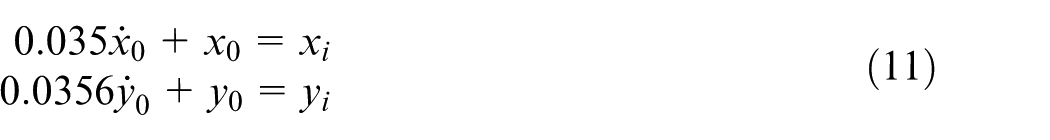
The circular contour to be tested was constrained to the X- and Y-axes, and position models of each axis were identified following the procedure described in Rober and Shin. 26 Each axis was commanded to move in a sine wave pattern for a set of 20 frequencies ranging from 0.1 to 80 Hz. The sine wave amplitudes were selected to limit the accelerations to safe values (listed in Table 2), which were determined by recording the Mazak axes positions when manually moving at the 50% rapid rate. The position data taken during the sine wave operation was used in the MATLAB system identification toolbox to produce linear dynamic models of each axis. The identified models are as follows
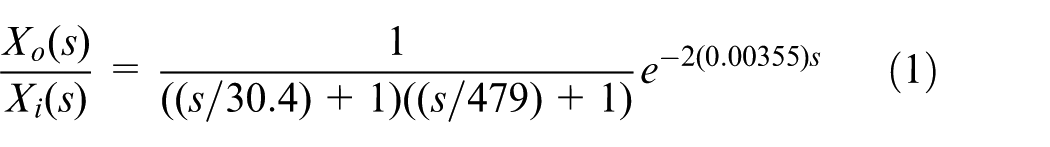
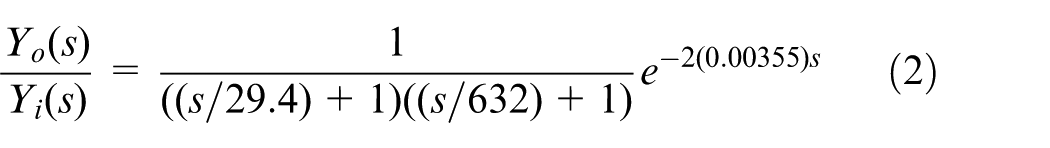
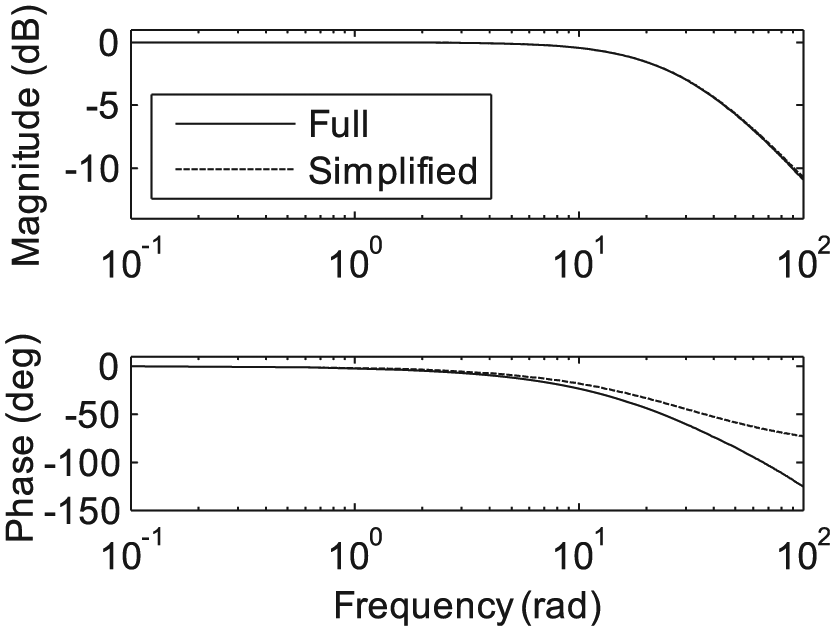
where subscripts o and i represent the output and input, respectively. The models can be simplified by neglecting the relatively small delay time of 0.0071 s and fast poles, which decay very quickly with respect to the sampling time. Bode plots of the simplified models
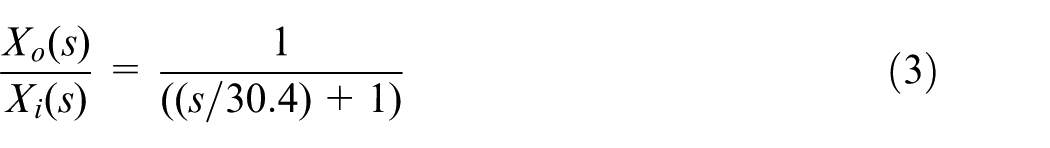
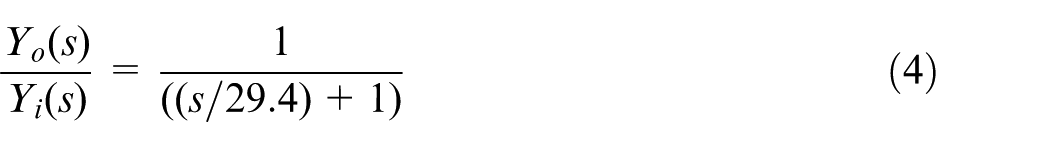
are compared with the originals in Figures 4 and 5. It will be shown later that the robustness provided by ARC makes the effects of this simplification negligible. Care must be taken during the control design to avoid operating outside the range of good approximation, which extends up to frequencies of 100 rad/s, or approximately 15 Hz.
Identified maximum accelerations for Mazak axes (mm/s2).
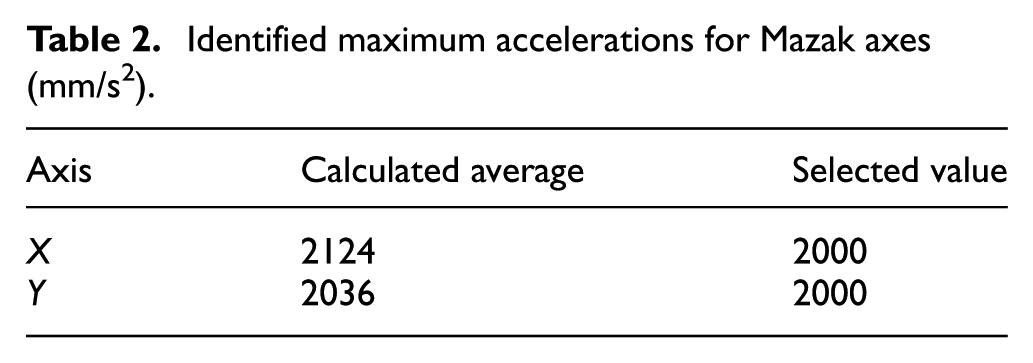
Bode plot of original and simplified X-axis models.
Bode plot of original and simplified Y-axis models.
Cutting force model
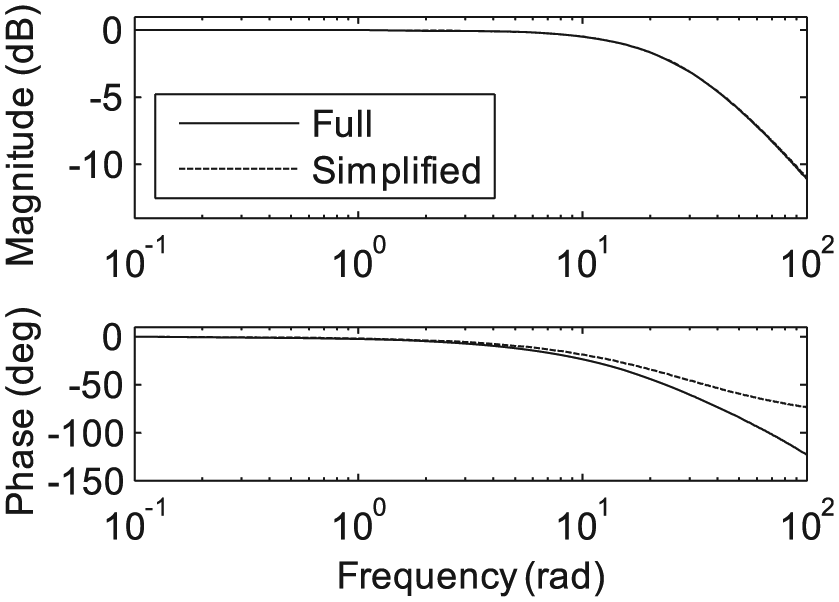
The peak cutting force is known to be a function of both axial and radial DOC, spindle speed, and feedrate. Of these, only feedrate is allowed to vary during the control experiments. To model the relationship between force and federate, a number of identification experiments were performed for both linear and circular contours at various feedrates. The average peak cutting force was then fit to an exponential curve using the MATLAB curve fitting tool. The resulting model is as follows

where F (N) is the peak cutting force and f (mm/s) is the feedrate. The data fit is reasonable, with a coefficient of determination value of R2 = 0.92 as shown in Figure 6.
Comparison of modeled cutting force with experimental data.
A linear relationship between tool power Pt (W) and peak cutting force has been used for milling processes.33,34 The force is then given by
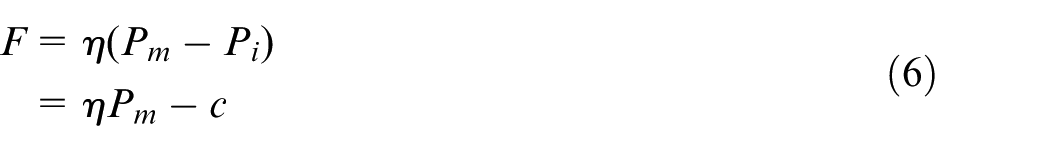
where

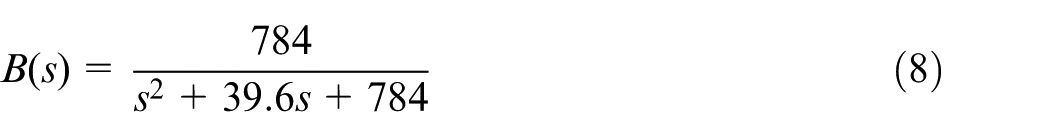
which follows the data trend with some discrepancy as shown in Figure 7. The spindle power measurement is very noisy, which required the calculated force to be filtered before applying it to control. The filtering is accomplished with a second-order low-pass Butterworth filter with a cutoff frequency of 4.46 Hz, or 28 rad/s
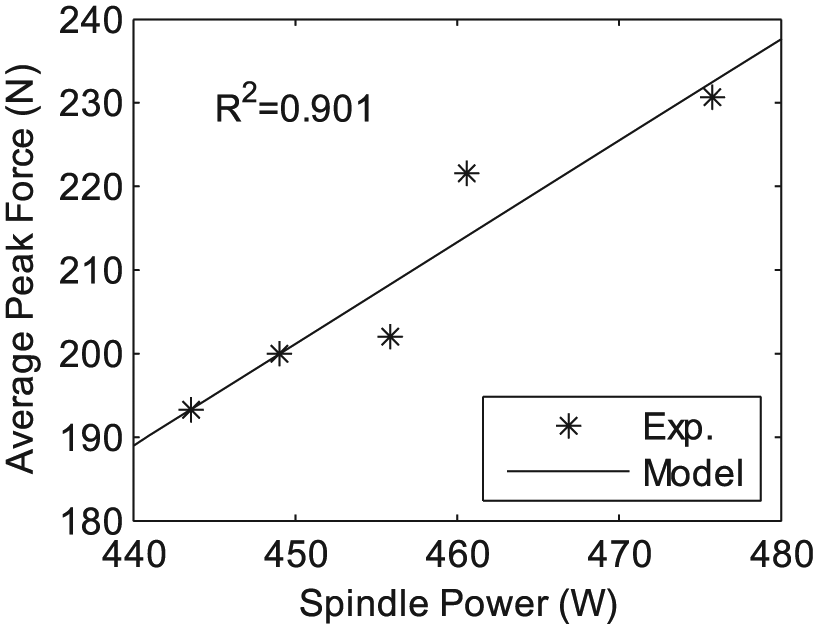
Experimental and model results for average milling peak force.
Tool deflection
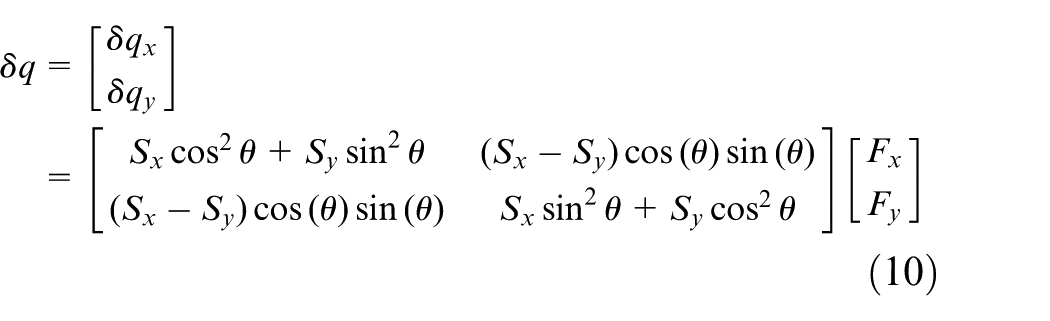
The tool deflection is modeled as a linear biaxial spring system with the principal axes rotated from the X- and Y-axes directions by an angle
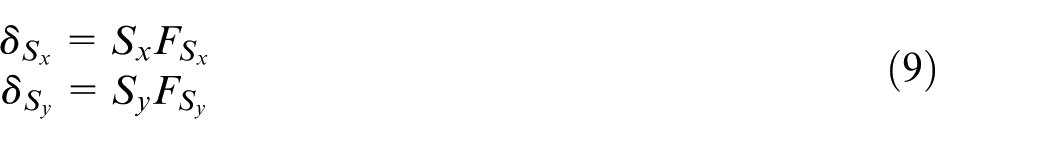
where
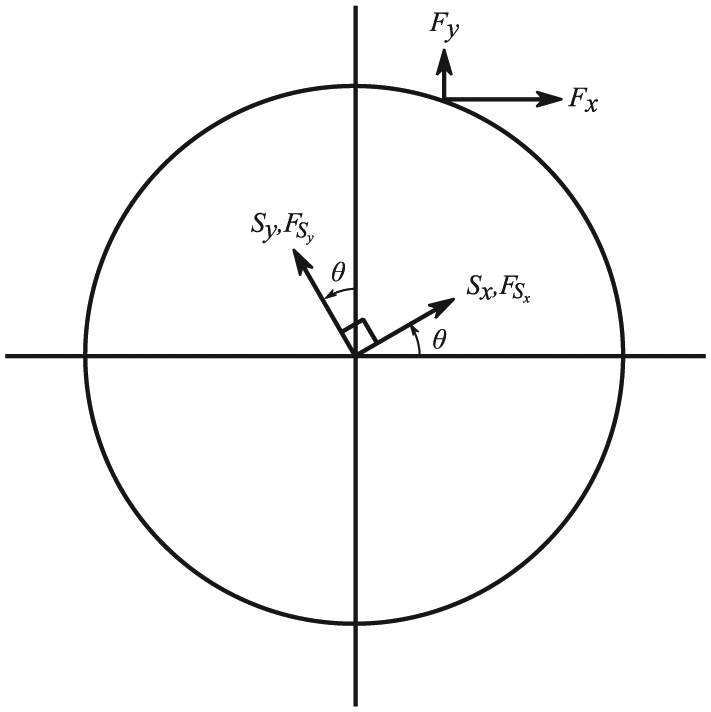
Overview of deflection analysis components.
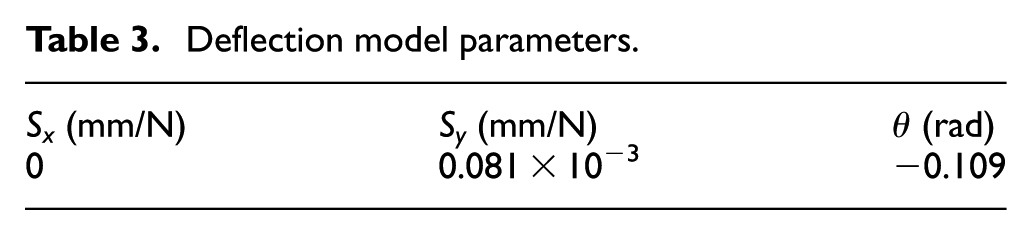
To measure the tool deflection, identical circles were cut in an aluminum workpiece and in a foam board workpiece. The foam board exerts negligible cutting forces on the tool which eliminates tool deflection from the process. Any discrepancy between CMM measurements of the aluminum and foam workpieces were attributed to tool deflection, regardless of the actual source of the error. Measured deflections were typically in the range of 0.005–0.03 mm, about one order of magnitude larger than the axes contour error. The deflection model parameters (given in Table 3) were selected as those which minimize the difference between the observed contour error and that predicted by the deflection model. The best fit of model parameters to the deflection model produced a small negative value of
Deflection model parameters.
The spindle power–based force measurement corresponds to the resultant peak tangent cutting force. For use in the deflection model, this force must be separated into components along the X- and Y-axes directions. The identification experiments showed that the resultant force acts in a direction oriented 0.646 rad (∼53°) from the tool path tangent. The tool path tangent direction is known during control and therefore, it enables the use of the deflection model in equation (10). Note that this model is specific to the workpiece and tool combination. The modeling process must be repeated for different work conditions.
Control design
The time-domain representation of the simplified axis position models in equation (3) and equation (4) is
where

where

The global task space transformation defined in Yao et al.
35
relates the Cartesian position vector q to a task space vector
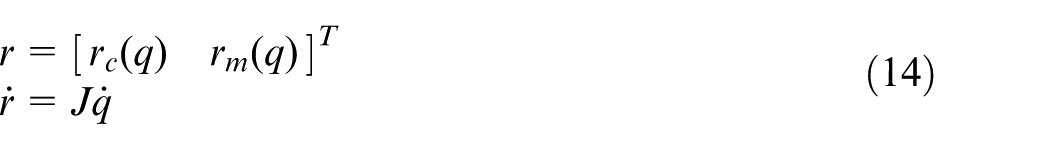
where
Noise in the force signal can lead to undesirable fluctuation in the change of deflection term
First, a Lyapunov equation based on the error is defined as
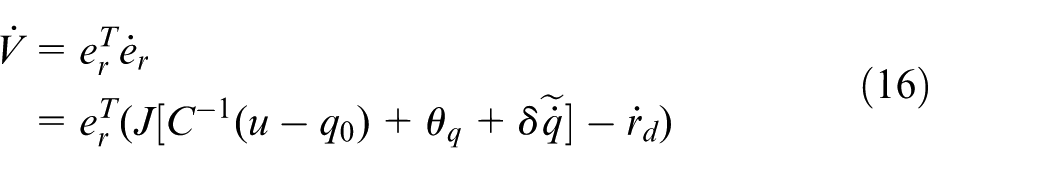
The control law u is composed of two components: a model-based feedback term that compensates for the correctly known model terms and a stabilizing robust feedback term that compensates for unmodeled behavior. The known term is defined as follows

where

The robust control term guarantees stability of the system if
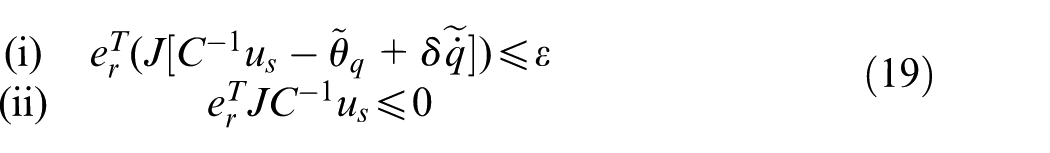
where

where

Adaptation of the unknown parameters
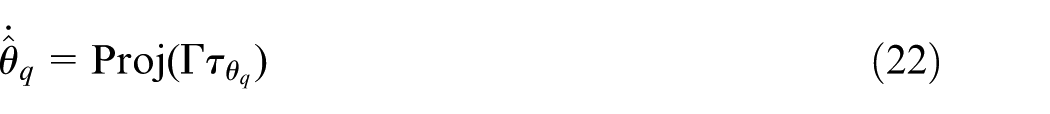
described in Yao et al.
35
with an adaptation term of
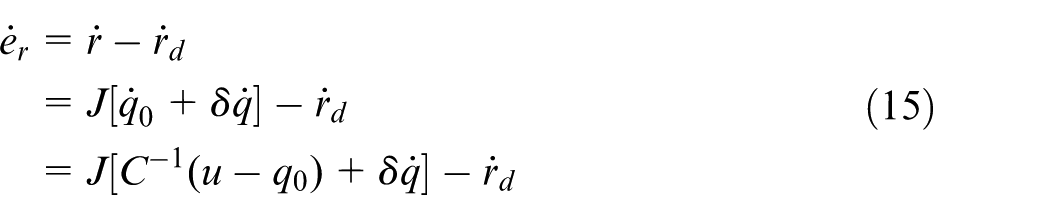
The commanded feedrate appears when calculating the trajectory for
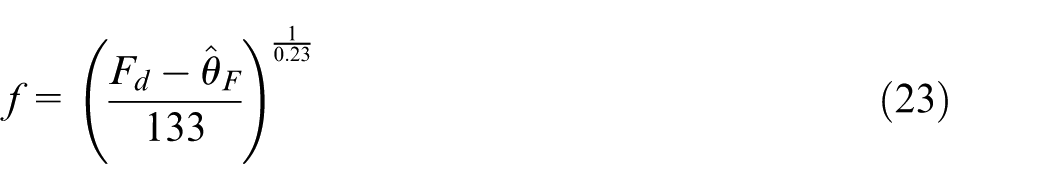
Substituting equation (23) into the error equation yields
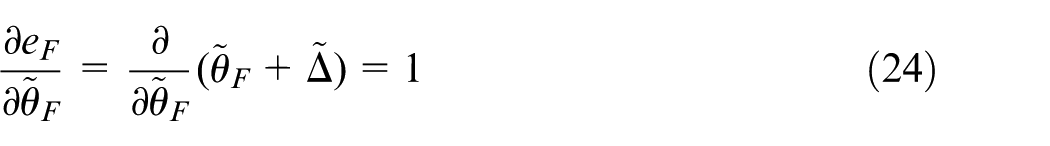
and then define the adaptation dynamics
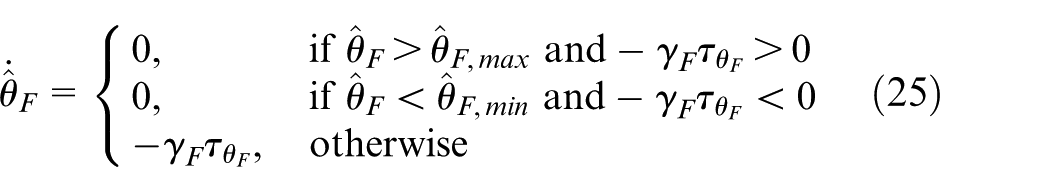
The calculated feedrate is used directly in the existing contour error control law through the term
Simulation results
To demonstrate the advantages of the proposed control method, the contour error portion of the system modeled above is controlled in simulation first using the combined H∞/zero phase error tracking controller (ZPETC)/CCC method described by Wang et al.
20
and then using the controller designed in this work. The controller is constructed by designing H∞ velocity controllers and ZPETC feed-forward position controllers for each axis. The coupled contour error is then addressed by implementing the CCC method. The system is simulated with a feedrate of 8.21 mm/s, a spindle speed of 3000 r/min, an axial DOC of 2.54 mm, and a radial DOC of 0.572 mm. The simulated tool deflection was calculated from simulated cutting force summed with white noise in the range of ±100 N. The controller design for the approach in Wang et al.
20
is not reproduced here, but the selected controller gains are
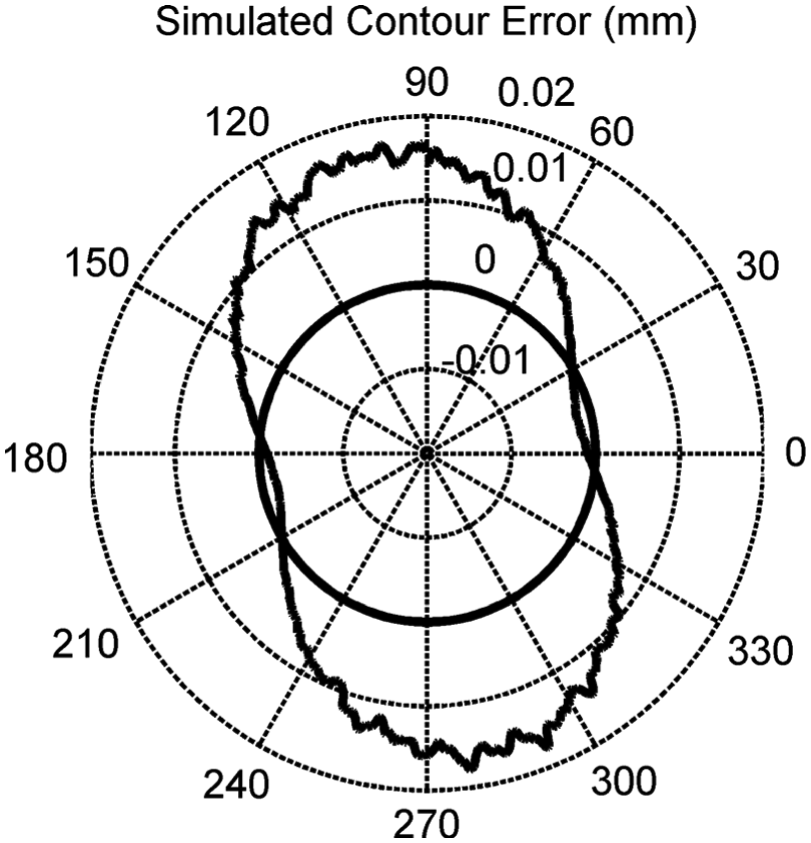
Simulated contour error for control method in Wang et al. 20
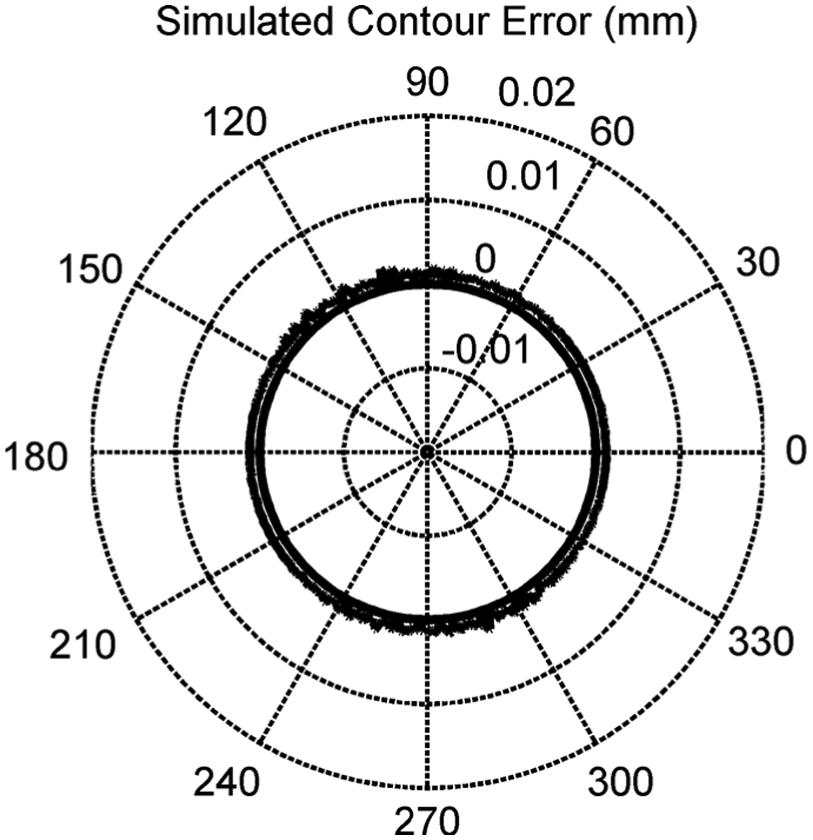
Simulated contour error for the GTCF/ARC approach.
Despite the controller’s efforts at eliminating axis position error, without a means of compensating for tool deflection, the control method from Wang et al. 20 is unable to reduce the corresponding contour error. The GTCF/ARC method significantly reduces the contour error and simultaneously improves the contour circularity. This result is clearly idealized since the tool deflection model used in the simulation is the same as that used in the control design. However, it illustrates the effects of tool deflection and the advantage of compensating for these effects.
Experimental results
Three experiment conditions were tested, each using a spindle speed of 3000 r/min, axial DOC of 2.54 mm, and a nominal radial DOC of 0.572 mm. In two cases, variation in the radial DOC was introduced by offsetting the rough cut tool path by −0.0254 mm in the x-direction. In the third case, a flat side was cut into the rough cut tool path with a maximum reduction in radius of 0.127 mm. These conditions are illustrated in Figure 11. In each case, a nominal feedrate and desired peak cutting force were specified. To prevent damage to the tool and machine, the desired peak cutting force was selected from within the typical cutting force range observed during model identification, the feedrate was limited to a range of ±20% of nominal, and accelerations were limited to a maximum of 40 mm/s2. The experiment conditions are listed in Table 4. For comparison purposes, the same conditions were applied without control to an ideal workpiece (no variation in the radial DOC). The measured contour error for the uncontrolled case is shown in Figure 12. It must be noted that this result is with the standard proportional–integral–derivative (PID) controller existing in the system.
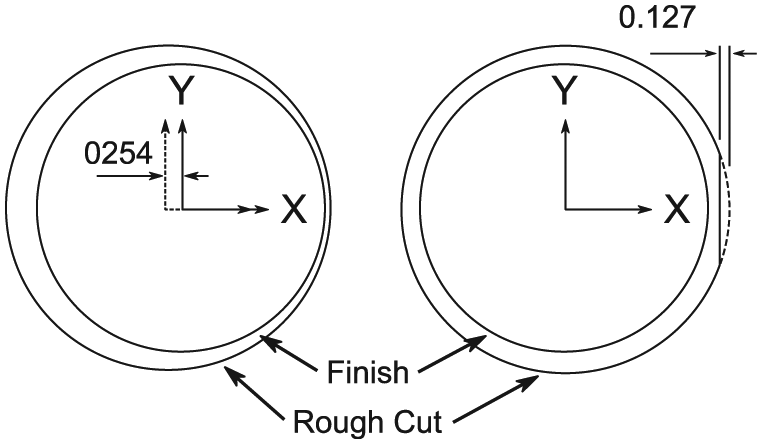
Experimental rough cuts used to introduce radial DOC variation (mm).
FCE experiment conditions.
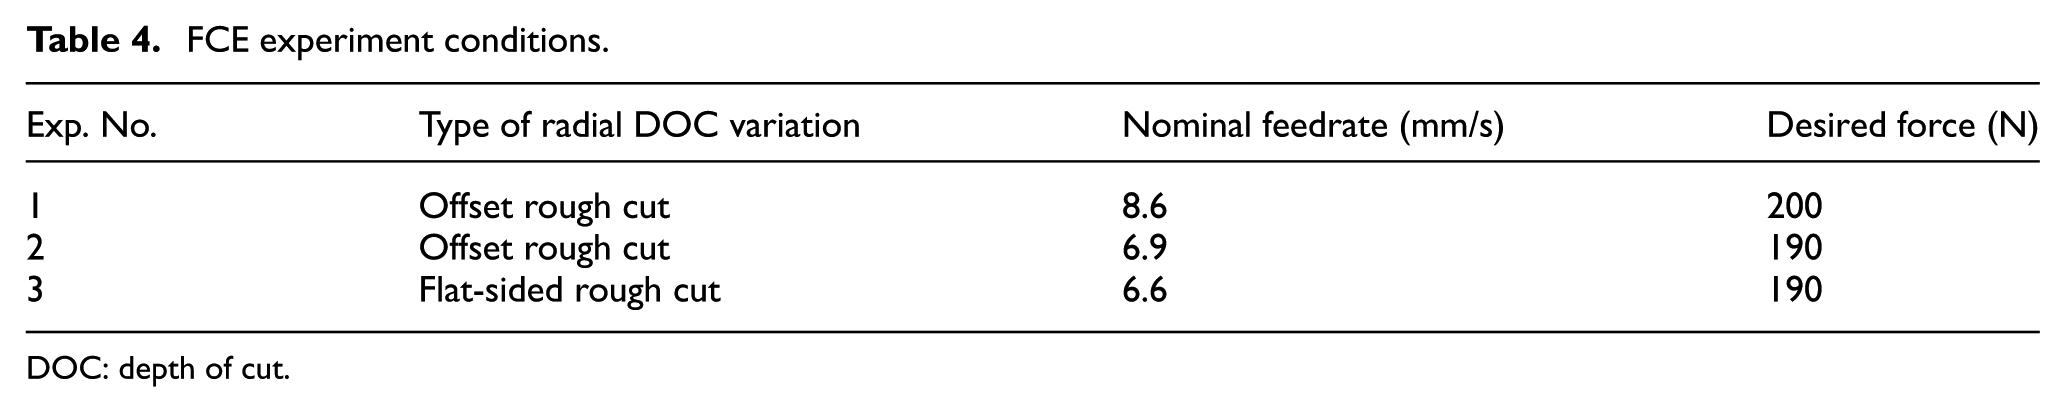
DOC: depth of cut.
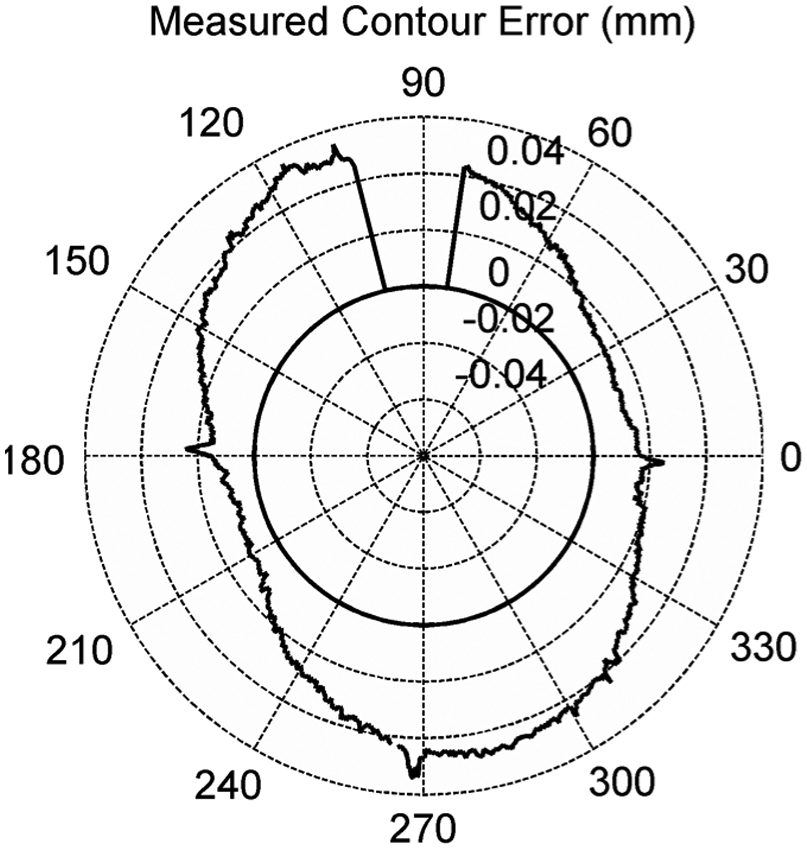
Measured contour error for uncontrolled case with feedrate of 7.37 mm/s.
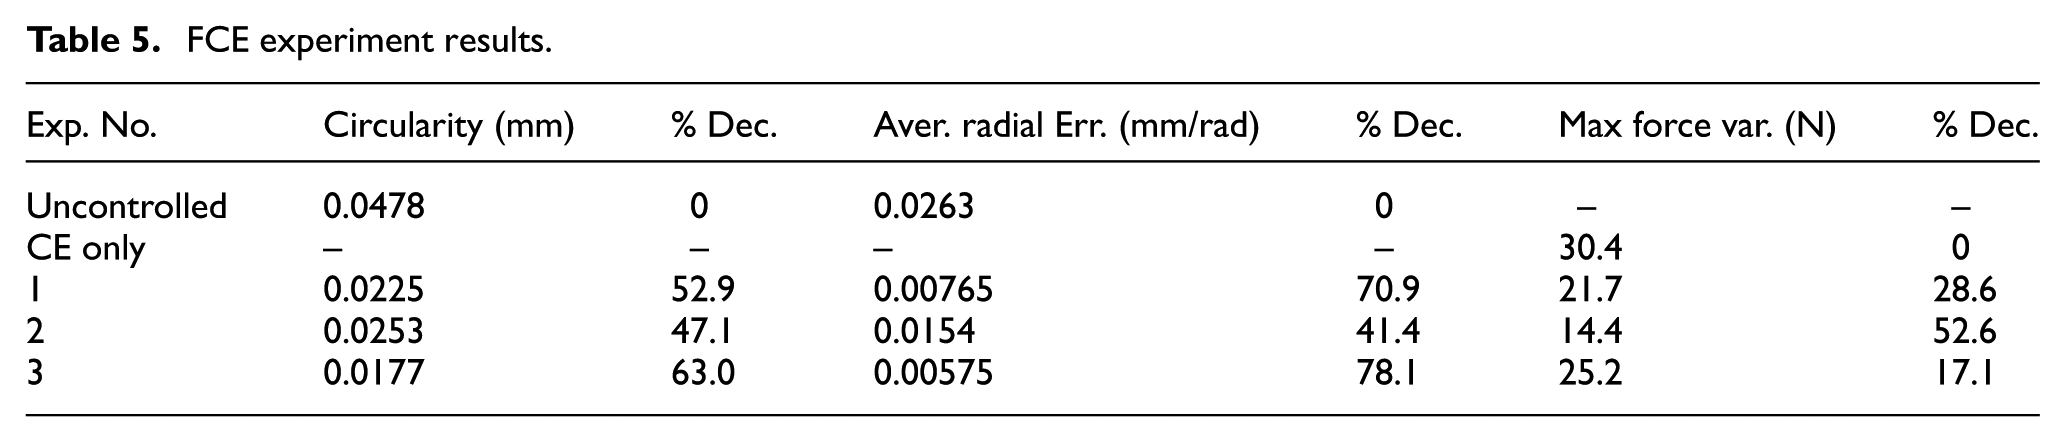
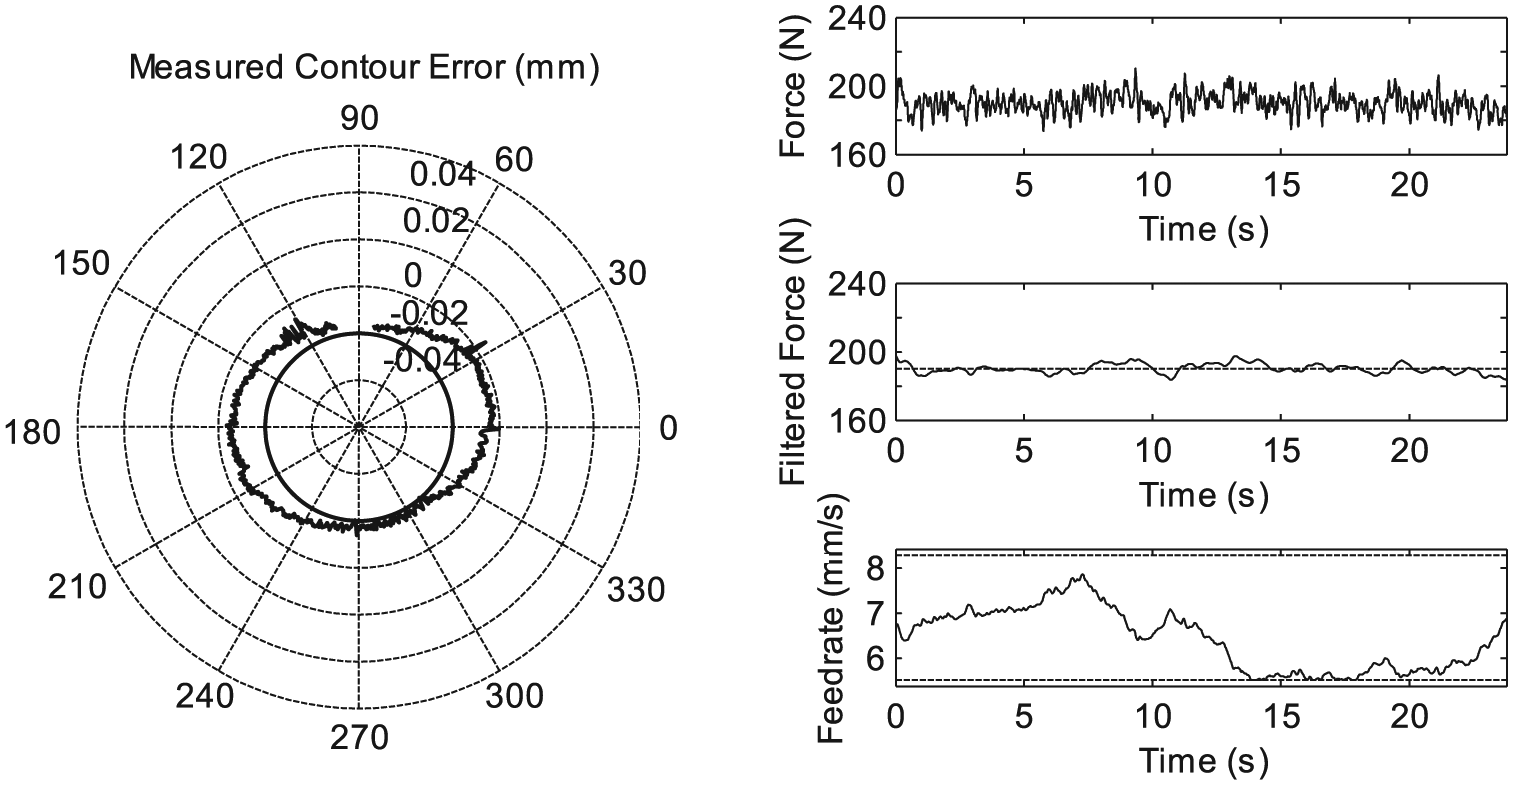
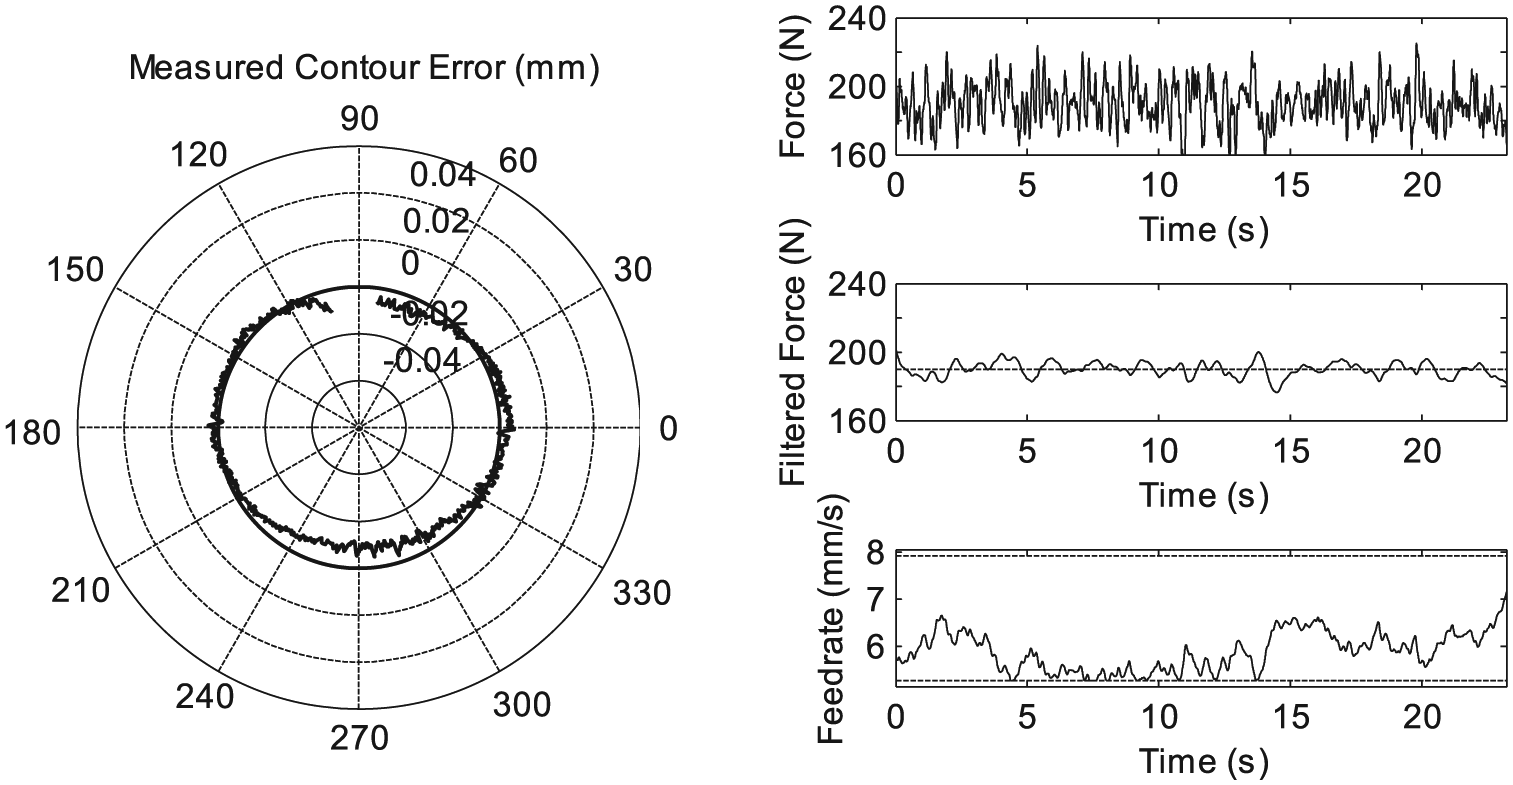
Table 5 summarizes the measured circularity (the difference between the maximum and minimum radius), average contour (radial) error, and force variation for the uncontrolled cases and the three controlled experiments. Plots of the contour error, peak cutting force, and commanded feedrate are given for each experiment in Figures 13–15, while Figure 16 shows adaptation parameter behavior typical of all experiments. Note that measurements in the range of 82°–103° are omitted from the error calculations due to the effects of the lead-in and lead-out moves. Measurements show that the controller has dramatically improved the circularity and reduced the average radial error of the machined part in each case while also reducing the amount of fluctuation in the cutting force.
FCE experiment results.
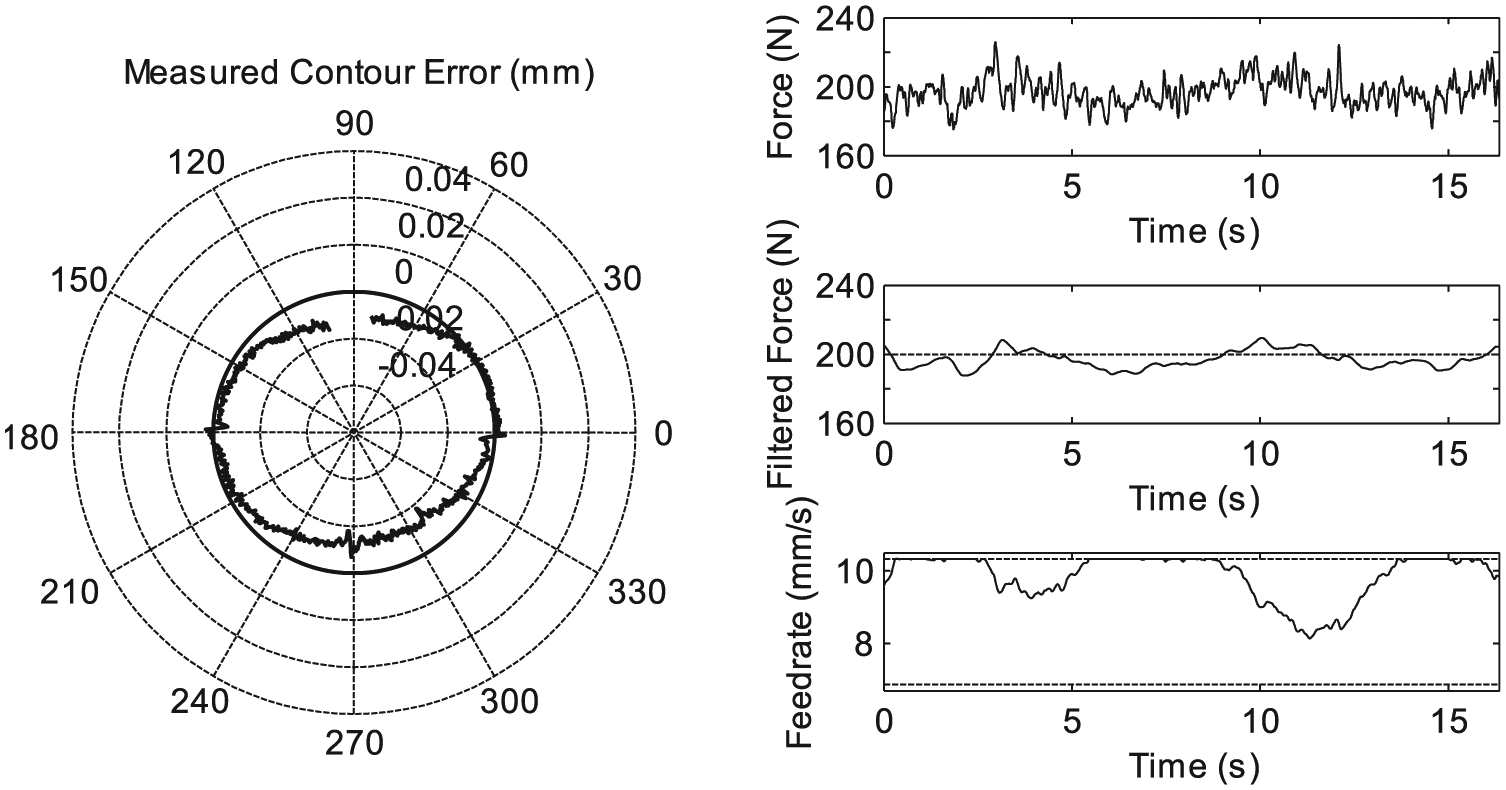
Contour error and force control results for Exp. No. 1.
Contour error and force control results for Exp. No. 2.
Contour error and force control results for Exp. No. 3.
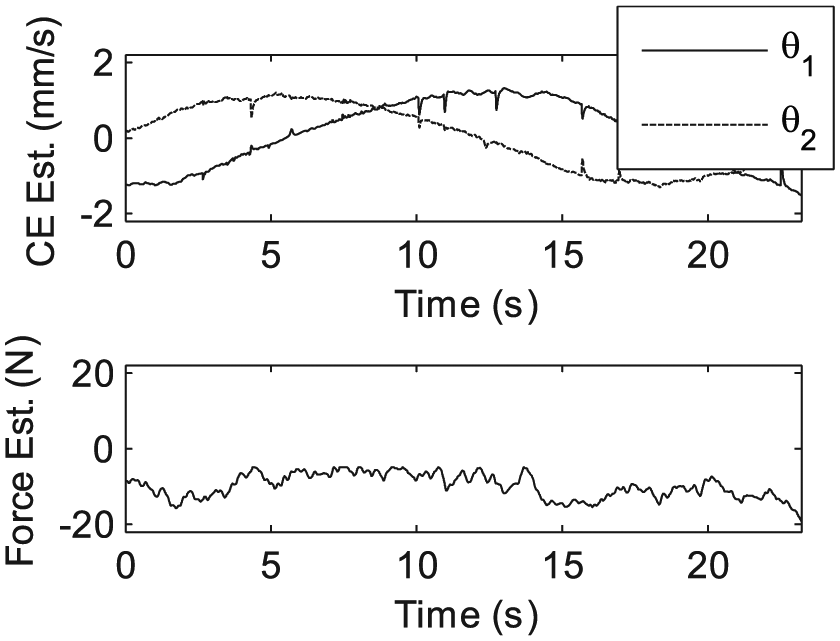
Adaptation parameters for contour error (top) and force (bottom) for Exp. No. 3 (typical of all experiments).
The feedrate limits are active in all cases, but are most prominently encountered in Exp. No. 1. While these limits are required to ensure the safety of the machine, they reduce the force control performance somewhat as can be seen in Figure 13. The CE control is unaffected by the force control performance.
The lobed shape of the uncontrolled contour error is dramatically reduced in all cases although not with identical results. This characteristic deflection shape is likely a consequence of compliance in the machine tool, cutting tool, and fixture arrangement. As such, it should be noted that unique deflection models must be developed for each particular cutting process, including the process parameters such as feedrate.
Conclusion
A combined approach for the ARC of cutting FCE was presented. The machine axes dynamics and tool deflection models were embedded in a GTCF to enable high-performance control of each. External disturbances and uncertainties in the CE and force system were addressed by the adaptive control component. The control design for the resulting highly nonlinear system was implemented for circular contours on a three-axis machine tool. Experimental results show that significant reductions in error for both CE and force have been achieved despite the presence of radial DOC variation. This validates the capability of the ARC approach to improve the contouring accuracy while maintaining constant cutting force for highly nonlinear systems with significant model uncertainty and external disturbances, and the GTCF transformation as a useful representation of contour error.
Footnotes
Appendix 1
Appendix 2
To illustrate the approximate second-order contour error system behavior, consider the transformed error dynamics given in equation (15) after substituting
Recalling that
In the linear operating region of equation (22),
which is substituted into equation (27) to produce
The error dynamics characteristic equation is then effectively
which corresponds to the classical second-order characteristic equation:
For circular contours, the transformation Jacobian is as follows
where
which eliminates coupling between each term in the error vector
Declaration of conflicting interests
The author(s) declared no potential conflicts of interest with respect to the research, authorship, and/or publication of this article.
Funding
The author(s) received no financial support for the research, authorship, and/or publication of this article.