
Abstract
Radial forging was introduced to the strain-induced step in the strain-induced melt activation process to prepare high-quality semi-solid A356.2 billet for the high solid fraction compression. Then, the deformation behaviour and microstructures at different compression velocities, temperatures and deformation zones were investigated. The results showed that radial forging can induce enough strain at 60% reduction of area to prepare ideal semi-solid microstructure. The microstructure had no obvious improvement at 75% reduction of area because the distortion energy may be saturated at 60%. During compression tests, the flow stress was sensitive to compression velocity (Vc) but was insensitive to holding temperature (Th), and it obeyed the power law
Introduction
Semi-solid metal processing (SSMP) has attained considerable interest owing to its distinctive rheological characteristics that originated from spherical-like microstructures.1,2 Compared with conventional casting and forging, SSMP exhibits lower forming temperature, less deformation resistance, better formability and higher mechanical properties.3,4 Thus, investigations on the preparation technology, microstructural evolution and deformation behaviour of the semi-solid alloys have caused lots of attention.
Among different kinds of production technologies, strain-induced melt activation (SIMA) is one of the most widely investigated technologies to obtain fine and spheroidal solid particles,5,6 which include deformation step and partial re-melting step. The former is obviously more crucial and caused more researches. Here, we summarize the common strain-induced methods used in the SIMA process as follows: cold compression and warm compression,7,8 equal channel angular extrusion (ECAE), 9 cyclic upsetting-extrusion process (CUEP), 10 rolling, 11 cross wedge rolling (CWR), 12 multi-axial forging (MAF), 13 accumulative back extrusion (ABE), 14 cyclic closed-die forging (CCDF) 15 and cyclic extrusion compression (CEC). 16 Although high-quality semi-solid billet can also be prepared by the above-mentioned method, the billet dimensions are severely limited by the capacity of the equipment. However, the investigation on the large semi-solid billet preparation in SIMA technologies for industrial application is less presented.
Furthermore, many investigations tried to seek the primary origin of the thixotropic deformation behaviour from the corresponding microstructure through the semi-solid compression test. Shang et al. 17 proposed that four deformation mechanisms coexisted during the thixotropic compression process of 6061 alloy, and the predominant mechanism depended on the compression temperature and strain rate. The deformation mechanisms included liquid flow, flow of liquid incorporating solid particles, sliding among solid particles and plastic deformation of solid particles. Hassas-Irani et al. 18 explored the influence of initial microstructures on the thixotropic behaviour of A356 alloy during semi-solid compression and pointed out that due to the flow of liquid incorporating solid particle mechanism, globular microstructure exhibits the lowest flow resistance, followed by coarsened microstructure, rosette-like microstructure and cast microstructure. Some studies just concentrated on the local microstructure such as the centre microstructures and the edge microstructures during the compression test. However, the microstructures are greatly affected by the deformation zones it located. The detailed partition of the deformation zone is also less presented in the literature.
In this work, radial forging (RF) is applied to the strain-induced step in the SIMA process to obtain the semi-solid microstructure of A356.2 alloy, which can produce relatively large billet with large strain and good deformation uniformity. Then, high-solid fraction semi-solid compression tests at different compression temperatures and velocities are conducted to investigate the deformation behaviour of A356.2 alloy. Finally, four deformation zones are divided, and the influences of compression parameters on the microstructures at different deformation zones are investigated. All these works may lay an experimental foundation for the thixoforming of the semi-solid A356.2 alloy.
Experiment
Experimental material
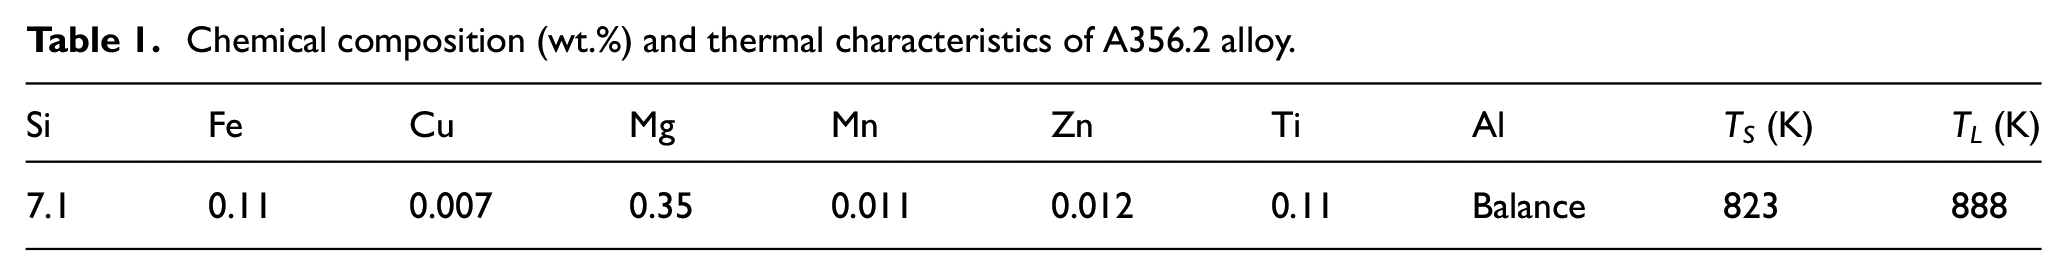
Commercial as-cast A356.2 aluminium alloy is used as experimental material; its chemical composition and thermal characteristics are shown in Table 1. The semi-solid temperature range of A356.2 aluminium alloy is obtained by differential scanning calorimetry (DSC) curve at 10 K/min as shown in Figure 1(a). Figure 1(b) shows the liquid fraction versus temperature, which is obtained by integrating under the DSC curve. It can be seen that for temperatures of 833, 838 and 843 K, the corresponding liquid fractions were 4.9%, 7.8% and 12%, respectively. These belong to high solid fraction and are suitable for thixoforming.
Chemical composition (wt.%) and thermal characteristics of A356.2 alloy.
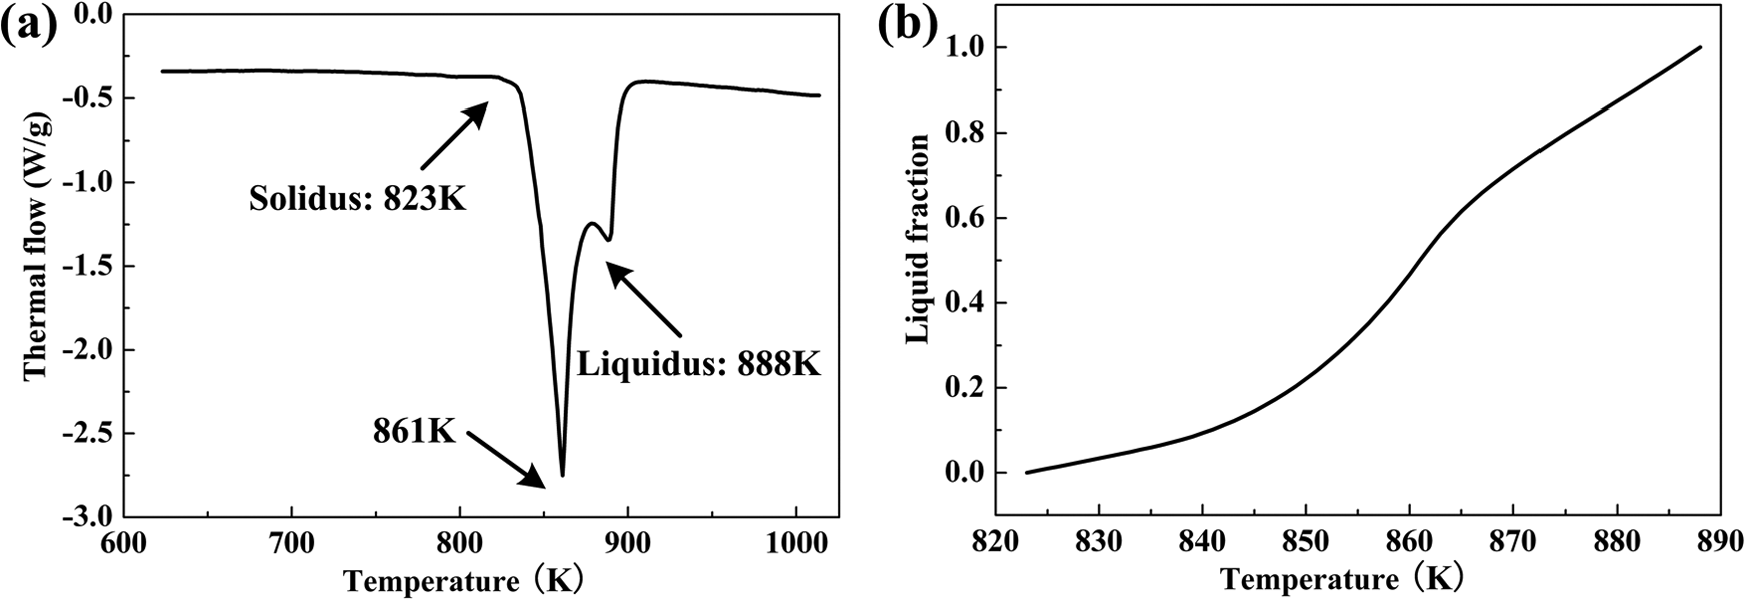
(a) DSC curve (10 K/min) of the A356.2 aluminium alloy and (b) liquid fraction versus temperature derived from the DSC curve.
Semi-solid billet preparation and compression test
RF is introduced into the SIMA process for the first time, and its working principle is shown in Figure 2. First, the as-cast A356.2 alloy bar (Φ120 mm) was held at 573 K for 90 min. Then, the preheated aluminium bar was deformed via repeating RF process until the reduction in area reached 60% (Φ76 mm) and 75% (Φ60 mm), respectively. Finally, the forged bar was quenched subsequently. During the partial re-melting process, the forged bar was isothermally held at 853 K for 15 min and water quenched immediately to retain the semi-solid microstructure.
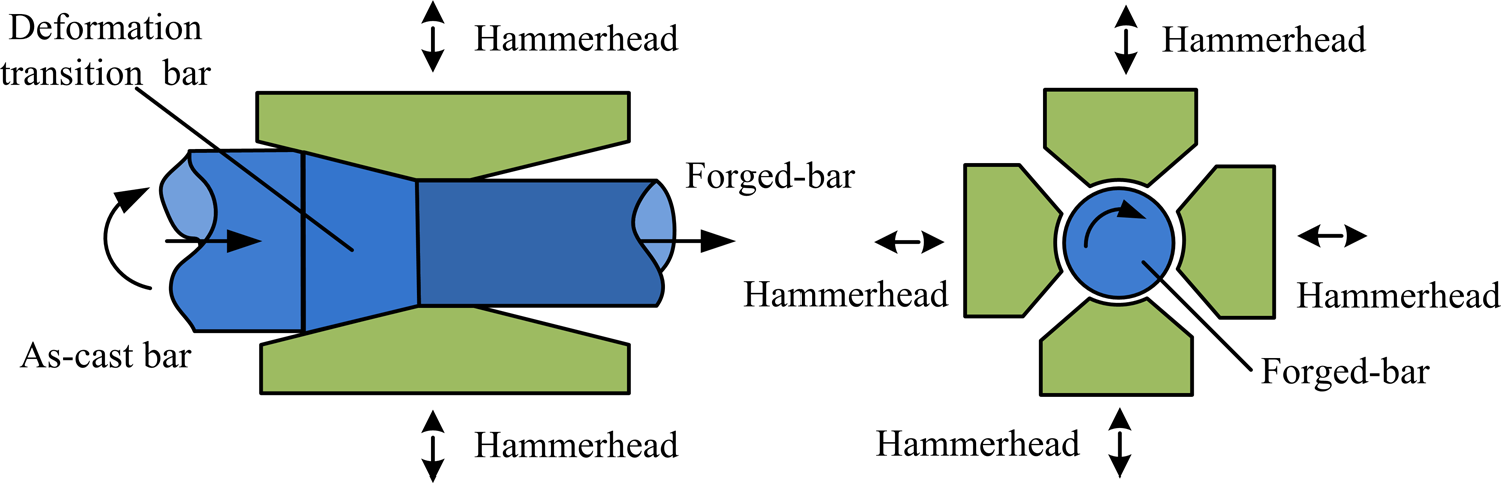
Schematic diagram for the radial forging of the as-cast A356.2 alloy bar.
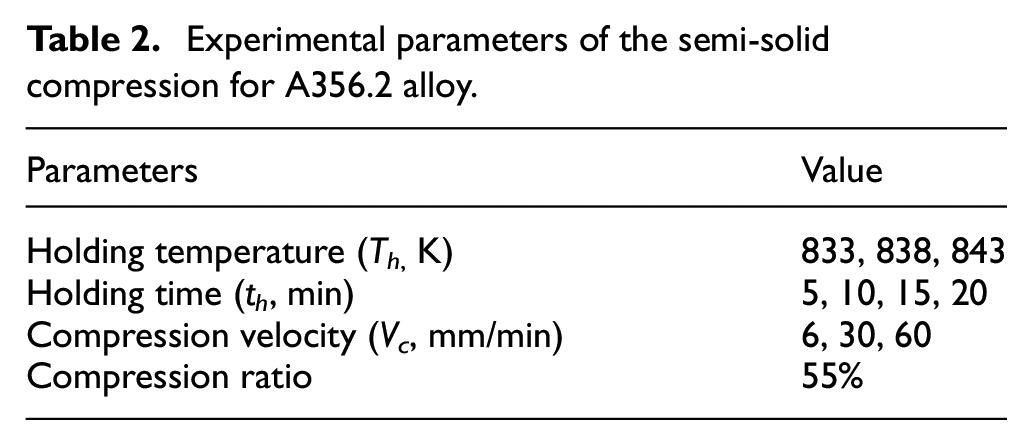
Moreover, compression specimens with dimensions Φ8 × 10 mm2 were fabricated along the forging direction at the Φ60 mm forged bar. Then, the semi-solid compression tests at different isothermal holding temperatures (Th) and compression velocities (Vc) were carried out by the Instron universal testing machine with a resistance furnace as shown in Figure 3. Three thermocouples were used to detect the temperature at the upper, middle and lower positions near the specimen before compression to retain the temperature in the furnace as uniform as possible. After compression, all the specimens were water quenched to retain the deformed microstructure. The detailed experimental matrix is given in Table 2.
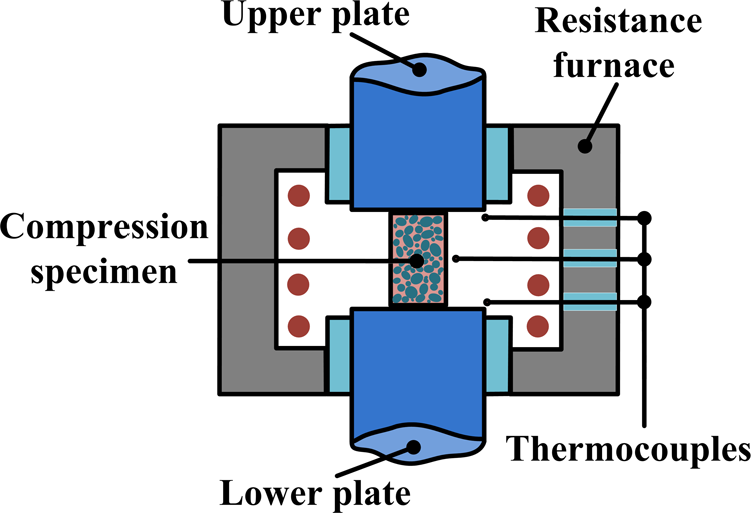
Schematic diagram for the compression test of the semi-solid A356.2 alloy.
Experimental parameters of the semi-solid compression for A356.2 alloy.
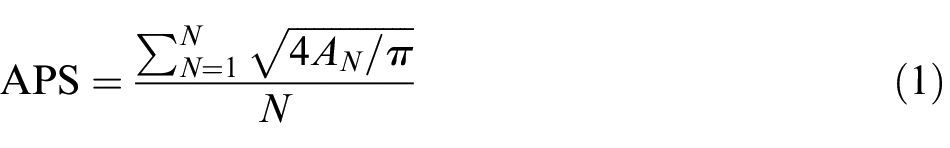
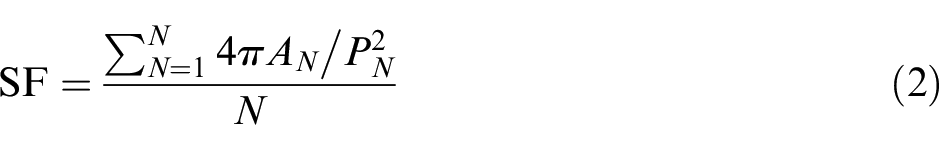
All samples were ground, polished and etched with an aqueous solution of 0.5% HF for microstructural observation. Microstructural observation was conducted on an OLYMPUS GX5 optical microscope. The average particle size (APS) and shape factor (SF) were calculated by equations (1) and (2), respectively. In these equations, AN, N and PN are area, the number and perimeter of solid grains, respectively. SF is a value that varies from 0 (for acicular particles) to 1 (for perfectly round sphere)
Results and discussion
Microstructures of the semi-solid A356.2 alloy prepared by SIMA
As shown in Figure 4, the representative microstructure of as-cast A356.2 alloy consisted of primary α-Al dendrites and some inter-dendritic eutectic structures among them. Owing to the severe plastic deformation by RF, the dendrites turned to textured structures along the forging direction as shown in Figure 5. It can be seen from Figure 5(a) that most large α-Al dendrites were crashed and elongated obviously along the forging direction and mixed with the eutectic structures, forming the laminar structures as the reduction in area reached 60%. When the reduction in area further increased to 75%, the dendrites were further broken up and the laminar structures became so compact that some further elongated grains were superimposed with each other and formed some aggregations as shown in Figure 5(b). Figure 6 shows the microstructures of A356.2 alloy with different reductions of area after isothermal holding at 853 K for 15 min. As shown in Figure 6(a), when the reduction in area was 60%, there existed many solid particles with larger size, although the particles have obviously undergone spheroidization. With further increasing reduction in area, the solid particles became finer and more spheroidal as shown in Figure 6(b). Liquid pockets were trapped in some large spheroidal grains in Figure 6(a) and (b) because the adjacent elongated particles that have perfect matching crystallographic orientation coalesced during the partial re-melting process, forming the new solid particles containing the eutectic in them. The APS and SF of the solid particles in 60% and 75% reduction in area were about 87 and 83 µm and 0.72 and 0.75, respectively. It can be seen that increasing the reduction in area refined the particle size and promoted the degree of spheroidization, but its variation was not obvious. This is because the induced strain introduced by RF may be high enough to produce good enough semi-solid microstructure as the reduction in area was 60%. Higher reduction in area can provide more distortion energy that stored in the vacancies, lattice defect and dislocation multiplication. During reheating process, vacancies will combine and dislocations will climb and cross slip to decrease the free energy, which results in the occurrence of recovery and recrystallization. 19 Thus, more distortion energy would provide larger driving force to recrystallize finer grains during reheating. In addition, more grain boundary and sub-grain boundary areas were generated with increasing reduction in area. This led to greater potentiality for the development of recrystallization nuclei. 20 Thus, the increased nucleation rate can also give finer recrystallized grains. Finally, high-angle boundaries of more recrystallized grains were penetrated by liquid, leading to the entire fragmentation of large particles to smaller and more spherical ones. However, it can be seen from Figure 6 that the distortion energy may have reached a peak value when the reduction in area was 60% since further increase in the reduction in area to 75% cannot decrease the APS obviously. This is possibly due to that the density of vacancies, lattice defect and dislocation may be saturated as the reduction in area reached 60%, and some of them would be neutralized with further increased reduction in area to 75%. Such two dislocations with opposite Burgers vectors will neutralize each other. 21 Therefore, the total amount of distortion energy did not increase obviously. Furthermore, higher reduction in area induced that the forged alloy was more thermodynamically unstable and owned stronger atomic diffusion capacity during reheating process. This will further improve the degree of spheroidization at higher reduction in area because spheroidization is a diffusion-controlled process.
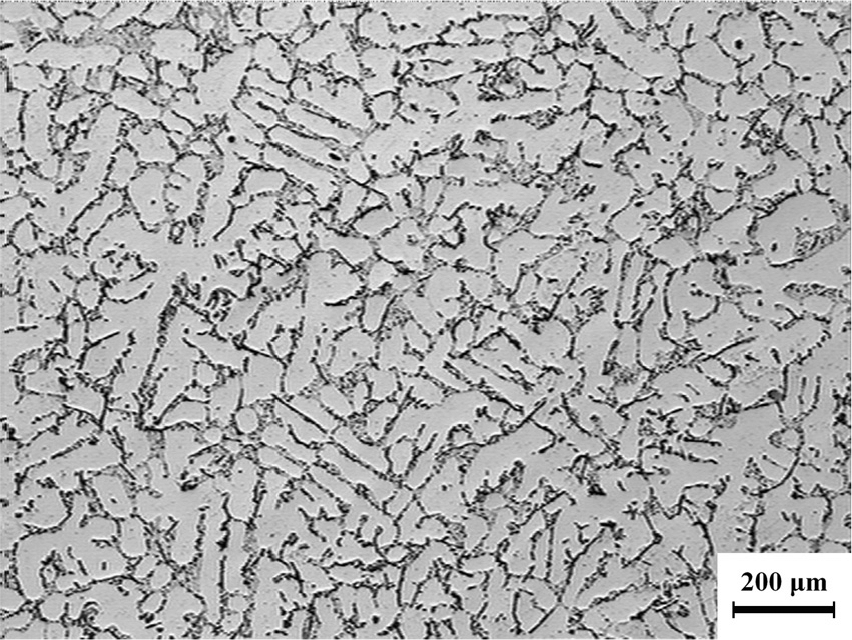
Microstructures of as-cast A356.2 aluminium alloy.
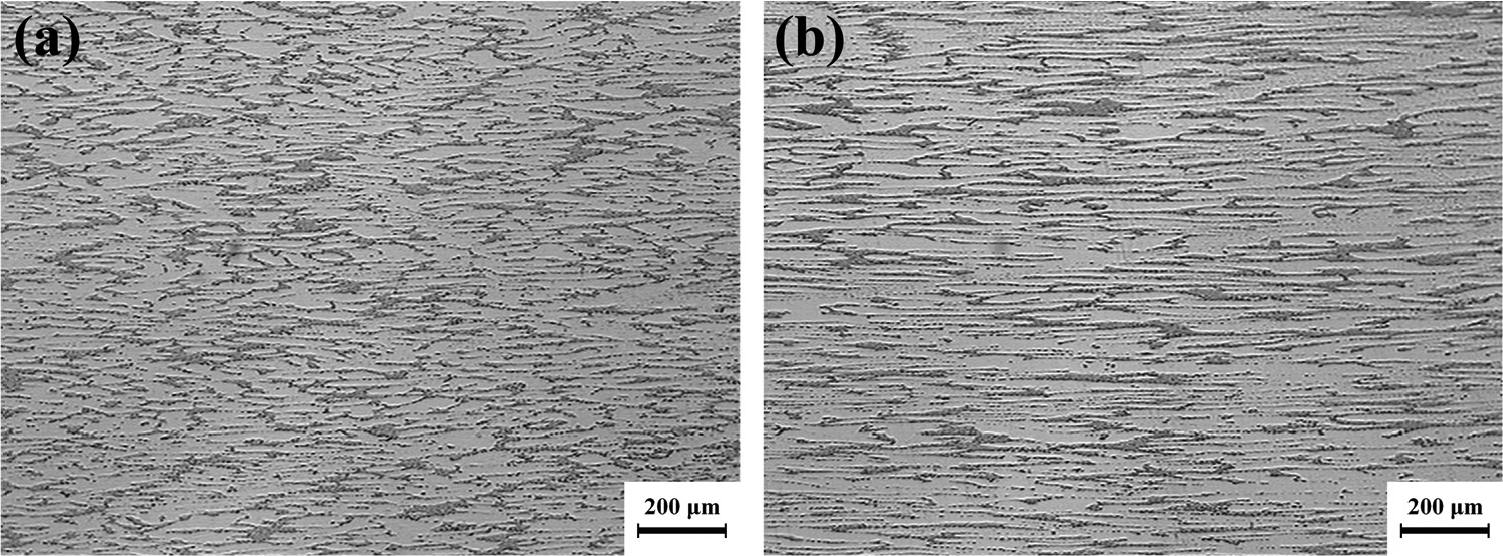
Microstructures of radial forged A356.2 aluminium alloy with different reductions in area: (a) 60% and (b) 75%.
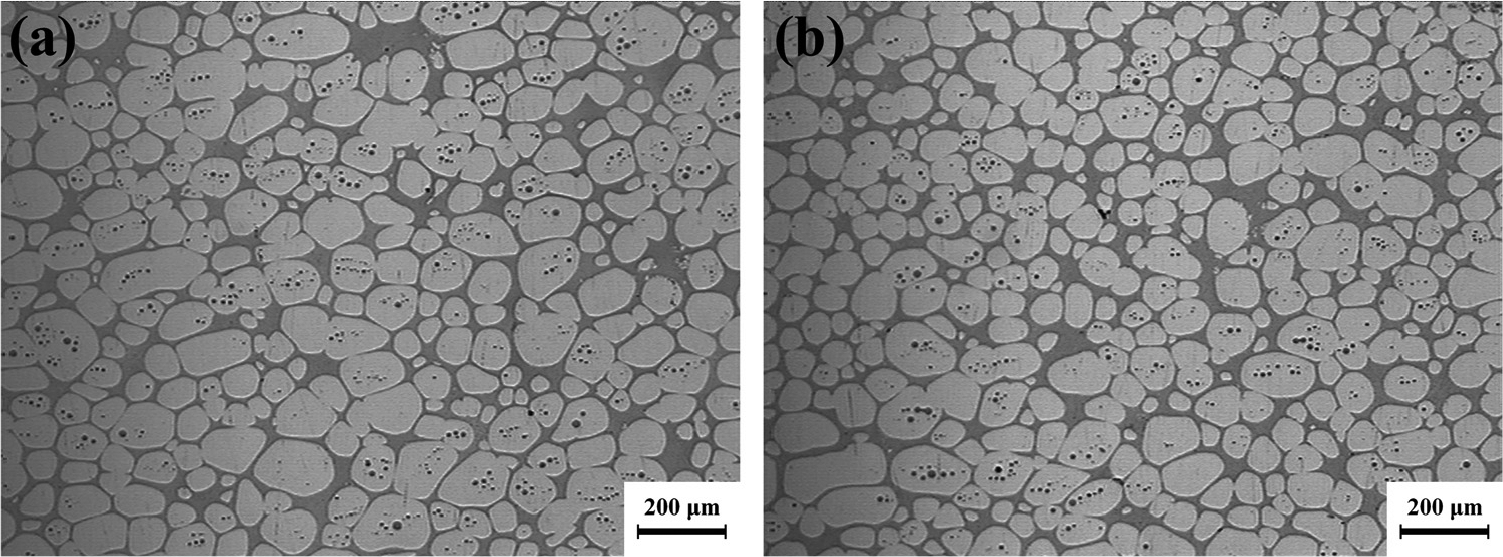
Microstructures of radial forged A356.2 alloy with different reductions in area after isothermal holding at 853 K for 10 min: (a) 60% and (b) 75%.
Characteristics of stress–strain curves and microstructures at different deformation zones
Figure 7 shows typical stress–true strain curves at various isothermal holding times (th) when Th was 833 K and Vc was 6 mm/min. It can be seen that the whole stress–strain curve gradually decreased with the increasing th, but the descend range was limited. This may attribute to the slight improvement of the liquid film distribution around the solid particles to reduce the friction with longer th. However, there was no obvious difference on the microstructures. Considering the above-mentioned reasons, we finally chose 10 min as the isothermal holding time in the following experiments. Furthermore, the variation trend of these curves can be divided into three basic stages: strain hardening, thixotropic strain softening and steady deformation stage. 22
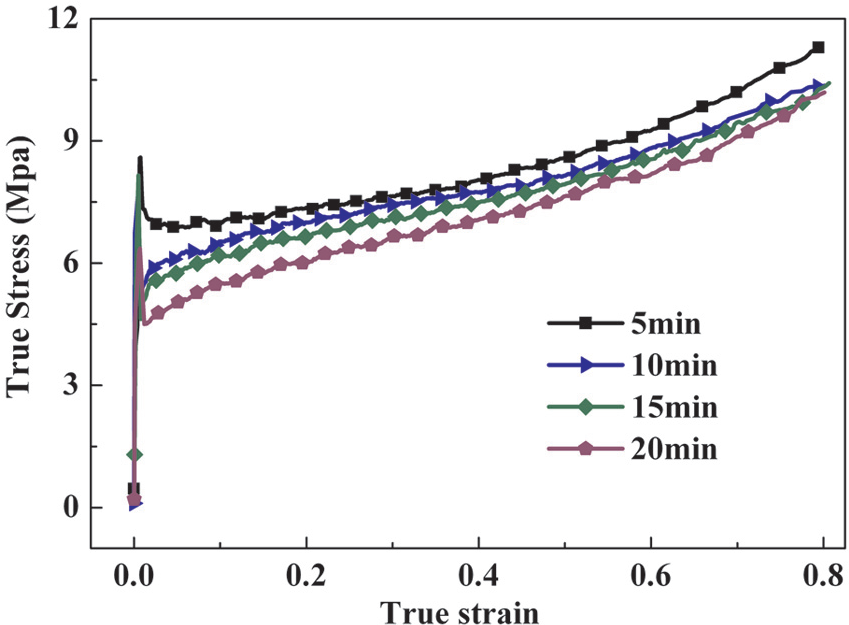
Stress–strain curves of the semi-solid A356.2 alloy under different isothermal holding times (Th = 833 K and Vc = 6 mm/min).
The semi-solid A356.2 alloy can be viewed as a solid skeleton that is filled with liquid which can possess certain static pressure. As the deformation was applied initially, the flow stress increased rapidly and reached a peak value, which was designated as strain hardening process. With the increase in local deformation, the solid skeleton began to bend and fell apart. When the thixotropic collapse occurred, the flow stress decreased. This was called thixotropic strain softening. Because both Th and Vc were relatively low, the surface of the specimen was not ruptured obviously, and little liquid was extruded outside the surface; thus, the thixotropic strain softening process maintained a very short period. 23 At steady deformation stage, the stress–strain curve did not maintain a certain value just as in the compression tests with high strain rate in high liquid fraction sample 24 but presented a steady and slow increase. Although the liquid film reduced the friction among the solid particles, there still existed many solid particles that were contacted with each other and compressed seriously to adapt the deformation in the centre of the specimen due to the lower Th. Even worse, the densification of particles, in turn, further increases the friction and prohibits the sliding and rotation of the particles. Therefore, the flow stress was increased gradually with the increased strain.
Figure 8 shows a quarter of the semi-solid compression sample and the corresponding microstructures at different deformation zones. Based on the different deformation characteristics of the microstructures, the compression sample can be divided into four deformation zones as shown in Figure 8: zone 1: hard deformation zone, zone 2: transition deformation zone, zone 3: severe deformation zone and zone 4: free deformation zone. In the following texts or figures, zone 1, zone 2, zone 3 and zone 4 represented the microstructures in different deformation zones, respectively, just as defined above. In zone 1, all particles still maintained the solid skeleton, but the particles at the bottom were bigger than those on the top because they were slightly stretched along the compression direction. In zone 2, the liquid incorporating solid particles flowed to the edge obviously, and the solid particles slid or rotated to adapt the liquid flow. Some large clusters were formed by several elongated grains due to the shearing force generated by the slip between the solid particles. In zone 3, the solid skeleton was completely destroyed, and the orientation of all grains turned to be vertical to the compression direction. Most elongated grains were further compressed into slender grains and formed some large aggregations with fuzzy grain boundaries. Some residual liquid was trapped among them. In zone 4, most grains had no obvious deformation and distributed more uniformly. Although the grains slightly flow to the edge with the liquid, more liquid in zone 4 than other zones ensured the free sliding and rotation of the solid grains. Therefore, the grains almost retained their morphology. From the above, it can be seen that the unbroken solid skeleton in zone 1 and the squashed grains in zone 3 may be attributed to the increase in flow stress, while the mixed flow of the liquid and solid particles in zone (2) and free sliding and rotation of grains in zone (4) may help in the thixotropic decrease in the flow stress. Therefore, we can conclude that liquid flow, mixed flow of the liquid and solid particles, sliding, rotation and plastic deformation of solid particles coexisted in the specimen during the compression process. However, the predominant deformation mechanism in different zones may be quite different. These differences not only affected the morphology of the grains in different deformation zones but also codetermined the magnitude and trend of the flow stress.
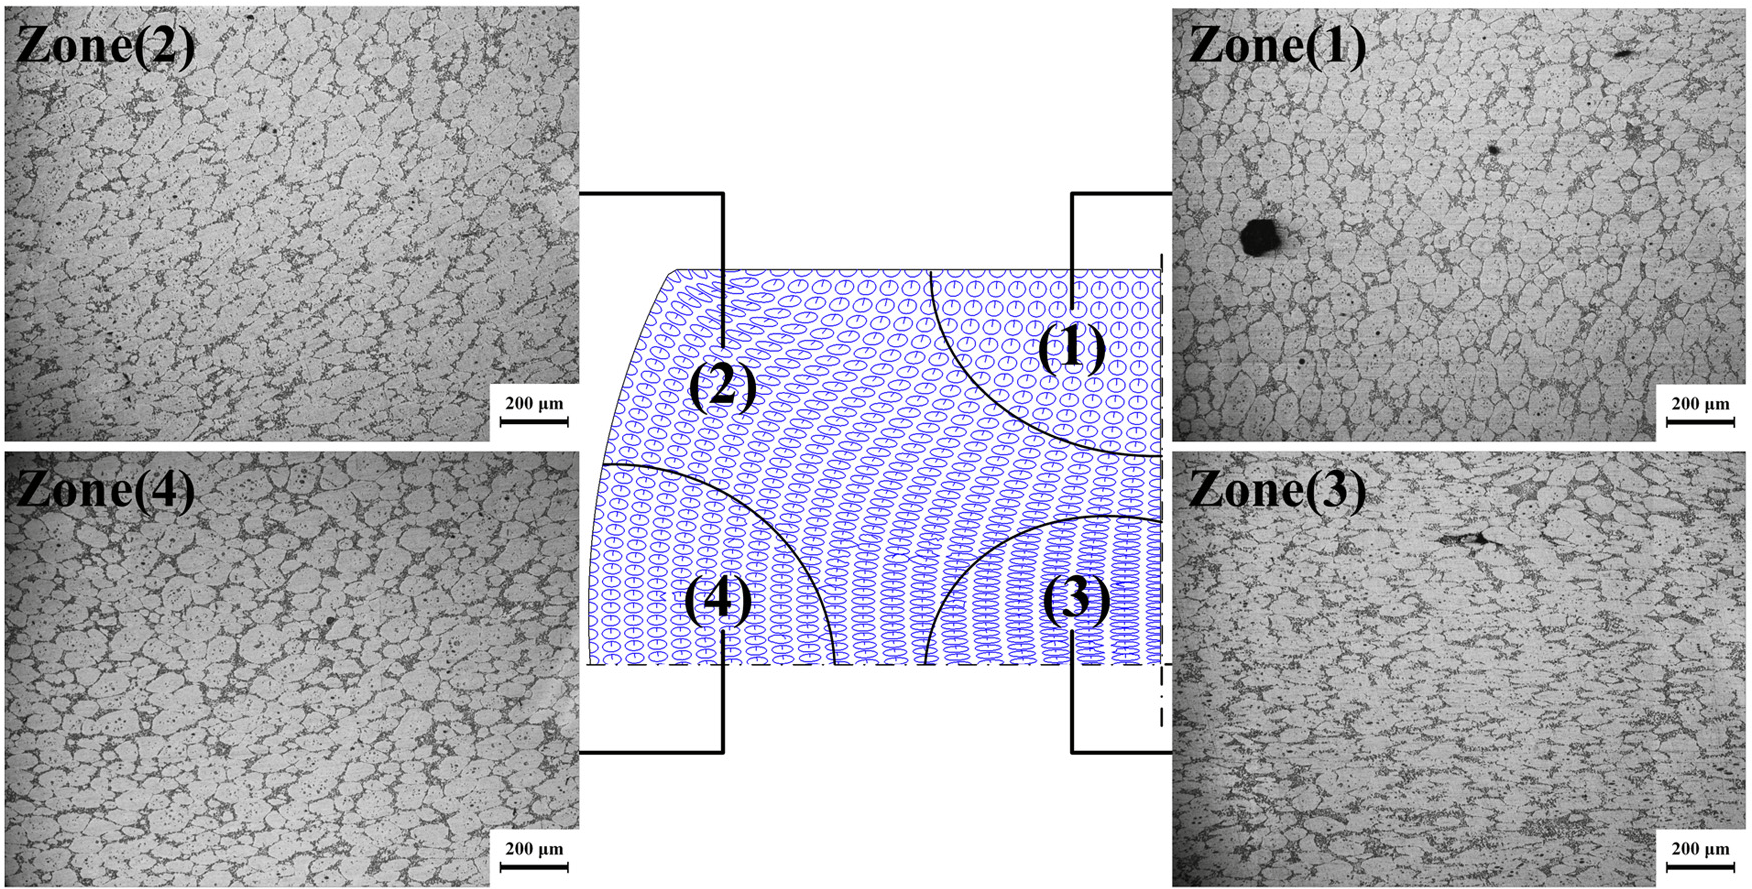
Microstructures of the semi-solid A356.2 at different deformation zones (Th = 560 °C, th = 10 min and Vc = 6 mm/min).
Effect of Vc and Th on the stress–strain curves
Figure 9 shows a series of stress–strain curves under different Vc and Th. It could be seen that the developing trends of the curves resembled basically. The flow stresses were all obviously increased with increasing Vc but inconspicuously decreased with increasing Th. This phenomenon proved that in the low-liquid fraction compression tests, the flow stress was very sensitive to the Vc but insensitive to the Th. In order to further investigate the influence of average strain rate (
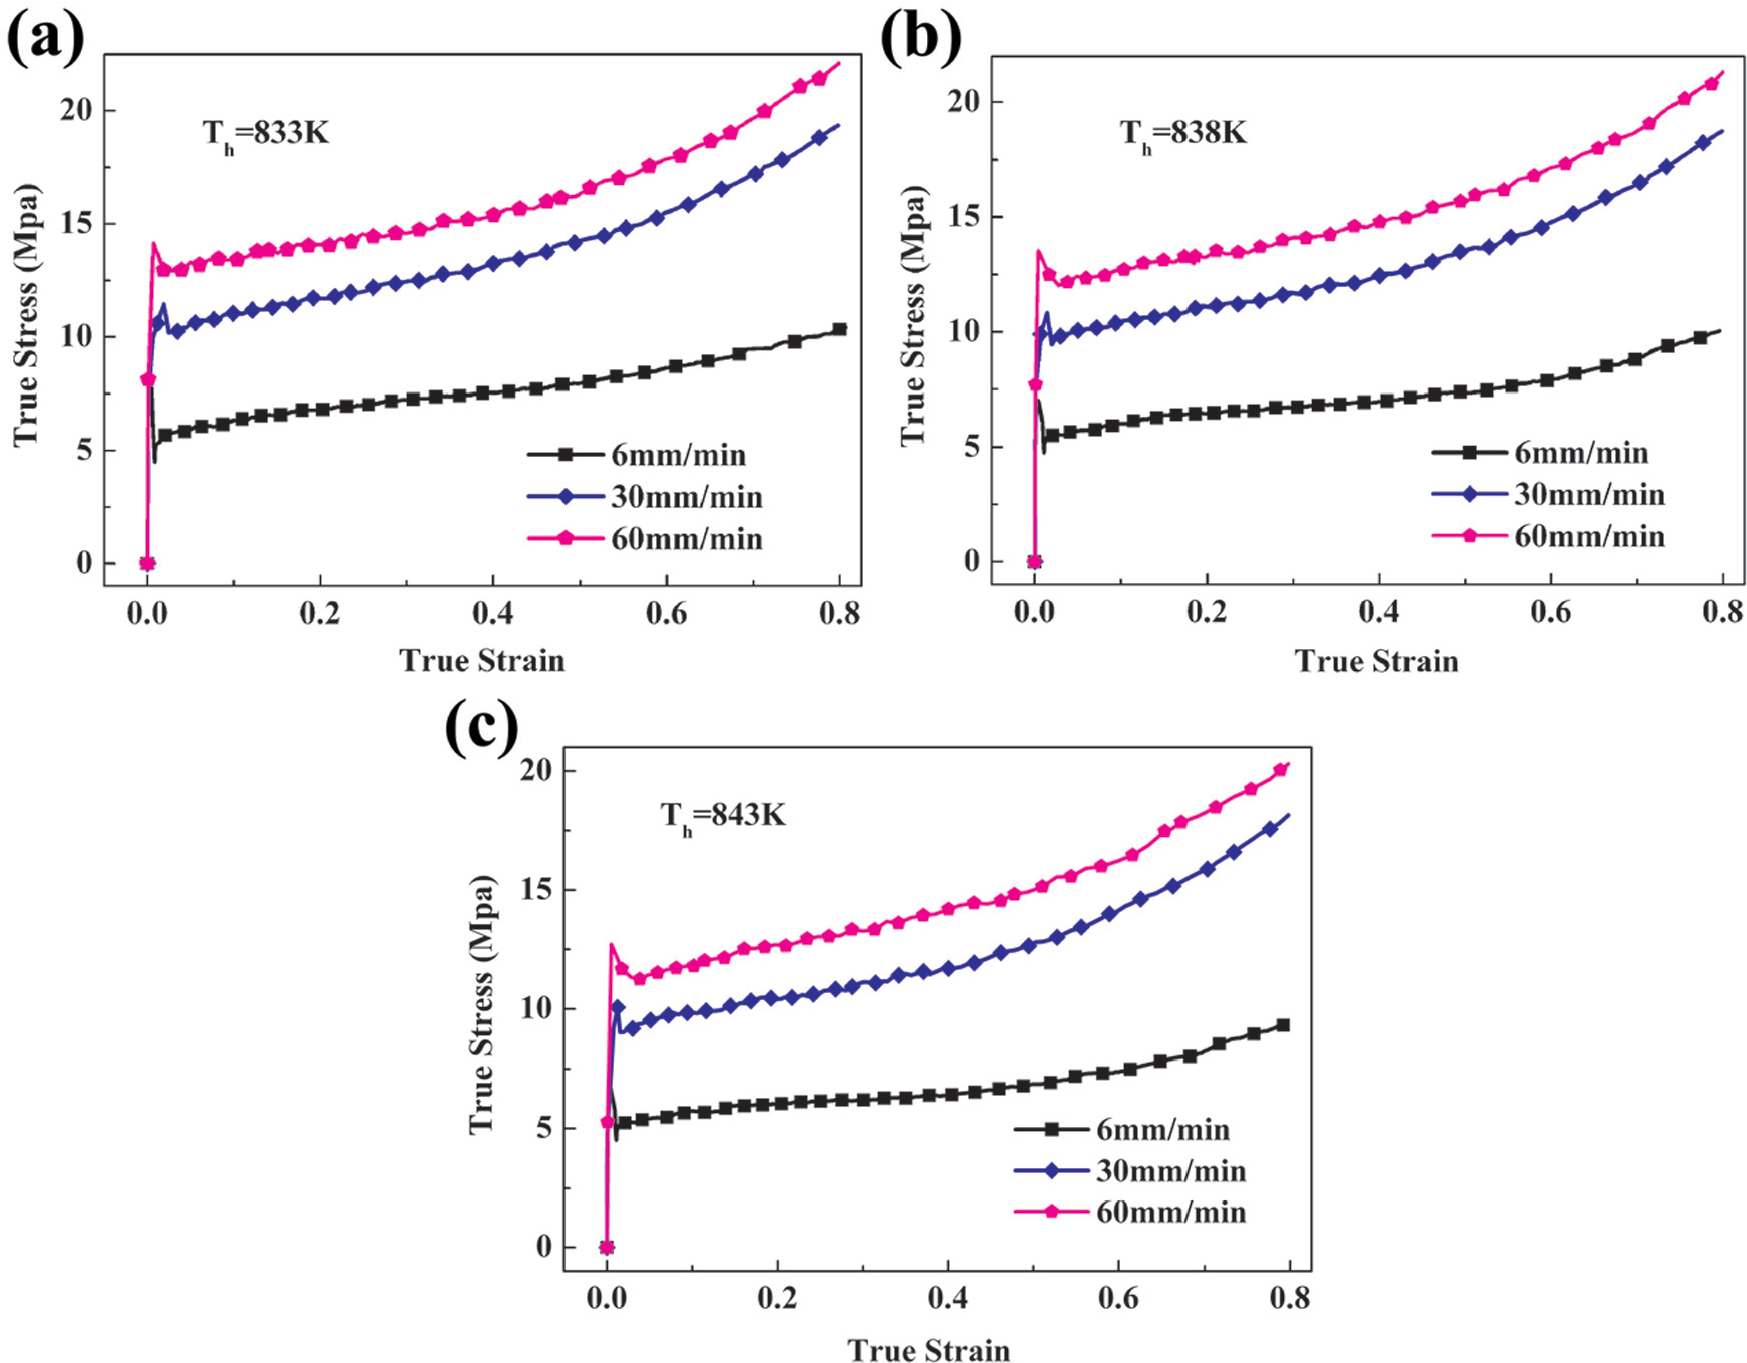
Stress–strain curves of the semi-solid A356.2 alloy under different Vc: (a) Th = 833 K, (b) Th = 838 K and (c) Th = 843 K.
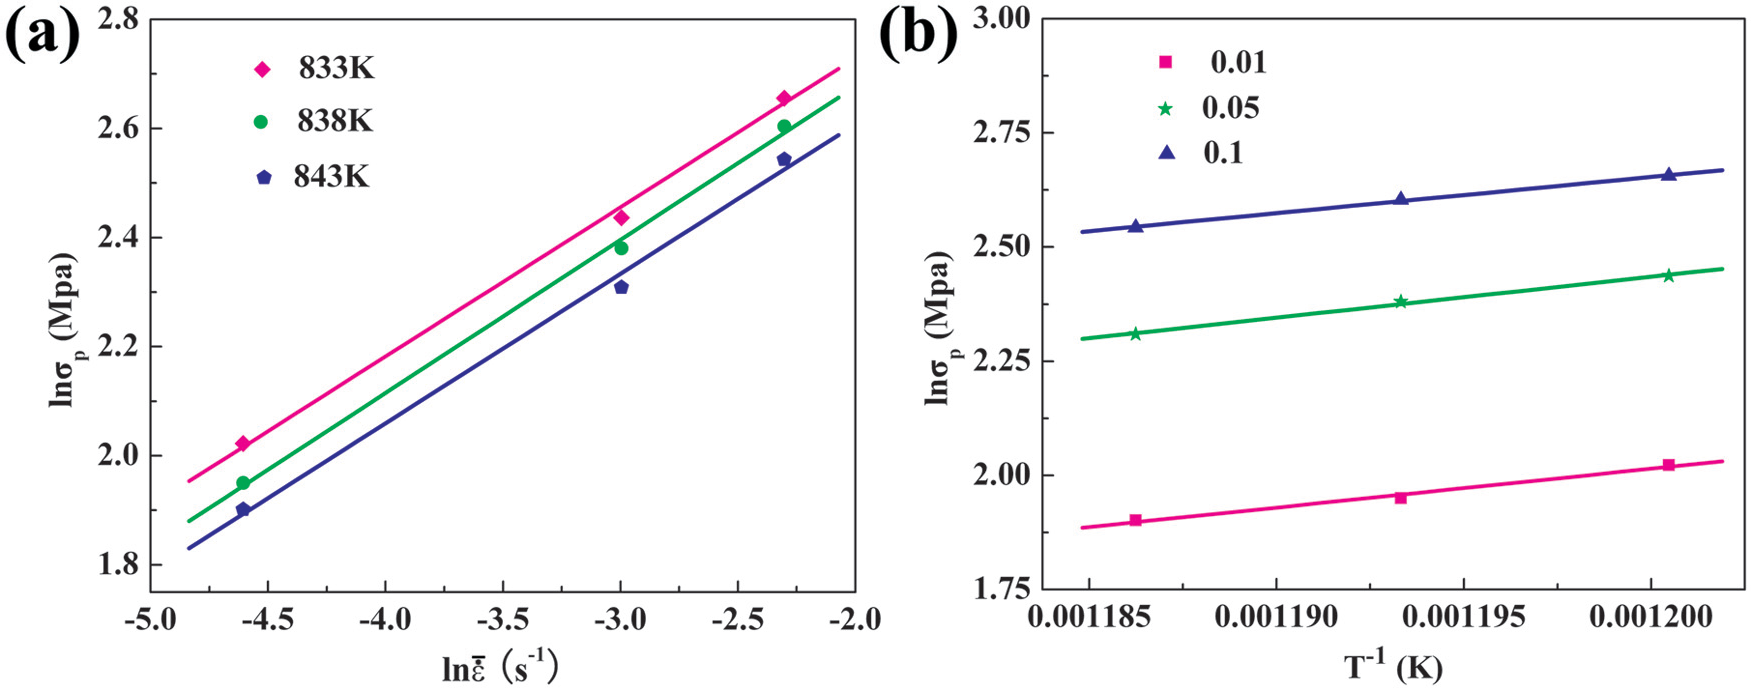
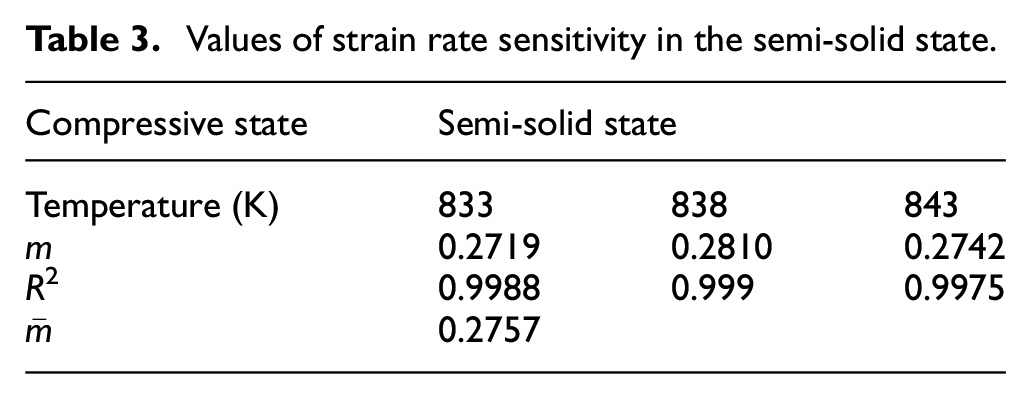
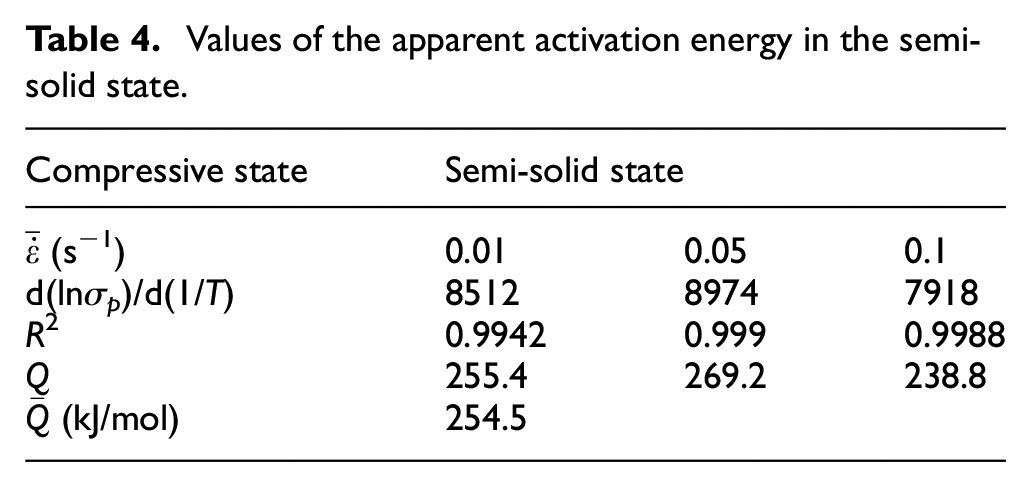
Relationship between the lnσp and (a) the
Values of strain rate sensitivity in the semi-solid state.
Values of the apparent activation energy in the semi-solid state.
Effect of Vc and Th on the microstructures at different zones
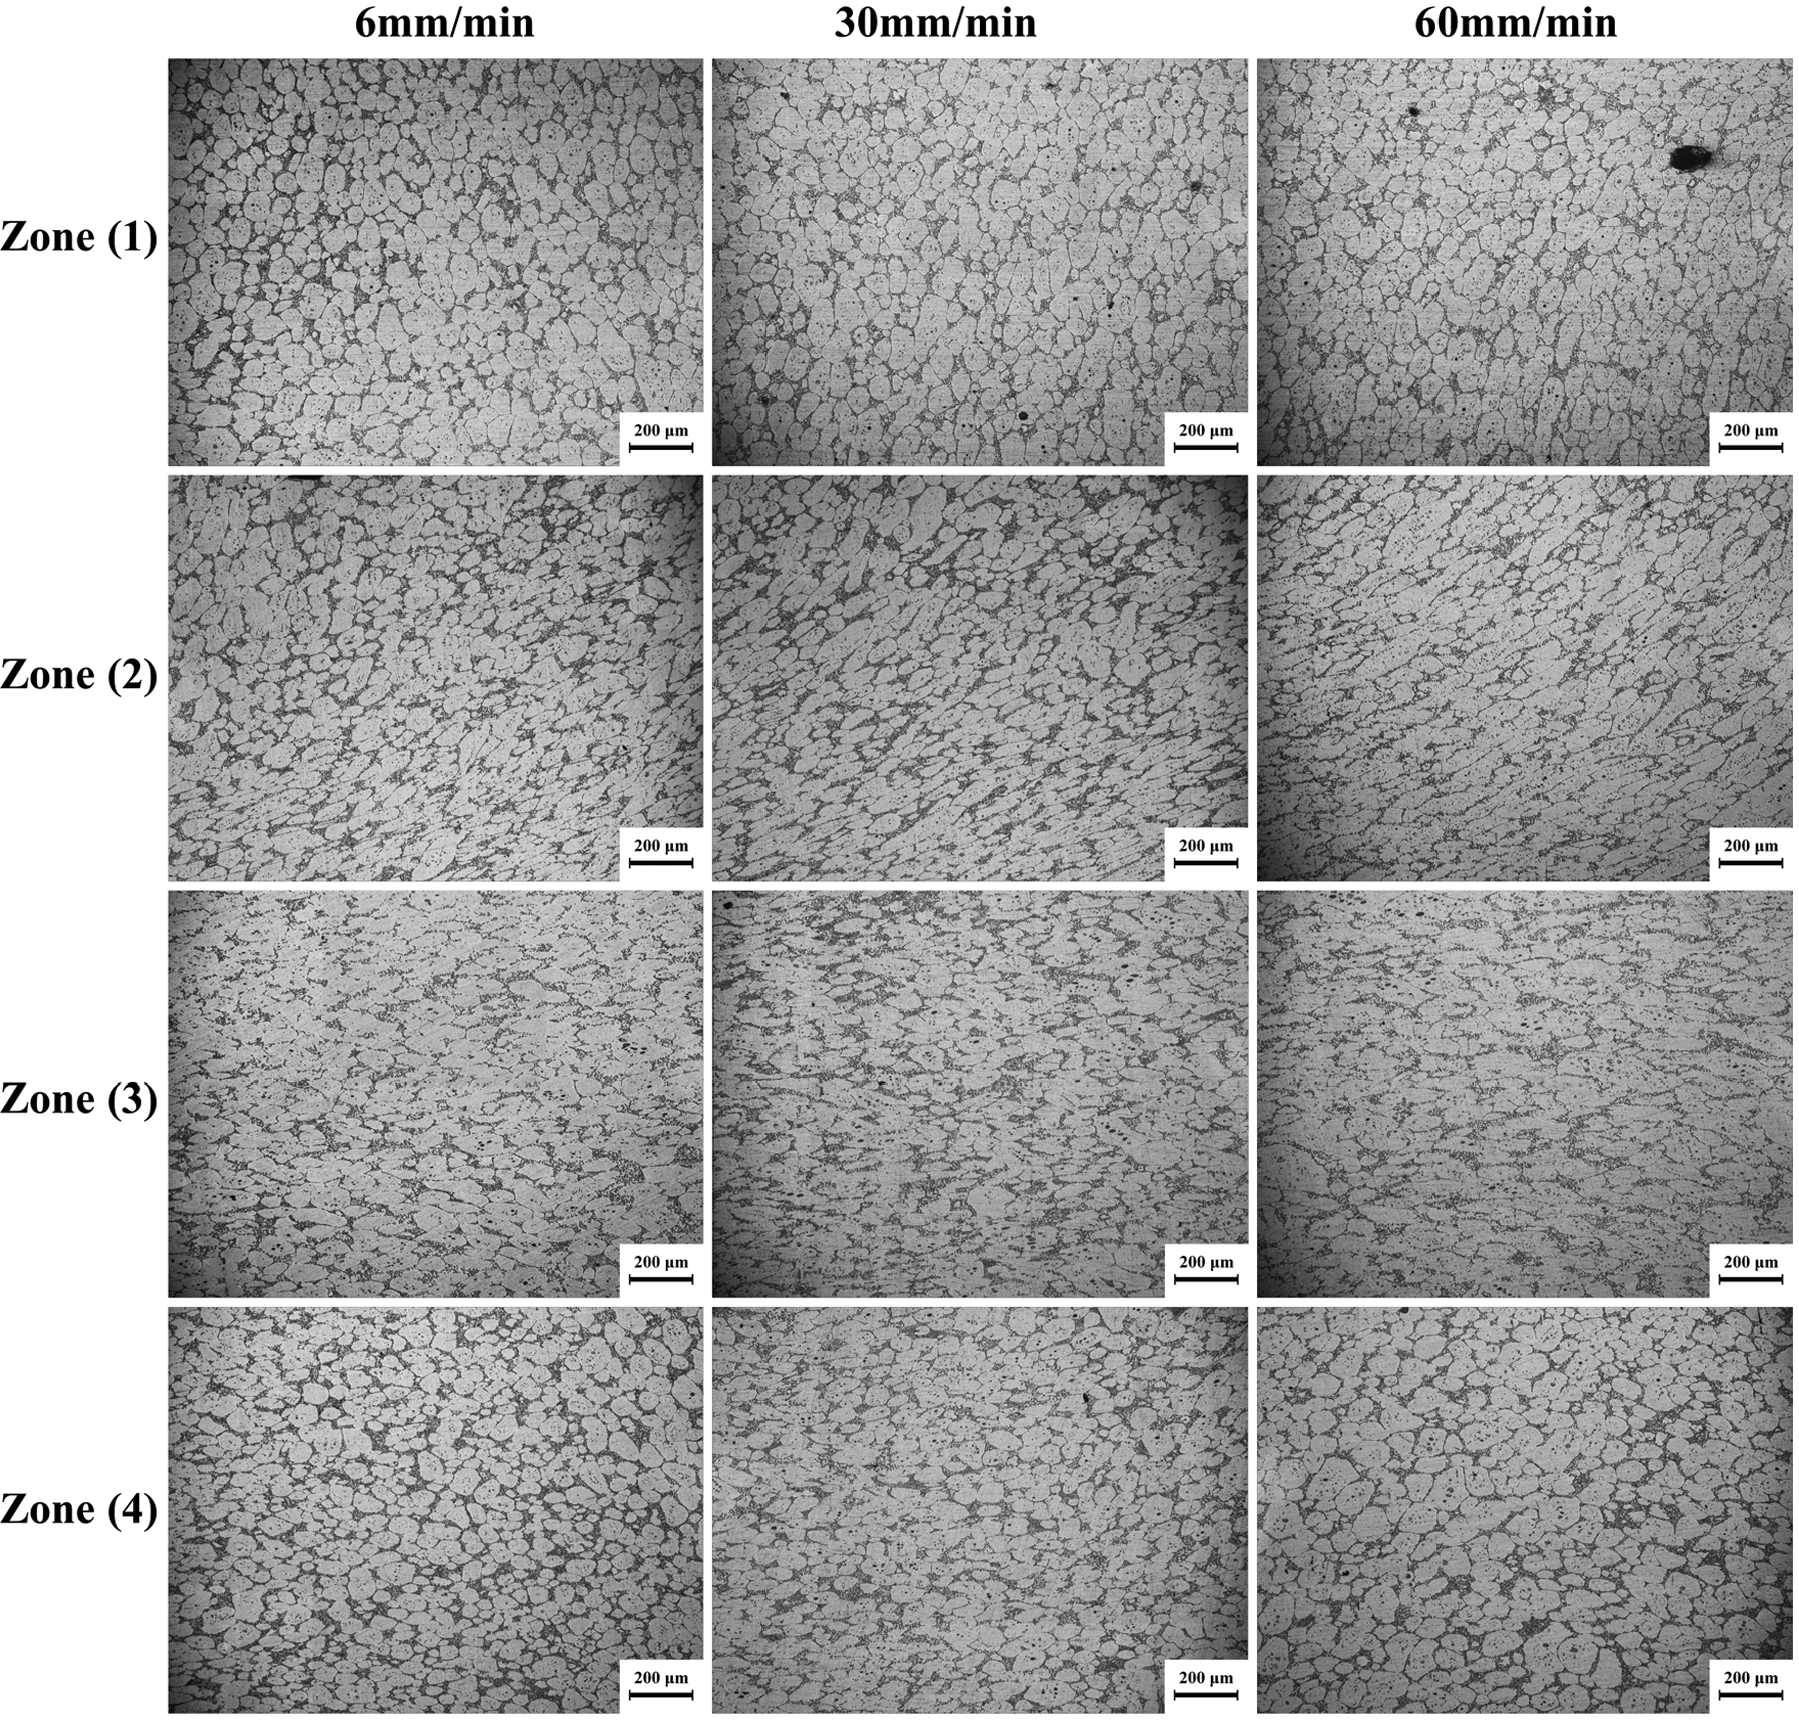
Figure 11 presents the microstructures at different zones for different Vc when Th is 838 K. It can be seen that at zone 1, as Vc increased, the globular grains on the top of the metallography still retained their morphology, but more and more grains at the bottom were elongated and coalesced by the increased shearing stress generated by the increasing Vc. At zone 2, the number and size of the elongated grains that flowed along the liquid flow direction increased sharply with the increasing Vc. Especially, when Vc = 60 mm/min, more grains were contacted with each other and merged into many large elongated grains along the liquid flow direction. At zone 3, higher Vc induced larger and more distorted grains that were vertical to the compression direction. Most of the liquid in zone 3 flowed away. The remaining liquid had no enough time to coordinate the sliding and rotation of the grains at higher compression velocity. Therefore, more elongated grains were compressed and merged with each other, forming the larger grains with some trapped liquid as Vc increased. However, the grains in zone 4 had no severe plastic deformation but grew up gradually with the increasing Vc. High Vc may enhance the liquid segregation, so more liquid existed at the solid–liquid interfaces of the grains at zone 4, which contributed to the Ostwald ripening of the solid particles. This phenomenon, on one hand, benefited sliding and rotation of the particles to adapt the macroscopical deformation; on the other hand, it may promote the coarsening of some coalesced grains, forming these large grains at zone 4 when Vc = 60 mm/min. Figure 12 shows the corresponding variations of APS and SF, respectively. The APS increased from zone 1 and reached the maximum at zone 3 and then decreased at zone 4 for different Vc, while the opposite was the case for SF as shown in Figure 12(b). Furthermore, with the increasing Vc, the APS was increased, while the SF was decreased, respectively, at each zone. This may be due to higher deformation degree and compression velocity that could lead to more grains contacted with each other and merged into larger and more irregular grains as shown in Figure 11. Furthermore, the abnormal increase in SF at zone 4 when Vc = 60 mm/min may be mainly attributed to the coalescence and Ostwald ripening of the solid particles as mentioned above. From the above, it can be concluded that the compression velocity greatly influenced the size and morphology of particles at different zones.
Microstructures under different Vc at different deformation zones (Th = 838 K).
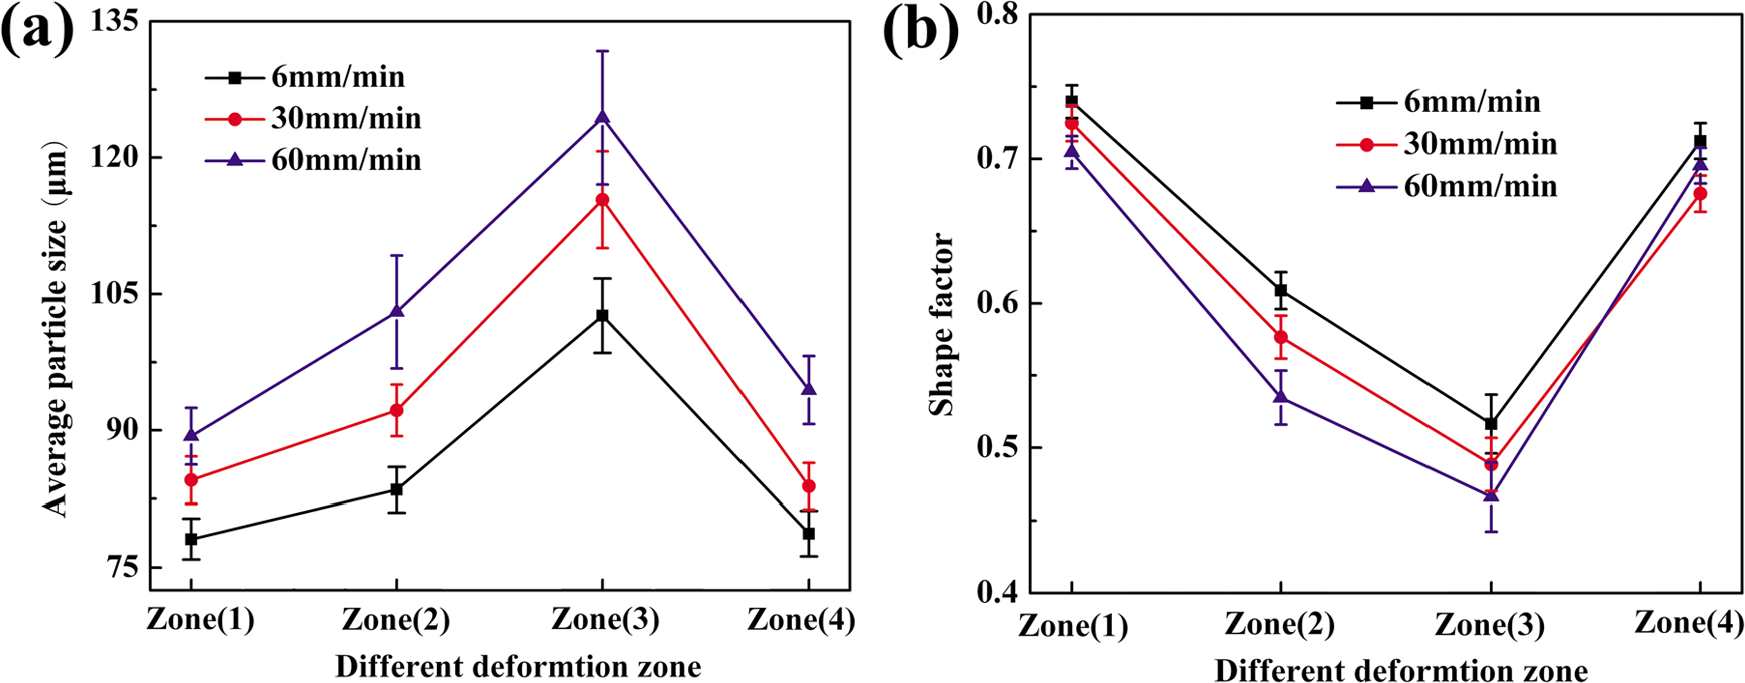
Variations of (a) APS and (b) SF of microstructures under different Vc at different deformation zones (Th = 838 K).
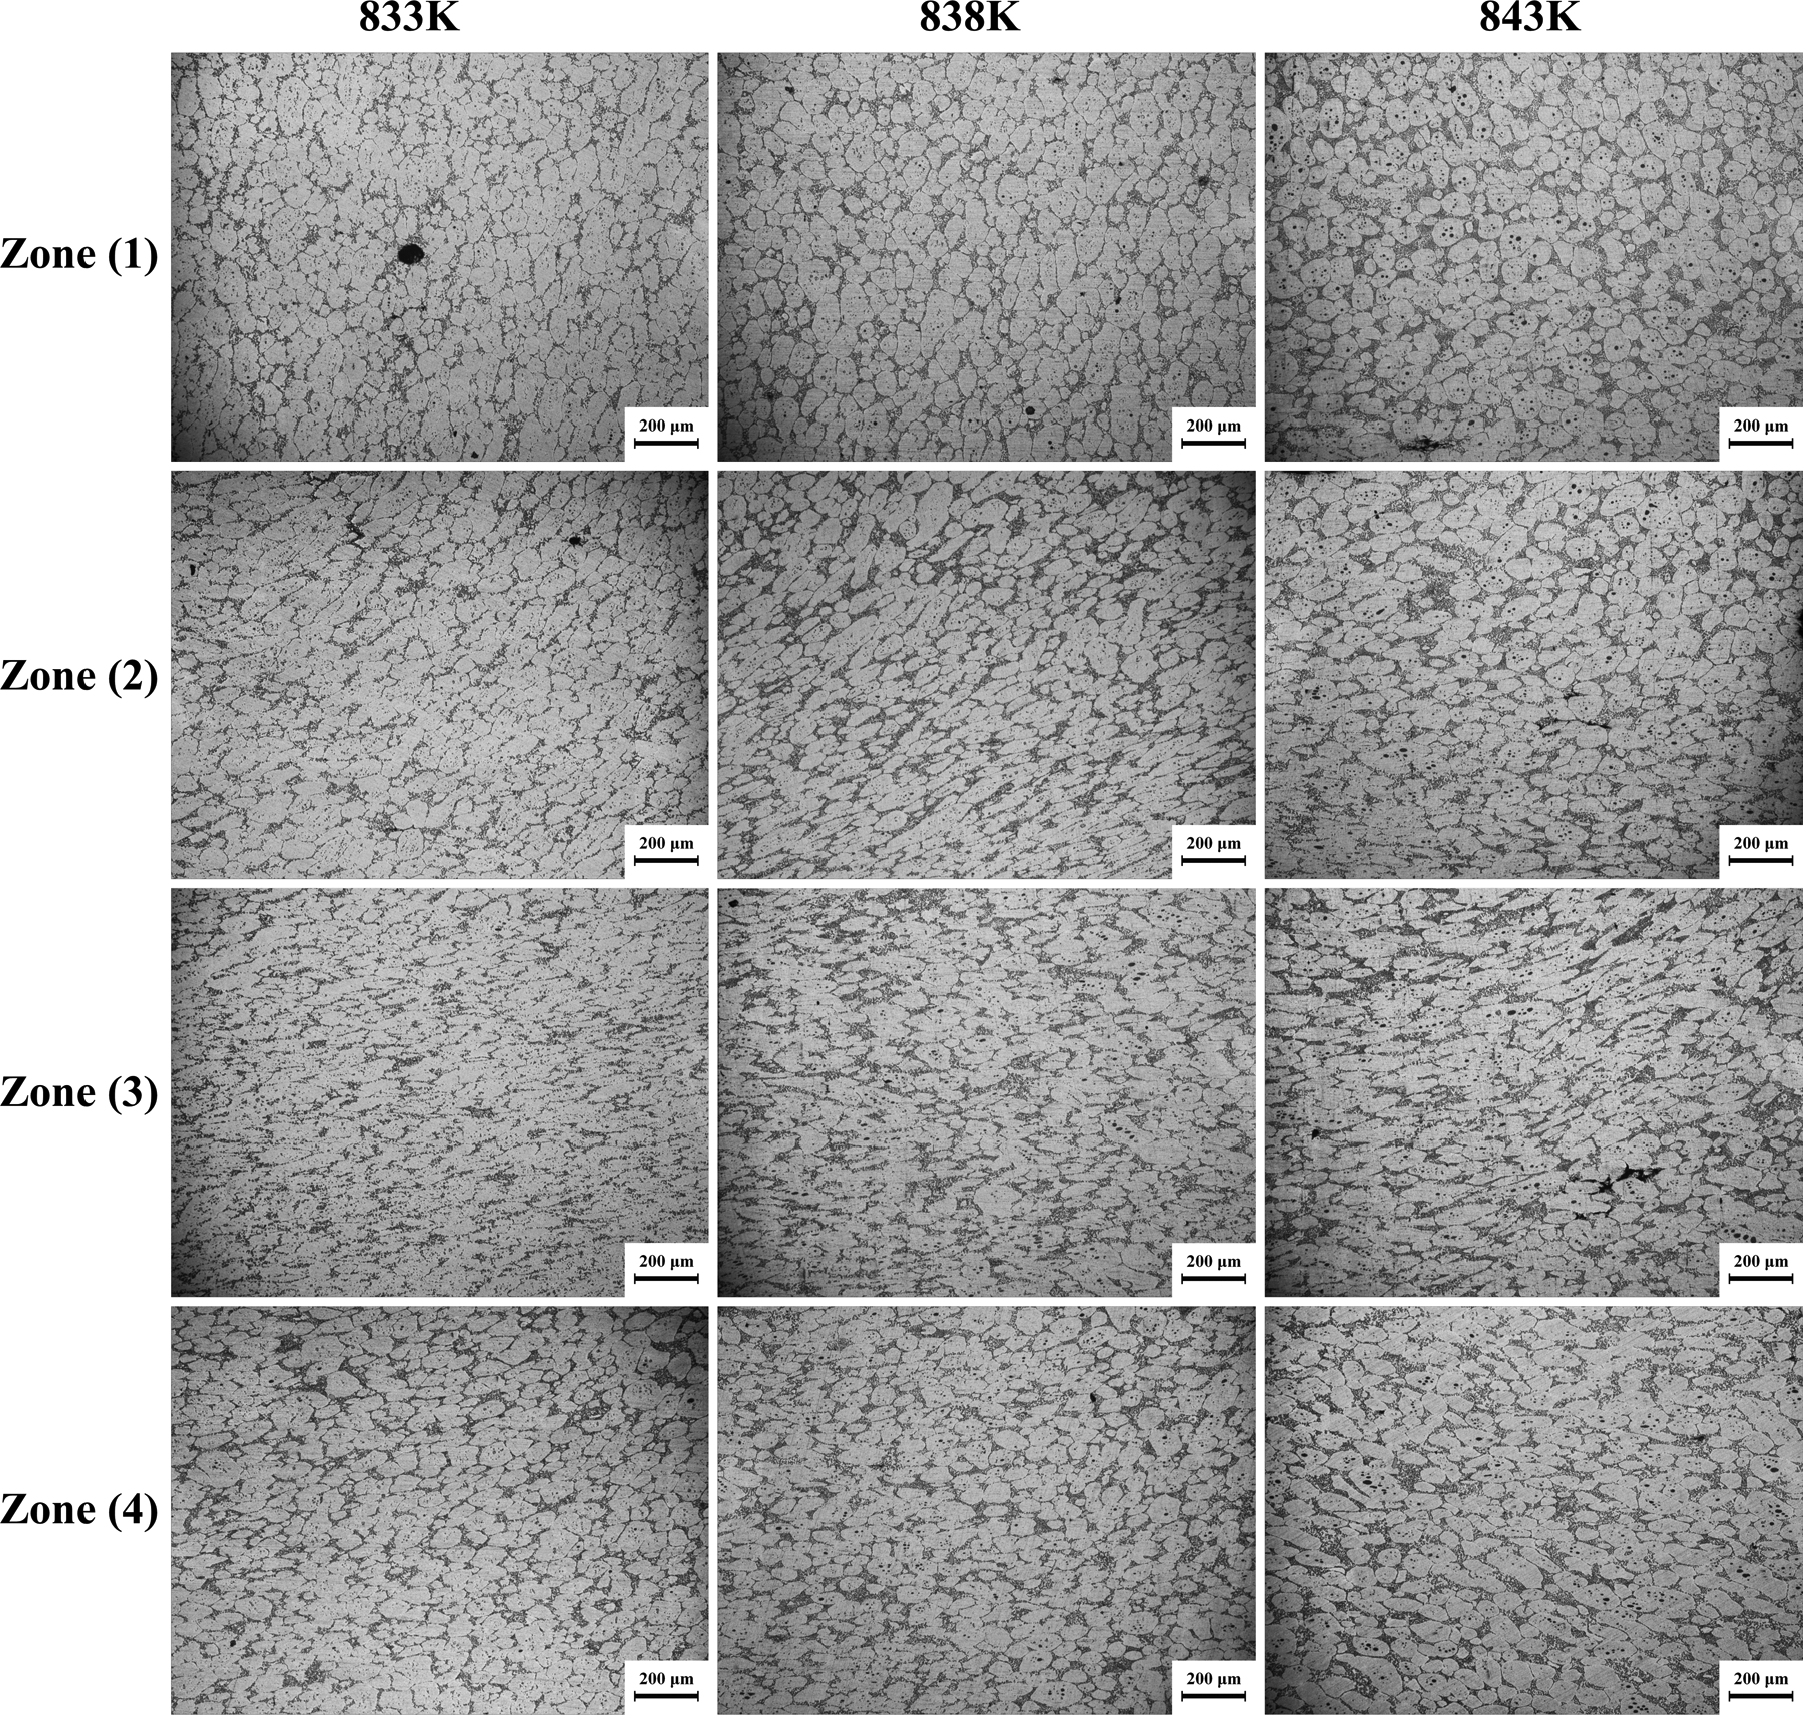
Figure 13 shows the microstructures of the semi-solid A356.2 alloy under different Th at different deformation zones, when Vc is 30 mm/min. As shown in Figure 13, when Th was 833 K, most globular particles stick to each other and formed irregular grains at zone 1 because there was no enough liquid to penetrate the grain boundaries. As Th further increased, the liquid film was thicker, and the particles were more global and distributed more homogeneous at zone 1. Meanwhile, the number of elongated grains decreased. At zone 2, most grains were bended along the liquid flow direction. Because of lack of fluid lubrication, the bended grains contacted with each other and formed some large aggregations at 833 K. However, the number of the aggregations was gradually decreased due to the thick liquid film as Th increased. At zone 3, the grain boundary became unapparent, and most elongated particles were transformed into large and spindly grains. But as Th increased, more liquid contributed to separate the aggregations and improve the morphology of the particles. Meanwhile, some liquid was trapped between the incorporative squashed grains, forming some liquid pockets at higher Th. Zone 4comprises many fine and spherical particles on account of more liquid than other zones. The particles became more isolated with increasing Th. However, the liquid flow to the edge resulted in many elongated particles along the liquid flow direction at 843 K, which deteriorated the morphology of the particles. Figure 14 shows the variations of APS and SF of the semi-solid A356.2 alloy under different Th at different deformation zones. As shown in Figure 14(a), the APS was increased from zone 1 to zone 3 and then decreased at zone 4 at different Th. Furthermore, the APS was generally decreased with the increasing Th at different zones because more liquid helped to moderate the extent of aggregations. On the contrary, the SF was decreased from zone 1 to zone 3 and then increased at zone 4 at different Th. Meanwhile, the SF was generally increased with Th at different zones because more liquid can penetrate the boundary of the contacted particles and contributed to the spheroidization of the independent particles. But the APS at zone 3 and SF at zone 4 at 843 K were a little abnormal. This phenomenon may be due to the drastic liquid flow from zone 3 to zone 4 caused by the instability of the semi-solid billet at higher temperature. On one hand, this drastic liquid flow to the edge resulted in further connection of the compressed particles at zone 3 seriously, forming some large and twisty grains, which led to the abnormal increase in APS at zone 3; on the other hand, this drastic liquid flow incorporating solid particles into zone 4 induced the forced motion and elongation of the particles in zone 4, which deteriorated the spheroidization degree of the particles in zone 4. It can be seen from above that the compression temperature mainly affected the fraction and distribution of the liquid in different deformation zones and then affected the size and morphology of the grains.
Microstructures under different Th at different deformation zones (Vc = 30 mm/min).
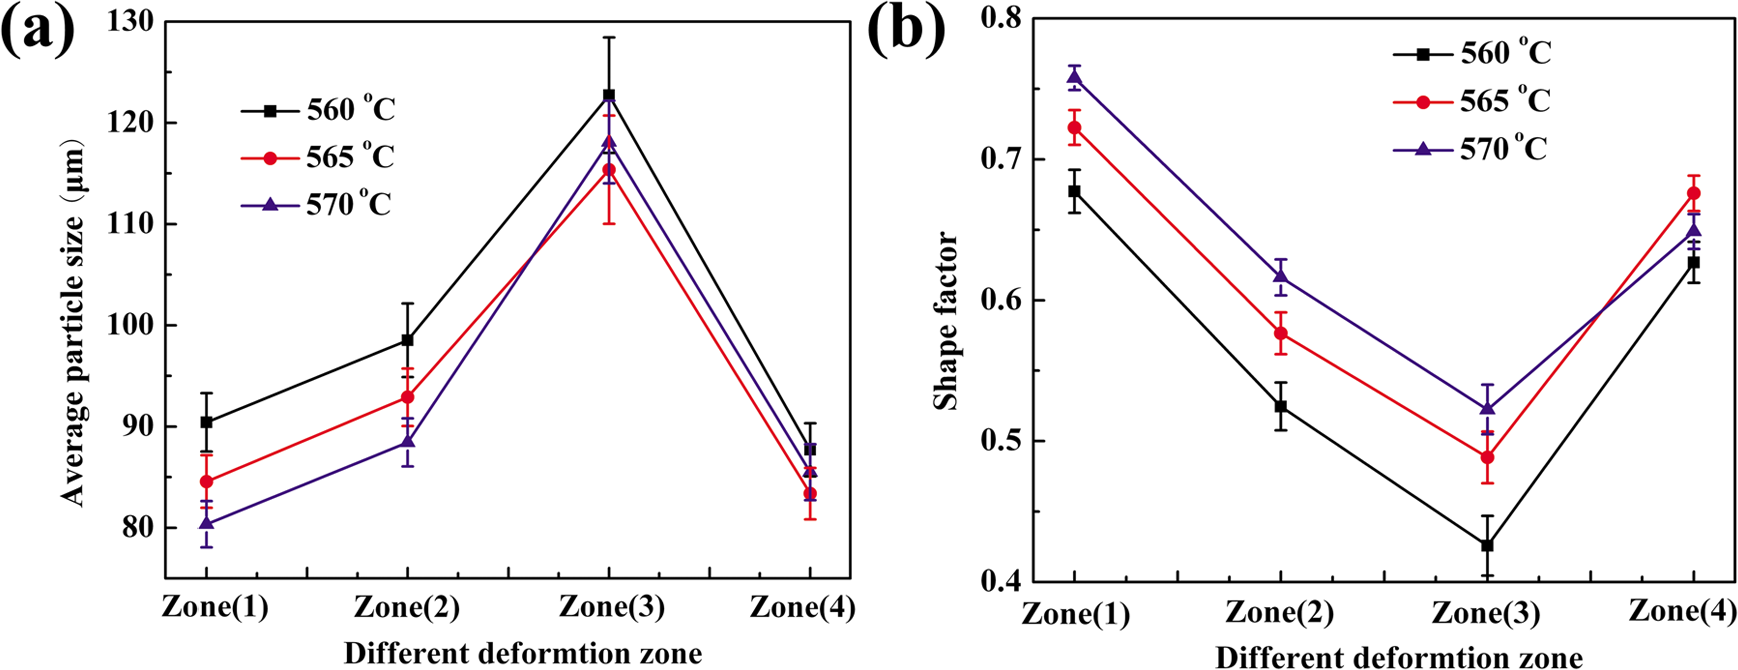
Variations of (a) APS and (b) SF of microstructures under different Th at different deformation zones (Vc = 30 mm/min).
Conclusion
RF can induce large strain to turn α-Al dendrites into compact textured structures at 60%–75% reduction of area, and the microstructure can be transformed into fine and spherical particles during isothermal holding at 853 K for 15 min. However, the APS and SF only improved slightly at 75% reduction in area compared with that at 60% because the distortion energy tended to be saturated at 60%.
During the thixotropic compression process, the compression sample can be divided into hard deformation zone, transition deformation zone, severe deformation zone and free deformation zone based on the deformation characteristic of the microstructures. Although liquid flow, mixed flow of the liquid and solid particles, sliding, rotation and plastic deformation of solid particles coexisted in the specimen, different zones have different predominant deformation mechanisms which affected both the morphology of the grains and the variation trend of the flow stress.
The flow stress were obviously increased with increasing Vc but inconspicuously decreased with increasing Th, proving that the flow stress was sensitive to the Vc but insensitive to the Th. The rate-dependent deformation behaviour of the A356.2 alloy obeyed the power law
With increasing Vc and Th, the APS was increased from hard deformation zone and reached the maximum at severe deformation zone and then decreased at free deformation zone, while the opposite was the case for SF. At each zone, the APS was increased while the SF was decreased, respectively, with the increasing Vc because higher Vc caused more grains to merge into larger and more irregular grains, while the opposite was the case for the increasing Th because higher Th generated more liquid which helped to isolate the contacted particles and improve their spheroidization degree.
Footnotes
Acknowledgements
We thank Mr Guanhai Yan for providing relevant suggestions and performing language corrections.
Declaration of conflicting interests
The author(s) declared no potential conflicts of interest with respect to the research, authorship and/or publication of this article.
Funding
The author(s) disclosed receipt of the following financial support for the research, authorship, and/or publication of this article: This work was supported by the National Science Foundation of China (grant no. 51335009) and Major National Science and Technology Project of China (grant no. 2012ZX04004021).