
Abstract
The total least square method based on singular value decomposition for fitting straight line and plane surface has been developed to deal with the straightness calibration problem. Different from the ordinary least square method only taking into account the error of the dependent variable, total least square method considers the errors of all the variables in a symmetrical way. However, in practice, it is difficult to choose an optimal method for the variable errors of measurement data in an asymmetric way. This article presents an improved calibration method for straightness error of a coordinate measuring machine. The proposed method, named as improved total least square, could fit straight line and plane surface when the variables are in an asymmetric way. In improved total least square method, weight matrices with parameter λ set between the independent and dependent variables are introduced to augmented matrix. A procedure is developed to determine the parameter λ. Numerical cases and measurement experiment are given to prove the performance of improved total least square method.
Introduction
Straightness calibration of coordinate measuring machine (CMM) can be performed by scanning a standard workpiece with sensor. The straightness error is usually distributed to three dimensions in the real world. Compared with the straightness error, the flatness error of the datum plane where the measurement line is located may have the same and even bigger magnitude. The neglect of the straightness and flatness error will cause the calibration deviate from the true solution. To solve these problems, a lot of studies have been employed for the straightness and flatness calibration, for example, genetic algorithm,1,2 support vector machine, 3 data exchange algorithm, 4 and computational geometry methods.5–7 Murthy and Abdin 8 presented a simplex search method for form error calibration, which is a sequential gradient search for achieving the least minimum zone. Huang and Lee 9 proposed a minimum potential energy algorithm for solving the conicity problem. Venkaiah and Shunmugam 10 calculated cylindricity by identifying so-called extreme points to form a limacon-cylinder. Some researchers attempted to approximate the cylinder iteratively and then solved a sequence of linear programs.11,12 Carr and Ferreira 11 proposed a linear program model to solve the three-dimensional straightness problems, which is derived from the original nonlinear optimization problem constructed as a constrained nonlinear programming problem with a linear objective function. The small-displacement screw matrix is used for linearizing the nonlinear constraints, which can be easily implemented when a library of optimization subroutines is available. 13 Lai and Chen 14 calculated cylindricity by implementing a series of inverse transformations, in which a cylinder was converted into a plane and appropriate control points were obtained. However, these methods need a very good initial guess and are always prone to sub-optimal solution.
The ordinary least square (OLS) method 15 is used commonly for form and profile error calibration.16,17 It is to find the minimum sum of the squared errors of the measurement data from the nominal feature, which is efficient in computation and widely used on most of CMM. The total least square (TLS) method, in which the errors of all the variables are considered in a symmetry way, can be considered as natural generalization of the OLS method for dealing with errors-in-variables (EIVs) model.18,19 And TLS method is tightly related to the maximum likelihood principal component analysis method introduced in chemometrics by Schuermans et al. 20 However, the variable errors of measurement data are usually in an asymmetric way in practice. The generalized total least squares (GTLS) method21,22 with noise covariance matrix can be regarded as a restricted total least squares (RTLS) method for dealing with the data, which are measured with unequal precision and contaminated with uncorrelated errors. However, an implementation for this approach seems challenging in practice.
In this article, we consider a special case of the GTLS problem. The independent and dependent variables of measurement data are in an asymmetric way and uncorrelated. For the straightness calibration problem of CMM, an improved total least square (ITLS) method is proposed for fitting straight lines and plane surfaces which treats the variables in an asymmetric way. Moreover, in ITLS method, the parameter λ of weight matrices associated with the variable errors is determined by a designed procedure. In section “Outline of OLS and TLS method,” a brief description is given for OLS and TLS methods. ITLS method is presented in detail in section “Algorithm and implementation.” And the measurement experiment is given in section “Measurement experiment” for comparing ITLS method with OLS and TLS methods. Conclusions are drawn in section “Conclusion.”
Outline of OLS and TLS methods
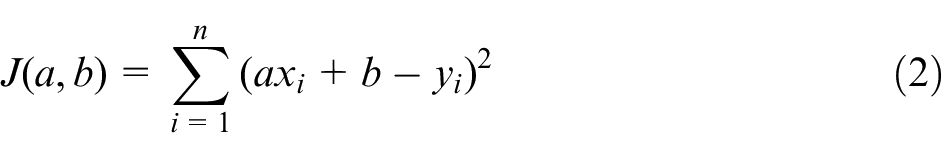
The determination of calibration criterion and the corresponding measurement function is one of the most common problems in metrology. A supposed linear relation is usually written as

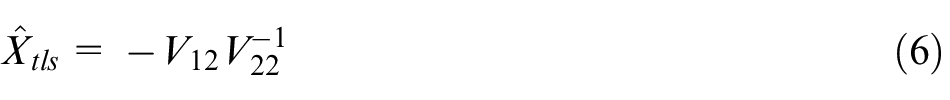
where a is the slope and b is the y-axis intersection of the straight line. In OLS method, the independent variable is assumed to be known exactly, and the uncertainties of the ordinate data are always used as weights for fitting the calibration line or plane to a given number n of (xi, yi)-data pairs (i = 1, 2,…, n). So, OLS method uses the vertical distances from the data for straight line fitting, of which constraint function can be written as
However, the independent variable from measurement is not always free of uncertainty. When errors occur in all the variables in a symmetrical way, it makes more sense to determine the approximant in the sense of TLS method. The TLS problem23–25
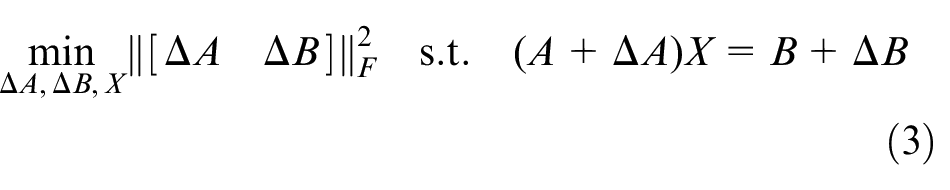
when an EIV model
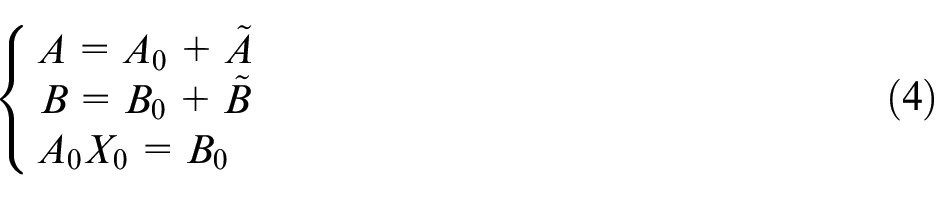
is considered. Here,
Let
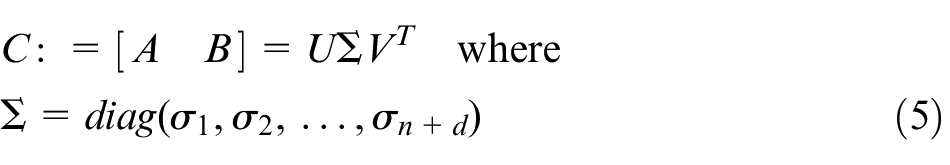
be a singular value decomposition of C,
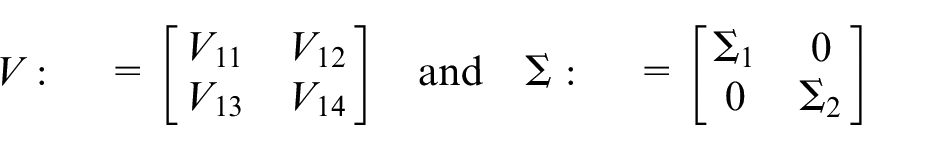
A TLS solution exists if and only if
OLS and TLS methods evaluate the fitting coefficient in different ways. 26 OLS method minimizes the sum of the squared vertical distances from the measurement data to the fitting line or plane, whereas TLS method minimizes the sum of the squared orthogonal distances from measurement data, in which geometry of constraint function can be written as
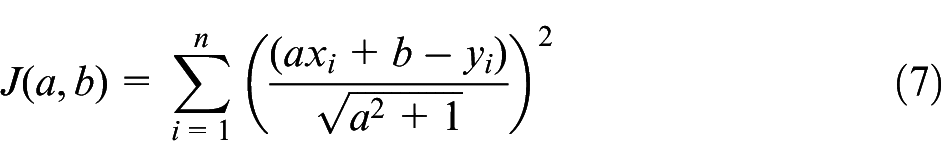
To clarify the distinguish features of OLS and TLS methods, Figure 1 describes the two common methods for straightness calibration.
OLS and TLS methods for straightness calibration.
Algorithm and implementation
ITLS method
In this article, a close attention is paid to the augmented matrix of TLS method. As shown in Figure 1, OLS method only considers the error of the dependent variable which is carried out in the vertical direction, whereas TLS considers the errors of all the variables in a symmetry way carried out in the orthogonal direction. However, the variable errors of measurement data are usually in an asymmetric way in practice and it is difficult to choose an optimal method for measurement data with errors. This article attempts to propose an improved method for fitting straight line and plane surface named ITLS method. A weighted matrix with parameter λ between A and B is introduced in the ITLS method to determine approximation coefficient.
In the ITLS method, C for approximant is defined as
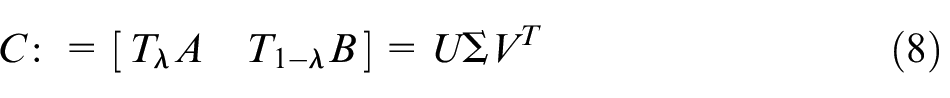
where
Determination of parameter λ
Example 1
Consider the function

and choose a uniformly distributed set of points (xi, yi), i = 1, 2,…, n, determined by equation (9). Then, add δi and εi, which are normally distributed random errors with mean value of 0, to xi and yi, respectively, forming a set of measurement data. The fitting performance is characterized by the deviation from the coefficient a, that is

where Ea is the estimation value for coefficient a of fitting methods. The parameter λ of ITLS method can be set to λ0 (here, λ0 is 0.35) first. Then, vary λ with an increment of certain step h (here, h is 0.0001) and record λ corresponding to the minimum value of s. OLS, TLS, and ITLS methods are all applied to fit the measurement data. The fitting results are summarized in Table 1.
Fitting results of three methods.
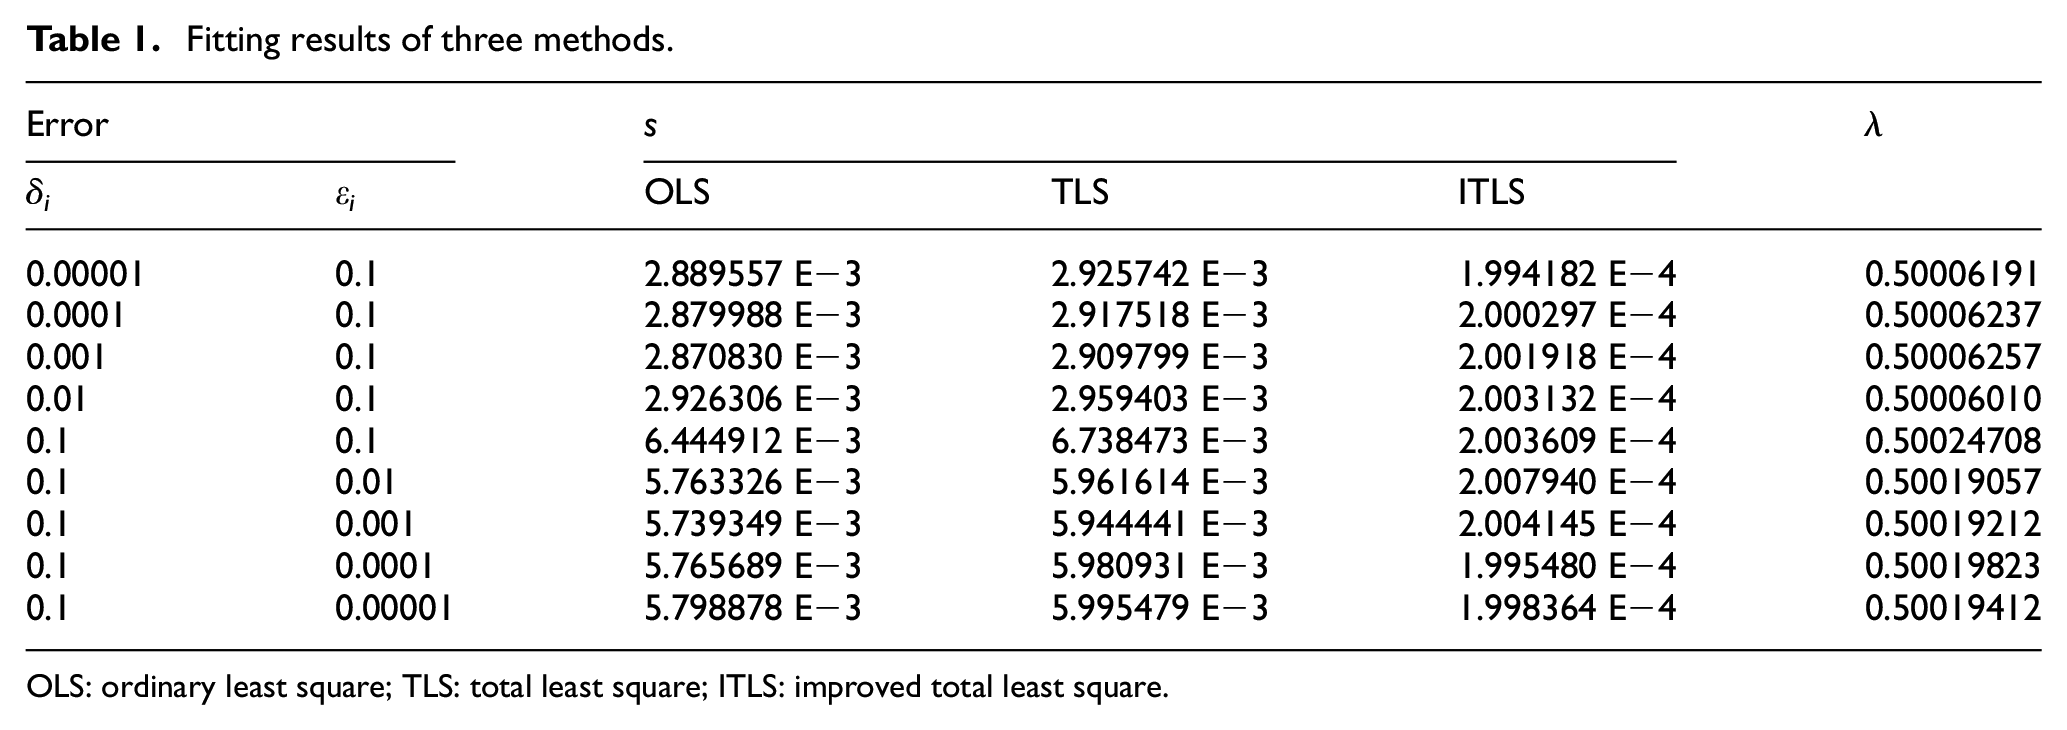
OLS: ordinary least square; TLS: total least square; ITLS: improved total least square.
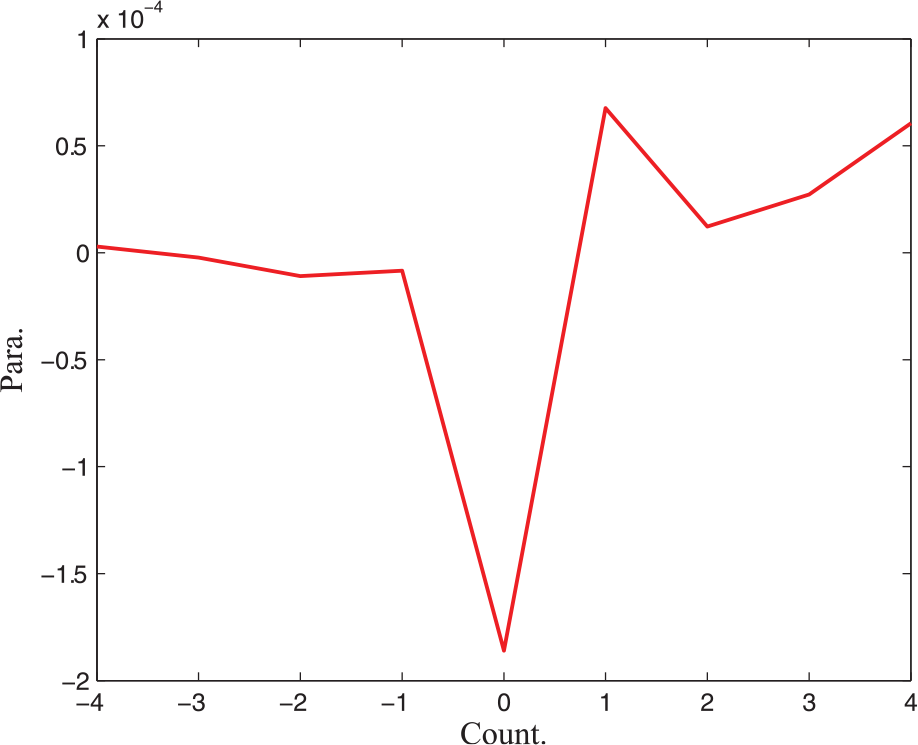
From Table 1, it can be seen that the fitting results of ITLS method are always better than those of OLS and TLS methods. And the variations in parameter λ with the errors of the variables demonstrate singular point when the independent and dependent variables have same error as shown in Figure 2. In this article, Count. and Para. represent lg(δi/εi) and (0.5 − λ), respectively.
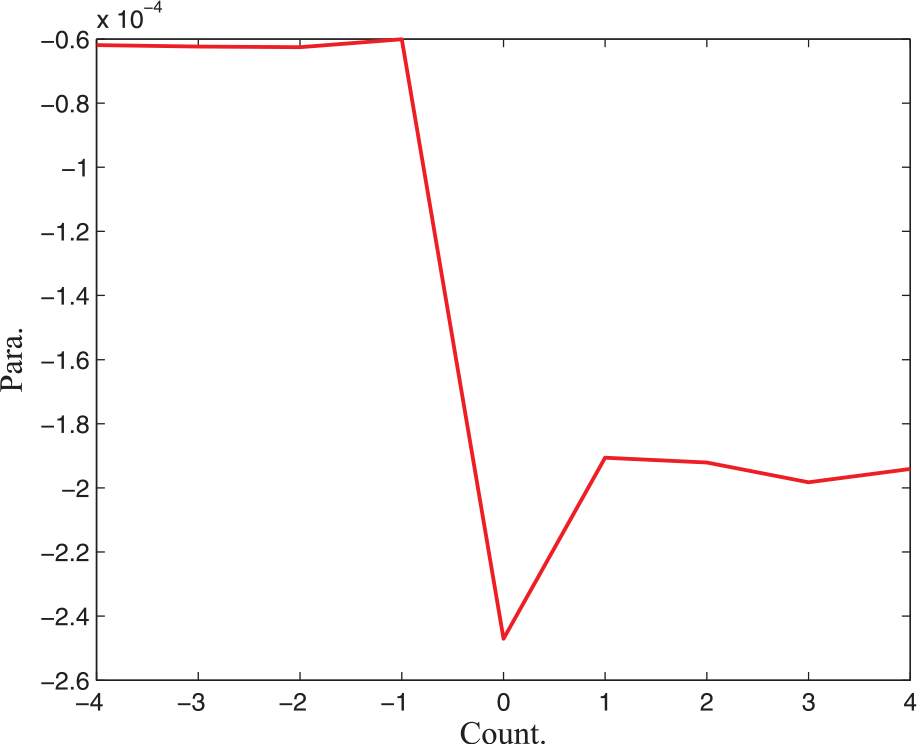
Variation in λ with the errors of variables.
The fitting results show that parameter λ can be the same value when the errors of independent and dependent variables are totally different, and parameter λ illustrates a nonstrict symmetry with the errors of the variables. Moreover, equation (6) with another set of random errors has been considered for further discussion, as shown in Table 2.
Fitting results of three methods.
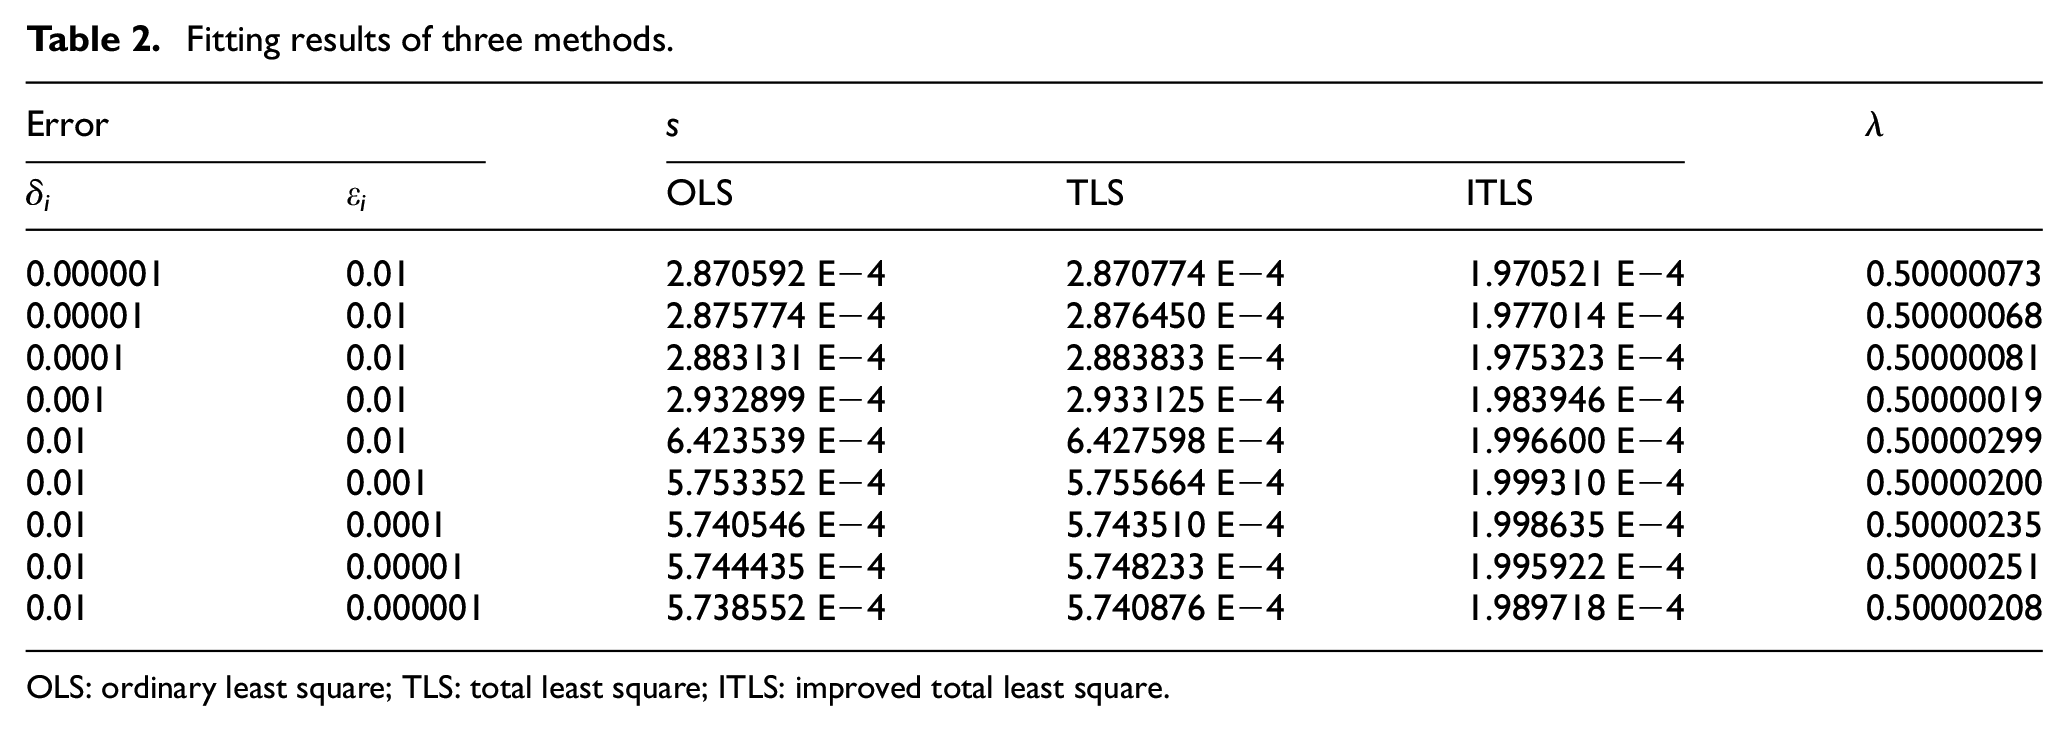
OLS: ordinary least square; TLS: total least square; ITLS: improved total least square.
From Table 2, it can be seen that the fitting results of ITLS method are still always better than those of OLS and TLS methods. And, as shown in Figure 3, the variations in parameter λ with the errors of the variables demonstrate similar change as shown in Figure 2. But the values of parameter λ in Figure 3 are totally different from the values of that in Figure 2.
Variation in λ with the errors of variables.
Example 2
Consider the function

defined on the region Ω = [−10, 10] × [−10, 10] and choose a uniformly distributed set of points. The measurement data are generated in the same way as Example 1 and the fitting performance is characterized by
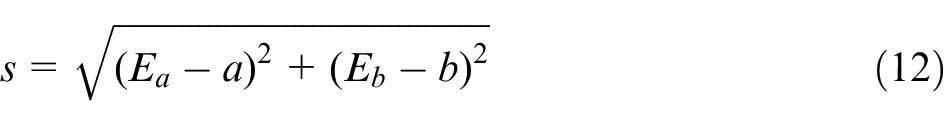
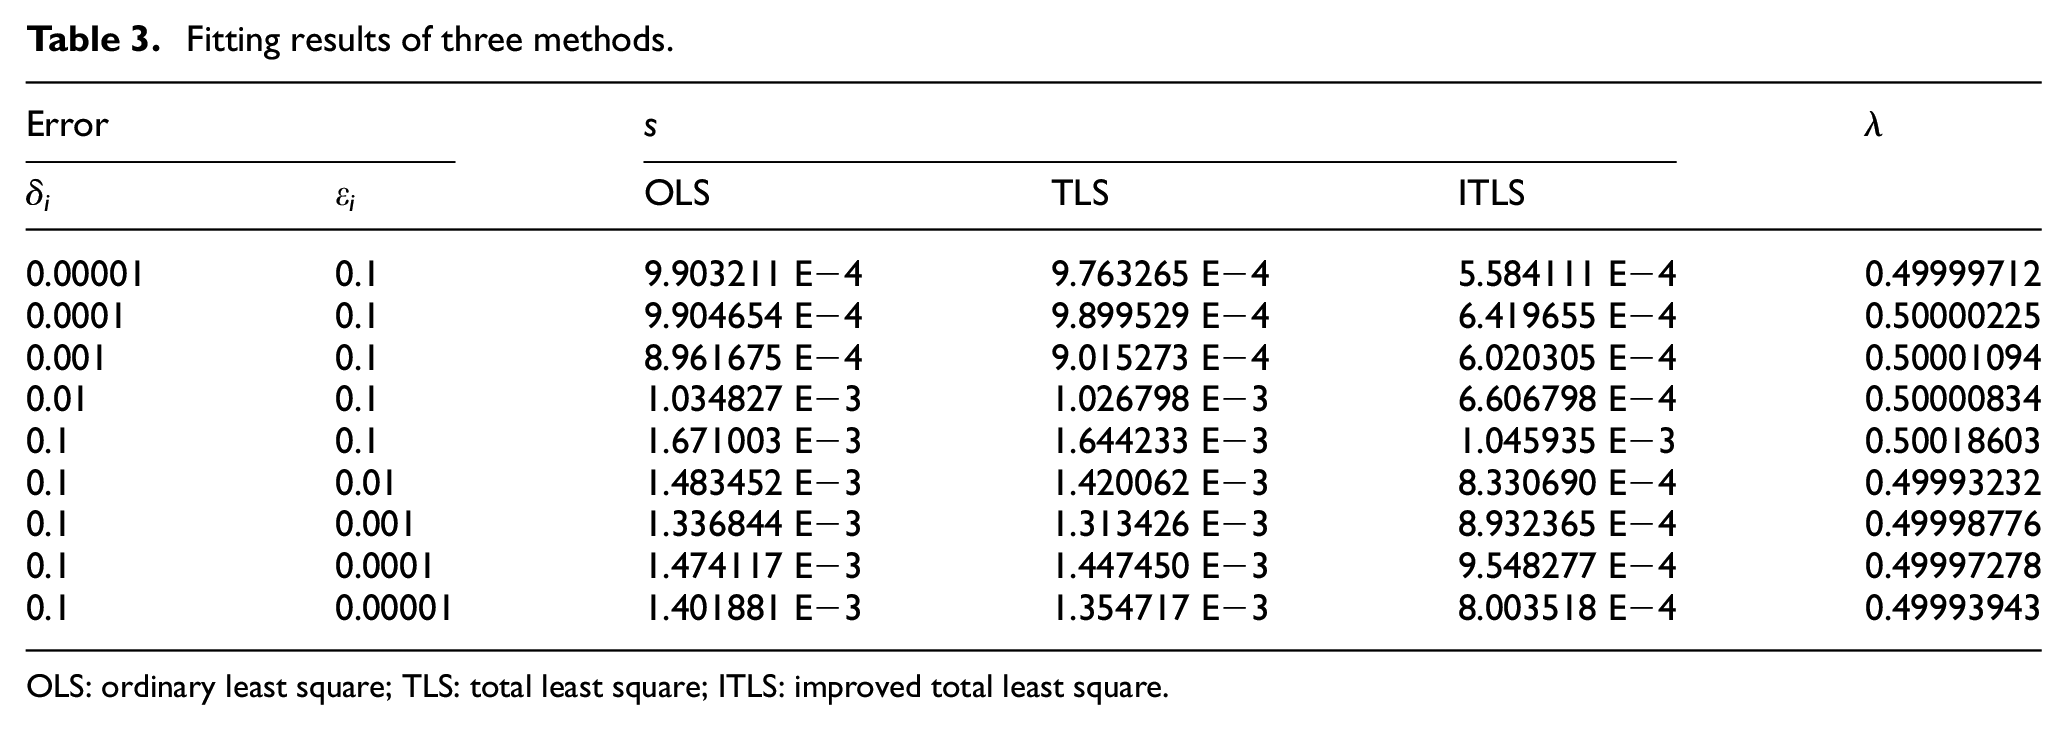
The parameter λ of ITLS method can be set to λ0 (here, λ0 is 0.45) first. Then, vary λ with an increment of certain step h (here, h is 0.00001) and record λ corresponding to the minimum value of s. OLS, TLS, and ITLS methods are all applied to fit the measurement data. The fitting results are summarized in Table 3.
Fitting results of three methods.
OLS: ordinary least square; TLS: total least square; ITLS: improved total least square.
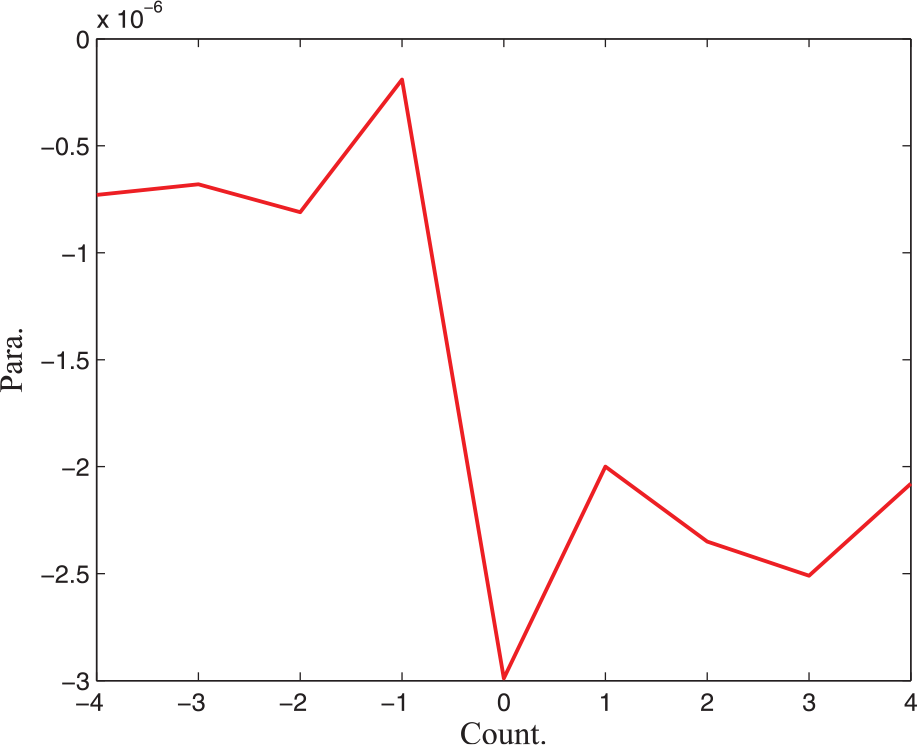
As shown in Table 3, the fitting results of ITLS method for plane surface fitting are still better than those of OLS and TLS methods. And the fitting results of OLS and TLS methods demonstrate singular point when the independent and dependent variables have same error. The variations in parameter λ with the errors of the variables are shown in Figure 4.
Variation in λ with the errors of variables.
From these tables, the fitting results of three methods associated with the errors of the variables can be illustrated as shown in Figure 5. Compared with OLS and TLS methods, ITLS method always has the best results for the fitting performance, especially when the error of the independent variable is more than that of the dependent variable. Furthermore, the fitting results of OLS and TLS methods demonstrate dramatic changes when the variable errors are equal or close.
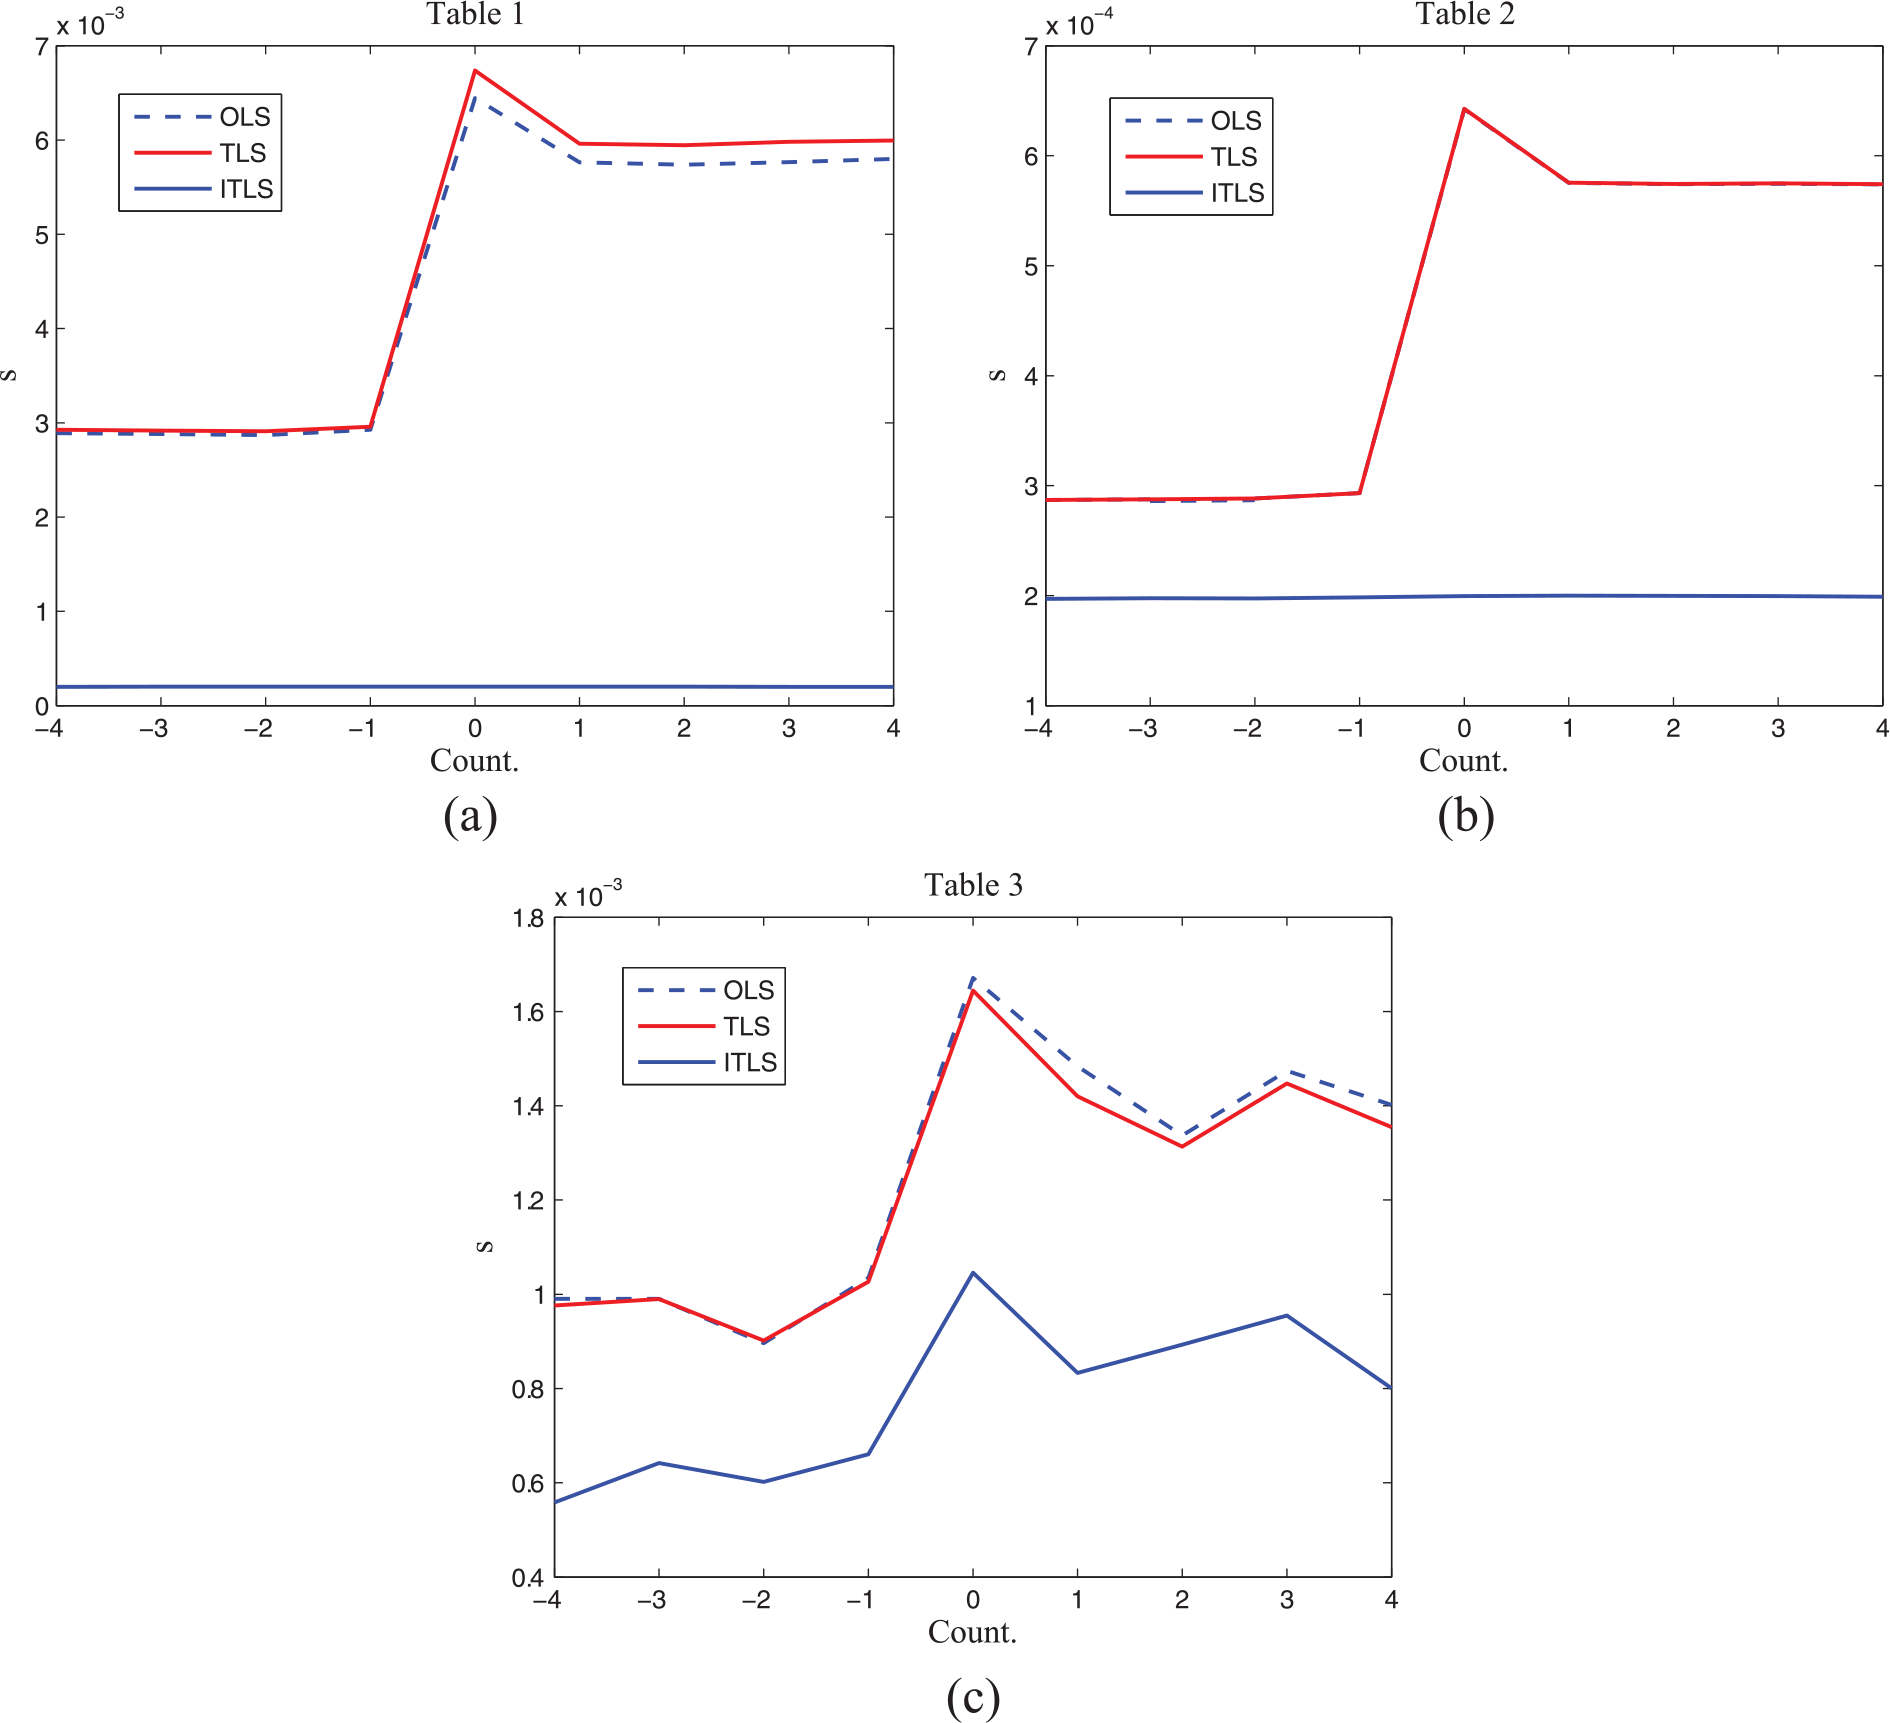
The s value of three methods.
As has been shown in Examples, it is difficult to determine the parameter λ of ITLS method with an explicit solution for measurement data. In this article, the following procedure is carried out to determine the parameter λ of ITLS method:
Step 1: fit the measurement data (xim, yim, zim) using TLS method for getting estimation values Ea, Eb, and Ec.
Step 2: consider the function

and choose a set of points (xim, yim, zi), i = 1, 2,…, m, determined by equation (13). Then, add δi and εi, which are known random error of measurement system, to xim, yim, and zi, respectively, forming a set of tested data (xit, yit, zit).
Step 3: λ is set up to λ0.
Step 4: fit the tested data (xit, yit, zit) using ITLS method for getting estimation value Eaλ and Ebλ.
Step 5: calculate the s
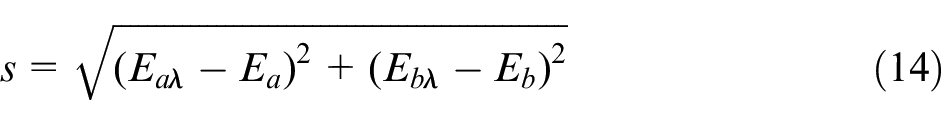
and record the value of s.
Step 6: vary λ with an increment of certain step h.
Step 7: record λ corresponding to the minimum value.
Step 8: repeat Steps 2–7 for r times.
Step 9: average the record values of λ and take it as the final value for λ in ITLS method.
Measurement experiment
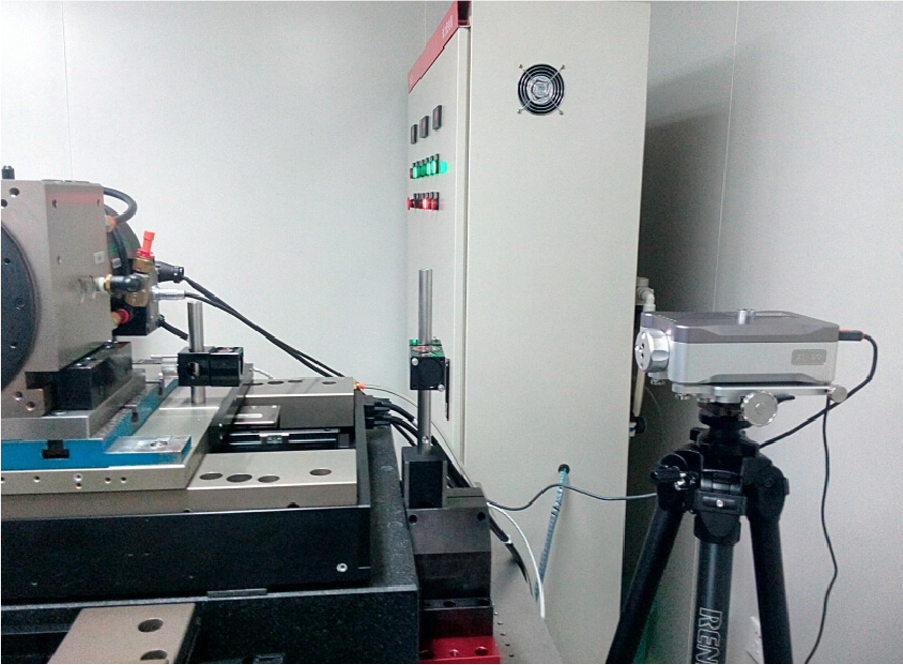
The profile of an optical optical flat with peak-to-valley (PV) value of 31 nm is measured by coordinate measurement machine as shown in Figures 6 and 7 for verifying the performance of ITLS method compared with those of OLS and TLS methods.
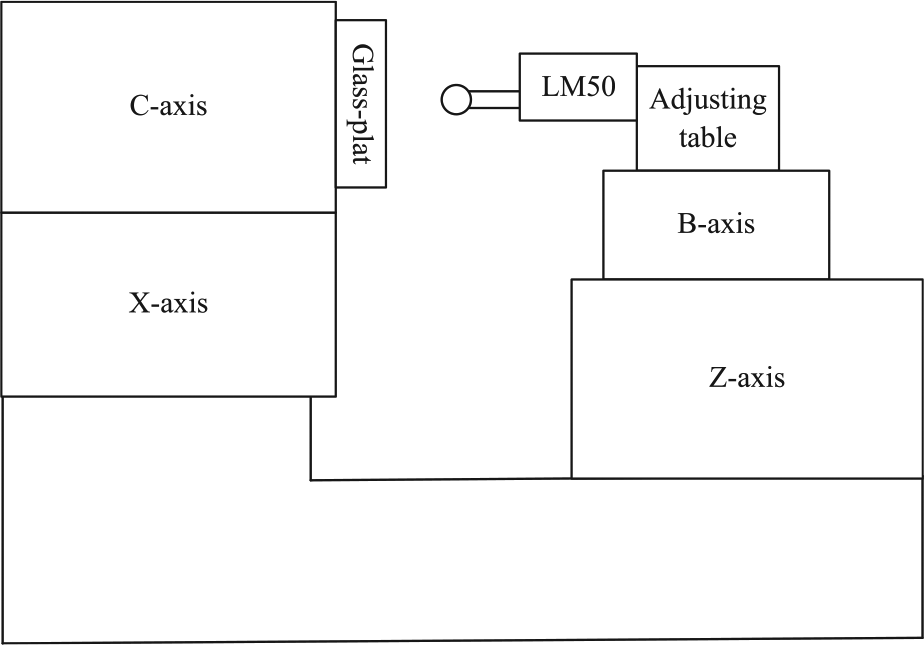
Schematic diagram of measuring machine.
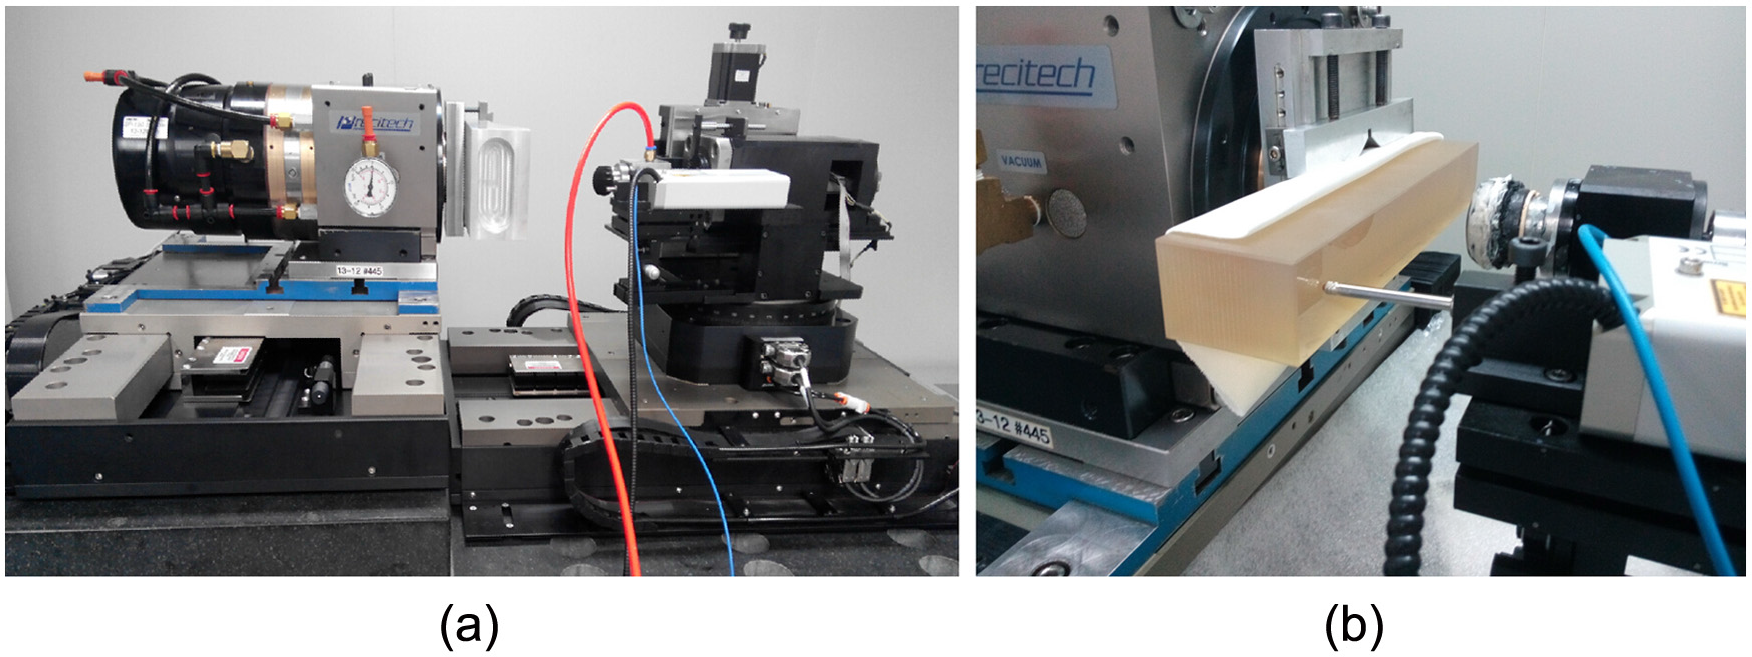
Profile measurement of optical flat: (a) coordinate measuring machine and (b) measurement for optical flat.
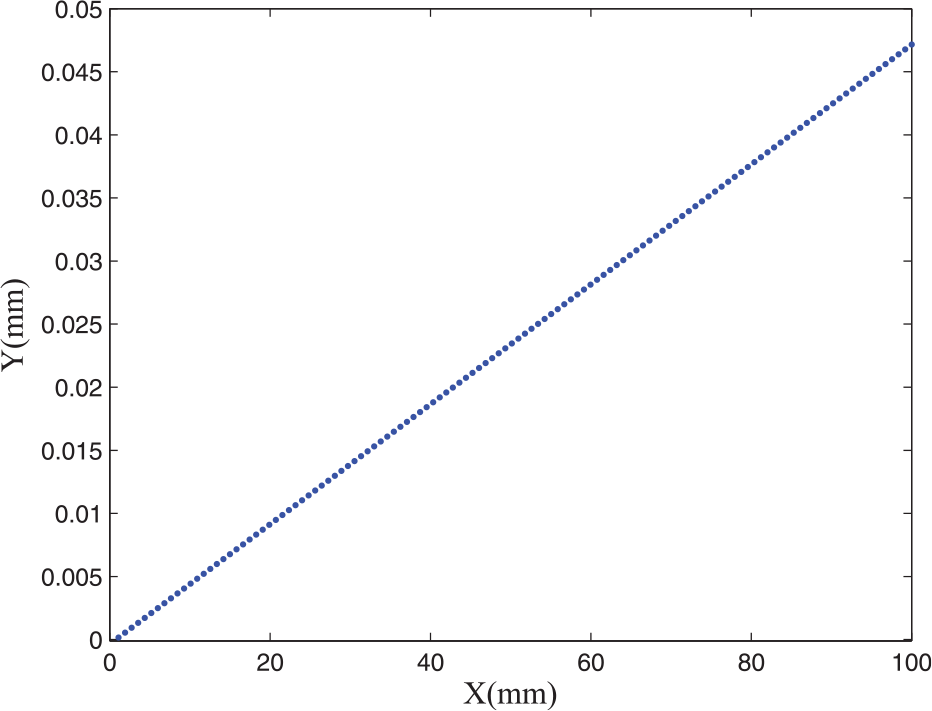
A laser interferometer (SIOS LM50) is set on a rotation axis B with an adjusting table to measure the profile of the optical optical flat set on the spindle C. The spindle C with optical flat is moved by a translation axis X, of which the range is −100 to 100 mm. The repetitive positioning error of X-axis is about 41 nm, which is measured by Renishaw laser interferometer as shown in Figure 8.
Calibration for repetitive positioning error of X-axis.
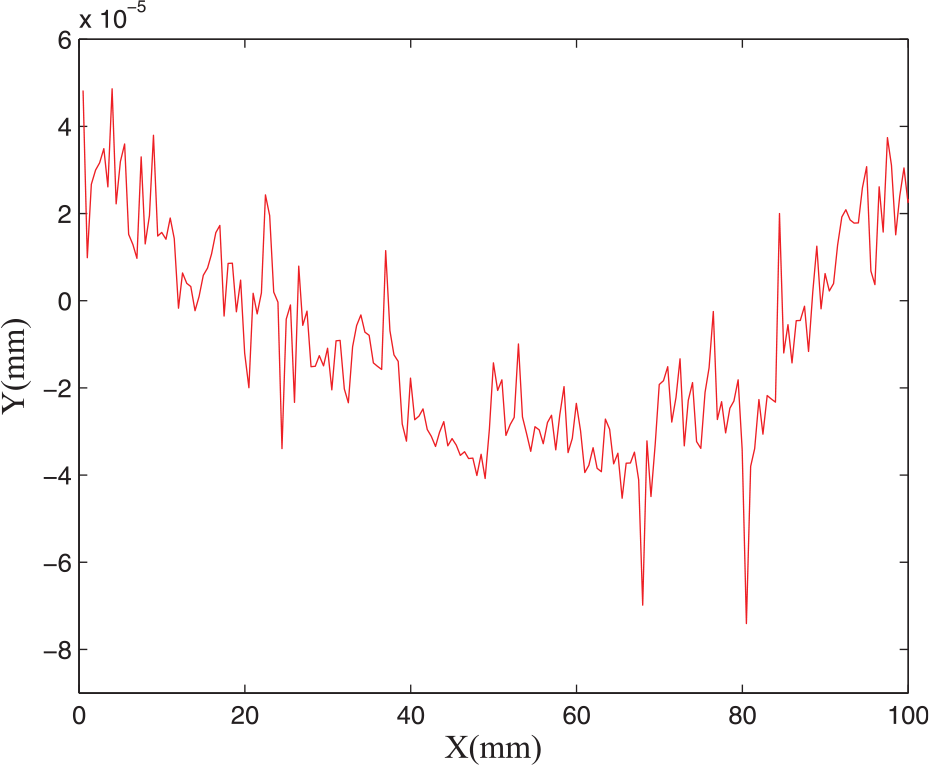
The measurement range of the sensor is about 50 mm and the repetitive error is about 127 nm. The scanning range and time for the optical flat are about 100 mm and 42 min, respectively, and the number of measurement data is 201. Figure 9 shows the measurement data of optical flat.
Measurement data of optical flat.
Based on the above-mentioned procedure in which h = 0.00001 and r = 1000, Ea and Eb of TLS method are used for determining the parameter λ of ITLS method. Based on the above-mentioned procedure, Ea and Eb of TLS method are used for determining the parameter λ of ITLS method under the condition that the h is 0.00001 and r is 1000. The fitting results of three methods are illustrated in Table 4.
Ea values of three methods.
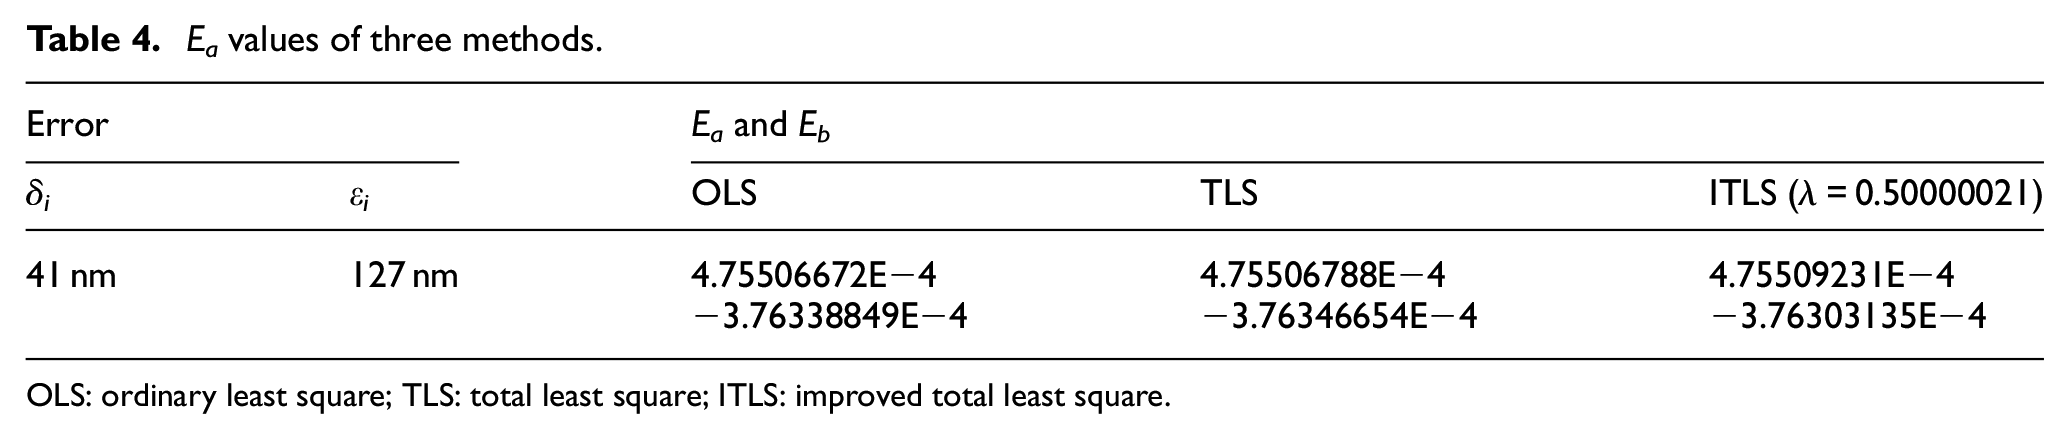
OLS: ordinary least square; TLS: total least square; ITLS: improved total least square.
The computation is implemented on a personal computer with MATLAB. The extra time for determining the parameter λ is about 34 min when h = 0.00001, r = 1000, and λ varies from 0.45 to 0.55. OLS, TLS, and ITLS methods are all applied to fit the measurement data. The fitting result of ITLS method is illustrated in Figure 10 and the straightness values of three methods are summarized in Table 5, which confirms the validity of the proposed ITLS method.
Straightness calibration of ITLS method.
Straightness values of three methods.
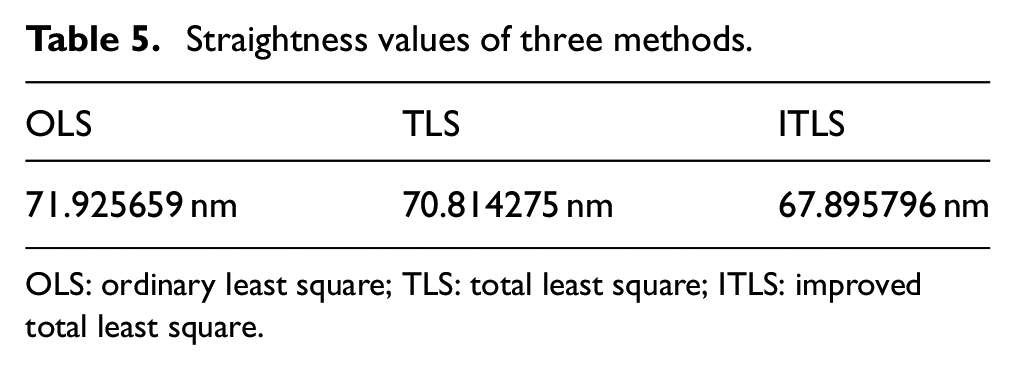
OLS: ordinary least square; TLS: total least square; ITLS: improved total least square.
As shown in Table 5, ITLS method with λ = 0.50000021 has the best result for the measurement data of optical flat. Note that ITLS method had more obvious performance for the errors of all the variables in a symmetrical way. In contrast, OLS and TLS methods were both insensitive to the variable errors. In conclusion, ITLS method is potentially useful for improving the calibration accuracy of straightness error of CMM. Further research is required for determining the parameter λ of ITLS method more efficiently.
Conclusion
The approximant of OLS method is carried out in the vertical direction and that of TLS method is carried out considering the errors of all the variables in a symmetrical way. Considering the practical need for straightness calibration, this article presents a straight line and plane surface fitting method called ITLS method. Different from OLS and TLS methods, a parameter λ is introduced to augmented matrix for determining the approximation coefficient in ITLS method. TLS method can be regarded as a special case of ITLS method. ITLS method can be converted into TLS method by setting λ = 0.5. Furthermore, the optimal value of parameter λ is difficult to obtain for the variable errors in an asymmetric way. A procedure has been developed to determine the parameter λ. The fitting results of ITLS method for the discrete points generated by numerical simulation or obtained by measurement are compared with those by OLS and TLS methods under the same condition. ITLS method always has better performance than OLS and TLS methods for the straightness calibration, which confirms the validity of the proposed ITLS method.
Footnotes
Declaration of conflicting interests
The author(s) declared no potential conflicts of interest with respect to the research, authorship, and/or publication of this article.
Funding
The authors would like to be grateful to the financial support from the National Natural Science Foundation of China (Grant Nos 51175086 and 51405085) and the National Key Basic Research and Development Program (973 program) of China (Grant No. 2011CB706702).