
Abstract
Fibre composite is widely used in the field of aerospace because of its excellent performance. However, during the process of fibre placement using an automated fibre placement machine, it is difficult to guarantee accurate fibre placement. To solve the problem, this study established an online detection method for fibre tow placement accuracy. It captures the image of the detection region using an industrial charge-coupled device camera, identifies those regions with gaps in the image using computer vision methods and then acquires the gap widths which are the fibre placement accuracy of each fibre tows. When the angle between upper and lower fibre tows was small, to find the position of edges in the images accurately, we presented an improved image enhancement method based on histogram stretching. The experimental results showed that this online detection method was applicable and can quickly and effectively identify the position and width of the gaps in the detection region. Furthermore, it had high resolution, which can meet the requirements of practical engineering.
Introduction
Resin matrix fibre composite is widely used in aerospace manufacturing and has broad application potential1,2 because it possesses several advantages, such as high specific strength and modulus, fatigue, creep and corrosion resistance, thermal and electrical conductivity, and a low coefficient of expansion. For example, the amount of composite materials in the airframe of the Airbus 380 is 22%, and for the Boeing 787 it is up to 50%. 3 It is predicted that the amount of composite materials in future commercial aircraft will reach 70%−80%. 4
Automated fibre placement (AFP) is the main technology used in manufacturing an airframe. 5 Being an advanced automatic moulding technology for resin matrix fibre composite, it is a vastly superior technique and is widely applied in the aerospace composites industry. AFP is a composite fabrication technique that increases the flexibility of the fibre placement process and allows the fabrication of more complex structures. 6 The process of AFP can be briefly summarized into three steps: first, heat the fibre tows; second, lay the fibre tows on the surface of the core mould; finally, cool down the moulding structure. The process of AFP is shown in Figure 1. 7 In sequence, it contains zones for preheating, air cooling, main heating, molten state, air cooling and cooling. 8 The process of preheating can improve the efficiency of fibre placement and more easily mould the fibre tows. The molten process contributes to a good combination of the fibre tows.
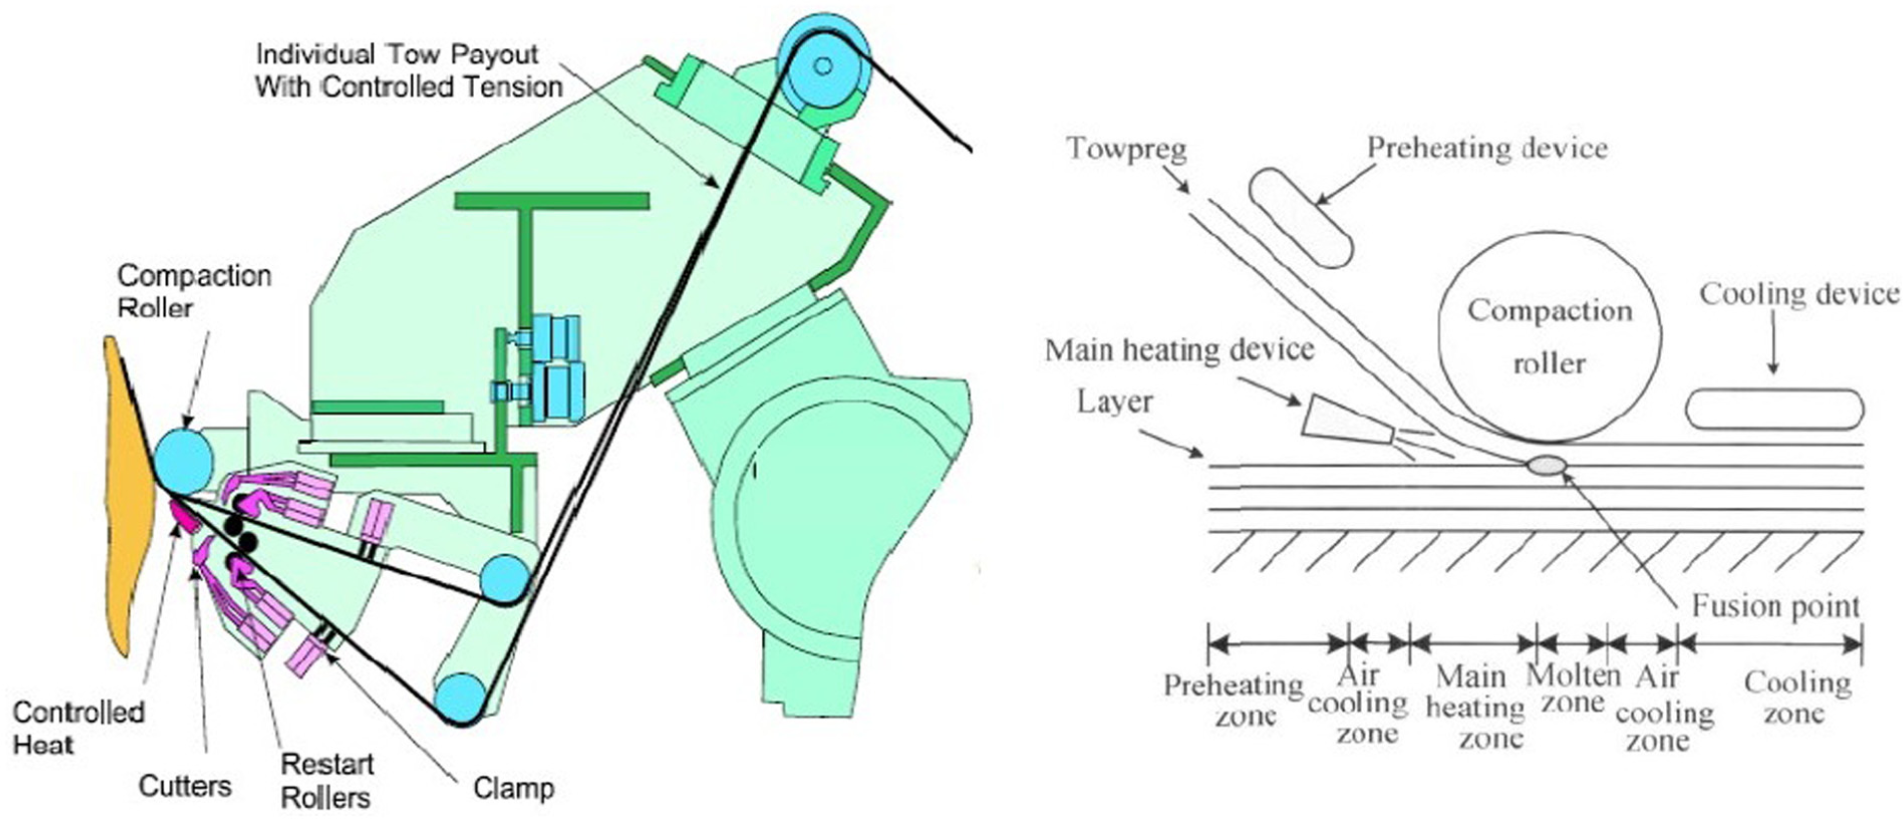
The process of automated fibre placement.
At present, the well-known manufacturers of AFP machine tools include Electro Impact, Ingersoll and MAG Cincinnati. However, the study of AFP machine tools is not enough. During the process of fibre placement, the accuracy of fibre placement which means the gap width between two fibre tows cannot meet the requirements because of the error between two strokes or some types of interference, and unstable factors, such as the fluctuations of motor speed and feed mechanisms. If the gap width is too large, the fibre tow will overlap with the sideward fibre tow and make the composite structure disabled. Therefore, we need to develop a special device and an online detection method to guarantee the requirements of fibre placement. This device and method must achieve real-time detection of placement accuracy. Using this device and method, the problem must be detected at the start of manufacture and fed back to the host computer to adjust the operating parameters of the fibre placement head. As a result, it increases the efficiency of fibre placement and guarantees the reliability and structural strength of fibre composite components manufactured by AFP machine tools.
It is necessary for large computer numerical control (CNC) machine tools to drive the fibre placement head during the process of fibre placement. Because of the current complex structures and high speed of the fibre placement head, it is common practice to achieve online placement accuracy detection through computer vision. For instance, Shi and Wu 9 provided a type of texture detection method based on computer vision, as well as writing algorithms to recognize the texture of carbon fibres. Kumar 10 applied a multi-charge-coupled device (CCD) camera group to locate the position of defects in a fabric based on computer vision. However, the multi-CCD camera group method cannot cope with the interference from the reflected light of the lower fibre tows when the angle between the upper and lower fibre tows is small. Wei and Jiao 11 used visual location technology in the pick and place process. This visual location system had high accuracy of the order of 1/40 sub-pixels. However, the texture detection methods cannot detect over a large view field when placing 8- or 16-fibre tows synchronously. Noting these problems, this study presents a special device and a detection method for detecting the placement accuracy. This special detection device applies a multi-lighting source illumination system, and a CCD camera which can obtain the digital images of the detection region. This online detection method can quickly and efficiently acquire the placement accuracy based on computer vision. The device is conveniently attached to the fibre placement head using six bolts.
The capture of fibre tow images of multi-laying angle
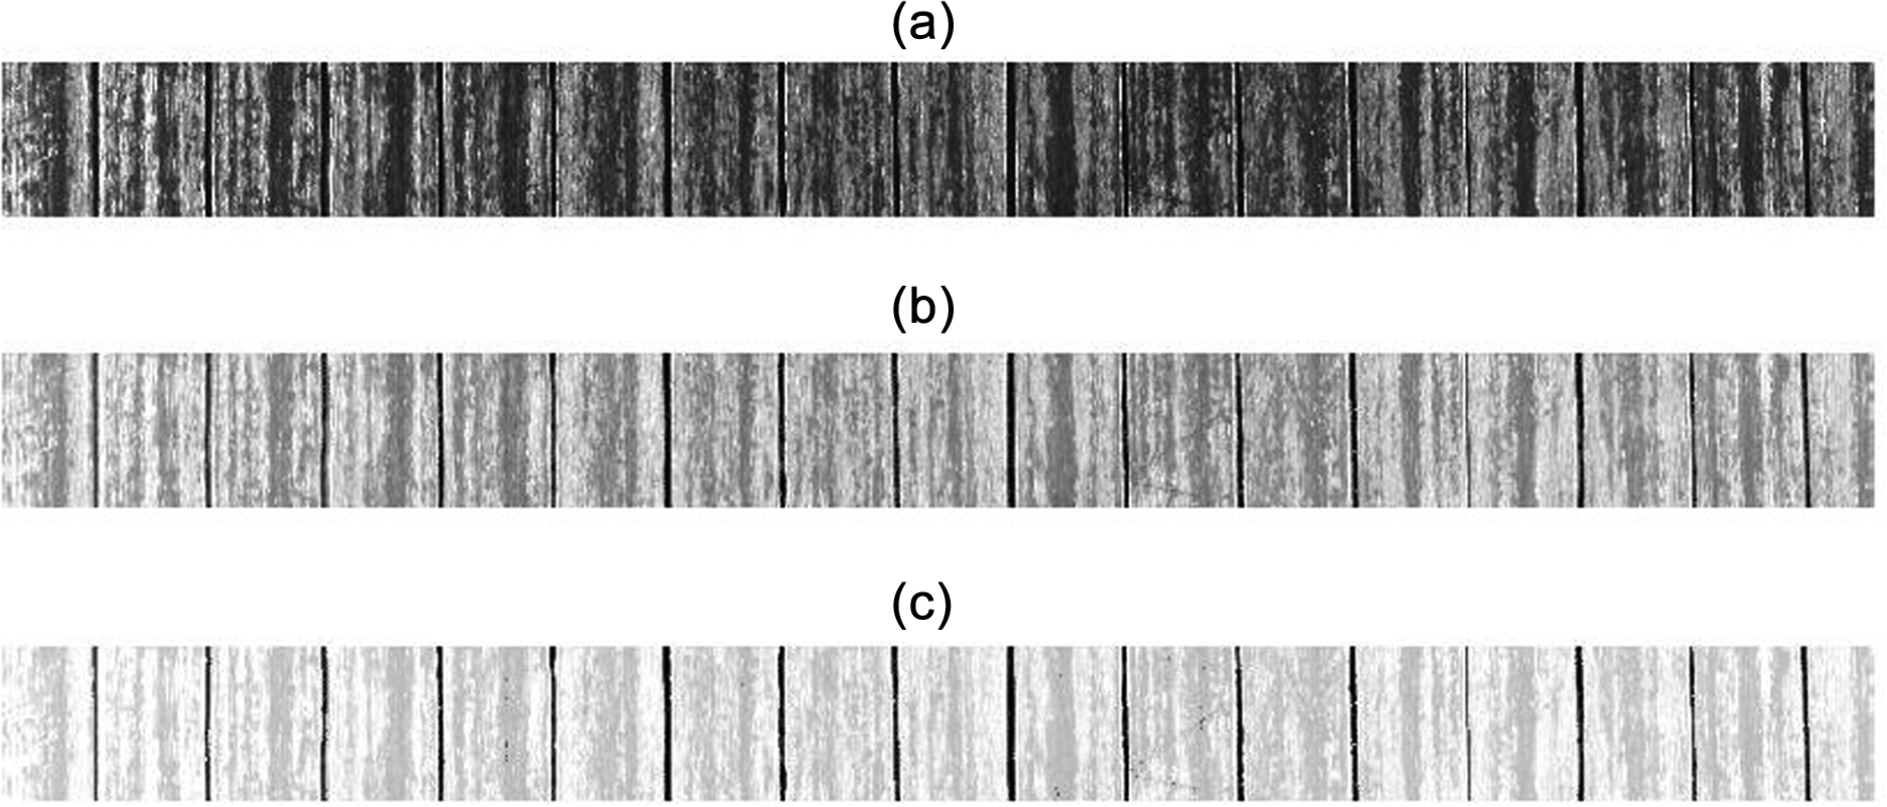
There is a visible texture on the surface of composite fibre tows. The reflectance of different lights with different incidence angles varies because of this. Consequently, it is easy to recognize the edges of fibre tows with this feature through computer vision. We designed a detection device to obtain a digital image of the detection region which is shown in Figure 2. There were two mirrors in this device to fold the optical path so that the position of the device could be closer to the pressure roller, capturing a digital image of the detection region with a single industrial CCD camera. The laying angle between the upper and lower fibre tows was not determinate and could be any value from 0° to 90°. To recognize all situations, it was necessary to install three strip light sources which were switched on at different times. According to the texture on the surface of the composite fibre tows, when the laying angle between the upper and lower fibre tows was above 20°, the strip light source, which was installed in front of the fibre placement head at an inclination of 45°, was switched on. The digital image captured when the laying angle was 90° (the laying directions of the upper and lower fibre tows were vertical) is shown in Figure 3(a). It was easy for the computer to detect the edges of the fibre tows. Conversely, because the upper and lower fibre tows had the same reflective property, the surfaces and edges presented a very low contrast in the digital image captured when the angle was 0° (the laying directions of the upper and lower fibre tows were parallel). As shown in Figure 3(b), it was very difficult for the computer to find the edges. As a result, we changed the method of illumination by switching on two strip sources whose positions were at a 45° inclination on both sides. The new digital image captured in the situation when the angle was 0° is shown in Figure 3(c). Furthermore, to make it easier for the computer to find the edges of the fibre tows, we pre-processed the digital image captured in this situation.
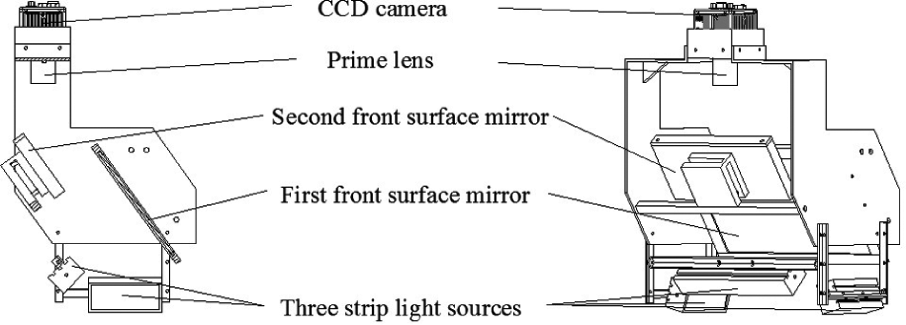
Placement accuracy detection device.
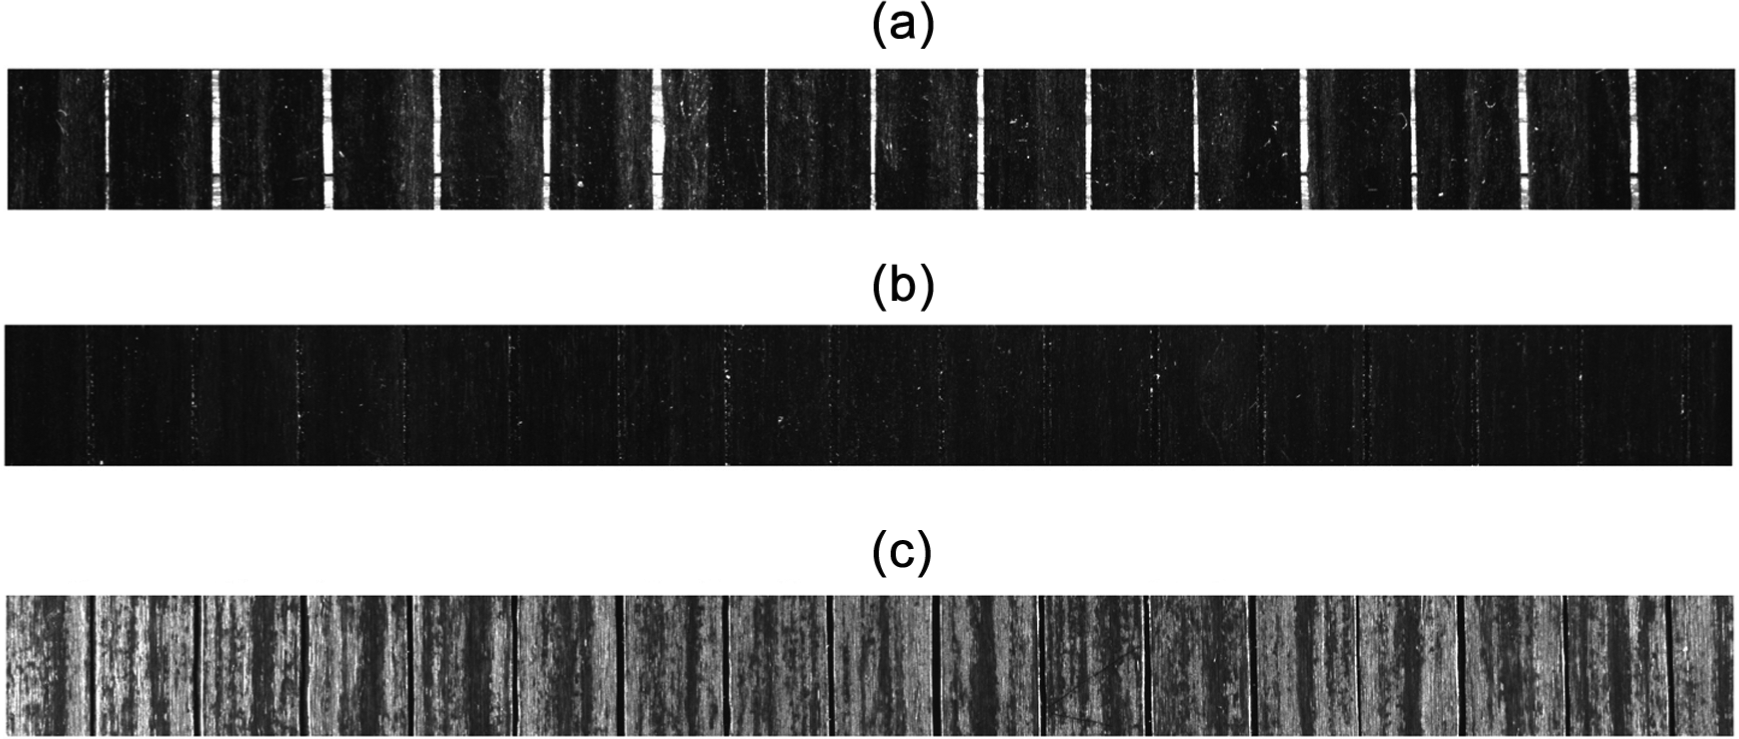
Digital image captured by CCD: (a) digital image captured when the laying angle was 90°, (b) digital image captured when the laying angle was 0° and (c) digital image captured when the laying angle was 0° after changing the method of illumination.
The image processing algorithms for acquiring fibre tow placement accuracy
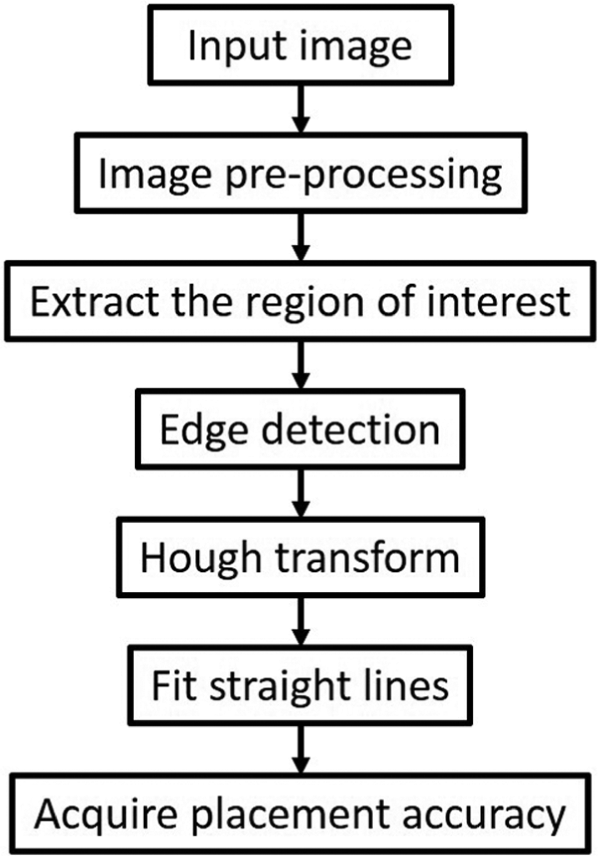
The image processing algorithms are used for improving the image quality and getting more accurate results. Choosing the appropriate image processing algorithms can make the detection results more credible. The algorithm flowchart of this detection method is shown in Figure 4.
The algorithm flowchart of detection method.
Image pre-processing
In Figure 3(a) and (c), the detection regions for the fibre tows are presented. It was easy for the computer to find the position of the edges in the digital image (Figure 3(a)) when the angle between upper and lower fibre tows was comparatively large (90°), whereas it was really difficult to find the exact position of the edge in the image (Figure 3(c)) when the angle was small because there was obvious texture on the surface. Therefore, it was necessary to pre-process the image to increase its contrast and reduce the influence of the texture on the surface of the fibre tows. As a result, we were able to exactly find the positions of the edges using computer vision.
Image enhancement
Histogram stretching is a common algorithm for increasing the contrast of digital images.12,13 The original histogram stretching method is used to make the intensity range of the input image full of the target dynamic intensity range which is set. The mathematical description of the original histogram stretching method is expressed as
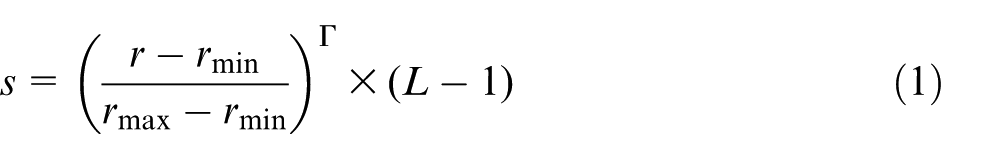
where r is the grey value of the input image,
In this study, we presented an improved image enhancement method that was, on the basis of the histogram stretching method, to add a constant brightness to a certain pixel whose grey value was larger than the threshold. We adopted this improved method to enhance the contrast of the images acquired when the angle between the upper and lower fibre tows was small. The mathematical description of the improved method is expressed as
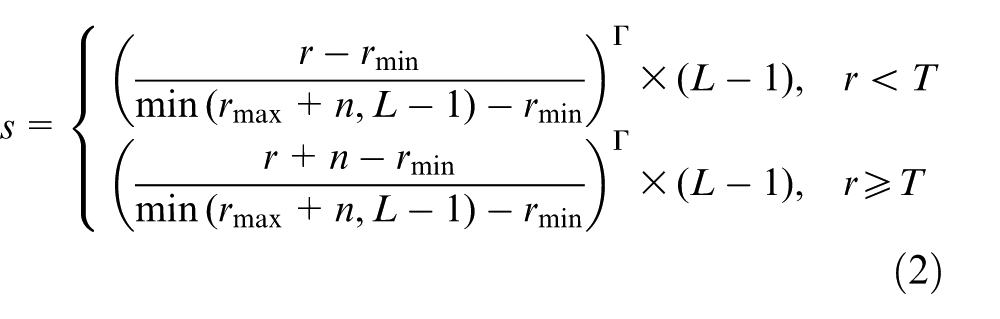
where n is the constant brightness adding to the image and T is the threshold of this improved method. And the threshold represented the grey value where the probability density was 10%. In the input images acquired by CCD, the gaps were mainly concentrated in the areas of low grey levels. The proportion of the width of gaps in the images was about 6%, considering there were some interference on the surface of fibre tows; to separate the gaps from the images, we set the threshold to 10%. This improved method can separate the gaps from image and make the bright areas where the fibres’ surfaces were brighter, as well as make the dark areas where the gaps were darker so that it can increase the contrast of surfaces and gaps.
We applied the original histogram stretching method and the improved method to pre-process the image (Figure 3(c)) and compared the results with the original image. It's worthy to note that, the results of real-time detection were accurate and the thresholds of images acquired by CCD were also relatively stable during the process of fibre placement. It illustrated that the grey level distribution of the input images was also relatively stable.
The results of image pre-processing are shown in Figures 5–7. The grey values in the histogram of the original image (Figure 6(a)) were mainly in the area with low grey levels. There was little difference between the edge and surface of the fibre tow in this three-dimensional (3D) grey value image (Figure 7(a)). The edges were not obvious and the textures of the surface of the fibre tows also had a significant impact on the recognition of edges. The grey values in the images processed using histogram stretching (Figures 6(b) and 7(b)) and the improved method (Figures 6(c) and 7(c)) were mainly in the area with high grey levels. The grey level differences between the edges and surface increased significantly. Both of the image enhancement method can increase the contrast of the images. However, compared with the results of original histogram stretching method, in the result of improved method, the grey level distribution was more polarized. The histogram of the image processed using improved method divided into two parts; on the contrary, the histogram of the image processed using original method was still consecutive. Compare with the side view of 3D grey level image processed using original method (Figure 7(b)), the contrast between edges and surfaces was larger in the results of improved method. Moreover, the minimum values in the side view of 3D grey level image of improved method was less fluctuant than the results of original method. And it meant the improved method can more effectively suppress the texture on the surface. As a result, the computer was able to find the edges more easily and accurately and this improved method had stronger adaptability.
(a) Original image: the brightness was very low, and the edges in this image were also not obvious. (b) The image processed using original histogram stretching. (c) The image processed using the improved method. The brightness and contrast of image in (c) were higher compared with the image in (b). It is shown that the improved method can obtain better results.
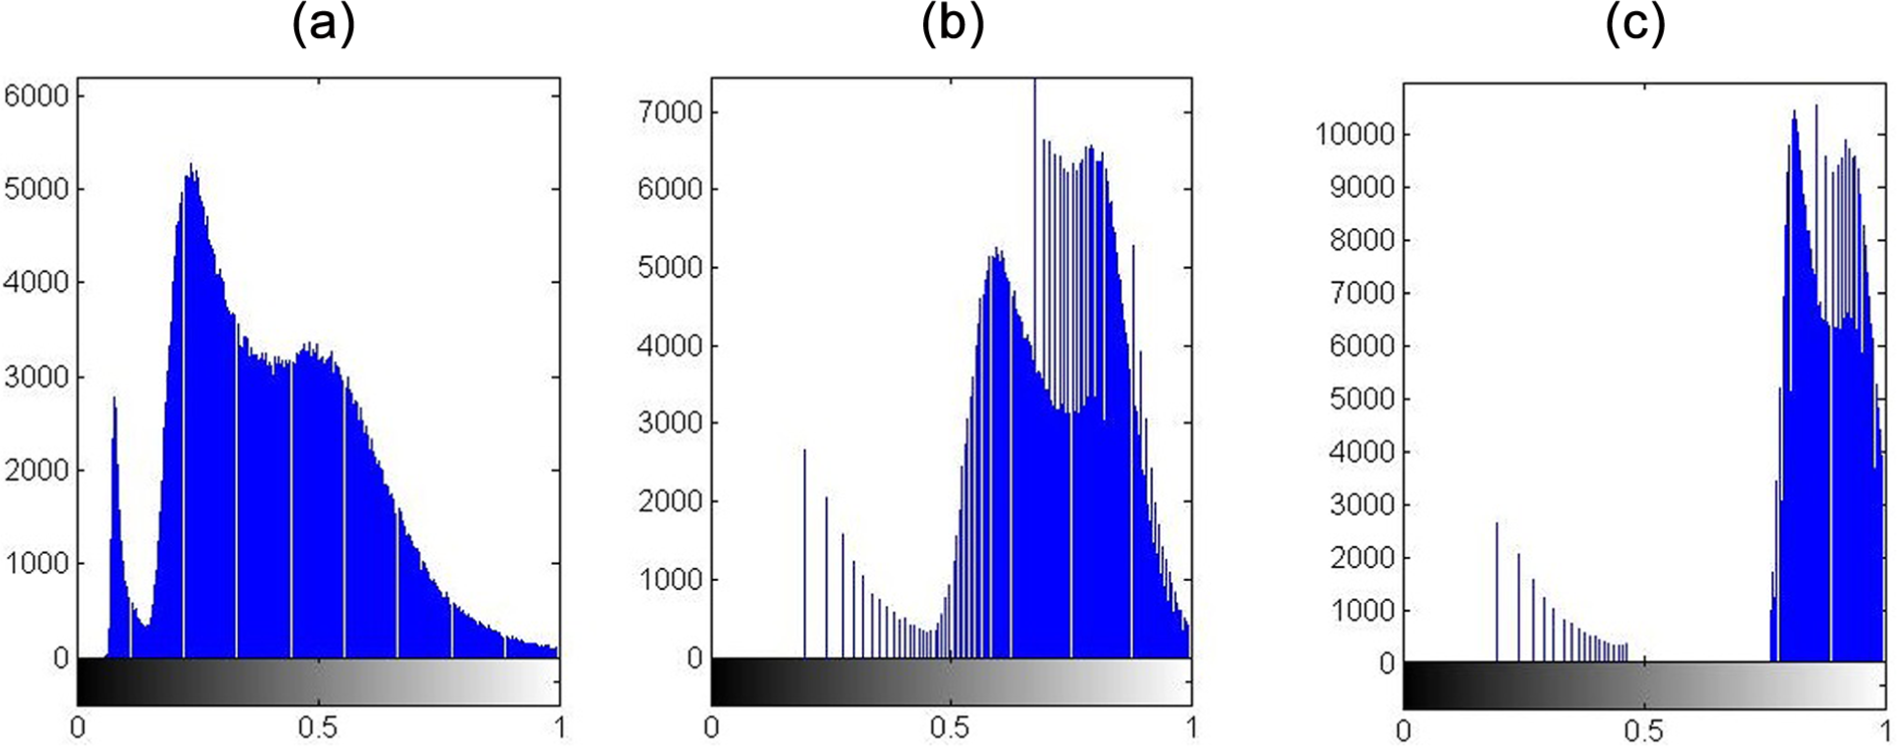
(a) Histogram of original image. It mainly concentrated in the region of low grey level. (b) Histogram of the image processed using original histogram stretching. It mainly concentrated in the region of high grey level. (c) Histogram of the image processed using the improved method. It is divided into two parts, and the region of high grey level was more concentrated. It meant that the improved method can make the contrast higher than the original method.
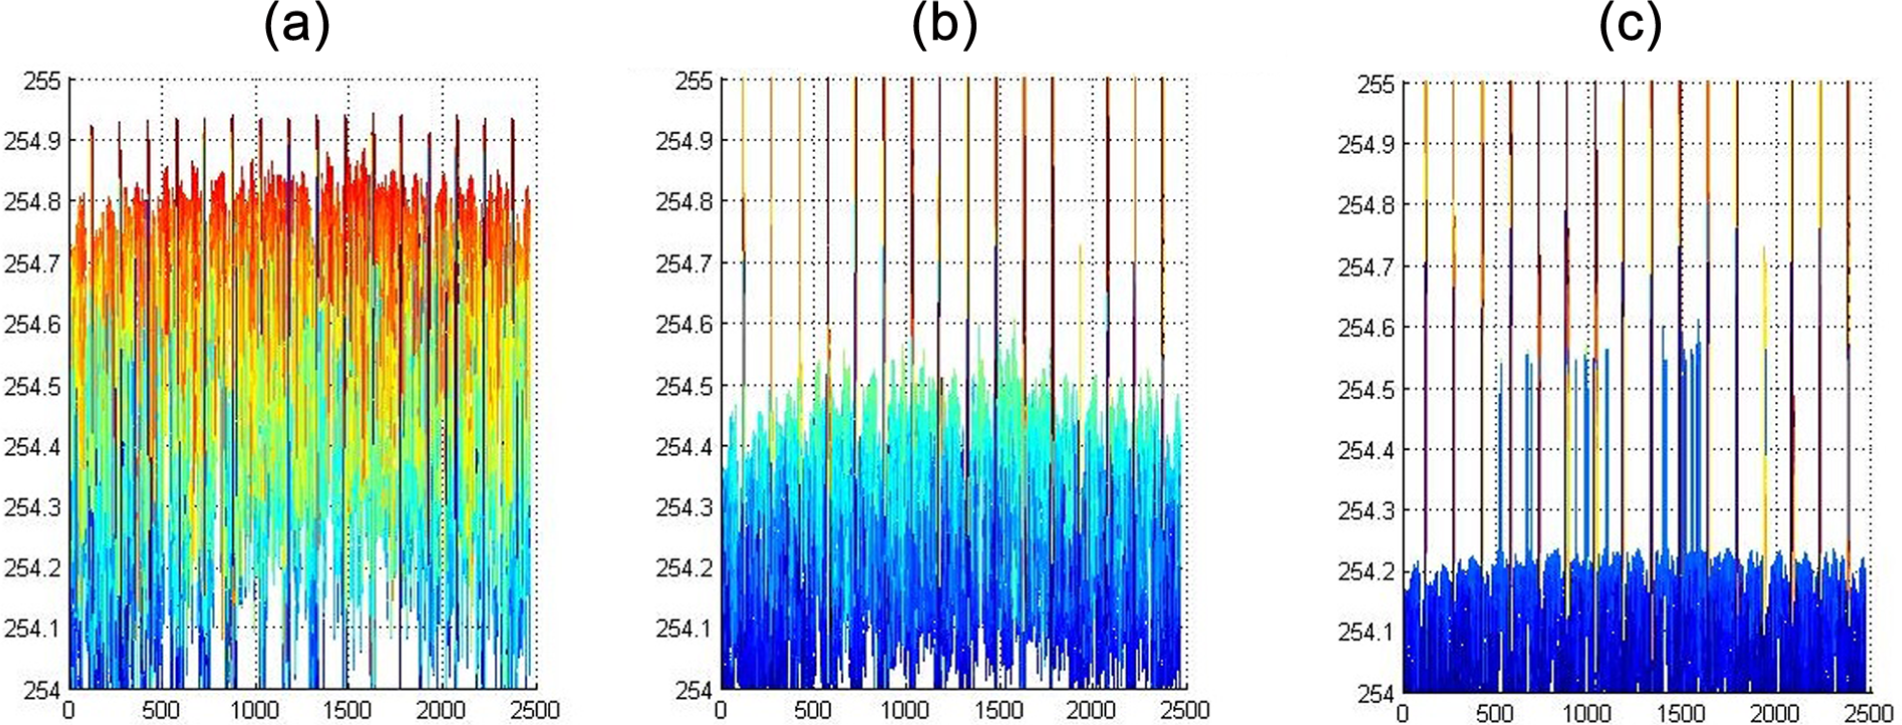
(a) Side view of 3D grey level image of original image. It was hardly to distinguish between surfaces and edges. (b) Side view of 3D grey level image of the image processed using original histogram stretching. It can improve the contrast of the image and make edges more obvious. (c) Side view of 3D grey level image of the image processed using the improved method. It can make the contrast of image higher and effectively suppress the texture on the surface.
Extracting the region of interest
The image to be processed is shown in Figure 7(c) whose size is 2456 × 200 pixels. It contained more information on the fibre tows’ surface and less information on the fibre tows’ edges and width direction. If we had processed this image directly, it would have taken considerably more time in processing the area of the fibre tow’s surface. Moreover, the pixels of the area of the fibre tow’s surface would have interfered with locating the edges. As a result, it was necessary to extract the region of interest (ROI). Considering that the relative position of the industrial CCD camera and fibre placement head was constant during the process of fibre placement, the length of the pixels between the edges in the digital image was basically constant although there was some jitter and deviation. Therefore, in this study, we extracted the ROI which was 40(W) × 100(L) pixels. Some pixels in the width direction were a reserved margin for possible position deviation of the fibre tows. There were only 640 pixels for all the ROIs in the width direction so the amount of calculation in the programme processing was reduced by 74% and the running time of programme also decreased significantly. In addition, it also avoided the influence of texture on the surface of the fibre tows. Generally speaking, the method for extracting the ROI can significantly reduce the running time of the programme and improve the efficiency and rate of accuracy in locating the edges.
Edge detection
Because the basic shape information of the digital image was conveyed by the boundary of the image, extracting and analysing the information of the boundary played an important role in processing the digital image.14,15 The most common edge detection operators are the Roberts, Prewitt, Sobel and Canny operators. Taking the first local image as an example, we processed this digital image using all four operators and established the best for processing the image. From the processing results shown in Figure 8, we found that the Prewitt and Sobel operators could detect edges more accurately compared with the Roberts and Canny operators. Known as the best edge detection operator, the Canny operator, in this experiment, received considerable interference from the texture on the surface of the fibre tows when detecting the edges, and Canny operator is more complex than Sobel and Prewitt operators. Compared with Prewitt operator, Sobel operator can locate the position of edges more accurately. In summary, the best edge detection operator was the Sobel operator because it detected the edges accurately and effectively.
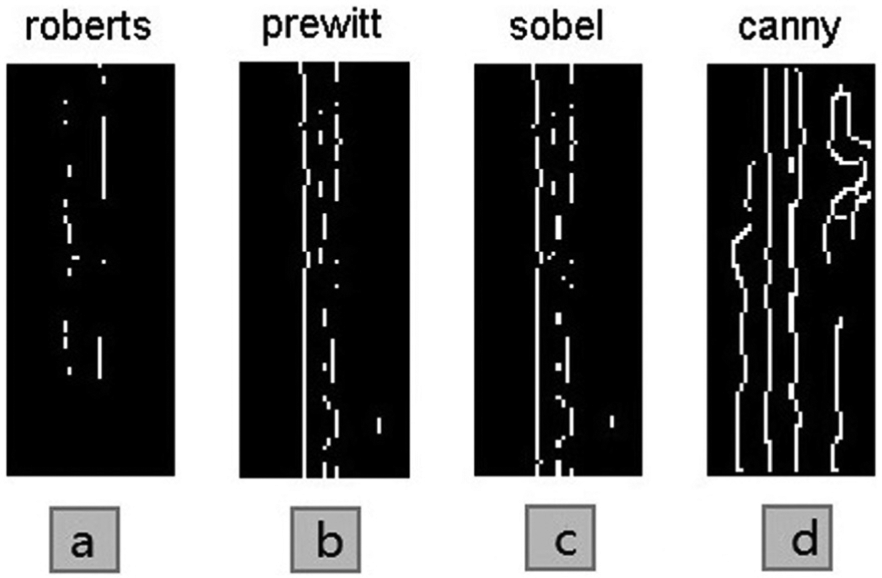
Results of edge detection using the operators of Roberts, Prewitt, Sobel and Canny. The result of Roberts operator was not complete edges. And Prewitt and Sobel operators made good results. The Canny operator was more sensitive and affected by considerable interference from the texture on the surface.
The edge detection operator only converted the original digital image to a binary image of its edges, while at the same time, the edges found in the image were discontinuous and the binary image also contained many interference points. Thus, it was necessary to do further processing to find the exact position of each edge pixel. Hough transform is a common method for finding lines in a digital image. We provide an example again using the first local image. After processing the first local image using the Hough transform, we obtained the transform result as shown in Figure 9.
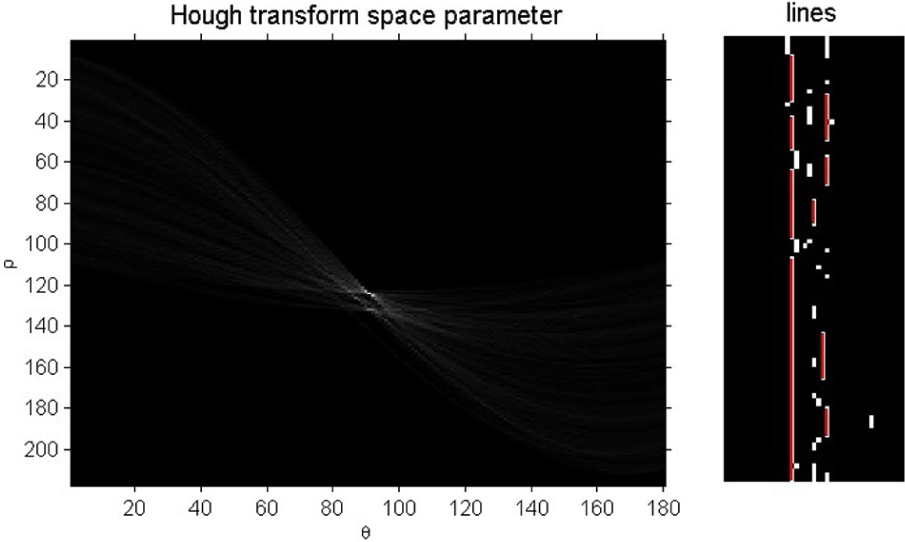
Results of the Hough transform of the found edges. The left picture was the space parameter and the red lines in the right picture were the straight lines obtained using Hough transform.
Acquiring placement accuracy
Based on the lines obtained from the Hough transform, we calculated the distances between these lines and obtained the gap width, namely, the placement accuracy of the fibre tows. To obtain the exact position of the edges requires fitting the lines obtained from Hough transform. The fitting results are shown in Figure 10.
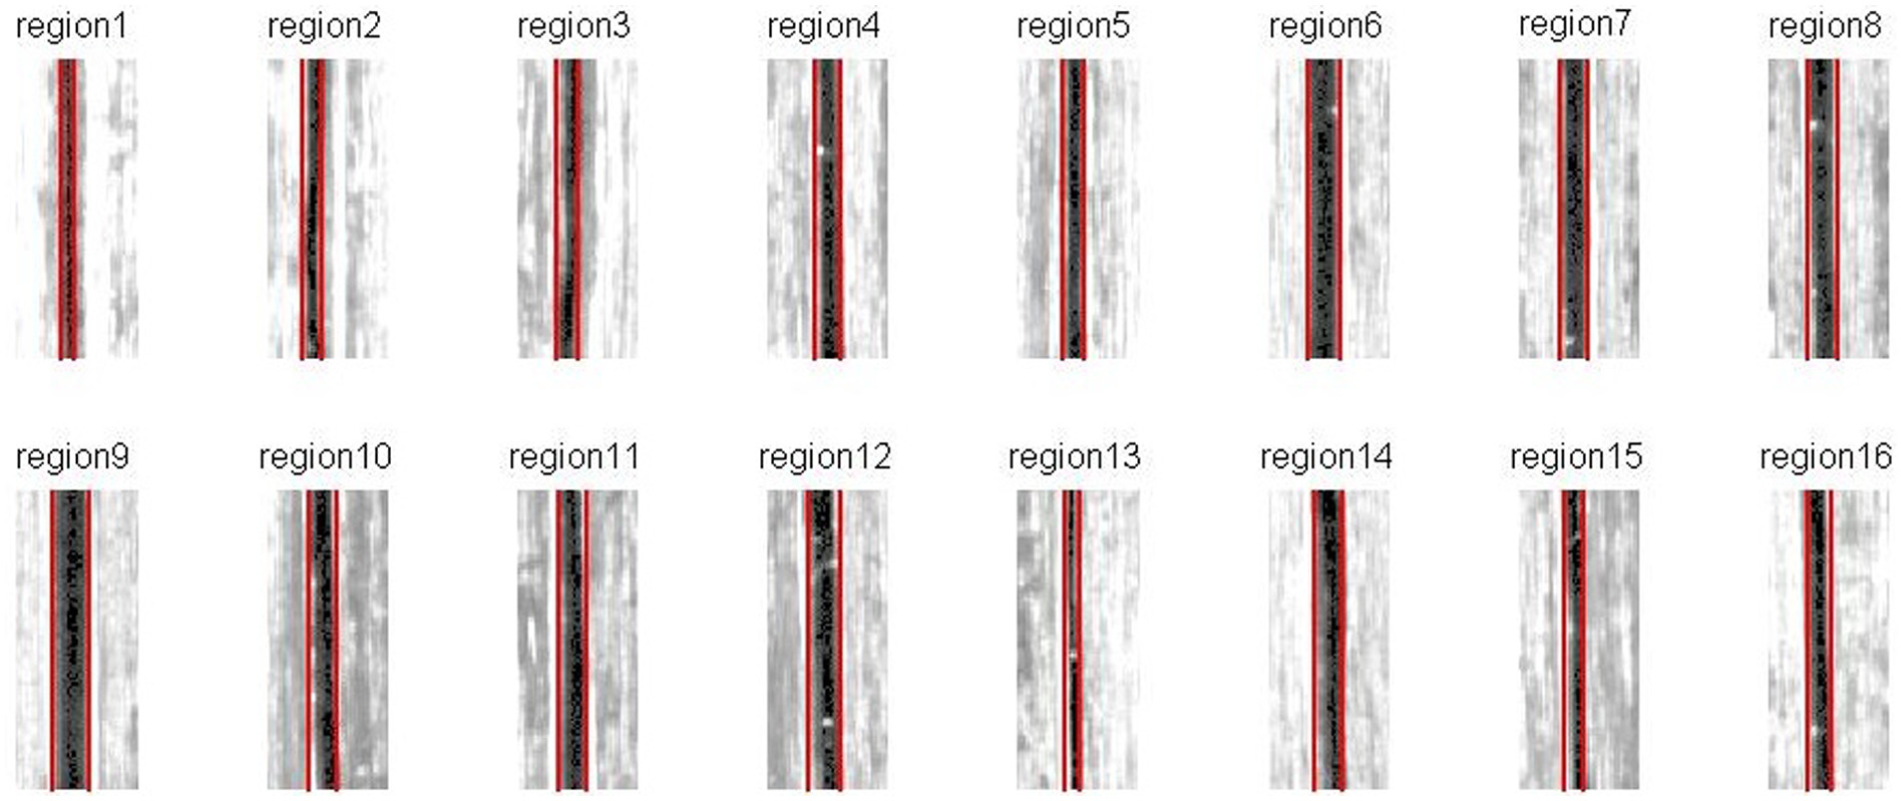
Results of lines fitting. Red lines in this picture represented the positions of the each fibre tow’s edges. And each edge in this image can be found out accurately.
Checking the results of processing
We obtained each gap width using the above digital image processing algorithms. Furthermore, we need to calibrate the measurement system to obtain the real placement accuracy of the fibre tows. During the process of fibre placement, the distance between the lens and fire surface was not determinate because of the core mould where the fibres laid had a certain curvature, and as a result, it was difficult to calibrate each height plane for each cases. Considering that the width of the fibre tows was constant, we used the width of the fibre tows as the scale for calibrating the measurement system. Taking Figure 3(c) as an example, the width of the fibre tow was relatively accurate 6 mm, and the average width of 15 fibre tows in the digital image was about 150 pixels. Each pixel represented 0.04 mm. Thus, we can obtain the true width of every gap.
To test the accuracy of the above digital image processing algorithms, it was necessary to compare the results with those measured using a standard instrument. In this study, we used an optical image measuring instrument to measure the width of the gap. The optical image measuring instrument is a highly efficient, accurate and reliable apparatus. It can effectively and accurately measure the size and angle of the surfaces and contours of complex components. 16 The comparisons of the checking results are shown in Table 1.
Comparisons of the checking results for fibre tow placement accuracy.
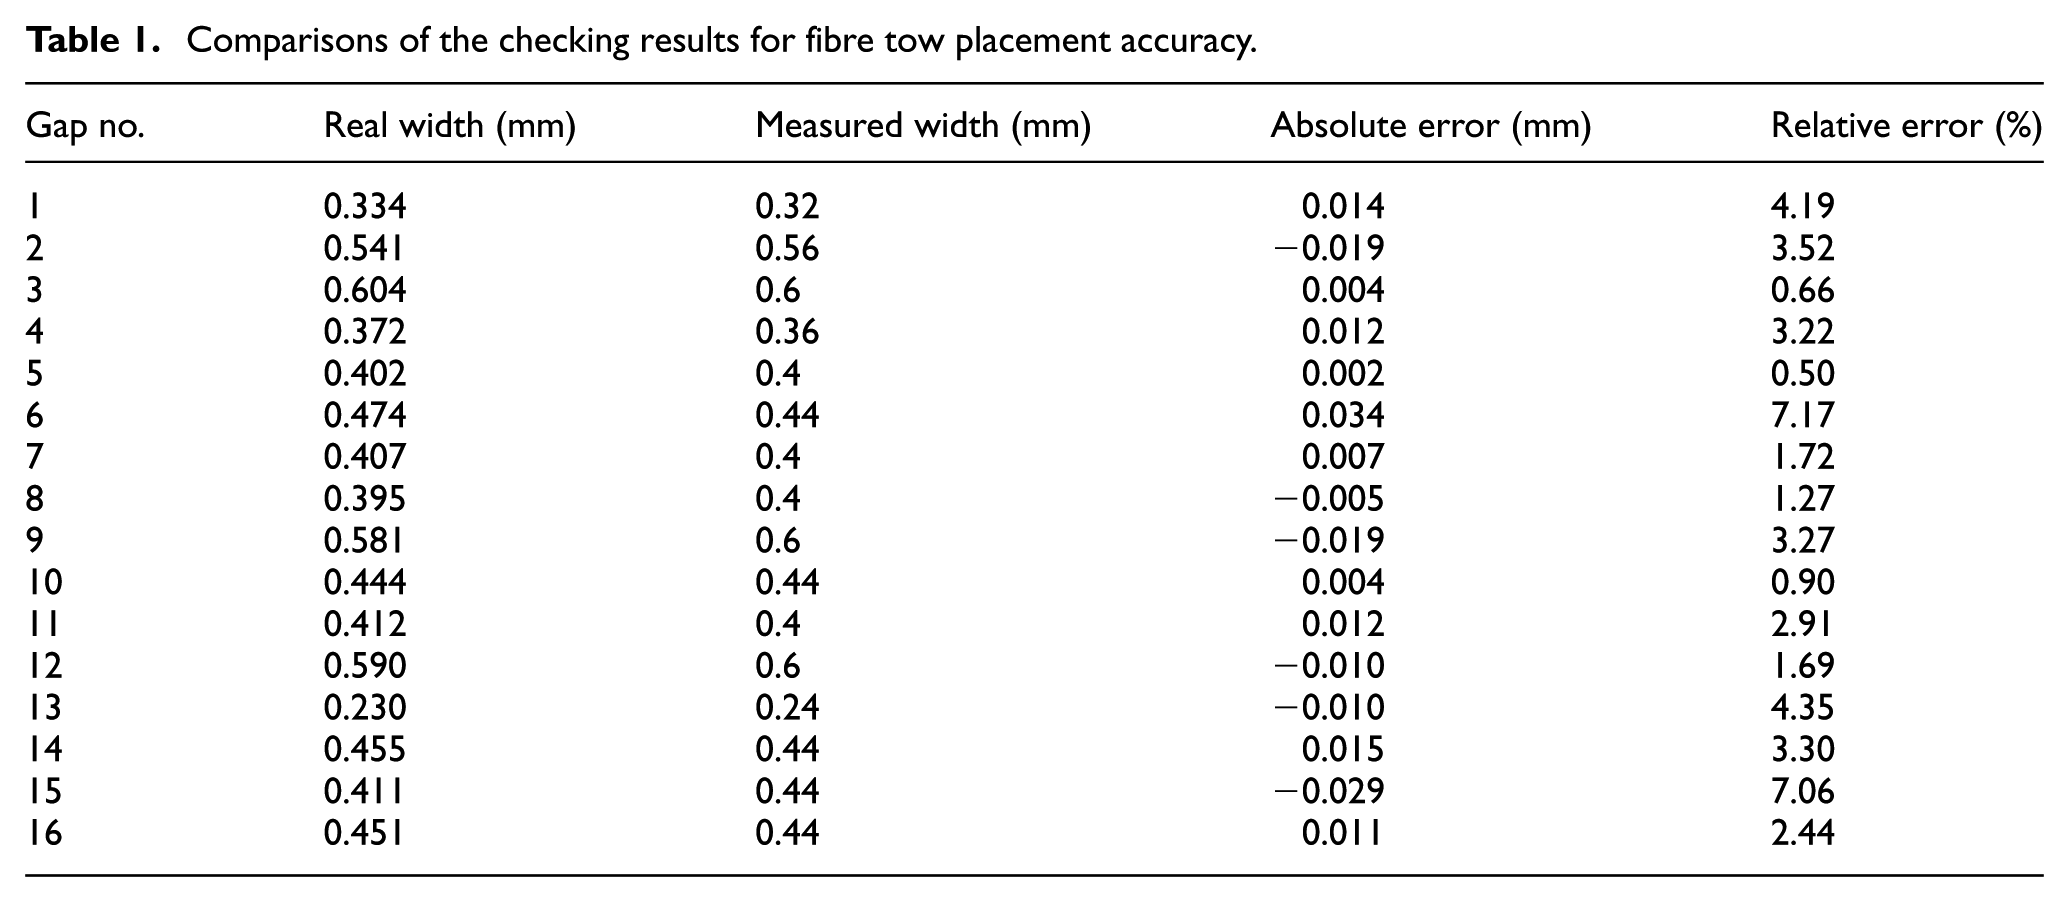
The maximum absolute error was 0.034 mm and the maximum relative error was 7.17%. All the results met the requirements for online detection.
Conclusion
A dedicated detection device was designed which could detect large-scale gaps with multi-angles between the upper and lower fibre tows according to the characteristics of CNC fibre placement machine. We propose a placement accuracy detection method based on computer vision. It mainly consists of image enhancement, extracting the ROI, edge detection, Hough transform and a series of digital image processing algorithms. The experiment shows that this online detection method can rapidly and accurately find the position of fibre tows and acquire their gap widths. The speed and accuracy of the measurements for this method also meet practical engineering requirements.
Footnotes
Declaration of Conflicting Interests
The author(s) declared no potential conflicts of interest with respect to the research, authorship and/or publication of this article.
Funding
The author(s) disclosed receipt of the following financial support for the research, authorship, and/or publication of this article: The authors gratefully acknowledge the financial support for the projects from the High-end CNC machine tools and basic manufacturing equipment National Science and Technology Major Project (2014ZX04001091) and Key Science and Technology Program of Shaanxi Province, China (2014K07-02).