
Abstract
Heavy machine tool work under such high-load conditions that chatter vibrations are prone to occur, which significantly diminishes the machining efficiency and quality. Stability lobe diagrams are commonly used to select appropriate spindle speed and axial depth of cut to get rid of chatter and maximize the material removal rate. However, this needs precise identification of the dynamics of the entire machine tool structure, especially in the low-frequency range. Operational modal analysis has been the proven technique for estimating dynamic characteristics of machine tool structures in operation conditions. In this article, a complete methodology was presented for employing operational modal analysis for heavy machine tool in machining conditions. A random cutting exciting method originally presented by Minis is modified which generates pseudorandom impulse force to excite a heavy vertical lathe structure. And the excitation signal of random cutting force was modeled to analyze the effect of cutting parameters on energy and frequency band of the excitation. One operational modal analysis method, the pLSCF (referred to as PolyMAX) method, was employed to estimate modal parameters during machining. It was also observed in chatter tests that the operational modal analysis results are more accurate than the traditional impact test results in characterizing the dynamics of machine tool structure in machining.
Introduction
High-performance cutting (HPC) 1 is a workpiece roughing technology employed to obtain a high material removal rate. Although there has been a strong movement toward high-speed machining, HPC can also be achieved at low speeds using greater depth of cut, which also contributes to longer tool life. One application of this strategy applies to heavy machine tool, where the speed of moving parts is often limited by their considerable inertia, and the depth of cut can be much greater. Heavy machine tool work under such high-load conditions that chatter vibrations are prone to occur, which significantly diminishes machining efficiency and quality. Stability lobe diagrams are commonly used to select appropriate spindle speed and axial depth of cut to eliminate chatter as well as to maximize the material removal rate. However, precise prediction of the stability lobe diagrams needs precise identification of the dynamics2–4 of the entire machine tool structure, especially in the low-frequency range.
Impact tests are often employed to identify the dynamic characteristics of machine tool with experimental modal analysis (EMA) when the machine is at rest. However, a heavy machine tool is quite difficult to be excited in such tests. Common impact hammers appear too weak to excite all the interested modes of the whole structure, which leads to a low signal-to-noise ratio. Dynamic properties are also expected to change due to the spindle rotation and the changes in machine–tool–workpiece boundary conditions between the rest state and the machining state. 5 Thus, the static results fail to accurately characterize machine tool dynamics during machining. All these limitations inhibit the application of EMA in identifying the dynamic characteristics of heavy machine tool under machining conditions. Minis et al. 6 developed a technique which is realized by interrupted cutting of a surface-modulated workpiece to provide broadband excitation. Tounsi and Otho 7 present a method to identify the dynamics of machine–tool–workpiece system. The excitation is realized by interrupted cutting of a single narrow workpiece width. However, all the cutting forces and the corresponding responses have to be measured to obtain the frequency response function (FRF). This lead to high cost in a factory condition and is even impossible in heavy machine tool because the cutting force may be too high to be measured.
Operational modal analysis (OMA) is a powerful tool for identification of dynamic modal parameters in ambient vibration tests (AVTs) for civil engineering structures. 8 Since the artificial excitation of impact tests is replaced by freely available ambient forces, AVTs are much more practical and economical. Furthermore, as structures are characterized under operating conditions, the obtained results are associated with realistic levels of vibration and not with artificially generated vibrations, as is the case when impact tests are used. 8 Zaghbani and Songmene 9 first developed a complete methodology to apply OMA for machine tool structures under normal milling operations. However, the natural frequencies are quite difficult to be distinguished from the harmonics which consist of power frequency and tooth-passing frequency. Li et al. 10 developed a so-called active excitation method to excite the machine tool structure by itself based on OMA. The method is realized by interrupted cutting of a narrow single tooth while the spindle is rotating randomly. This produces a random impulse-like excitation, which can not only meet the white noise input assumption of OMA within a certain frequency range but also eliminate the effect from the harmonics. Li et al. 11 identified the dynamics of the machine tool at different feed speeds. The method uses the inertia force caused by random running of the worktable to excite the structure. Mao et al. 12 presented a method based on Bin Li’s works to identify the FRF of machine tool structure without measuring any input force. Luo et al. 13 predicted position-dependent structural natural frequencies of machine tool using mass change method. However, these methods are only suitable for machine tool, the actuator of which can move promptly. Because of their huge mass (or inertia), this is often not the case with heavy machine tool. Therefore, an effective random excitation is needed in order to apply OMA in the case of a heavy machine tool structure.
This article presented a modified random cutting excitation method based on the work of Minis et al. 6 and developed a complete methodology for applying OMA for a heavy vertical lathe in machining conditions based on the proposed method. The effect of cutting parameters on the energy and frequency bandwidth of the excitation was analyzed. And the steps to estimate dynamic modal parameters of heavy machine tool structure through OMA are summed up. The feasibility of the excitation technique is discussed through spectral analysis. Then the OMA method was employed to estimate the dynamic modal parameters and the results were compared with impact testing. Finally, the results are further validated by modal assurance criterion (MAC) and chatter tests.
Modified random cutting technique for heavy vertical lathe
Minis et al. 6 developed an improved method based on the work of Opitz and Weck 14 to provide a broadband excitation by interrupted cutting of a workpiece which has a random surface profile. However, the cutting force and the corresponding responses have to be measured in order to identify the modal parameters, which in this case leads to high cost. And because the cutting force is too large, it is probably impossible to be measured when applied to heavy machine tool. Fortunately, Minis’s method can meet the white noise excitation requirement of OMA, and the only information that OMA needs are the responses. This section presents a modified random cutting technique based on Minis’s work, and the power spectral density (PSD) model of the excitation signal above is used to guide the excitation by cutting. Employing the modified excitation technique together with OMA results in a complete methodology for estimating the dynamic modal parameters of a heavy vertical lathe under machining.
Figure 1 shows the schematization of the modified excitation technique suitable for a heavy vertical lathe. The surface of the workpiece is modulated with randomly distributed steps and channels. The tool cuts the steps when the workpiece is rotating and the machine tool structure can be excited by the cutting force. The width of all the channels is the same, and random variable αk (k = 1, 2,…, i) is the angle between adjacent channels, which determines the random characteristics of the cutting force.
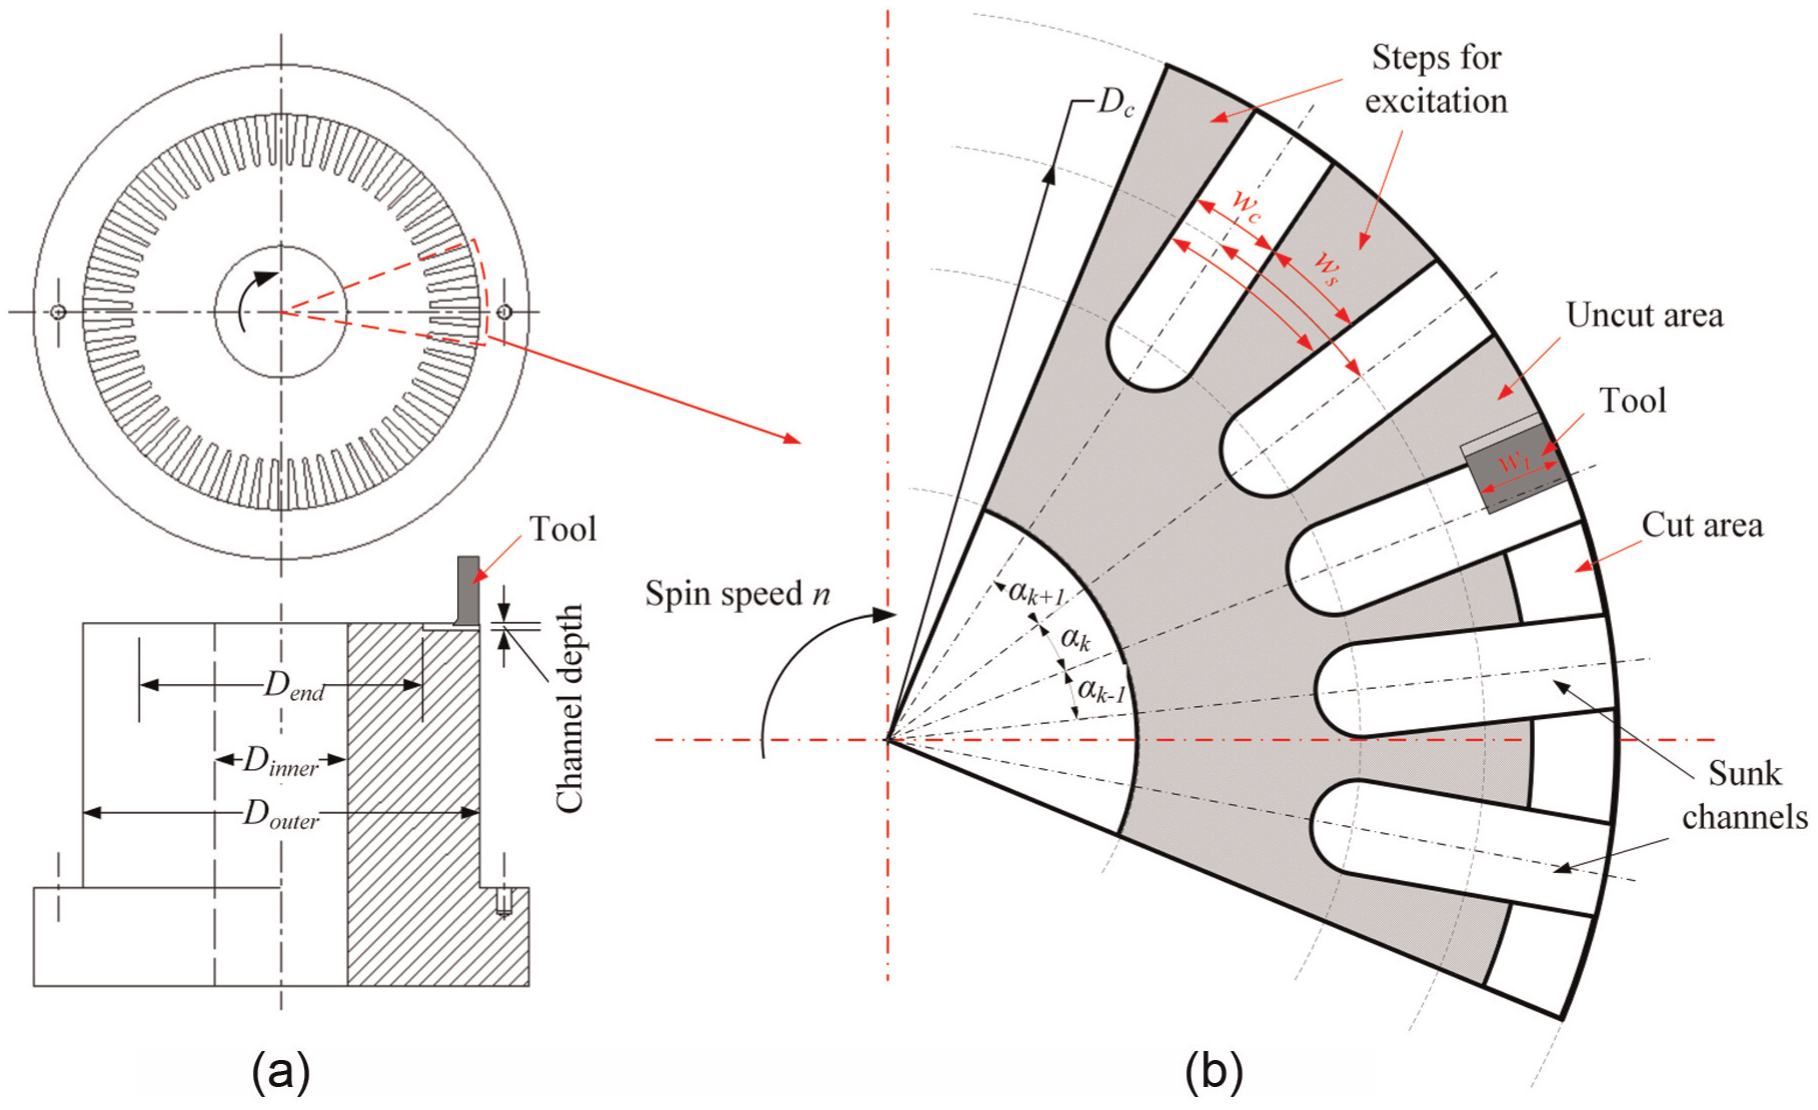
Schematization of random impulse excitation technique suitable for a heavy vertical lathe: (a) workpiece and (b) steps for excitation.
The excitation signal of the cutting process can be modeled as pseudorandom impulse signal f(t) shown only in one cycle in Figure 2
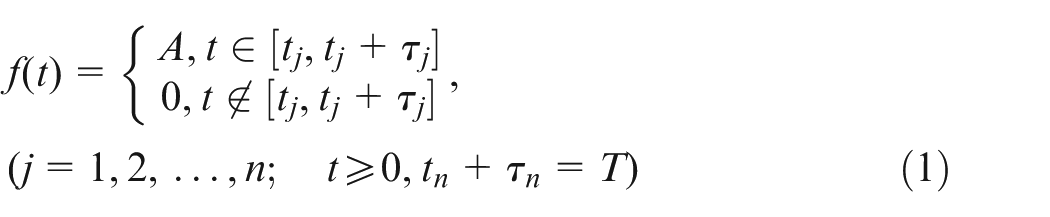
where

tj (tj ≥ 0, j = 1, 2, 3,…, n) is the start moment of the jth impulse, τj (j = 1, 2, 3,…, n) is the duration of time of that impulse, Δt is the duration of time between adjacent impulses and n is the number of excitation impulses included in one cycle T, which is referred to as density ρ. τi is a random variable determining the random characteristics of this signal. The spectrum of f(t) is
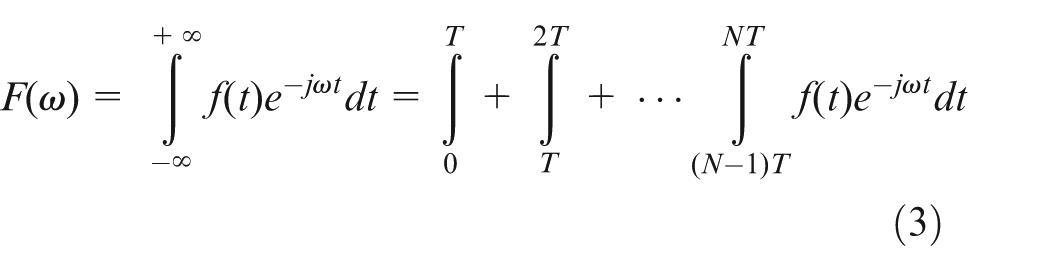
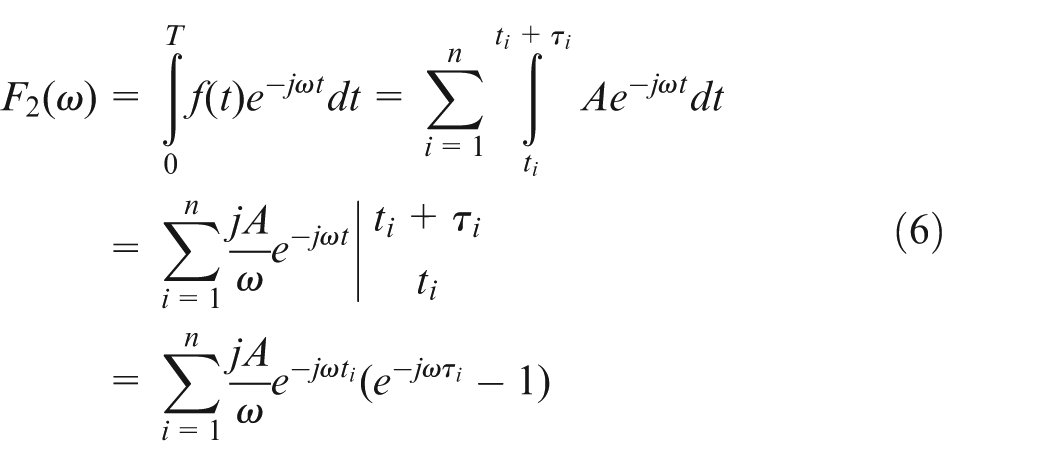
where N(≥1) is the number of total cycles contained within the signal. The last term of the equation (3) can be rewritten as
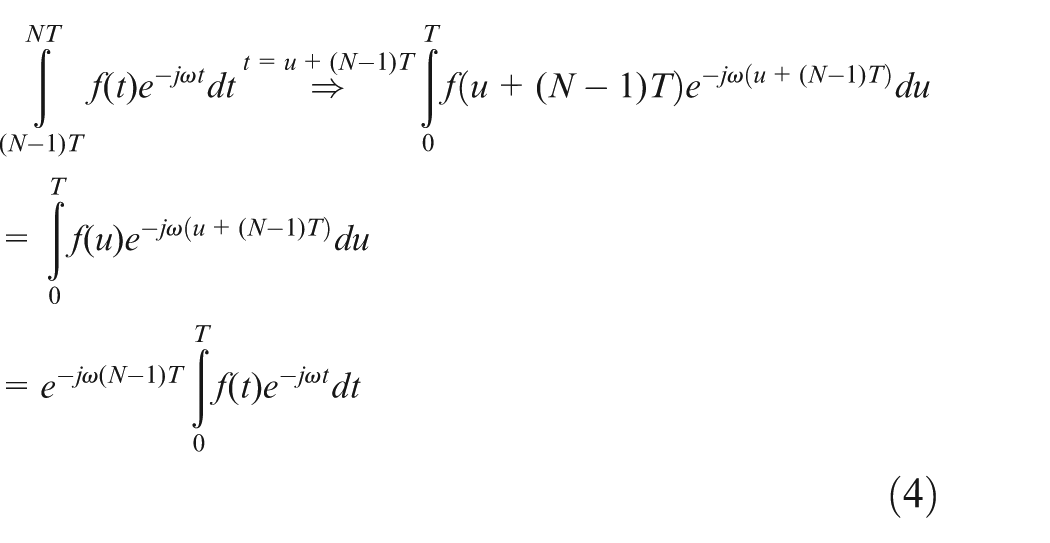
So equation (3) can be obtained as
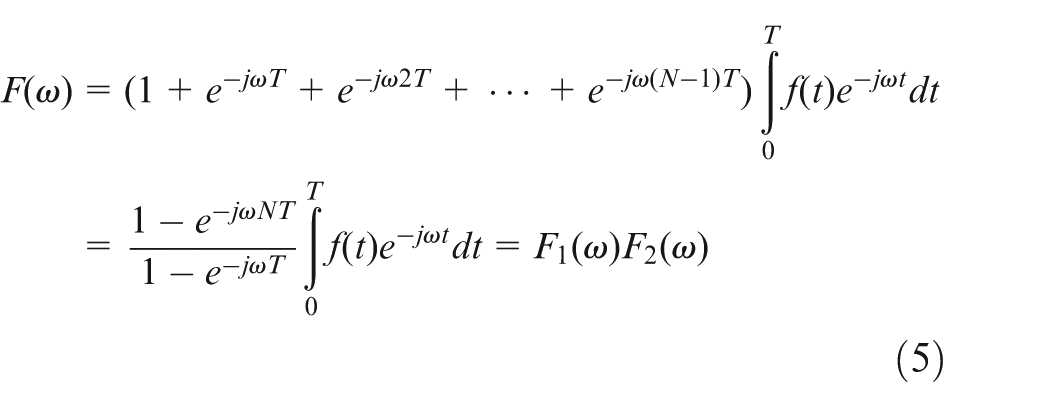
where
According to Euler formula,
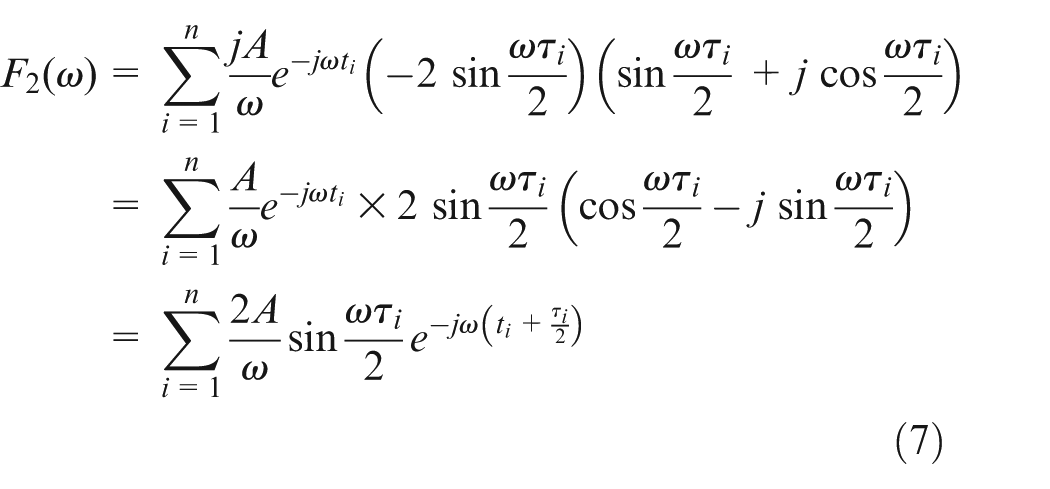
Finally, equation (5) becomes
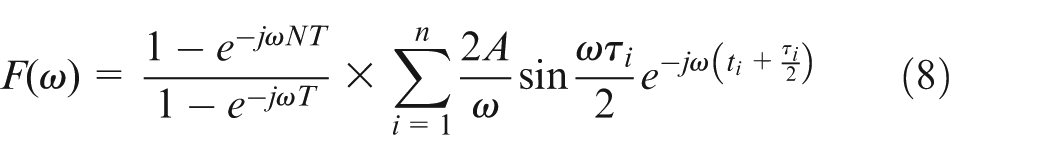
Making
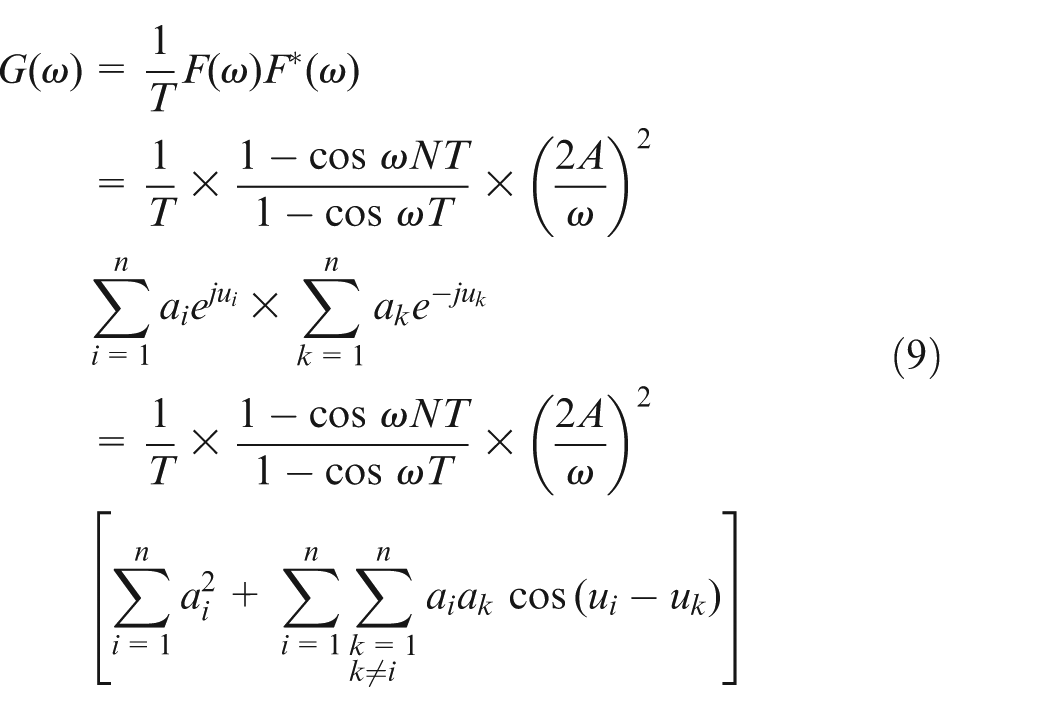
where superscript * denotes the conjugate of a complex number. When signal f(t) contains only one cycle, namely, N = 1, and considering ω = 2πf, equation (9) becomes
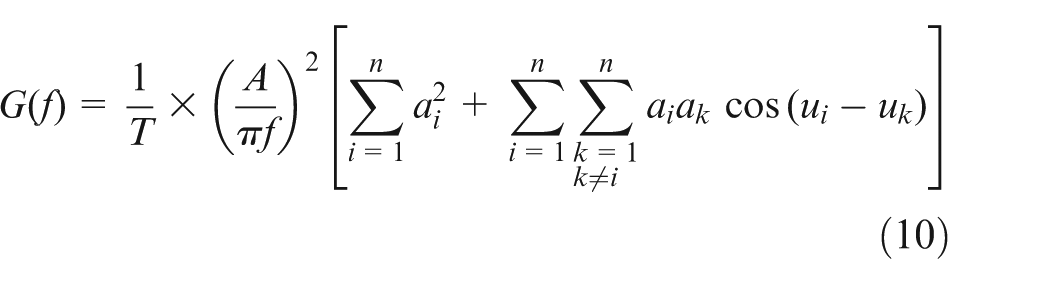
G(f) characterizes the energy (or power), referred to as Ee, at frequency f in the signal itself. It can be seen that G(f) is proportional to the square of impulse amplitude A and almost proportional to the impulse density ρ (the number of impulses n in one cycle). It should be noted that the zeros of ai = sin πfτi are f = k/τi (k = 0, ±1, ±2,…). If τi has Gaussian distribution (mean µ, standard deviation σ), most of its values will fall in the range (µ − 3σ, µ + 3σ). And if µ is far larger than σ, most values of τi are close to µ leading to sin πfτi ≈ sin πfτj ≈ sin πfµ (i ≠ j). So the bandwidth of the first spectral lobe (k = 1) of G(f), referred to as BW1st, is about the inverse of the mean µ
The cutting force amplitude A is assumed to be proportional to the shear area (referred to as As). In this case

where ad is the depth of cut, ws is the width of the steps and af is the radial feed per revolution. The cutting speed v (mm/s) is
where n (r/min) is the revolution speed and
where
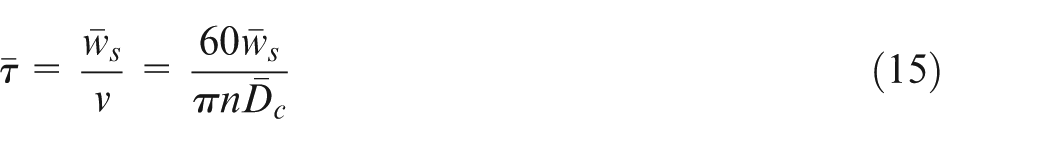
The first lobe BW1st of the excitation is
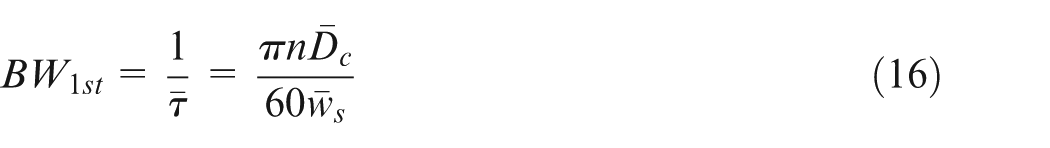
As previously stated, 6 the BW1st/2 is assumed to be the upper limit fh of the effective excitation frequency range
And the lower limit
Thus, the effective excitation bandwidth is
Signal model of the cutting force excitation.
Table 1 summarizes the relationships between the Ee and BW1st of excitation and the cutting parameters.
Relationships between the Ee and BW1st of excitation and cutting parameters.
∝ denotes proportional relationship and ∝− denotes inverse relationship.
The whole procedure to employ the modified excitation method with OMA for heavy vertical lathe is as follows:
Preparation: choose a workpiece according to the machine considered. Measure
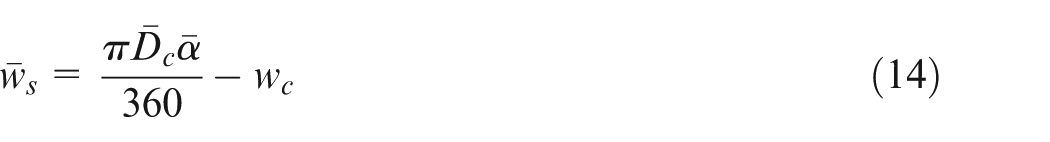
Design the workpiece: calculate the average width
Mill the channels according to the parameters obtained in Step 2. The depth and length of these channels should be chosen according to the actual needs.
Excite the machine tool structure by cutting the surface of the workpiece and collect the vibration responses at the measuring points.
Calculate PSD matrices and investigate the dynamic parameters of the machine tool structure by OMA algorithms.
Structure identification under cutting
Structure excitation with random cutting force
The presented random excitation method was applied on the heavy vertical lathe C5250E shown in Figure 3(a) from Wuhan Heavy Machine-Tool Group Co., Ltd (WuChong), and the corresponding responses were collected to perform OMA. The machine tool structure is designed with a removable tool holder, a separate rotating worktable, two support columns, a fixed beam and a slide beam carrying the tool holder and its geometry model is shown in Figure 3(b). The principal movement is the worktable rotation, and the feed movement is performed by the slide beam moving along the z-axis with the tool holder moving along the x-axis. The total mass of C5250E is about 100 ton, the maximum power of the main motor is 55 kW and the speed range of the worktable is 0.4–40 r/min.
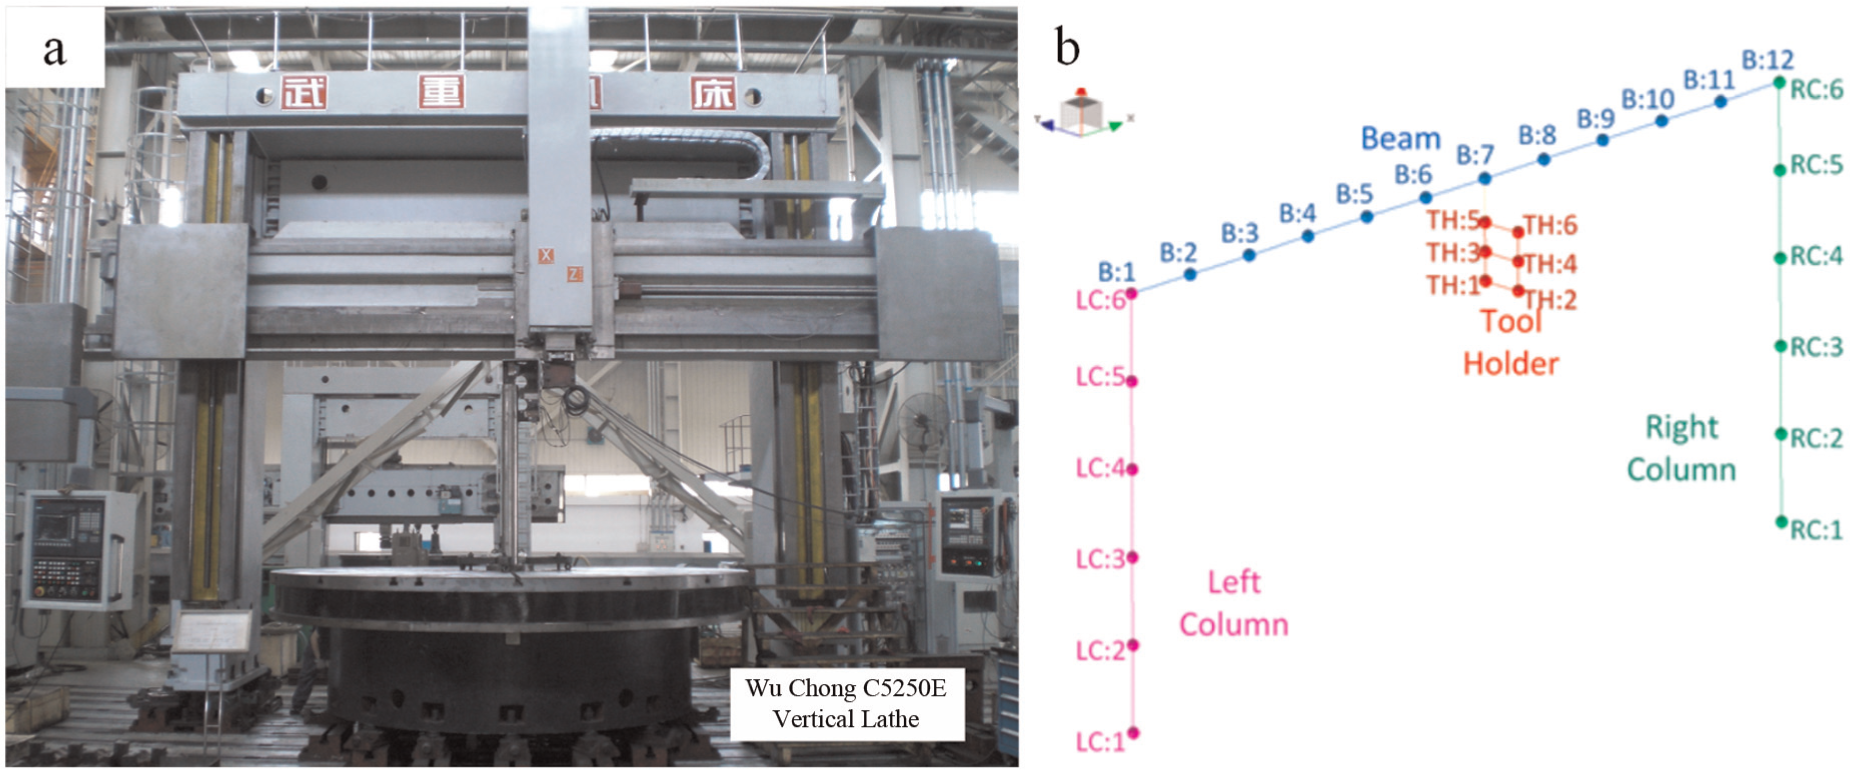
Vertical lathe C5250E used in test and its geometry model.
A cast iron hollow cylinder (inner diameter Din was 200 mm, outer diameter Dout was 600 mm, height h was 1000 mm) was employed to serve as a standard workpiece for checking the performance of the heavy vertical lathe by the factory. The surface of the workpiece was designed and manufactured as shown in Figure 1. Six parameters including the rotation speed n (r/min), the feed f (mm/rev), the axial depth ad, the diameter of the workpiece Dc, the width of channels wc and the angle αk between adjacent channels have to be chosen carefully.
An end milling tool with a diameter of 16 mm was chosen to machine the channels for convenience, so wc was 16 mm. Dc was chosen to vary from 400 to 600 mm, so
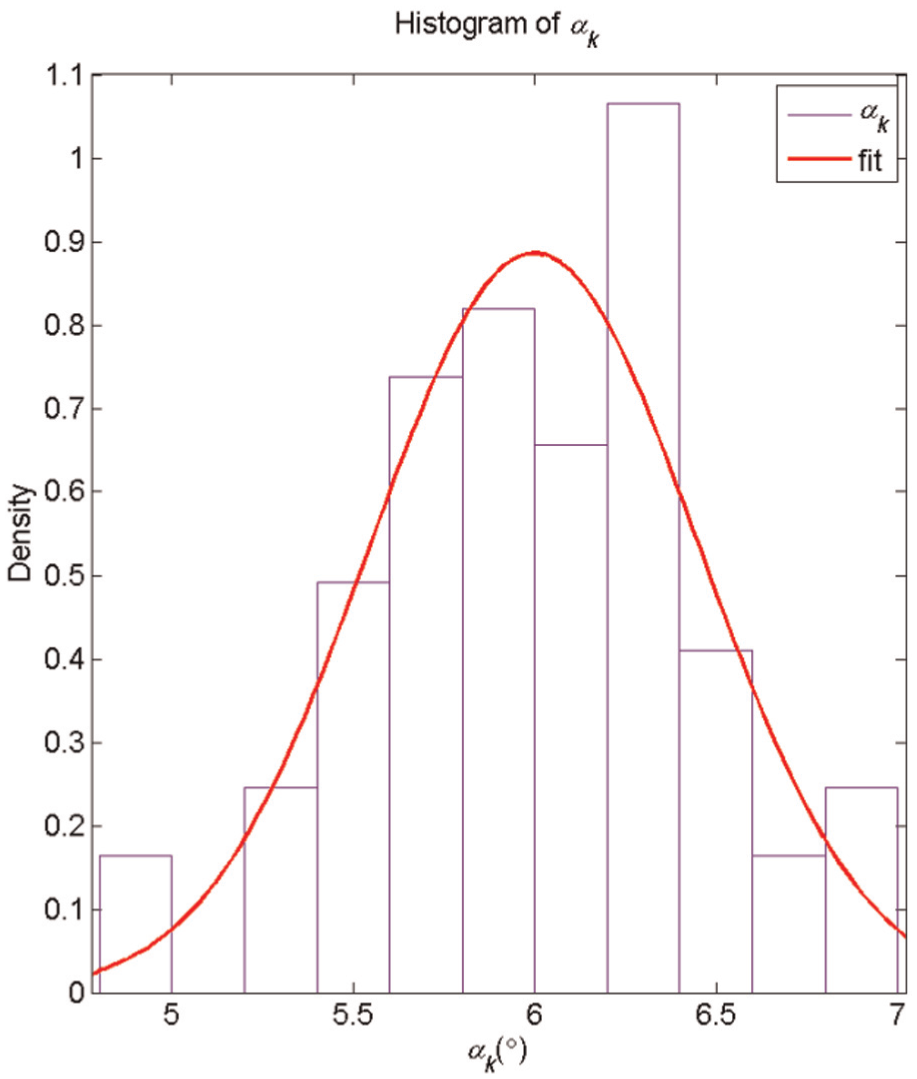
Sixty values of αk having a Gaussian distribution over [5°, 7°] generated by MATLAB.
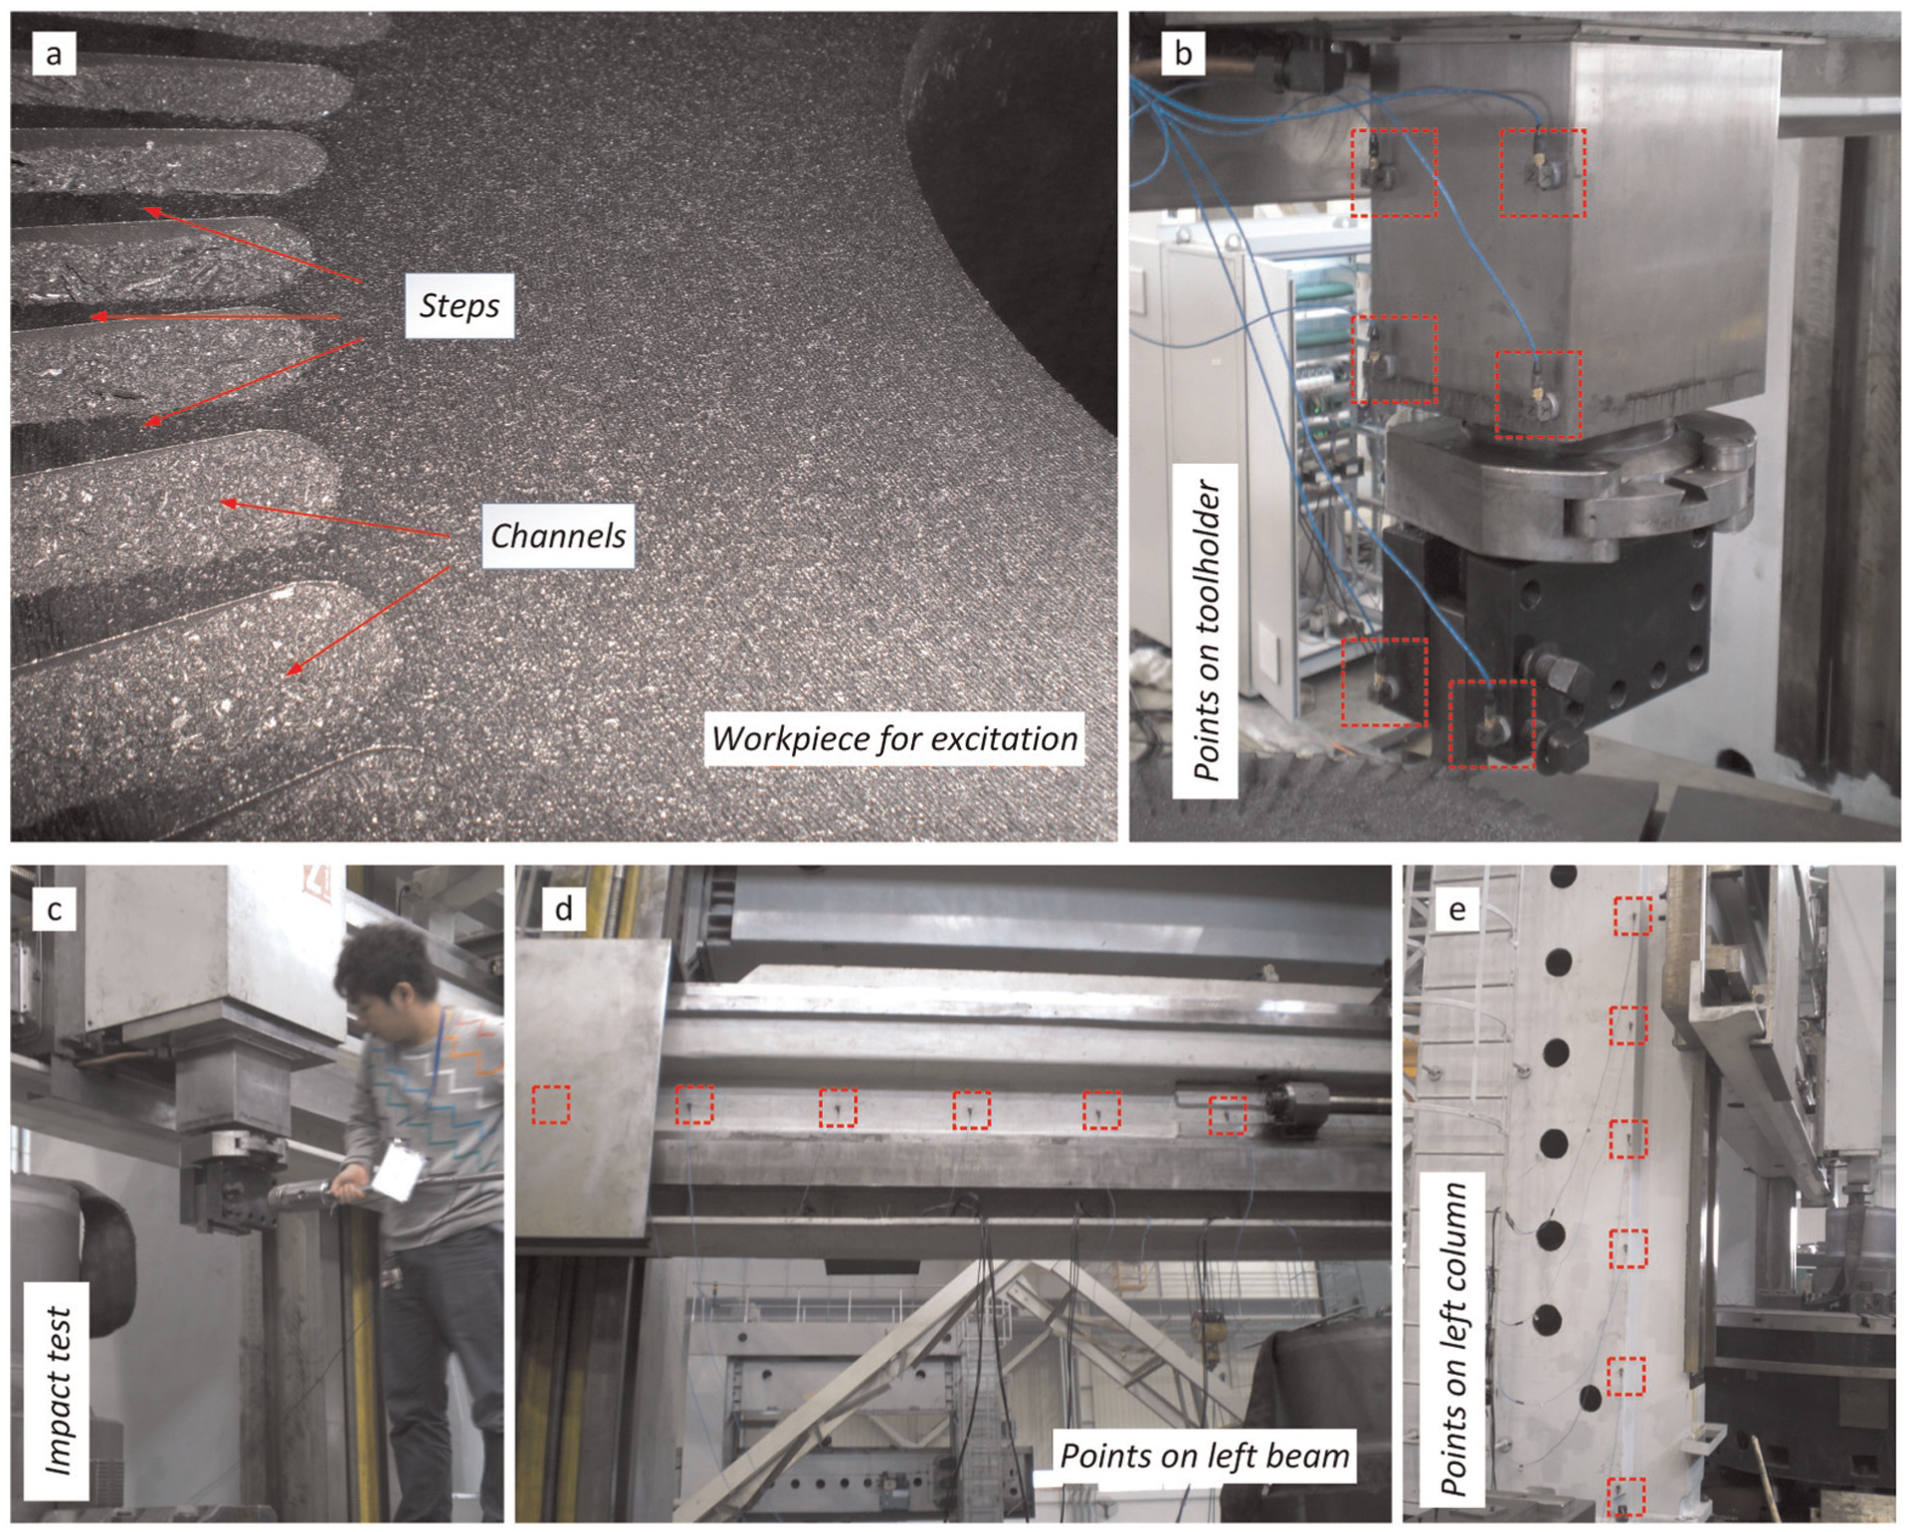
(a) Workpiece for excitation, (b) acceleration measuring points on tool holder, (c) tap point of impact test, (d) measuring points on the left beam and (e) measuring points on the left column.
Experimental setup
As Figure 5 shows, every red rectangle locates a measuring point, and the total number of measuring points is 30. The distance between adjacent points is 0.6 m on the column, 0.55 m on the beam and 0.15 m on the tool holder. Three cases of tests were conducted: first, the specially designed surface was cut to excite the machine tool; second, the inner smooth surface was cut in normal turning processes; finally, after all the cutting tests were done, an impact test employing a powerful customized hammer was conducted. The point TH:2 on the tool holder and point RC:6 on the right column were impacted in the x- and y-directions, respectively. Table 2 summarizes all the tests.
Cutting experiment parameters.
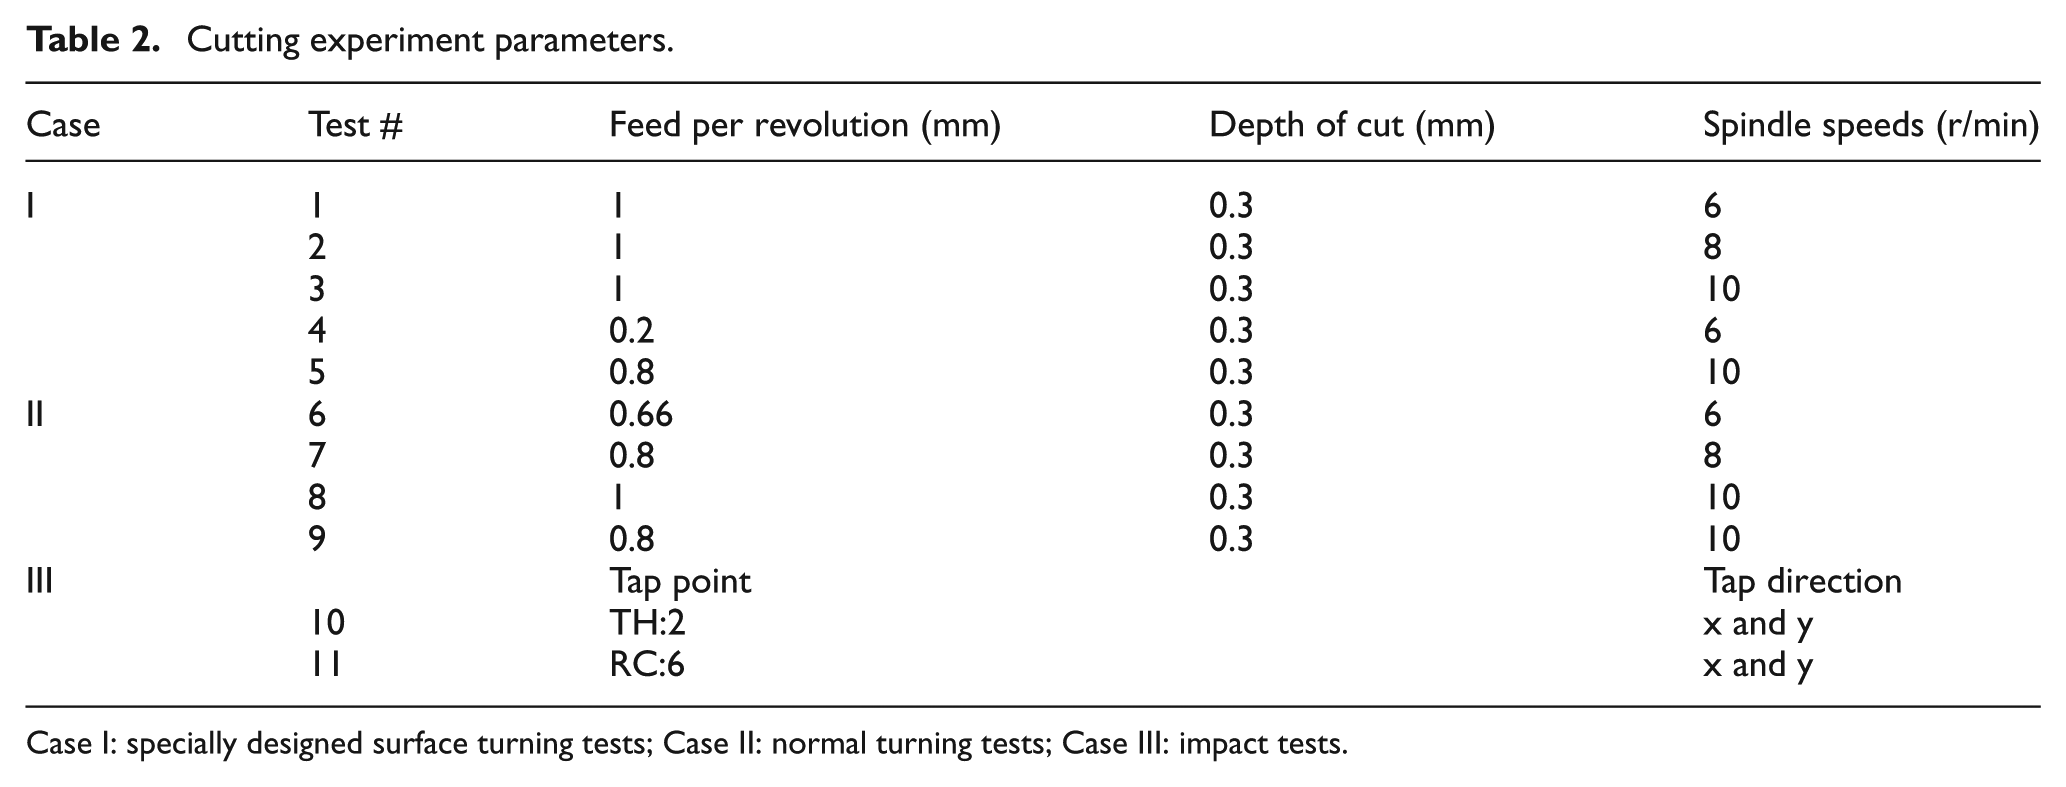
Case I: specially designed surface turning tests; Case II: normal turning tests; Case III: impact tests.
All the signals can be collected simultaneously by the vibration acquisition system, LMS SCADAS Mobile SCM05, and seven three-axis acceleration sensors of type PCB 356A15 (measurement range: ±50 g; frequency range (±5%): 2–5000 Hz; resonant frequency: ≥25 kHz) were mounted every time to measure the acceleration responses of the structure. Cutting force is not necessary and is also too difficult to measure. Each test was repeated five times in order to finish all the points, and all the acceleration signals lasted 200 s each time. The sampling rate of all tests was 1024 Hz. Tests #3, #8 and #10 were used for extracting the modal parameters.
Results and discussion
Spectral analysis
Because the cutting force is not available in cutting tests, the responses are the only information to verify the effectiveness of the excitation technique. The modes in the x- and y-directions are dominant according to the structure presentation, so the responses of these two directions were chosen to be analyzed here while responses in all three directions were used to extract the dynamics. The modified averaged periodogram method 15 was employed to identify the PSD with an overlap of 50%, a Hanning weighting function and 50 as the number of averages. This ensures that all data are equally weighted in the averaging process, minimizing leakage and picket fence effects.
Figure 6 shows the PSD comparison of responses at typical points TH:2, LC:3 and B:6 of test #3 with test #10 in the x- and y-directions. It can be noted that the PSDs of the responses under the random cutting excitation have a similar trend with the ones of the tap test. The former PSDs are much higher (10 dB in general) than the latter within the bandwidth of 0–75 Hz which match quite well with the maximum effective excitation range of 0.8–72.7 Hz. Also, there are three peaks corresponding to the three modes within the range of 0–20 Hz and the results of cutting tests present clearer peaks. The first two close modes at about 8 and 9 Hz appear in both directions of PSDs under random cutting test #3. However, in the case of tap test #10, one peak (the peak at about 8 Hz) appeared only in the x-direction and the other (the peak at about 9 Hz) appeared only in the y-direction. This can be explained by the assumption that the first two modes vibrate “between the x- and y-directions” and the resulting cutting force can excite the structure in all three directions at the same time while the tap test can only excite the structure in one direction each time. This assumption can be validated by modal shapes analysis later. Thus, the proposed random cutting technique behaves more effectively and efficiently than conventional tap excitation.
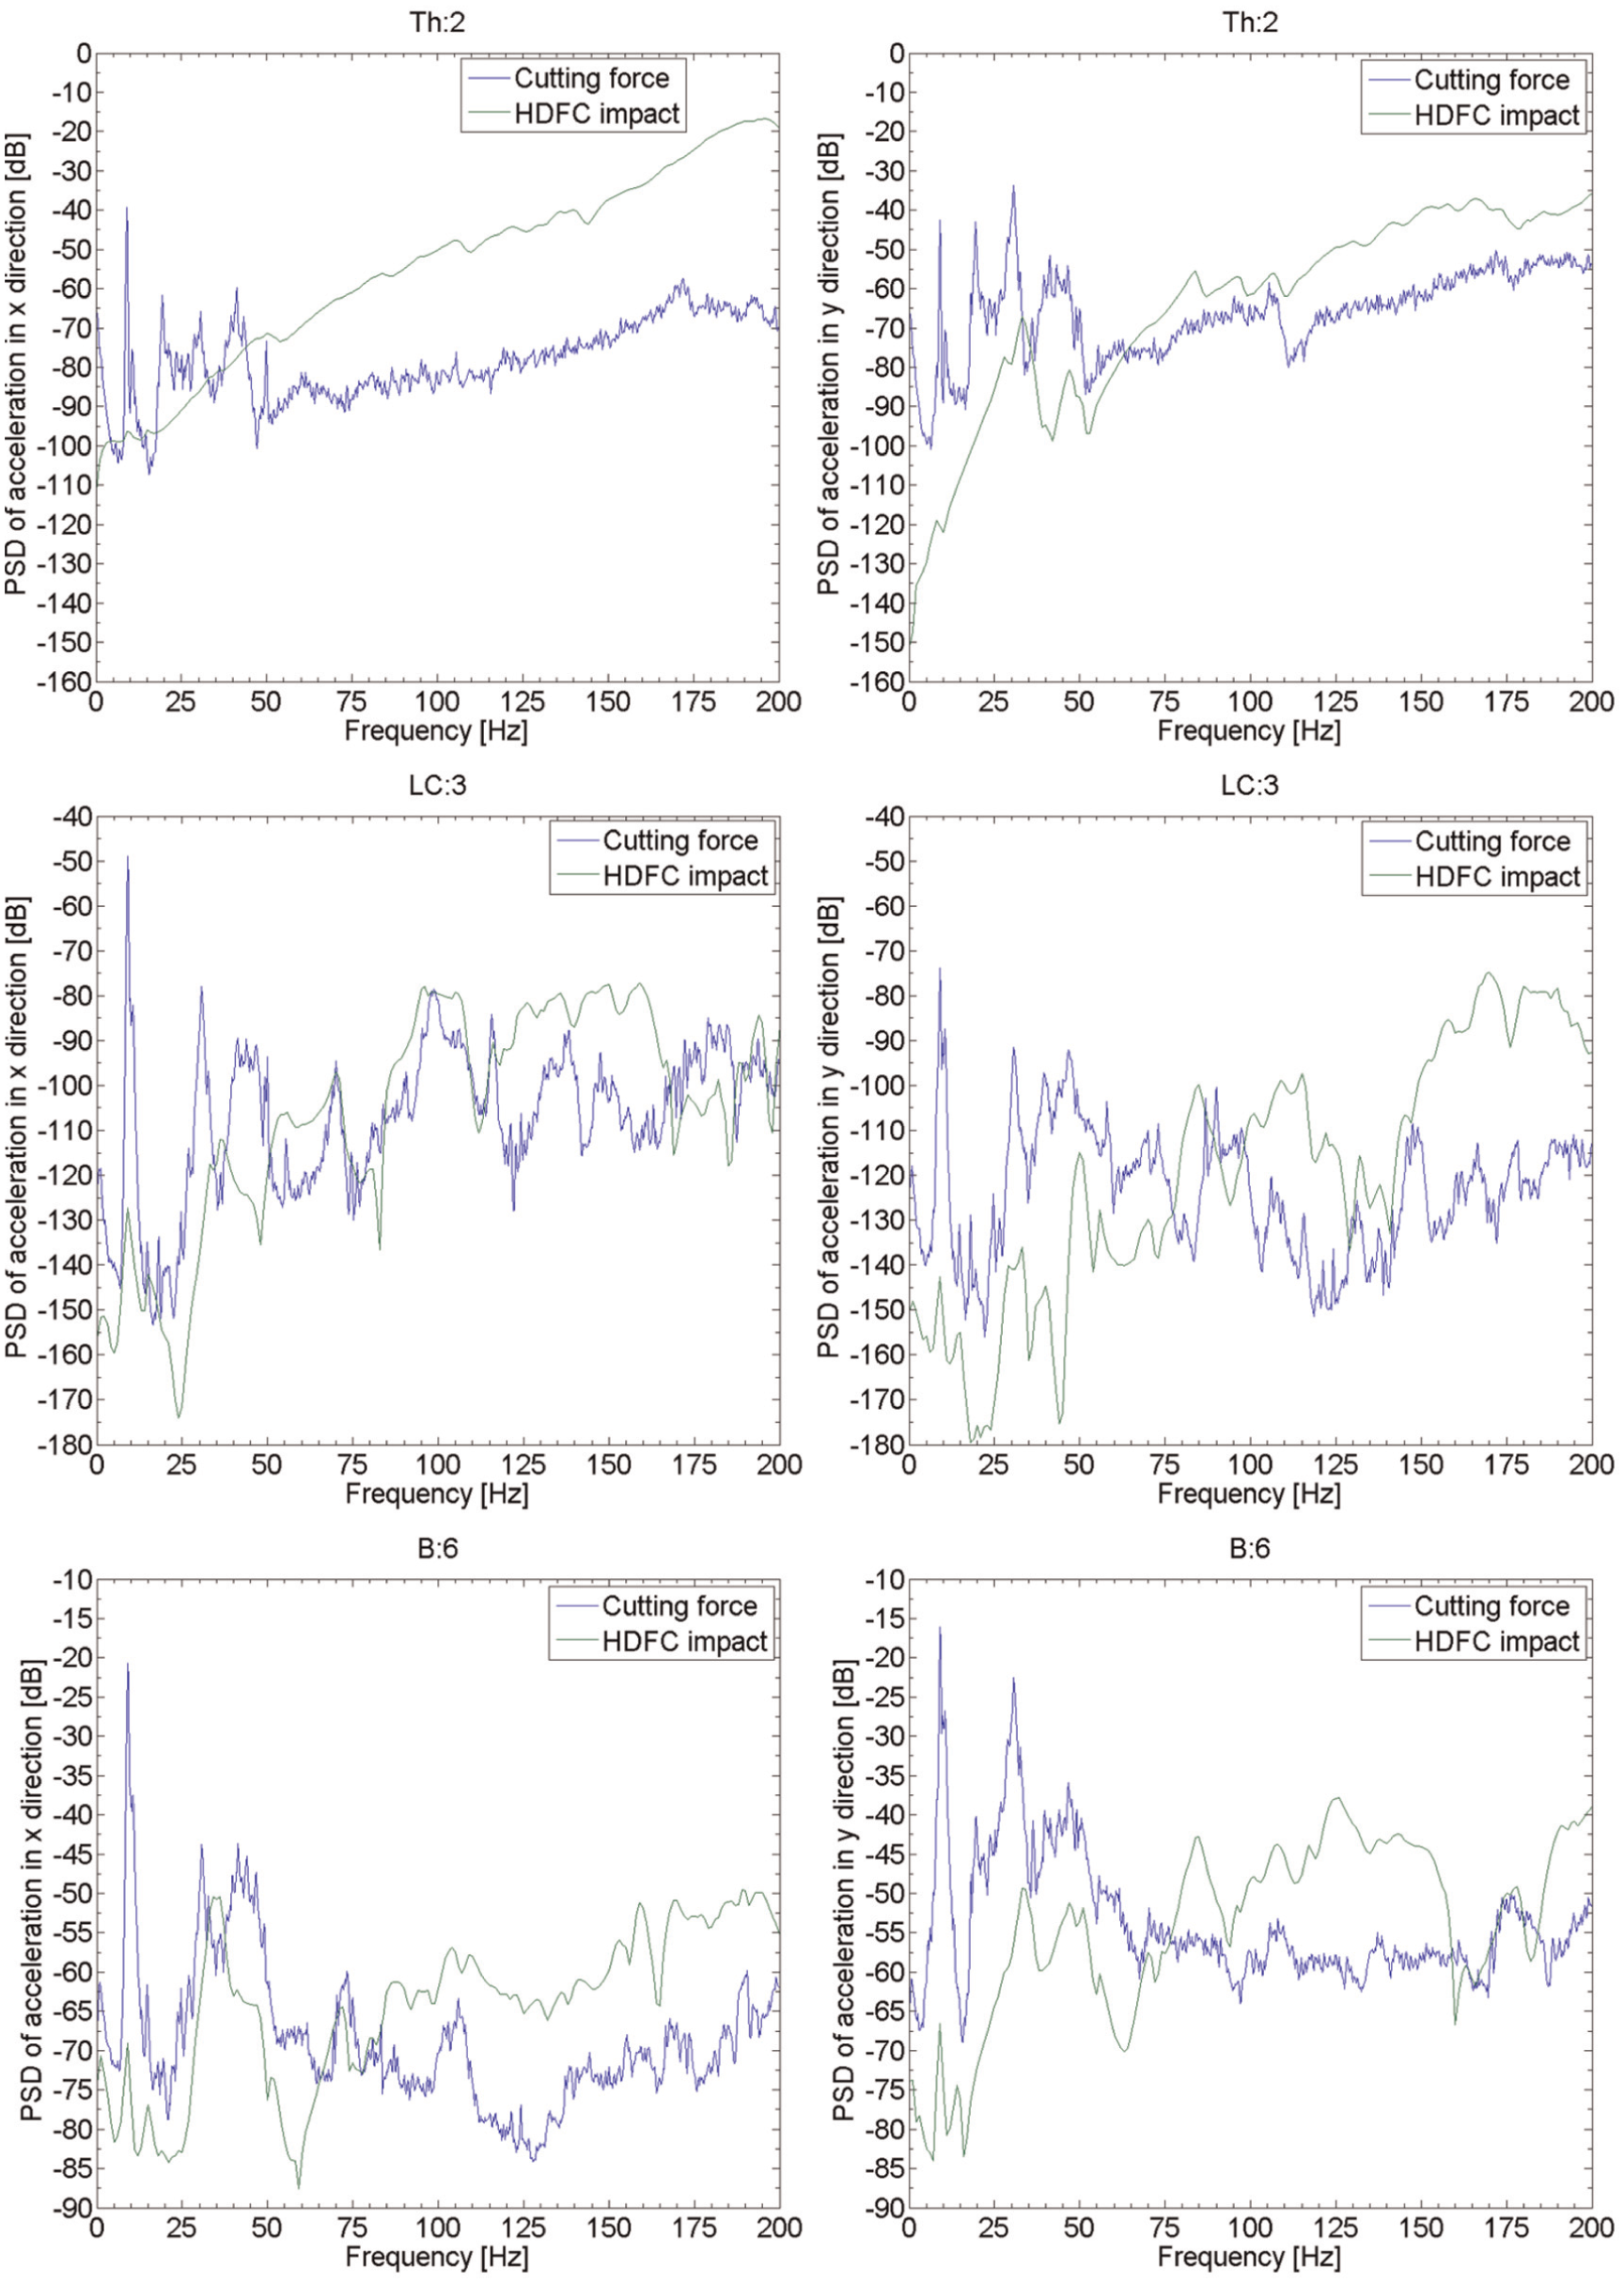
PSD of responses of TH:2, LC:3 and B:6 under different excitations.
Identification of the dynamics with OMA method
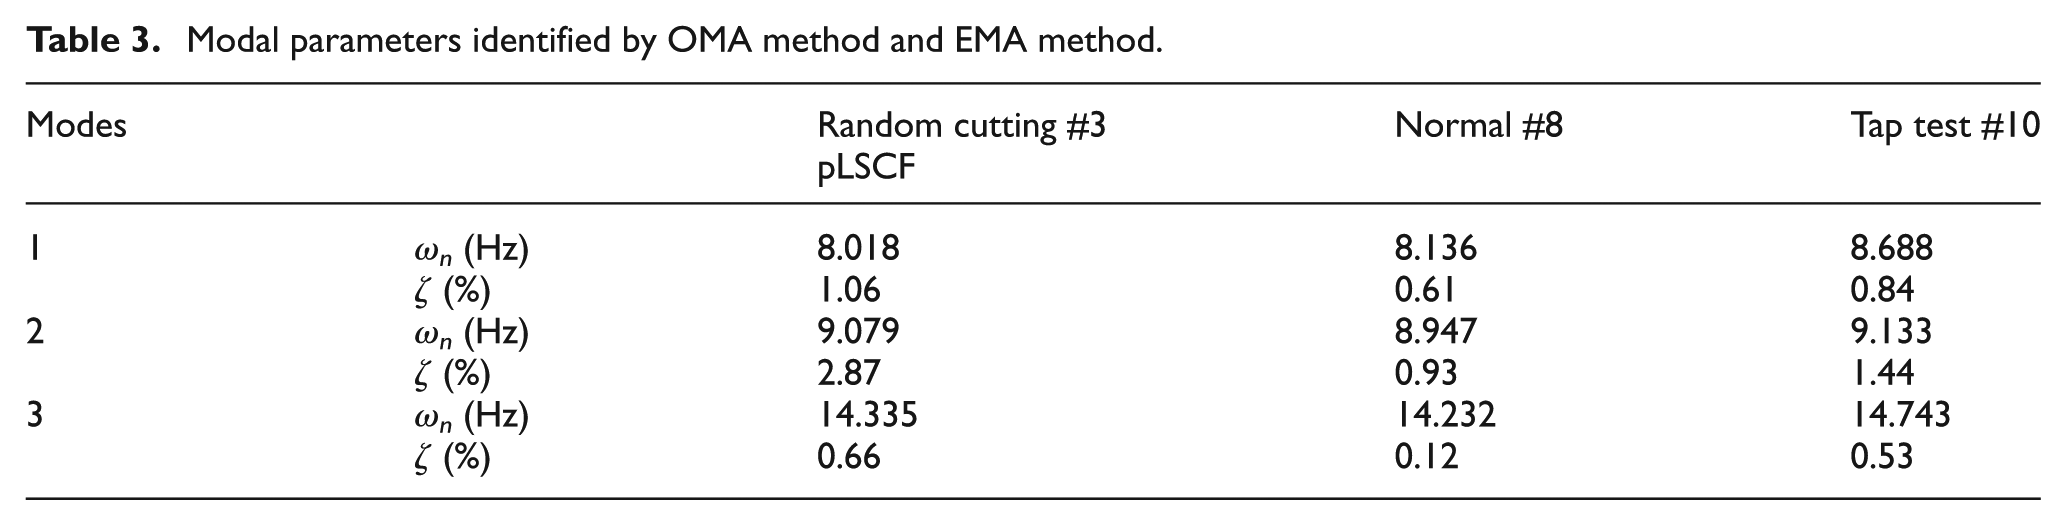
As Figure 7 shows, three modes are dominant within the frequency range of interest 0–20 Hz and are excited well. The three modes were first estimated during conventional tap test (test #10). Then all the response signals of 30 measuring points during random cutting (test #3) were used to calculate the averaged PSD for OMA. The OMA method, the operational version of pLSCF (referred to as Op.PolyMAX),16–18 was employed to identify the dynamic modal parameters of the machine tool structure, namely, the natural frequencies and the damping ratios. Finally, the modal parameters were estimated in the normal machining test (test #8) as a reference. Table 3 summarizes all the results. It can be seen that the natural frequencies of the proposed random cutting test #3 are quite similar to the results of normal cutting condition #8. The relative variation (ωcutting/ωnormal) lies between 0.72% (mode 3) and 1.48% (mode 2). In contrast, the results of tap test #10 present much more variations (ωtap/ωnormal) between 2.08% (mode 2) and 6.8% (mode 1). When it comes to damping, however, the results of both the random cutting test and the tap test do not match well with the normal cutting test. Because of the spindle rotation and the changes in machine–tool–workpiece boundary conditions between the rest state and the machining state, it should be noted that the damping ratios of the tap test are quite different from the results of cutting test. And the results of random cutting test #3 are quite different from the normal cutting results in test #8 due to the regenerative effect in normal cutting. 19 The results indicate that the estimated dynamic modal parameters from the proposed random cutting method are quite similar to the dynamics under normal cutting and vary from the results of static impact tests.
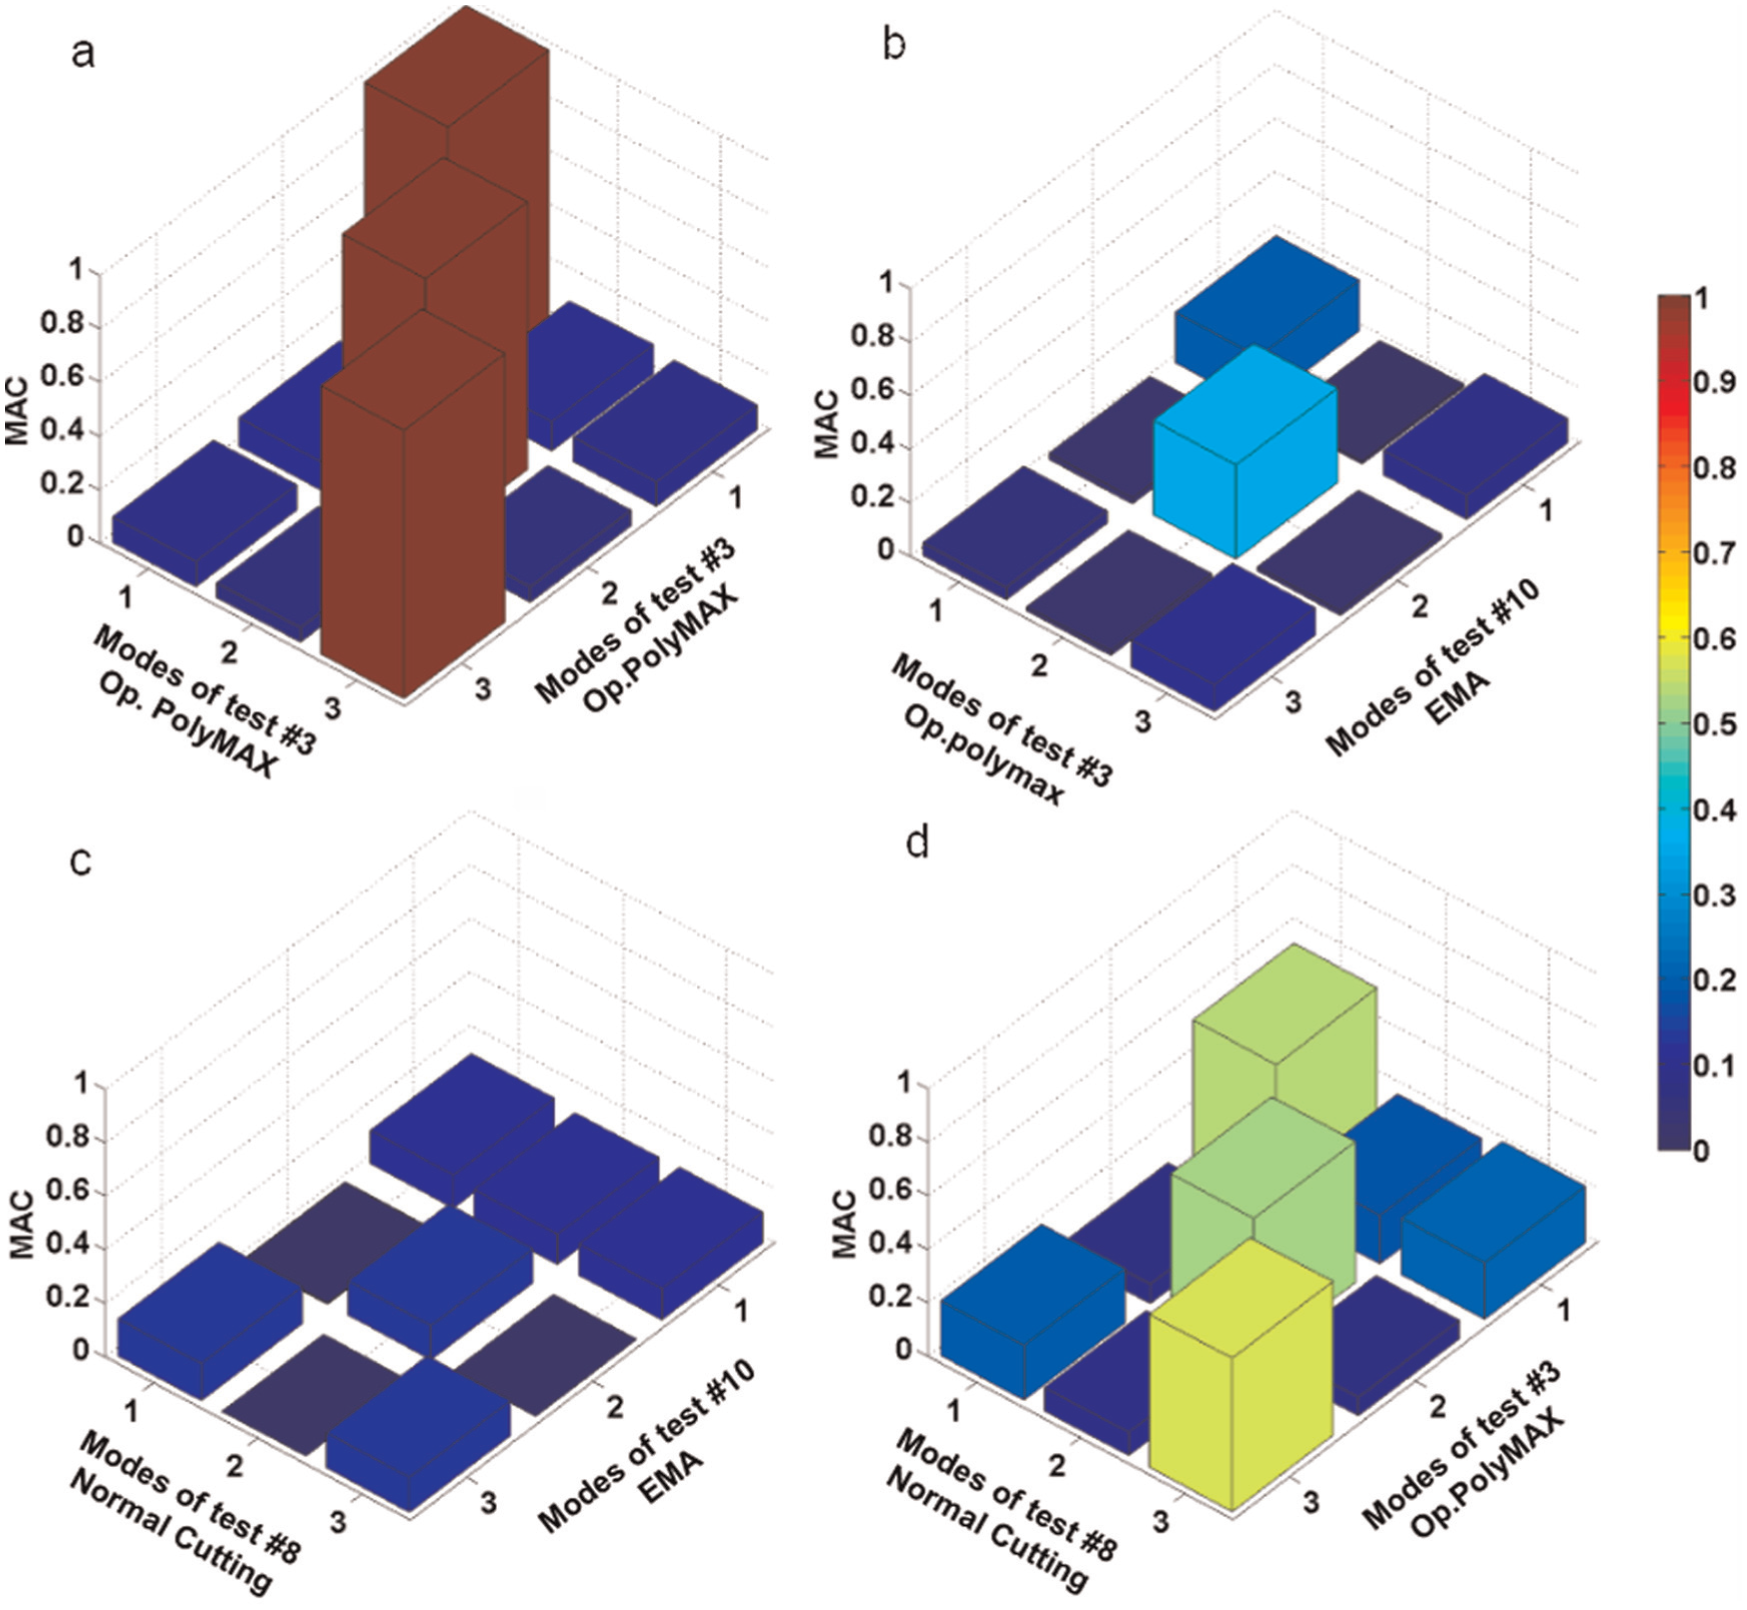
MAC of mode shapes identified by different methods in Table 3: (a) auto MAC of unscaled mode shapes by Op.PolyMAX, (b) MAC of shapes by random cutting test versus tap test, (c) MAC of shapes by normal cutting test versus tap test and (d) MAC of shapes by normal cutting test versus random cutting test.
Modal parameters identified by OMA method and EMA method.
The MAC 20 is used to evaluate the quality of the mode shapes which assesses the coherence between two mode shape vectors (referred to as Ψr and Ψs)
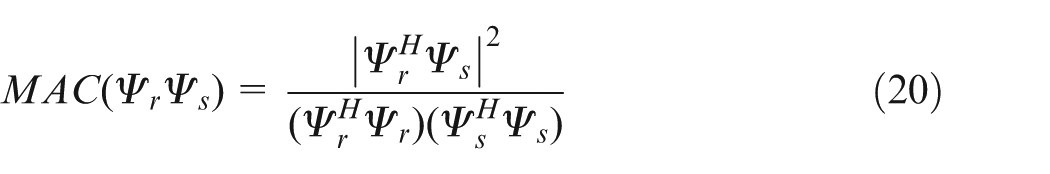
Figure 7 shows the MAC evaluation of the mode shapes of different methods and tests. The unscaled mode shapes of test #3 are pretty well (as Figure 7(a) shows). Figure 7(b) indicates that the mode shapes under random cutting operations are rather different from the shapes of tap tests. Also, Figure 7(c) and (d) shows clearly that the shapes of random cutting operations are far more similar to normal cutting conditions than the shapes under static tap tests.
Chatter test verification
After the concave–convex surface was machined, the standard workpiece was used for routine tests of machining performance check by the factory. It was recorded that when the axial depth increased to 0.5 mm, both rotation speeds of 6 and 8 r/min resulted in chatter. Figure 8 shows the trace of chatter mark. The chatting frequency is 8.60 and 8.67 Hz which the chatting trace is 86 in 6rmp and 65 in 8rpm., respectively. According to regenerative chatter theory, 21 the dynamic cutting force excites the structure whose dominant mode is very close to the chatter frequency and causes the chatter. Because the equivalent stiffness of cutting process adds a little to the stiffness of the whole cutting system, the chatter frequency is always a little higher than the natural frequency of related mode (first mode in this case). However, the results of the static impact test totally miss the regulation while the results of the proposed method fit the regulation quite well. It indicates that the results of the proposed method can represent the characteristics of the machine tool structure during machining operations much more accurately than static impact tests.
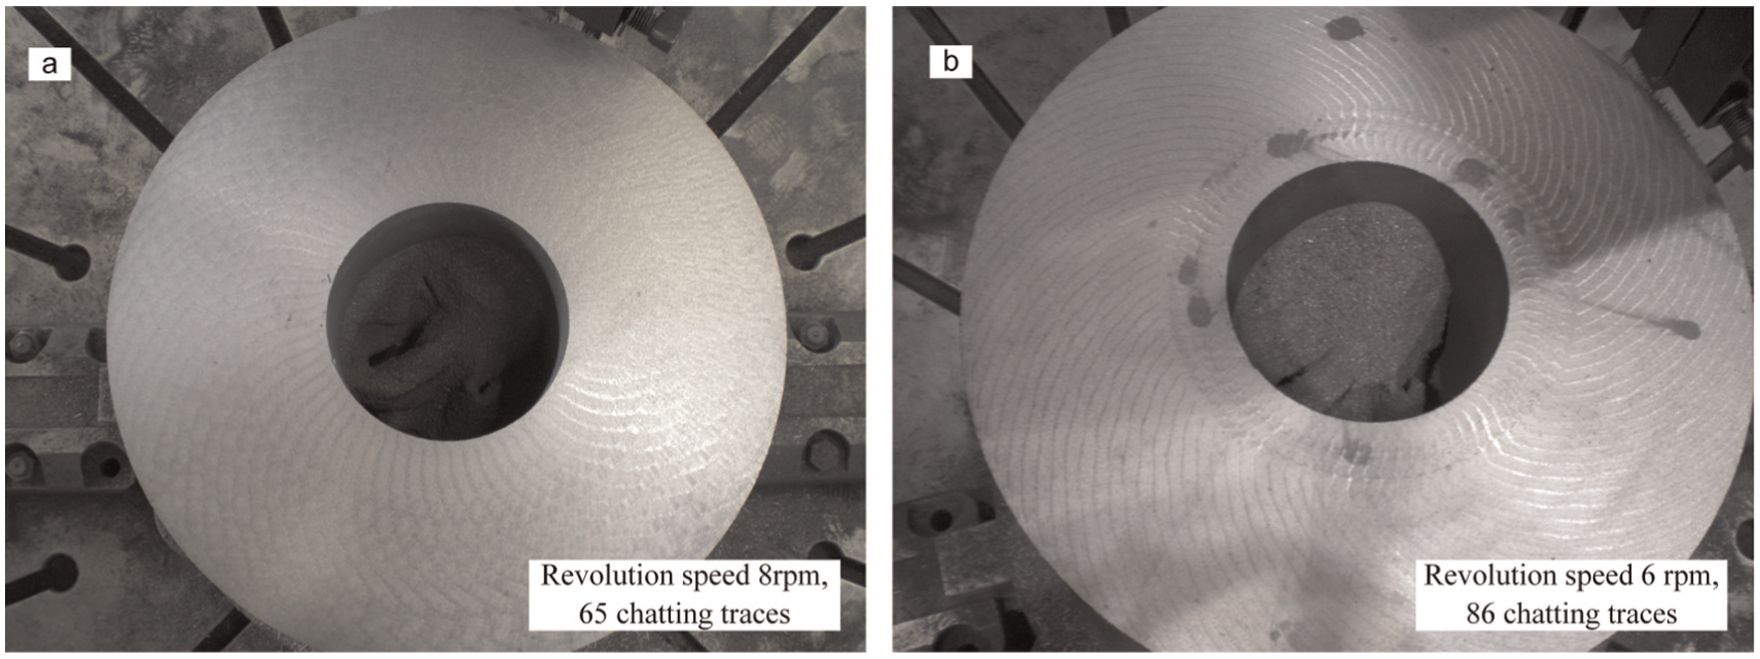
Trace of chatter mark at different rotation speeds during routine tests.
In summary, the dynamic modal parameters estimated through OMA based on the proposed random cutting excitation method can characterize the dynamics of the structure under normal cutting conditions much more accurately than the results obtained through impact tests. The proposed excitation technique is powerful enough to excite the whole heavy machine tool structure. The dynamics of the low-frequency range play a key role in the machining performance in heavy machine tool.
Conclusion
Heavy machine tool work under such high-load conditions that chatter vibrations are prone to occur. Precise estimation of the dynamics of the entire machine tool structure, especially in the lower frequency range, is necessary to the accurate prediction of stability lobe diagrams. This article presents a complete methodology for applying OMA to estimate dynamic modal parameters in the case of heavy machine tool structure. A random cutting excitation technique is proposed to excite the heavy machine tool structure. One OMA algorithm was employed to identify the dynamic parameters of the machine tool structure under machining operations. It can be observed that the dynamic properties of the structure under operations vary from the results of static impact tests. Chatter tests also showed that the modal parameters estimated by the proposed method are much more accurate than static impact test results to characterize the dynamic behavior of machine tool. Because of no access to input information, the modal shapes from OMA are not mass normalized (mass normalized shapes are necessary in synthesizing FRF). A modal shape scaling factor has to be obtained to do it, which needs further investigation.
Footnotes
Acknowledgements
The authors would like to acknowledge Mr and Mrs Serody for their help in checking and revising any grammatical and spelling errors in this article.
Declaration of Conflicting Interests
The author(s) declared no potential conflicts of interest with respect to the research, authorship and/or publication of this article.
Funding
The author(s) disclosed receipt of the following financial support for the research, authorship, and/or publication of this article: The research was sponsored by the National Natural Science Foundation of China under grant numbers 51275188, 51405176 and 51375193.