
Abstract
In order to improve the performance of the cutting tool, third-generation tools with multi-layered nanocoatings on the rake face are used. During machining, the chip–tool interactions depict that although the tool wear on the rake face is located in the close proximity of the cutting edge, that is, within 800 µm, all the commercially available cutting tools have the coatings on the entire rake face. Taking into account the tribological properties required by the rake face close to the cutting edge, that is, high wear resistance and low friction, this study makes an attempt to identify, characterize and locate the actual wear zones/regions in terms of hard and soft zones in the chip contact area of tungsten carbide (WC) inserts close to the cutting edge in turning. Mamdani fuzzy inference system model was developed, trained with the sample experimental data and tested with the test data. The simulated results showed that the average error values of edge chipping (in X- and Y-directions), nose damage and crater wear (in X- and Y-directions) are about 2.37%, 3.01%, 2.86%, 2.66% and 1.89%, respectively. The fuzzy model developed in this study showed remarkable prediction of the wear zone locations and is also helpful for the researchers to decide the type of coating (hard and soft) along the specified zones for reducing the cost of production.
Keywords
Introduction
In metal cutting operations, workpiece material undergoes rapid plastic deformation along the chip–tool interactions, which, in turn, leads to an undesirable tool wear. Therefore, to improve the cutting efficiency, it is necessary to select optimal cutting conditions in machining operations. Tool wear is a common phenomenon seen in all the machining operations and mostly it depends on the hardness of the work materials, type of tool, rigidity of the machine, heat, formation of chips and cutting parameters. 1 These factors, in turn, would try to increase the cutting forces and temperatures at the tool–chip and tool–workpiece interfaces, which lead to softening of the tool material and promotes the diffusion and different types of wear. Cutting fluids are used to reduce cutting temperatures and tool wear for better surface finish and tool life. However, with green machining philosophy, dry machining is gaining prominence. The effect of cutting parameters on surface roughness and tool surface temperature in turning of AISI 422 under dry machining conditions has shown better results compared to wet conditions. 2 Carbide cutting tool coated with TiAlN performed better in machining aerospace materials compared with TiN/MT-TiCN/TiN. 3 The machining performance has been assessed in terms of wear rate and wear mechanism of cutting tools over a feed rate to cutting velocity plane using wear maps. The focus of the study is to improve the integrity of such wear maps. 4 A novel signal processing technology called singular spectrum analysis (SSA) was proposed to improve the surface roughness prediction while dry turning with TiN-coated carbide tools. 5 The most important failure modes of a tool are flank wear and crater wear. In dry machining of Ti-6Al-4V alloy, the average and maximum width of flank wear was increased at a cutting speed of 220 m/min, which resulted in an increase of all the three components of forces. 6 A unique approach was used to monitor the tool wear and a correlation was made with the cutting forces in an interrupted metal turning operation. The tool monitoring system has been developed by understanding the spectra energy content of the dynamic, cutting force signals. 7 To have low cutting temperatures, high cutting speeds are normally preferred in dry machining. This is because under high cutting speeds, most of the heat generated will be carried by the chip.8–10 Surface roughness (Ra) value is found to increase with an increase in cutting speed whereas the depth of cut has not influenced the roughness value much in dry machining. The roughness values were found to vary nonlinearly with an increase in the variation of feed. 11 The tool wear index (TWI) and the tool life model was developed by analyzing crater wear and material loss from the rake face using micro optics and image processing/analysis algorithms. It was also advised to machine with the same tool under variable feeds by monitoring its TWI, which optimizes the production cost. 12 A novel technique was proposed to quantify both flank wear and crater wear for direct comparability. In crater wear, the material loss was assessed by comparing the three-dimensional (3D) wear data obtained by white light interferometry. It was likewise noted that at high cutting speeds and feeds, significant crater was formed and a slight increase or decrease in cutting forces was observed due to an effective sharpening of the cutting edge. 13 A pneumatic method was utilized to sense the tool wear and a special fixture was designed to find the land and crater wear profiles to evaluate in a single step. 14 A machine vision system was built up for automated tool wear inspection; contour algorithm was employed to measure the tool wear regions and neural networks for classifying the type of wear which gives accurate results. 15 A mathematical equation was developed to model the diffusion wear for high cutting speed cutting operations. The results are useful to determine the optimal cutting conditions with regard to tool life and volume of material removed. 16 To optimize the process parameters and to design the experimentation, Taguchi technique can be used. The cutting speed, feed and depth cut were optimized by using Taguchi technique to get maximum material removal rate (MRR) and good surface finish. 17 Tool wear and surface roughness values in turning of AISI-H11 steel with TiN-coated–mixed ceramic inserts were optimized by using response surface methodology and the effect of significant parameters has been analyzed by applying the analysis of variance technique. 18 Crater wear on the rake face of the tool is often measured by a profile meter as the maximum depth of the crater formed on the rake face. The characterization and quantification of wear zones on the rake face of tungsten carbide (WC) cutting tools under all the dry machining conditions in machining of 1040 steel are well explicated in Prasad et al. 19 The most common fuzzy inference system (FIS) types are Mamdani-type and Sugeno-type. Mamdani-type was used to defuzzify the resulting fuzzy set to yield the output of the system. 20 An online fuzzy expert system (FES) was developed for machinability data selection through socket programming, which affords a good prediction compared to the result from the Machining Data Handbook.21,22 The consolidated chip flow phenomenon over the rake face of WC tool bits helps the researchers and tool manufacturers to go for nanocoatings on the identified zones instead of depositing coatings on its entire surface. 23 Contemplating the tribological properties required by the rake face, that is, high wear resistance and low friction, the wear zones on the rake face are characterized in terms of using a digital image analyzer and by overlapping the AutoCAD (computer-aided design) drawings for different dry machining conditions. Hard zone visualizes the area where the hardness of the tool or its high wear resistance has to play a vital role, whereas over the soft zone the frictional properties of the tool should be enhanced. The experimental data revealed that hard zone is located at a distance of 200–500 µm from either of the cutting edges and the soft zone is located at a distance of 1400 µm. 24
This work aims on prediction of wear zone locations on the rake face by interpolating the data within the range by using one of the soft computing techniques, Mamdani FIS model in MATLAB (MathWorks, Inc.). The side and end cutting edges are taken as datum lines for locating the wear zones. The error obtained during the validation of the FIS model in locating the wear zones in WC inserts was found to be within the acceptable limits gaining the attention of the tool makers and researchers to a larger extent.
Experimental methodology
In general, for turning operation, WC tool is used for machining AISI 1040 steel. For this study, the experiments were carried out under various dry machining conditions. During plain turning operations that were done on all the geared lathe (Kirloskar make) machine at various dry machining conditions, the chip flow phenomenon and the tool wear were examined. The flow chart of the methodology adopted in this work is shown in Figure 1.
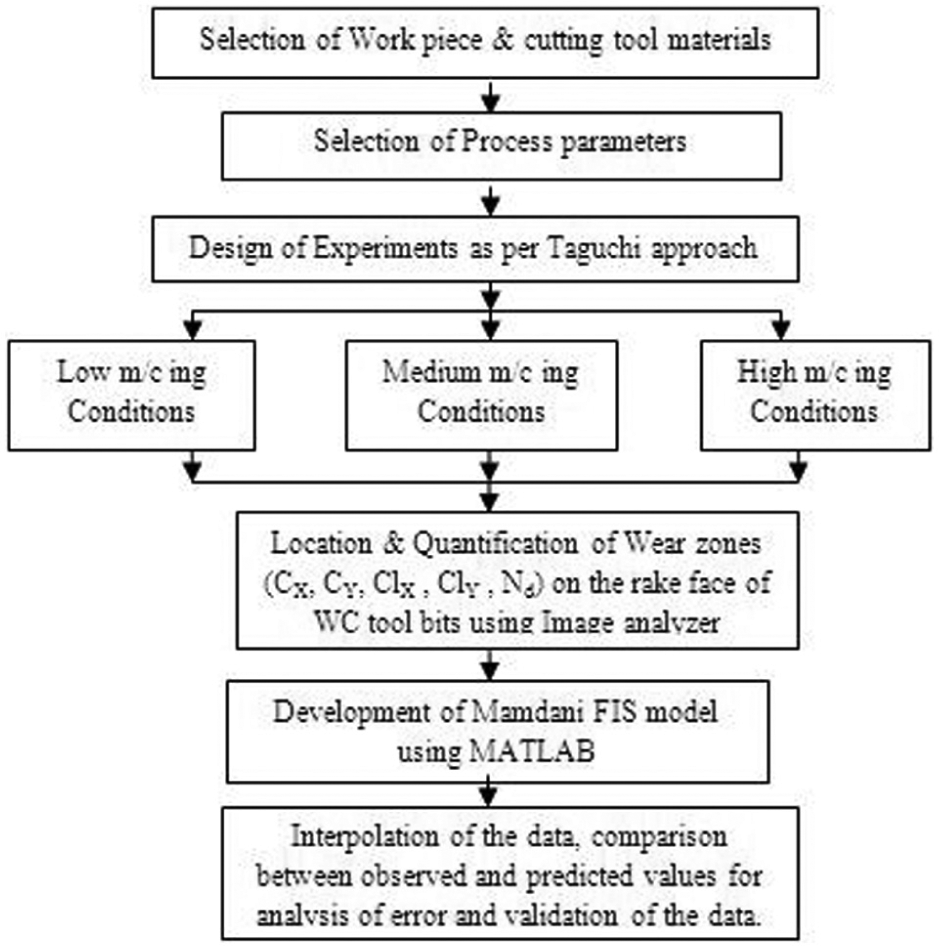
Experimental design and methodology.
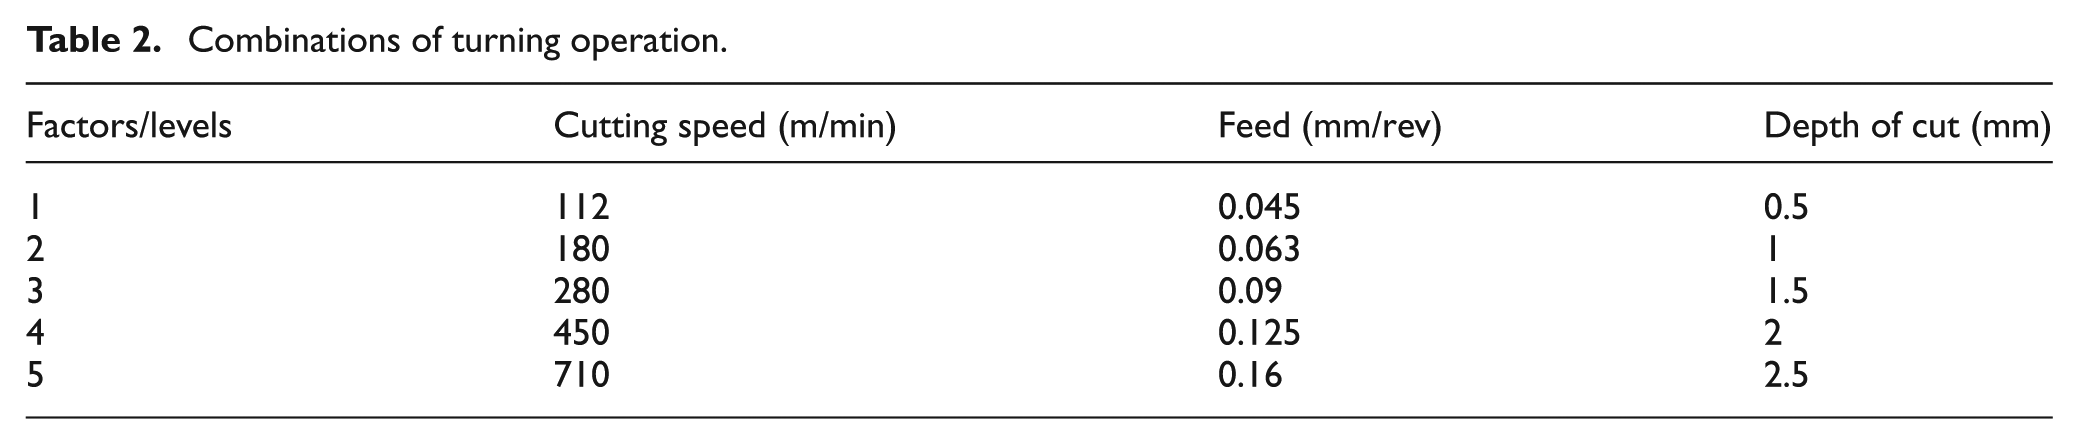
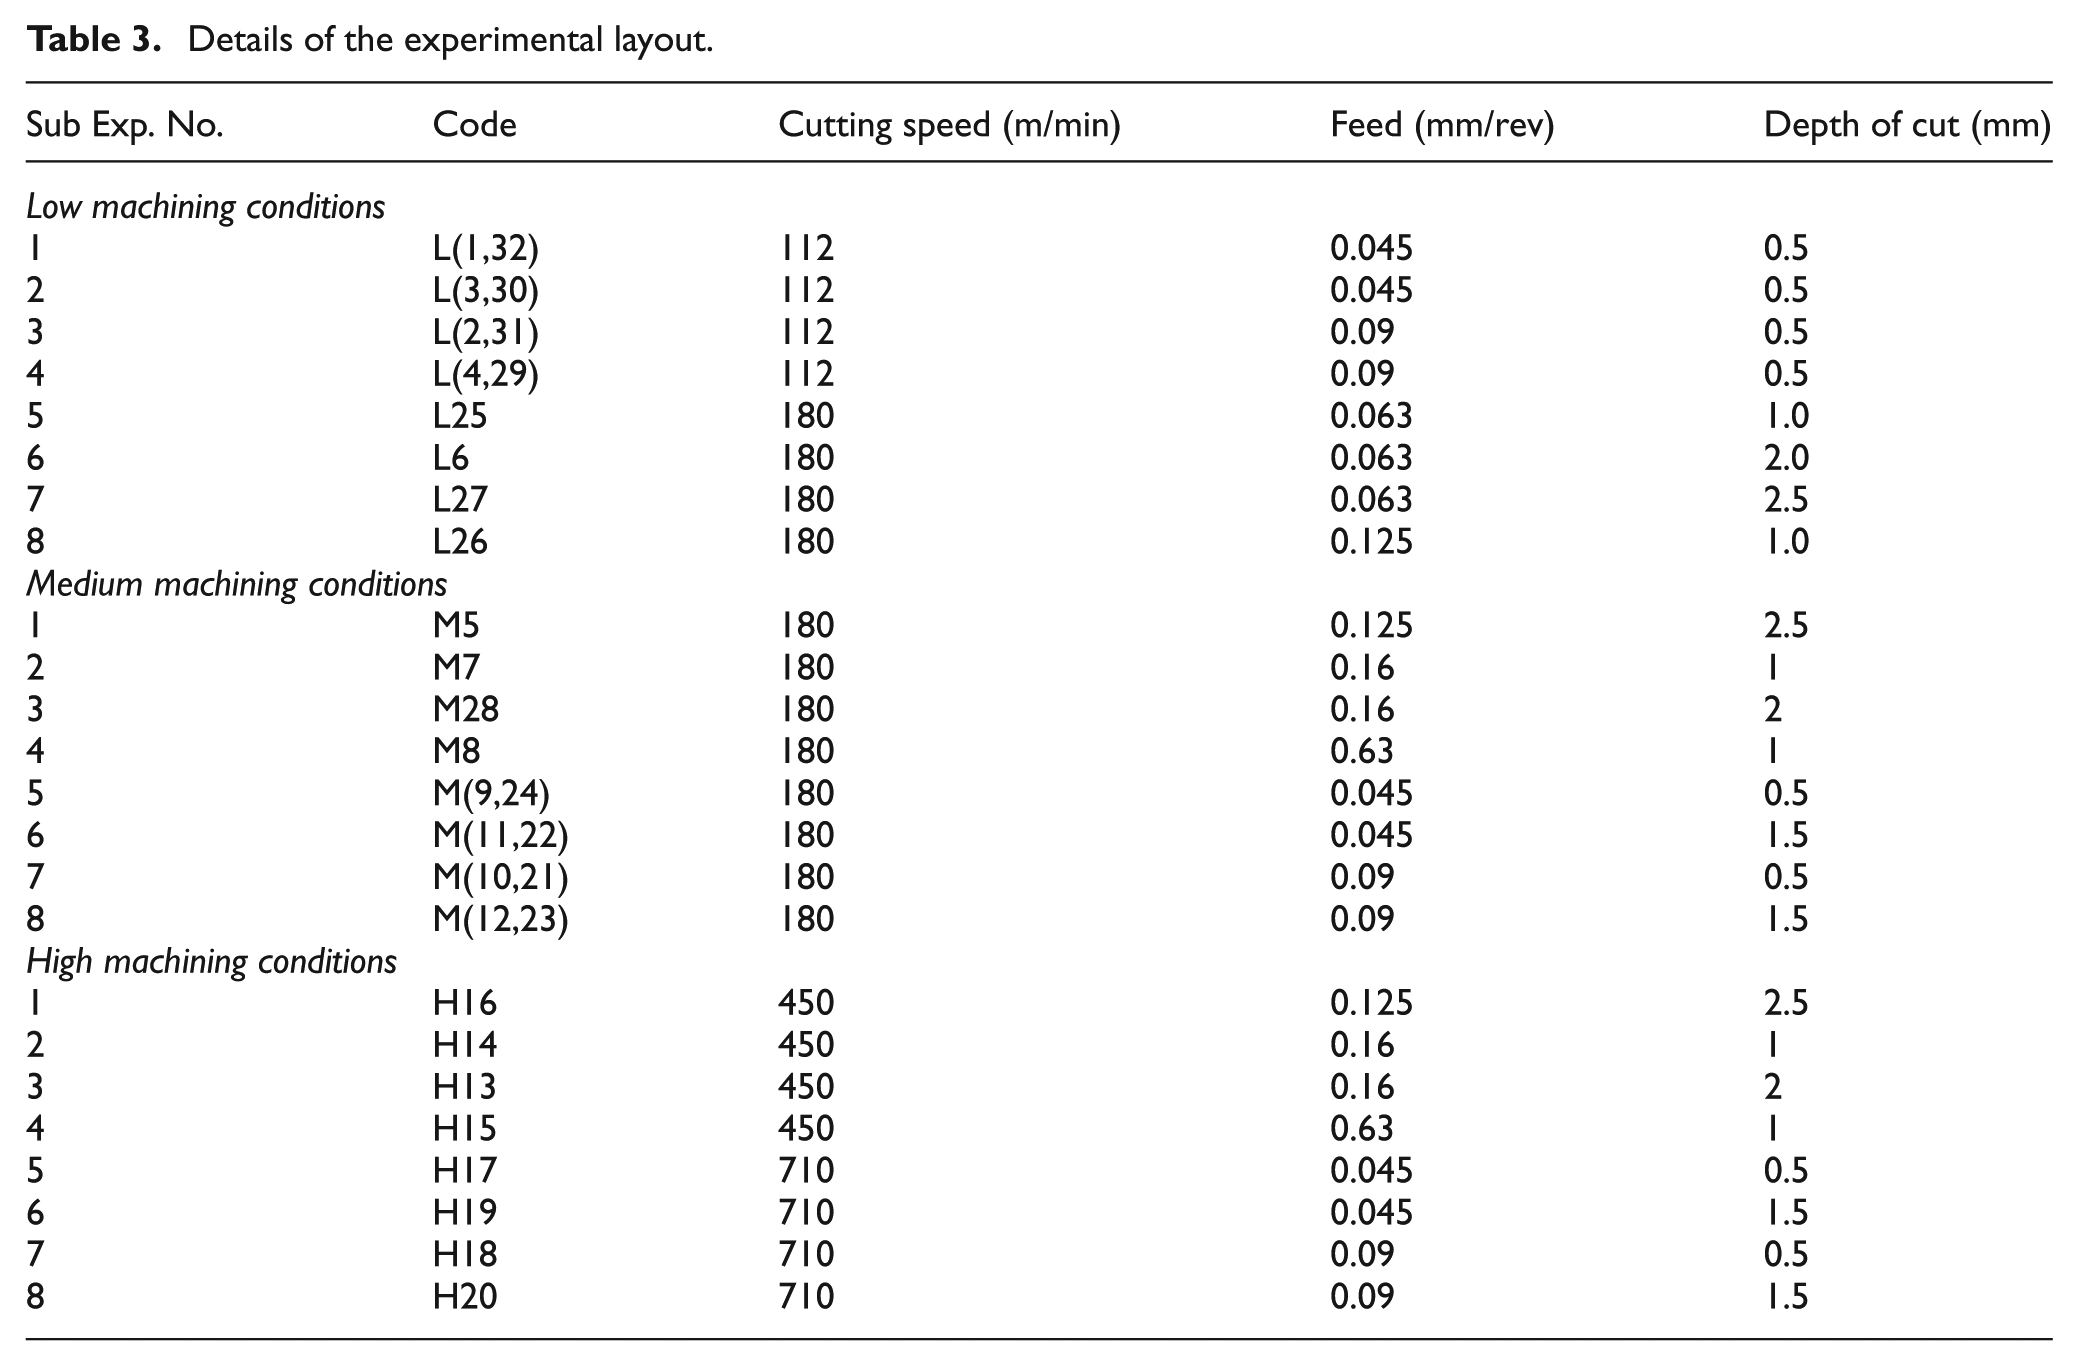
Taguchi method was used to plan the experimentation by considering the three machining variables (cutting speed, feed and depth of cut) at five different levels, respectively. The levels of the factors are shown in Table 1. In this study, OA32(231) orthogonal array was considered. It has 32 rows (no. of factors) and 31 columns (no. of levels) in it. As per the orthogonal array, the number of experiments was reduced from 231 to 32. So, a total of 32 experiments based on the Taguchi framework were designed, of which 24 experiments were conducted and the remaining were left out as they were repetitive in nature. Table 1 gives the details of the experimental conditions and Table 2 gives the details of various combinations of the machining parameters. These 24 experiments are categorized into three groups, namely, low, medium and high machining conditions as shown in Table 3. AISI 1040 steel workpiece that was being turned using WC cutting tools under various dry machining conditions is shown in Figure 2. For every pass, the tool bit was examined under an electron microscope to check the possible crater wear.
Experimental conditions.
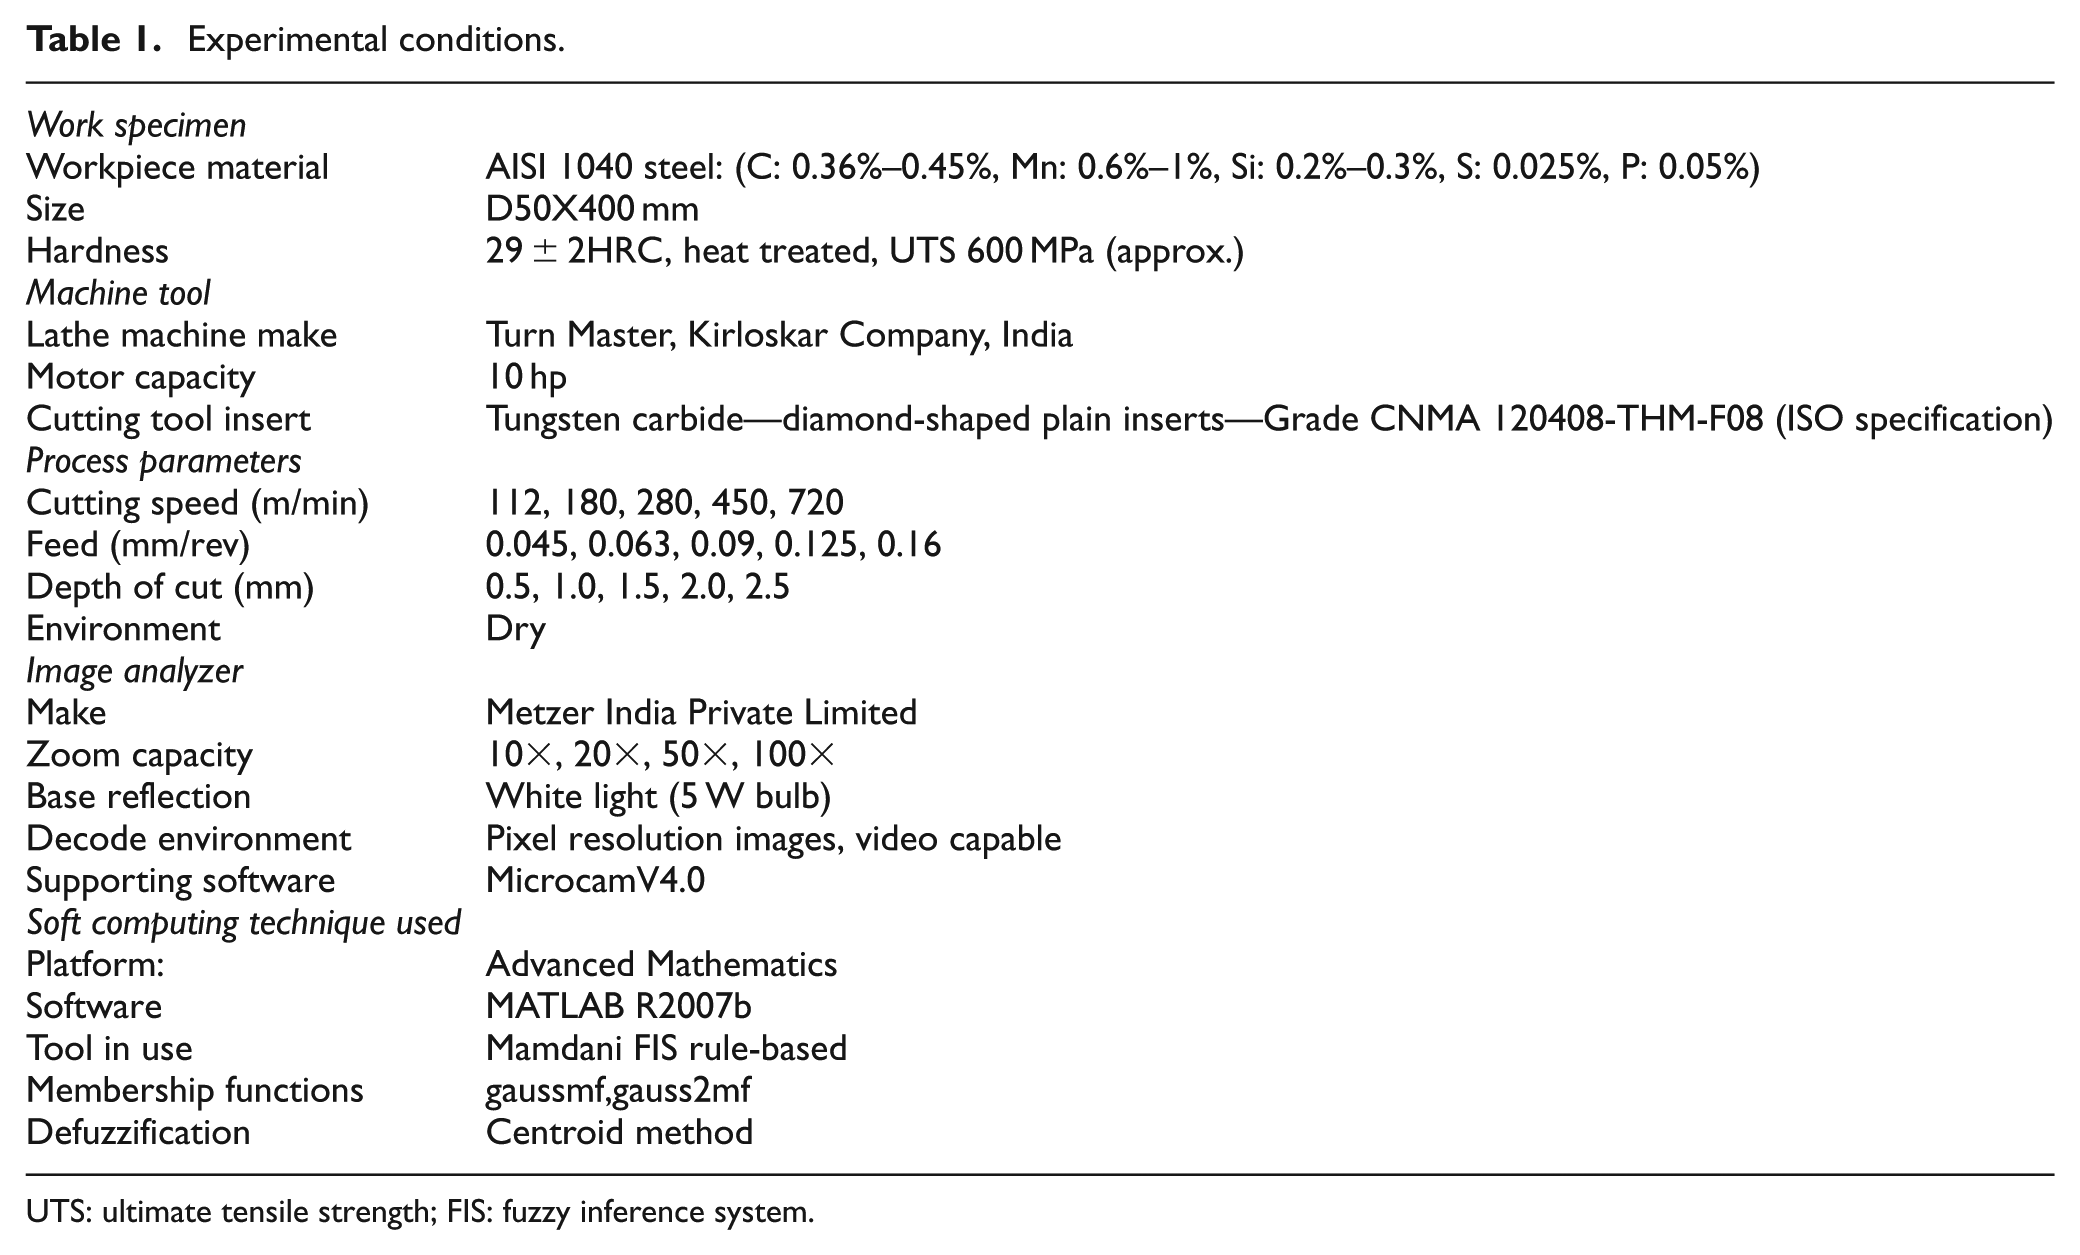
UTS: ultimate tensile strength; FIS: fuzzy inference system.
Combinations of turning operation.
Details of the experimental layout.
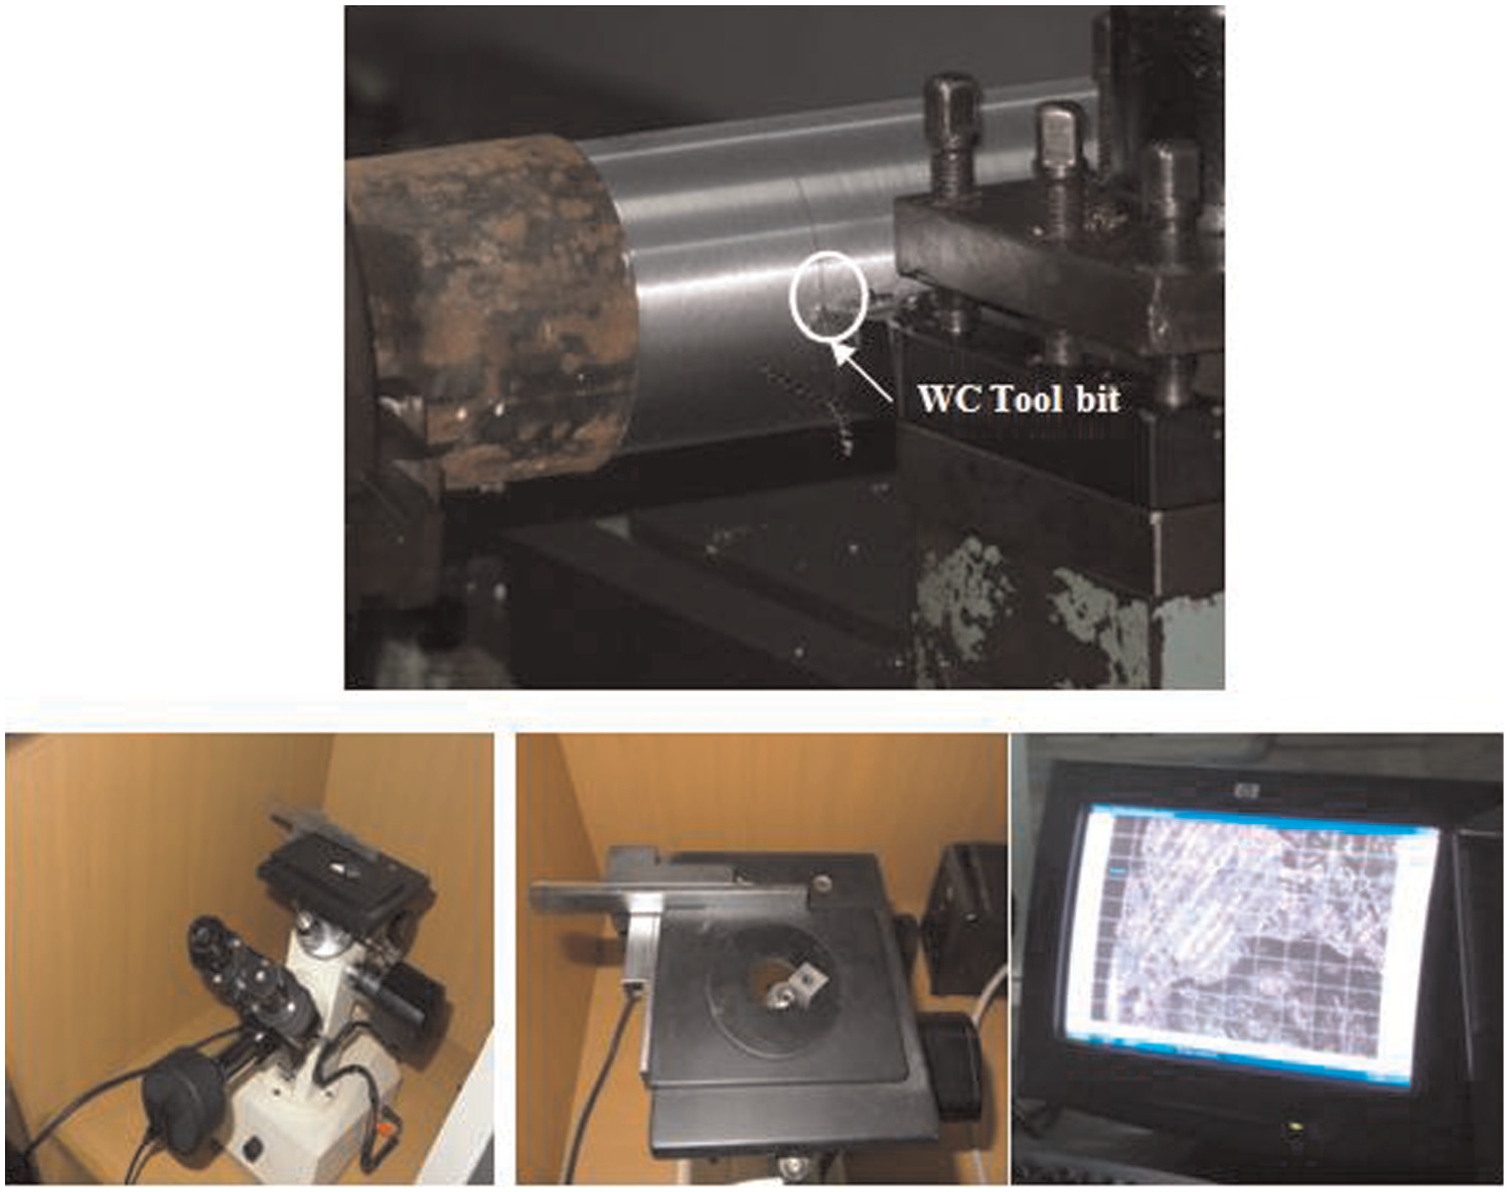
Experimental setup with digital microscope and image analyzer arrangement.
Images are captured through the digital image analyzer for understanding the intense details of wear in different regions of the rake face. Based on the proximity of the wear with reference to the cutting edge, edge chipping and crater wear are shown in Figures 3 and 4, respectively. The dark portion close to the cutting edge in the digital image shows the crater wear, whereas the textured portion indicates the unaffected surface of the rake face. The information obtained from the micro images for each low, medium and high machining condition are overlapped using AutoCAD drawings to study the combined wear patterns (edge chipping and crater wear) and characterize the wear zones as hard and soft as seen in Figure 5(b). Figure 5(a) depicts the consolidated chip flow phenomena over the rake face. The area, above which arrows are placed, is the consequence of the superimposition of AutoCAD drawings for all the three machining conditions considered in this study. The arrows indicate chip flow direction that was obtained from the observations. The direction of chip flow is vital in deciding the crater wear and edge chipping. The area where more arrows are placed represents a longer chip flow path. Edge chipping is more toward the side cutting edge and crater wear is more nearer to the end cutting edge.
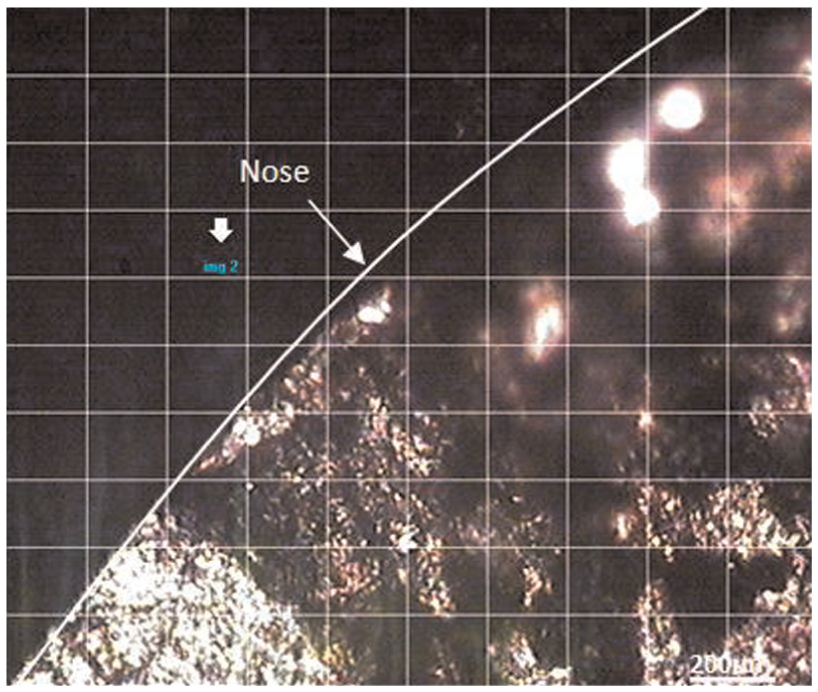
Digital image showing chipping of nose under one of the medium machining conditions (M(12,23)—speed: 180 m/min, feed: 0.045 mm/rev and depth of cut: 1.5 mm). 19
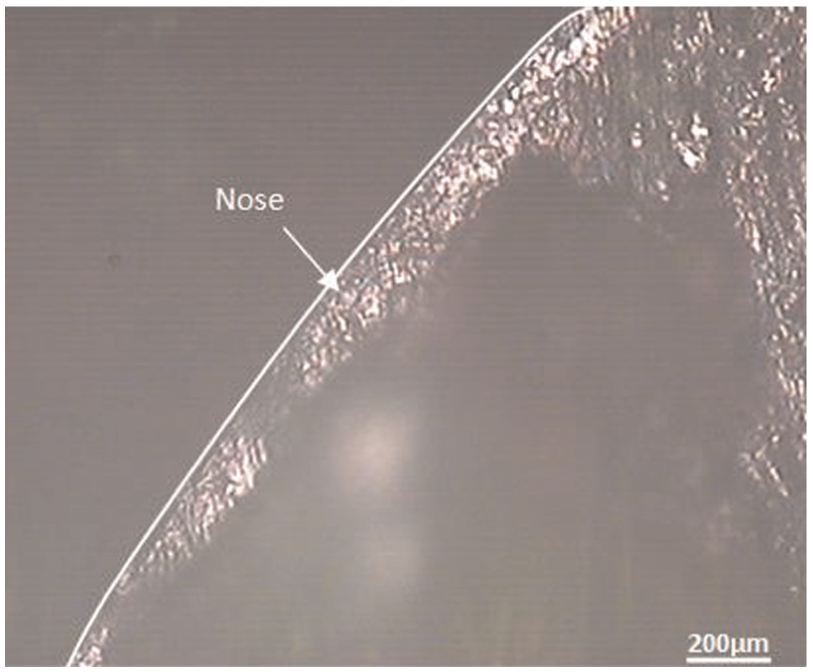
Digital image showing the crater wear under one of the high machining conditions (H16—speed: 450 m/min, feed: 0.125 mm/rev and depth of cut: 2.5 mm). 19
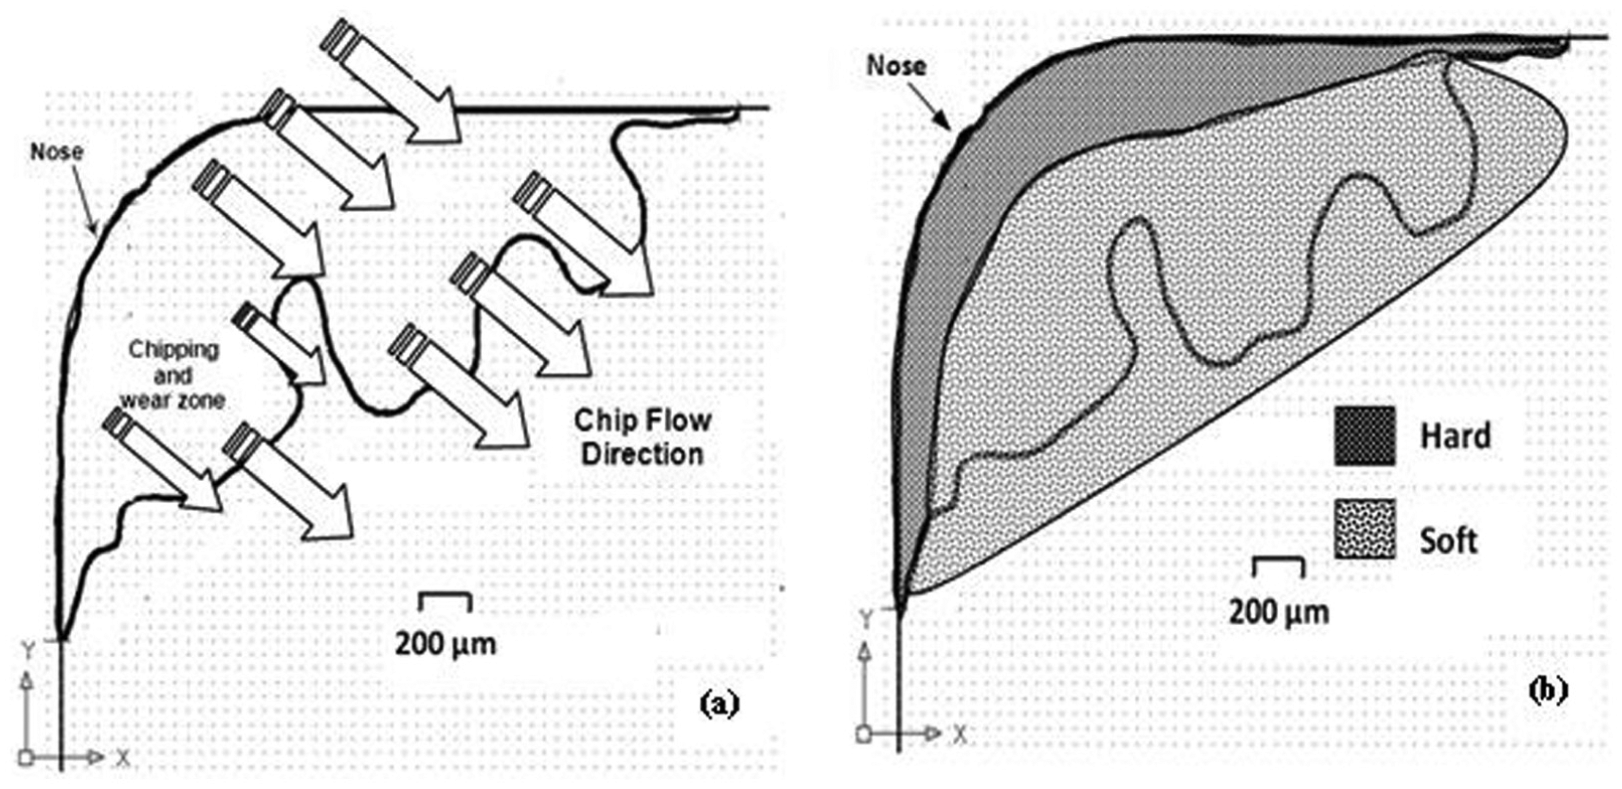
(a) Consolidated chip flow path and (b) cutting tool template showing location of hard and soft coatings. 19
Methodology adopted to locate and measure the wear zones
Wear along both the cutting edges is not symmetric; hence, an empirical method called diagonal separation method was applied to divide the total rake face into two zones separating diagonally enabling easy location and measurement of the wear zones as indicated in Figure 6. The side and end cutting edges are taken as datum lines to locate wear zones along the X- and Y-directions, respectively. The red mark (pre machining condition shown in Figure 6) indicates the actual distance of the tool bit from the guidelines (end and side cutting edge lines) and blue mark (post machining condition shown in Figure 6) indicates the peripheral distance of wear propagation; green and purple colors indicate the crater wear locations. Similarly, this technique can be applied to assess the wear zones in other directions also.
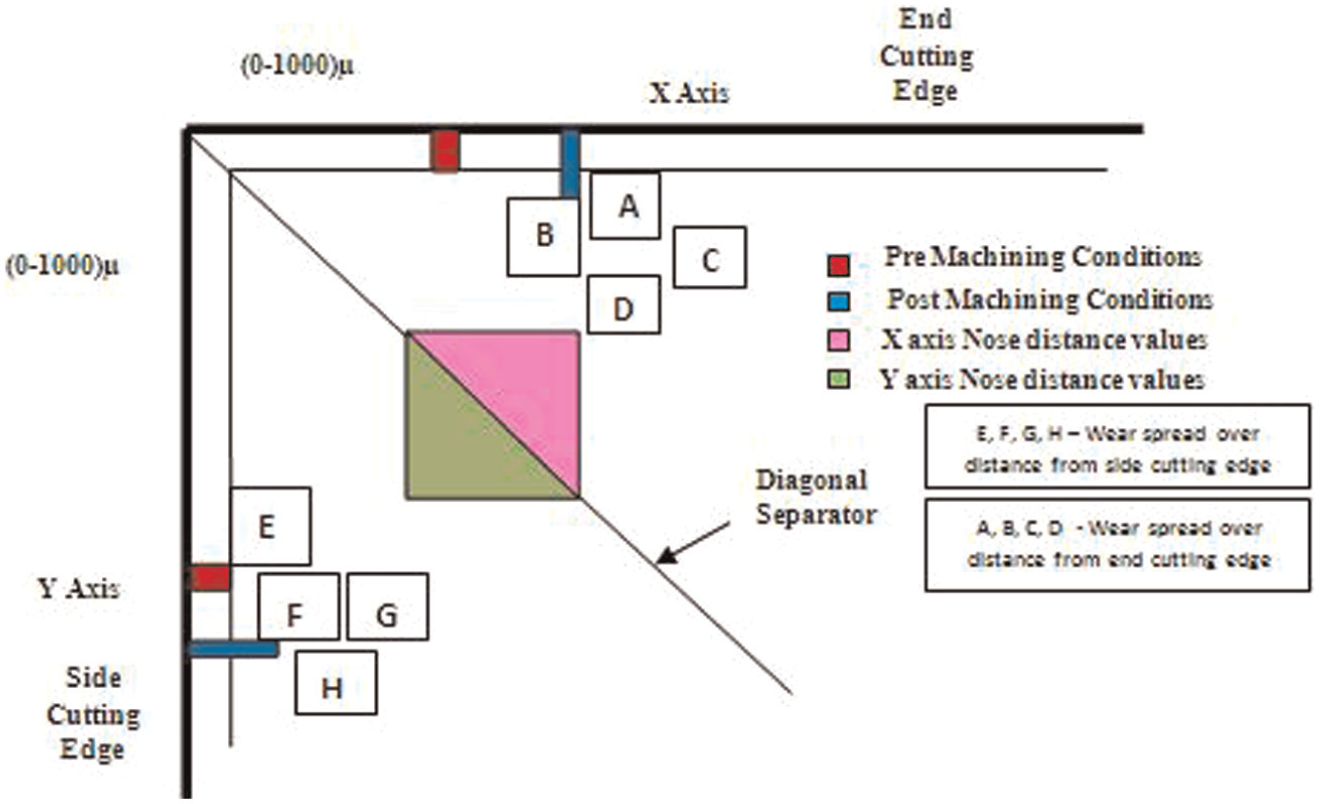
Diagonal separation method used for the quantifications of wear zones.
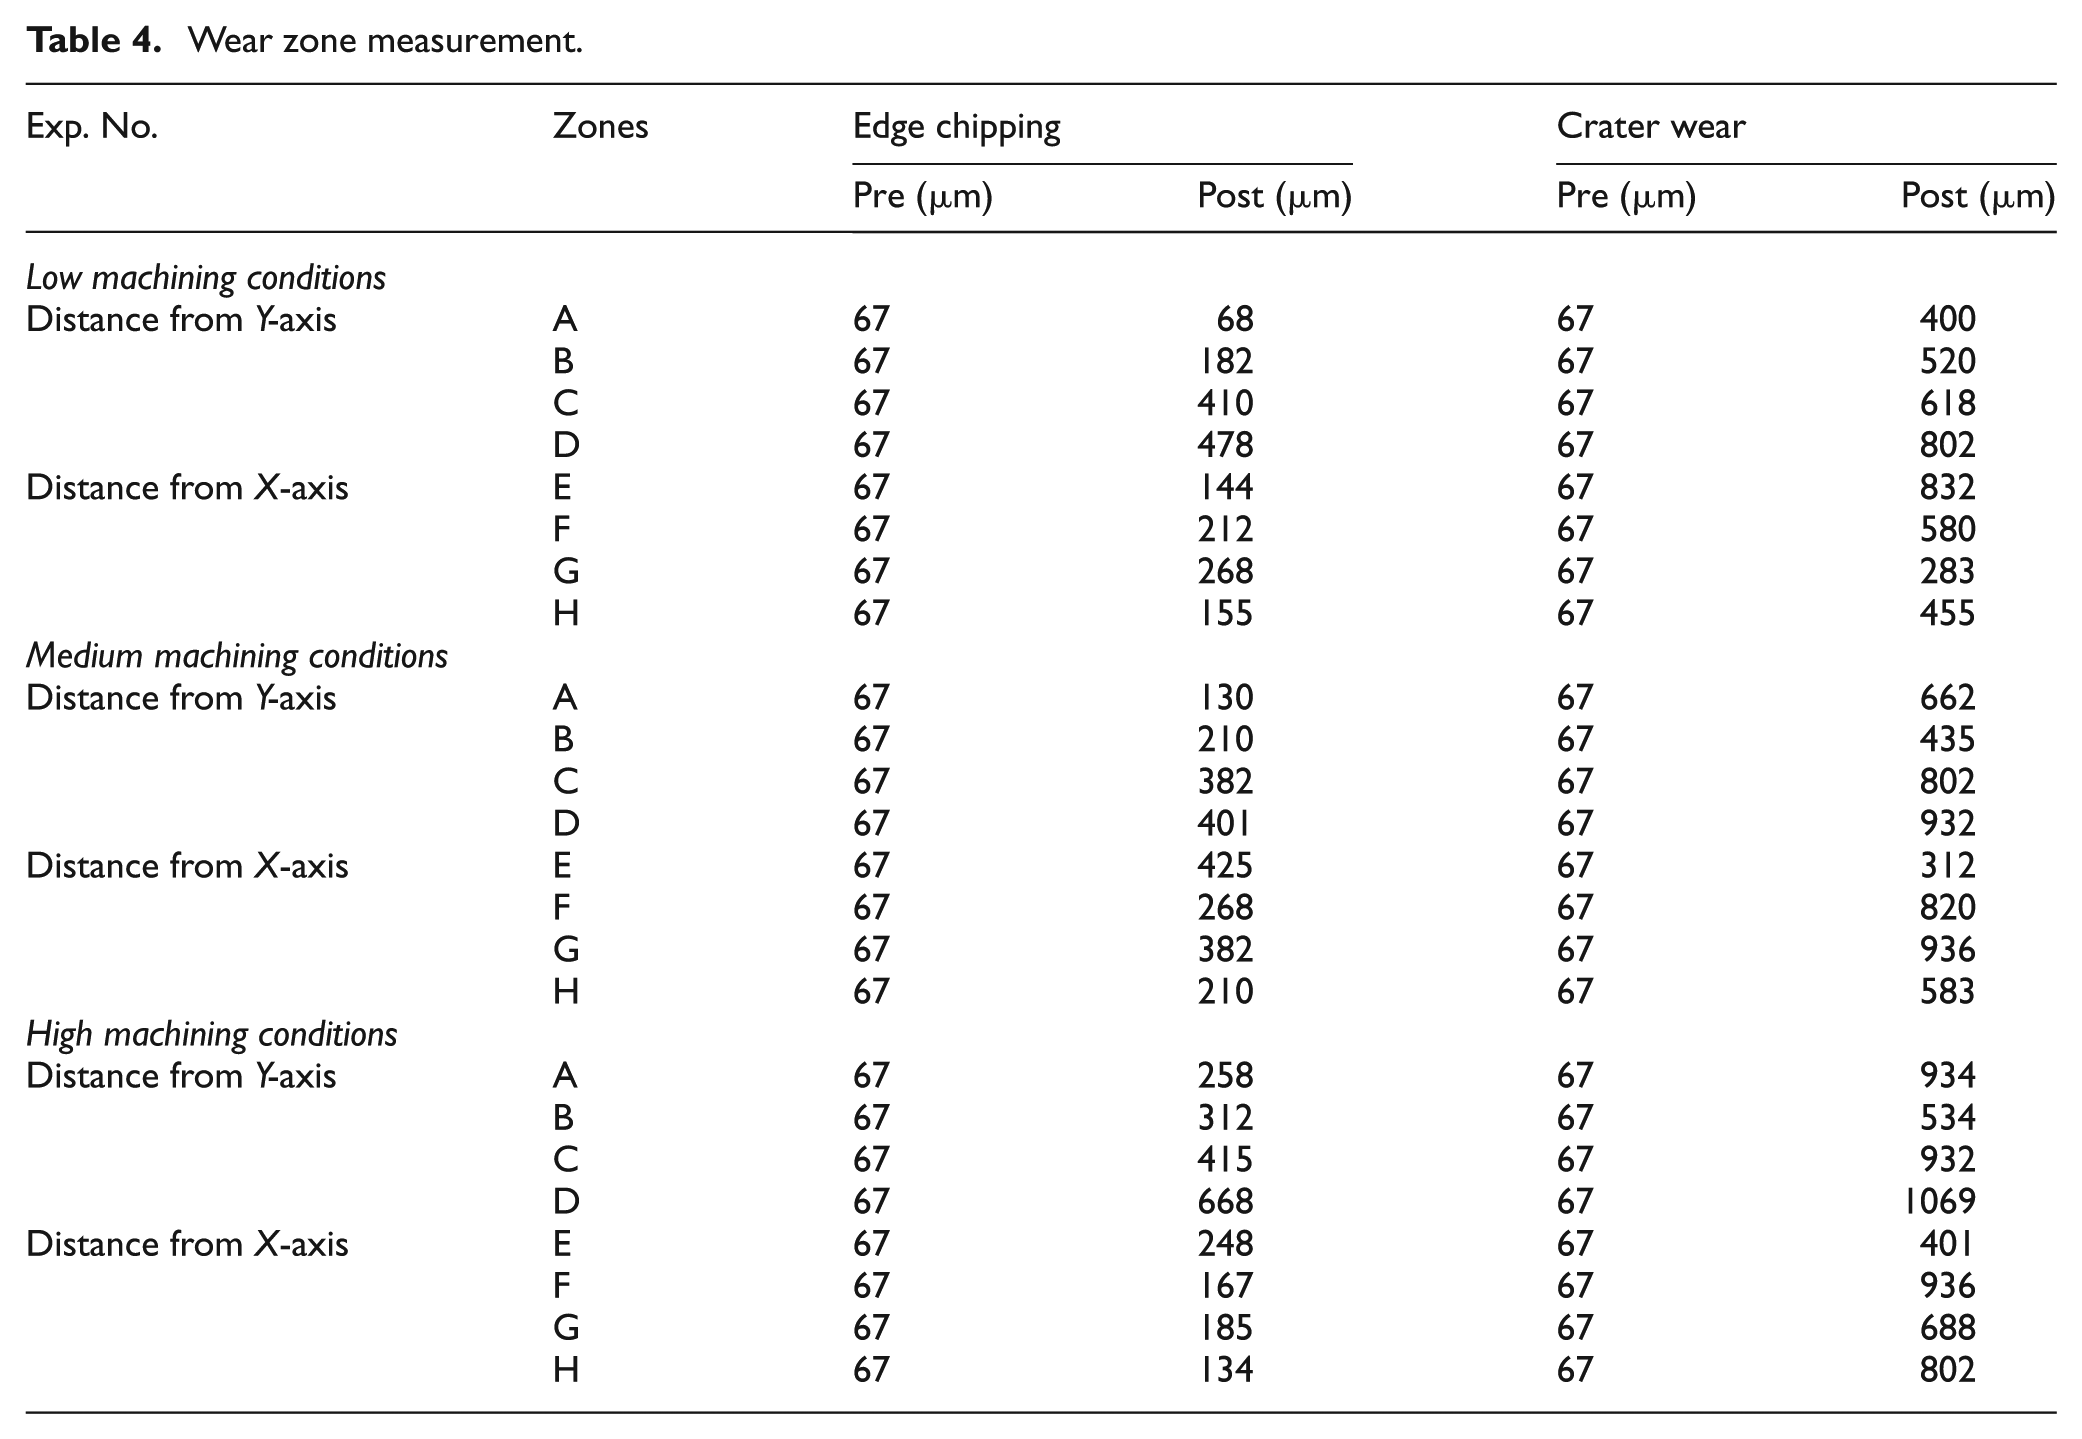
In this study, it has been considered that wear up to 800 µm from the cutting edge is edge chipping and beyond that it is mentioned as crater wear. Although the edge chipping and crater wear occur simultaneously, the respective data are tabulated separately for all the three dry machining conditions by measuring its pre- and post-machining distances (Tables 6–8).
Based on wear progression observed, 67 µm is considered as marginal for locating the wear zones for uncoated WC cutting tools (Table 4). After machining, the respective wear spread over distances is measured along the end and side cutting edges and is labeled as ABCD and EFGH, respectively, as shown in Figure 6.
Wear zone measurement.
Architecture of fuzzy logical system used for predicting the location of crater wear, edge chipping and nose damage
The two main types of FISs are the Mamdani-type and the Sugeno-type. Mamdani FIS is more widely used technique, because it provides reasonable results with a relatively simple structure. The fundamental difference between Mamdani-type FIS and Sugeno-type FIS is the way the crisp output is generated from the fuzzy inputs. Mamdani-type FIS uses the technique of defuzzification of a fuzzy output, while Sugeno-type FIS uses weighted average to compute the crisp output. Hence, Mamdani FIS has output membership functions (MFs) whereas Sugeno FIS has no output MFs.25–27 For this study, Mamdani-type FIS is proposed for the prediction of the output parameters such as edge chipping (X- and Y-directions), crater area length (X- and Y-directions) and nose damage on the tool under plain turning process. Mamdani-type FIS is modeled using three input parameters such as speed, feed and depth of cut as shown in Figure 7.
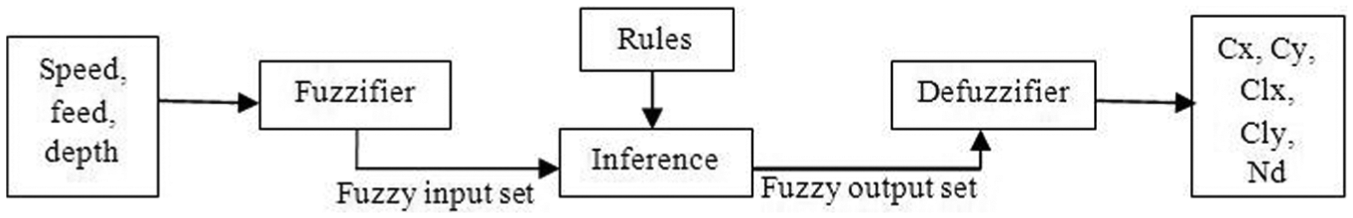
Architecture of FLS.
MF is a graphical representation of the magnitude of participation of each input. In fuzzy logical system (FLS), it associates a weighting with each of the inputs that are processed, defines functional overlap between the inputs and ultimately defines an output response. In Mamdani-type FLS, different types of MFs are available such as dsignmf, gauss2mf, gaussmf, gbellmf, pimf, psigmf, sigmf, smf, trapmf, trimf and zmf, respectively.
Figure 7 shows the architecture of the FLS adopted in the study. The foremost step in building the algorithm of the model is to pick out the shape of the fuzzy MF for fuzzy sets of process variables which helps distinguish the varied ranges of the input and output variables. The MF is assigned without depending on the results of the experiments. In this article, Gaussian MF is selected for fuzzy input and output parameters. In MATLAB, a Simulink model is developed using building blocks from the library.
Levels of input and output variables for fuzzification
As discussed before, the predominant parameters that influence the tool wear are cutting speed, feed and depth of cut or their combinations. Cutting speed, feed and depth of cut are divided into five stages (very low, low, medium, high and very high), that is, {VL, L, M, H, VH}, which assist in containing the ranges while in combinations. Similarly, MFs are defined for the output parameters, that is, edge chipping, crater wear and nose damage. Figure 8 shows fuzzy Simulink in MATLAB, MF for the input and output variables. Five levels {VL, L, M, H, VH} are identified to divide the intensity levels of speed, feed and depth of cut; accordingly, the range is set for the measurement of the output parameters as shown in Table 5. The rule set consisting of the notations {VL, L, M, H, VH} for the speed, feed and depth of cut is denoted against one of the experimental readings (crater wear in X-direction) as shown in Table 6.
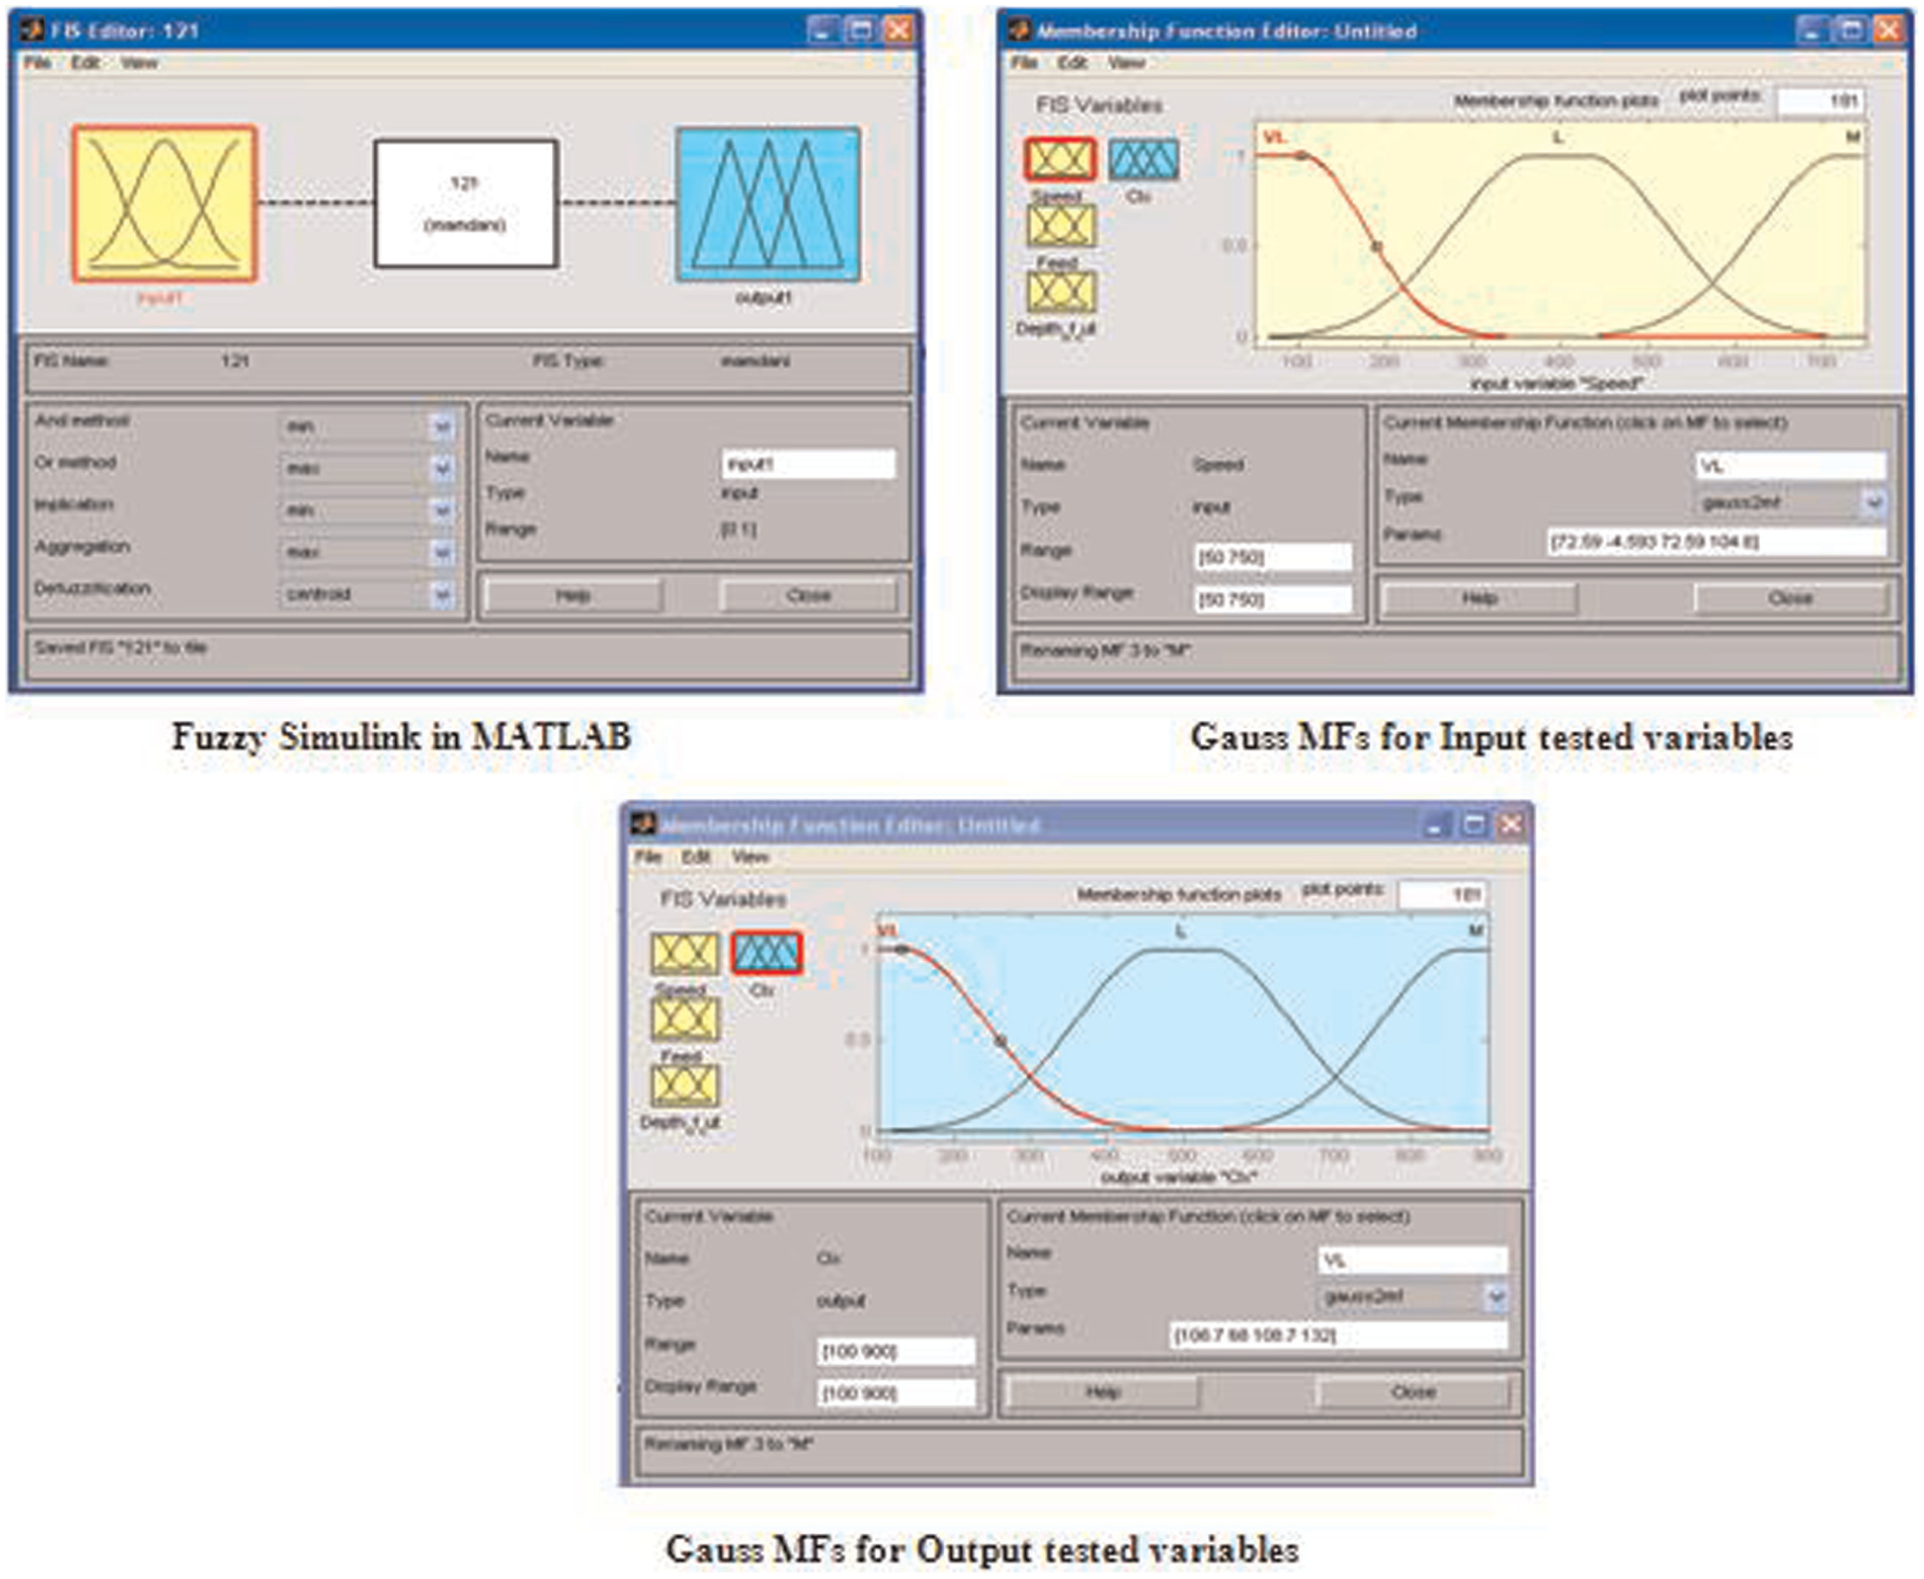
Fuzzy Simulink model in MATLAB.
Range set for crater length in X-direction.
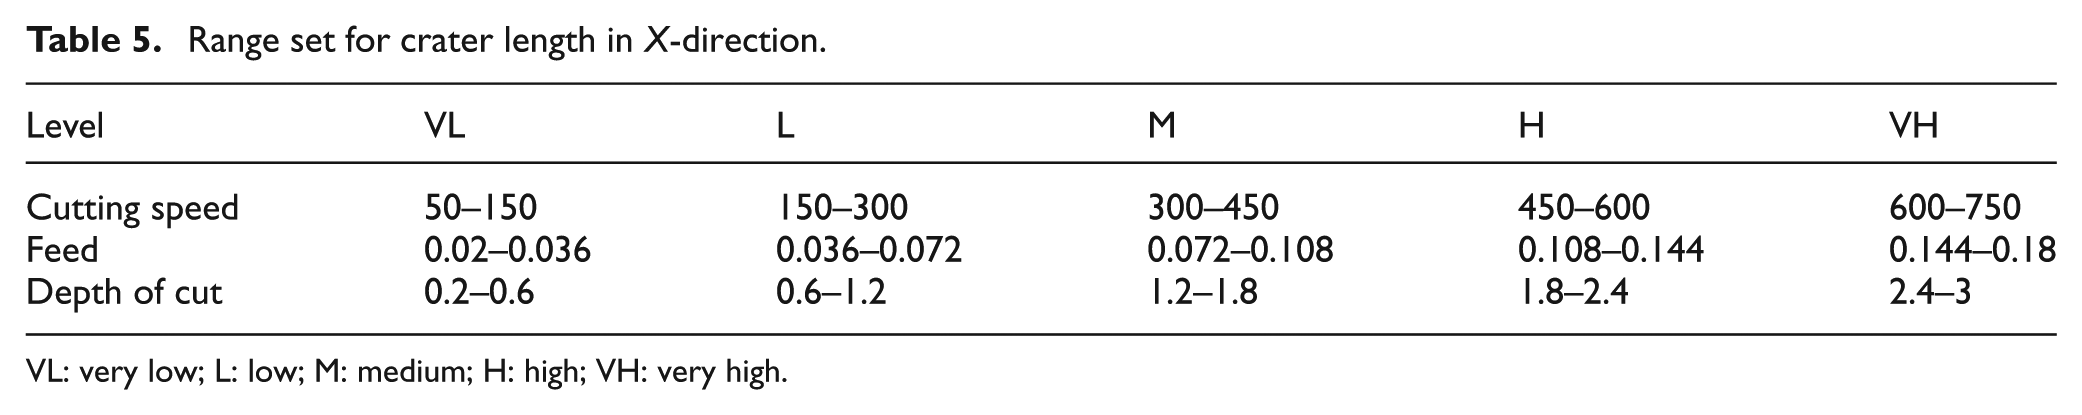
VL: very low; L: low; M: medium; H: high; VH: very high.
Rule set for crater length in X-direction.
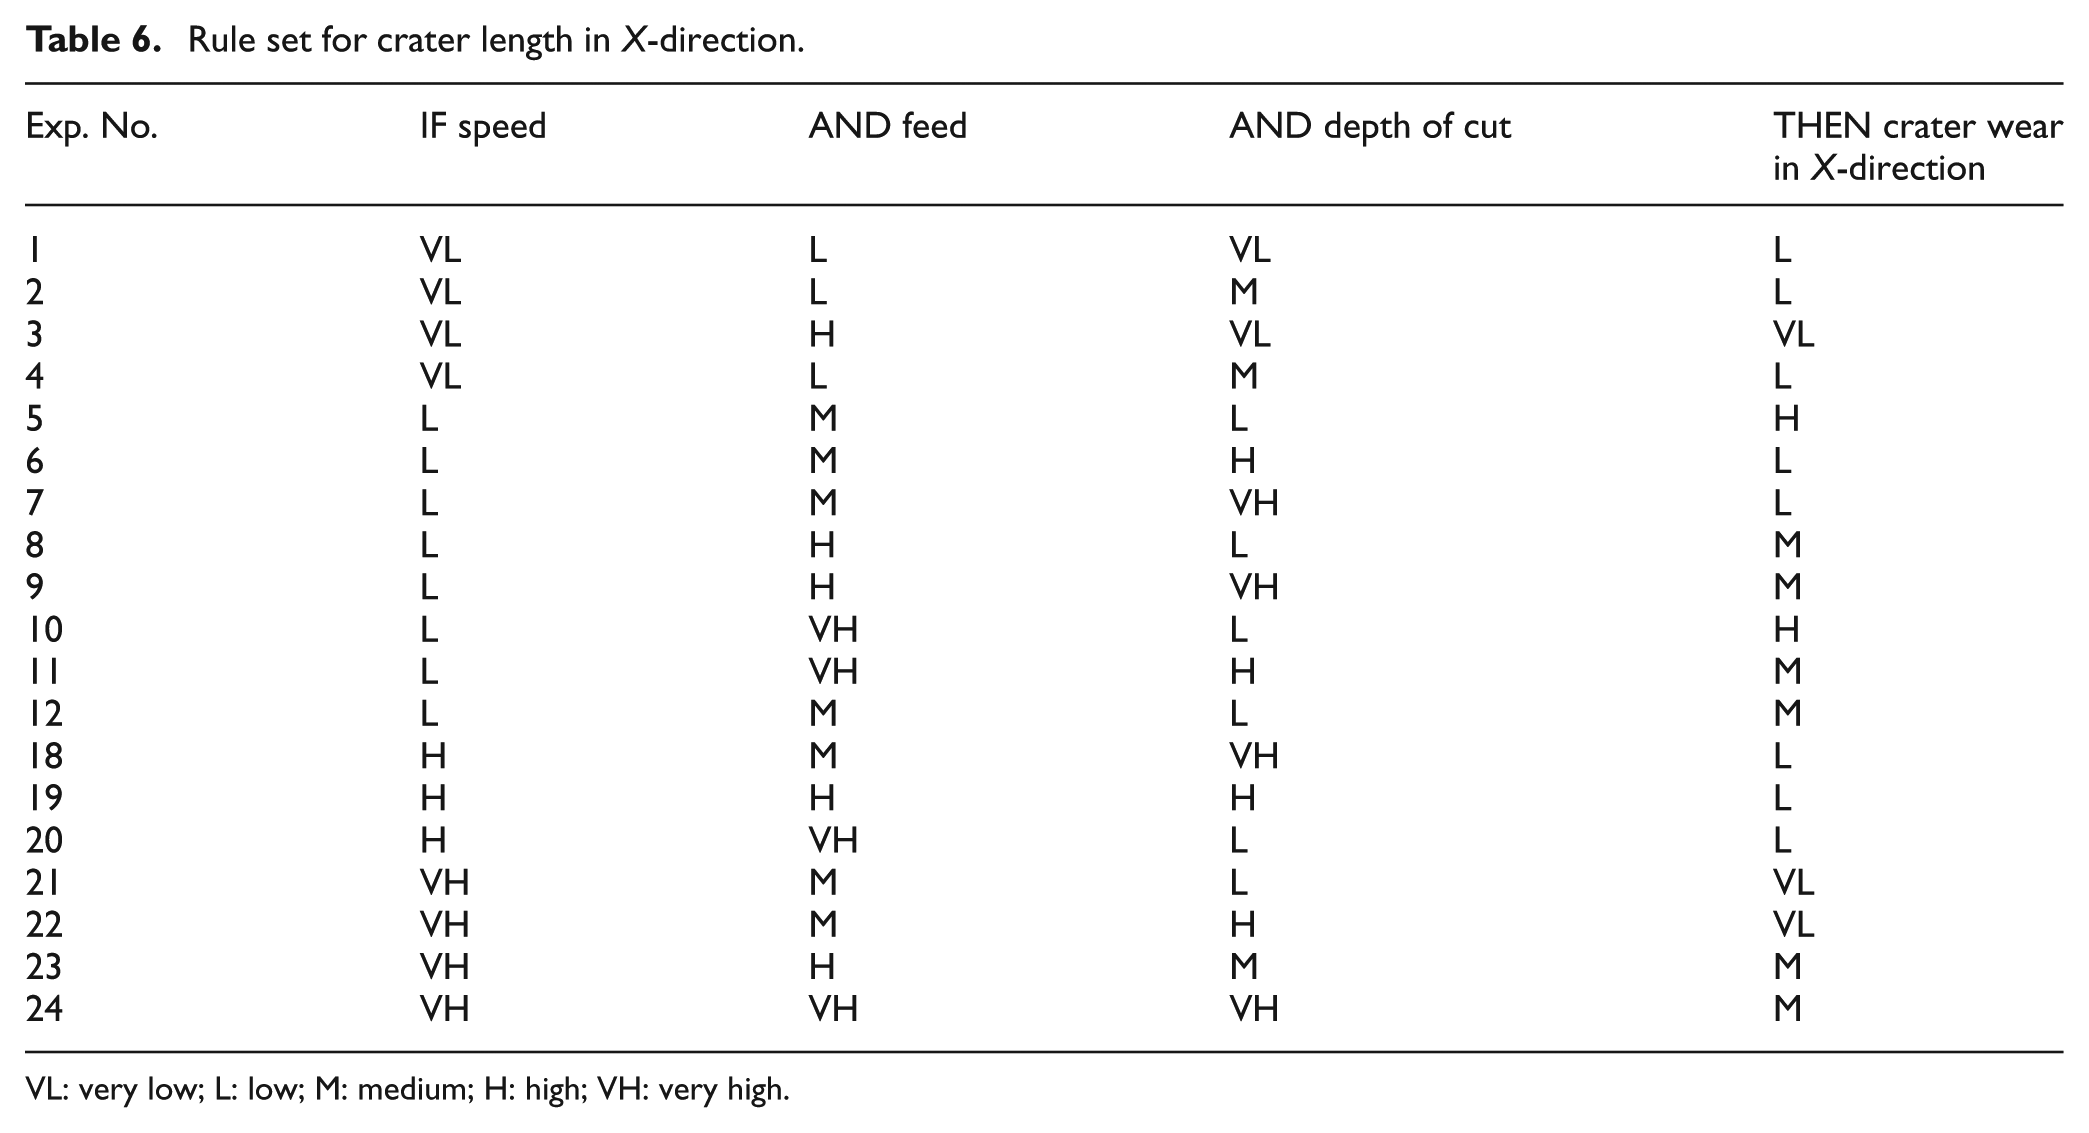
VL: very low; L: low; M: medium; H: high; VH: very high.
Development using Mamdani-type FIS
For the given
Edge chipping in X-direction Cx
Edge chipping in Y-direction Cy
Nose damage diagonally Nd
Crater wear length L toward X-direction Clx
Crater wear length L toward Y-direction Cly
The percentage error of each prediction is applied to ascertain the potency of the fuzzy model and it was computed based on equation (1)

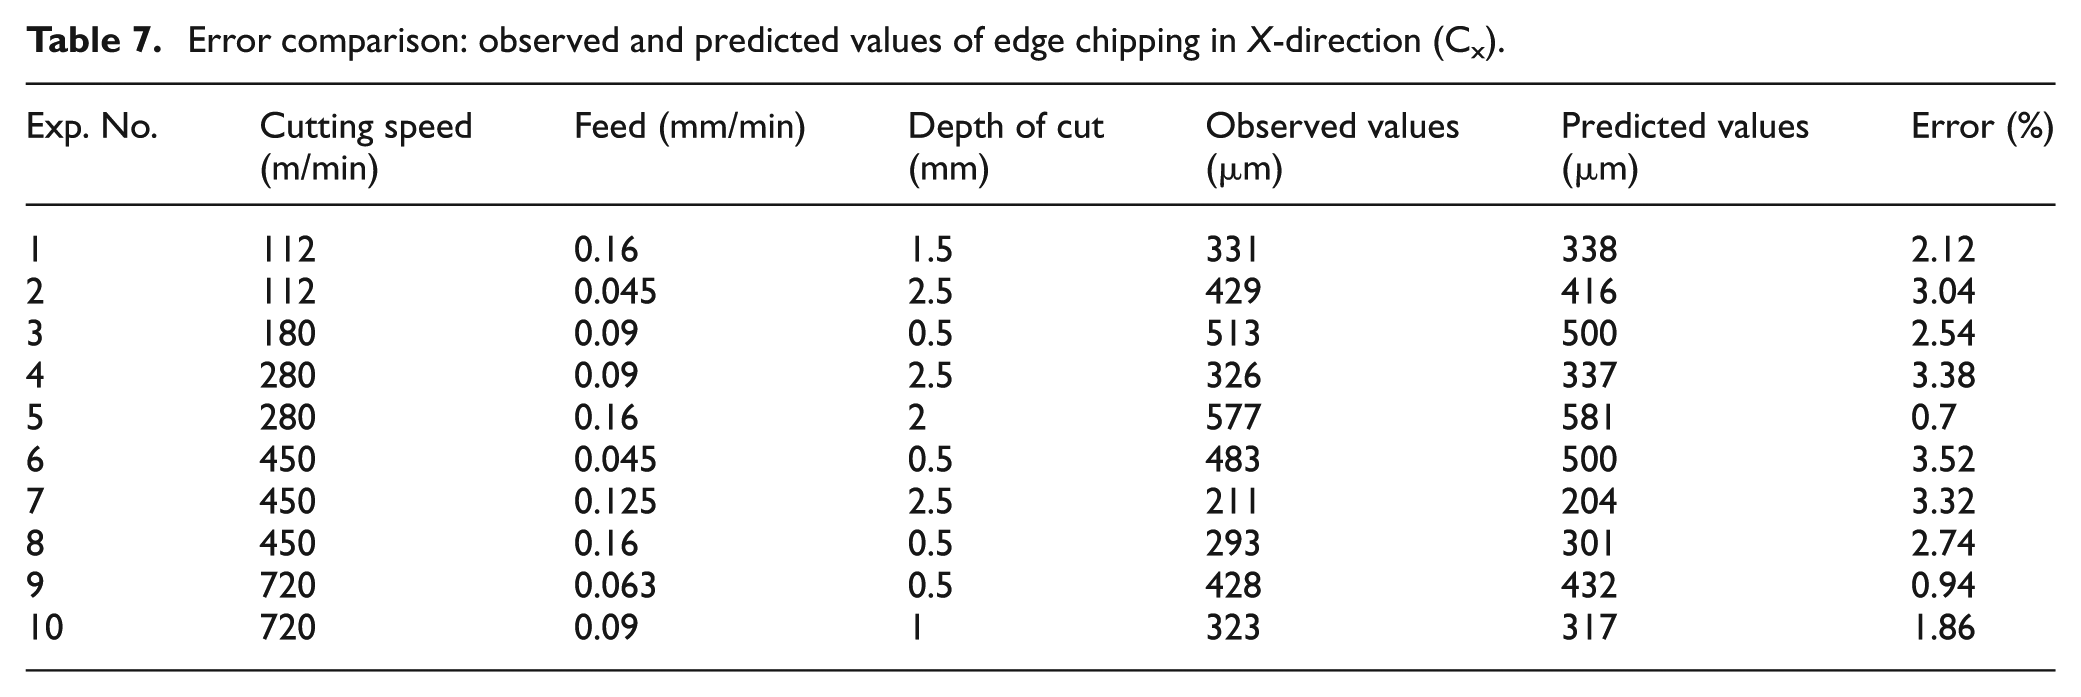
The observed and predicted values of each tested variable are compared for 10 different experiments conducted at various combinations of the machining parameters. The comparison of the observed and predicted values of edge chipping in X-direction (Cx) is presented in Table 7. The results clearly indicate that there is a good correlation between the predicted and observed values. The process is repeated for all the five output variables and the trend indicates that the results are statistically balanced.
Error comparison: observed and predicted values of edge chipping in X-direction (Cx).
The model variables were then plotted in histograms to provide better visualization and the details of the predictions are pictured in Figures (9)–(12) in which the values were found to fall on both sides of the trend-line proving that balanced and excellent fuzzy predictive models have been established.
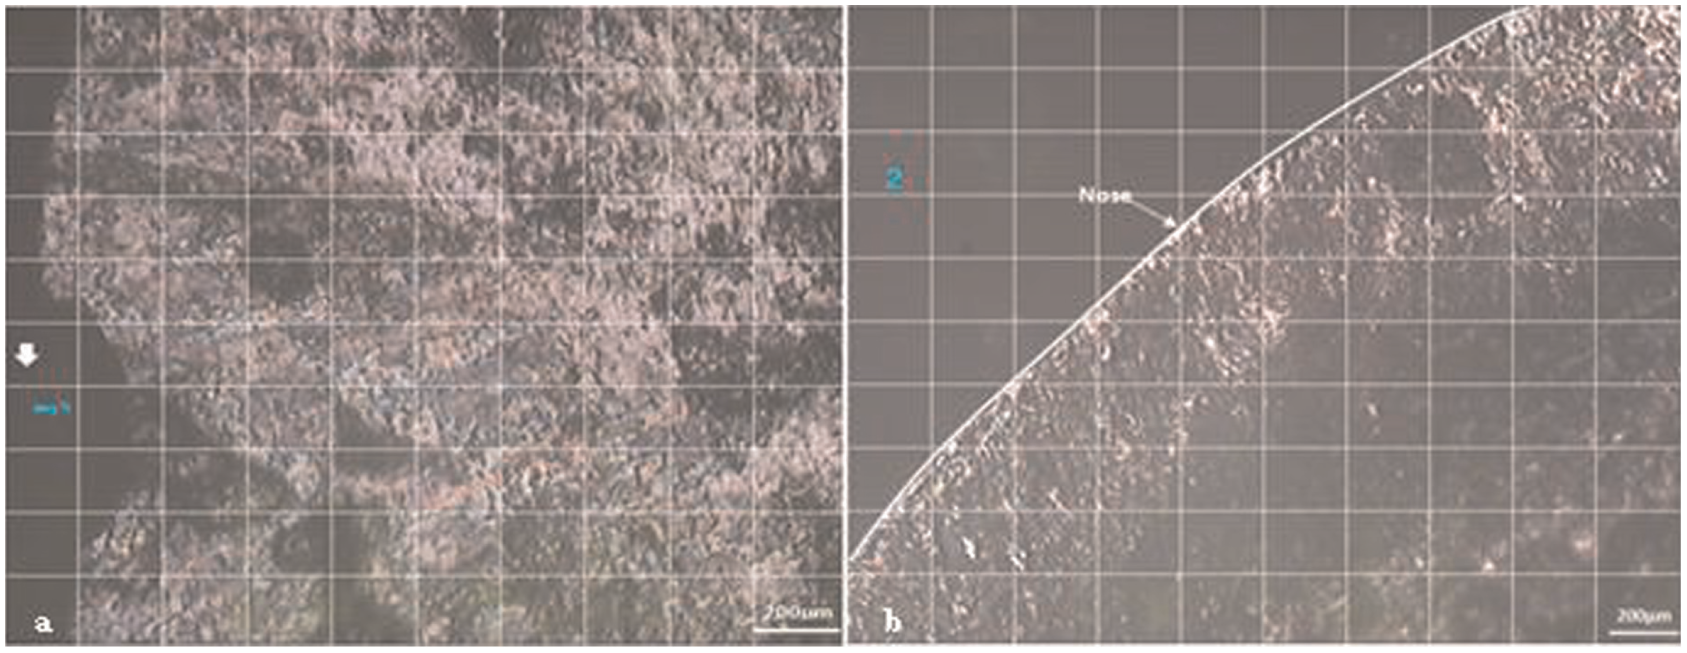
Digital images of (a) edge chipping and (b) crater wear under 1st and 10th of the tested machining conditions.
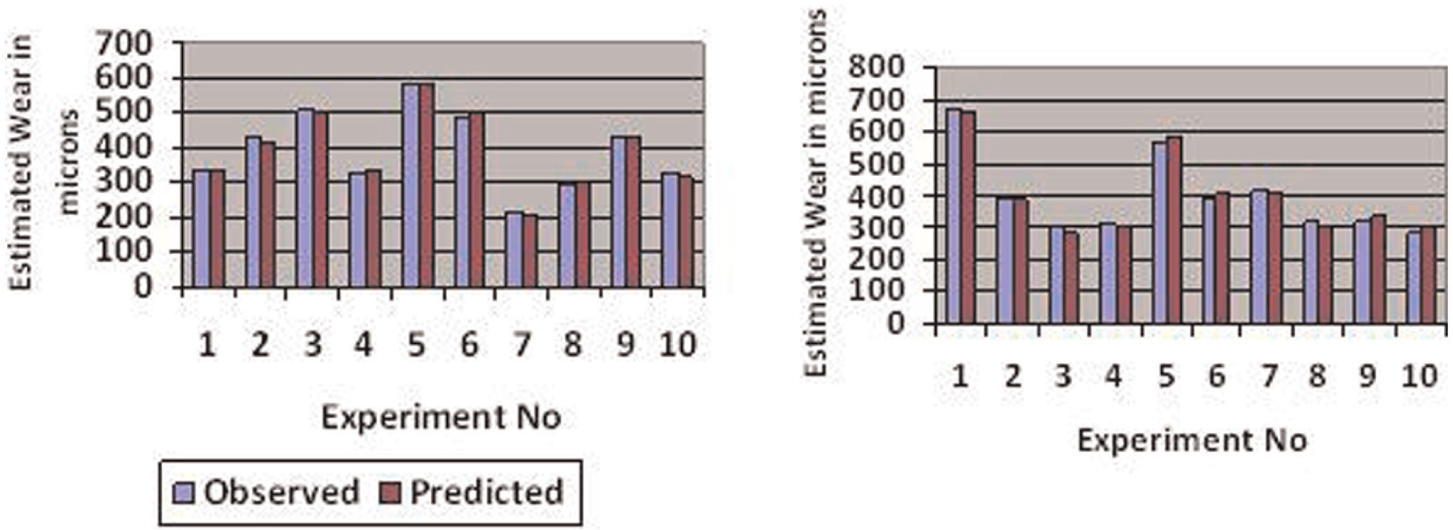
Histogram of observed versus prediction plot for edge chipping in X- and Y-directions.
Histogram of observed versus prediction plot for nose damage.
Histogram of observed versus prediction plot for crater wear in X- and Y-directions.
Results
Validation of the fuzzy model
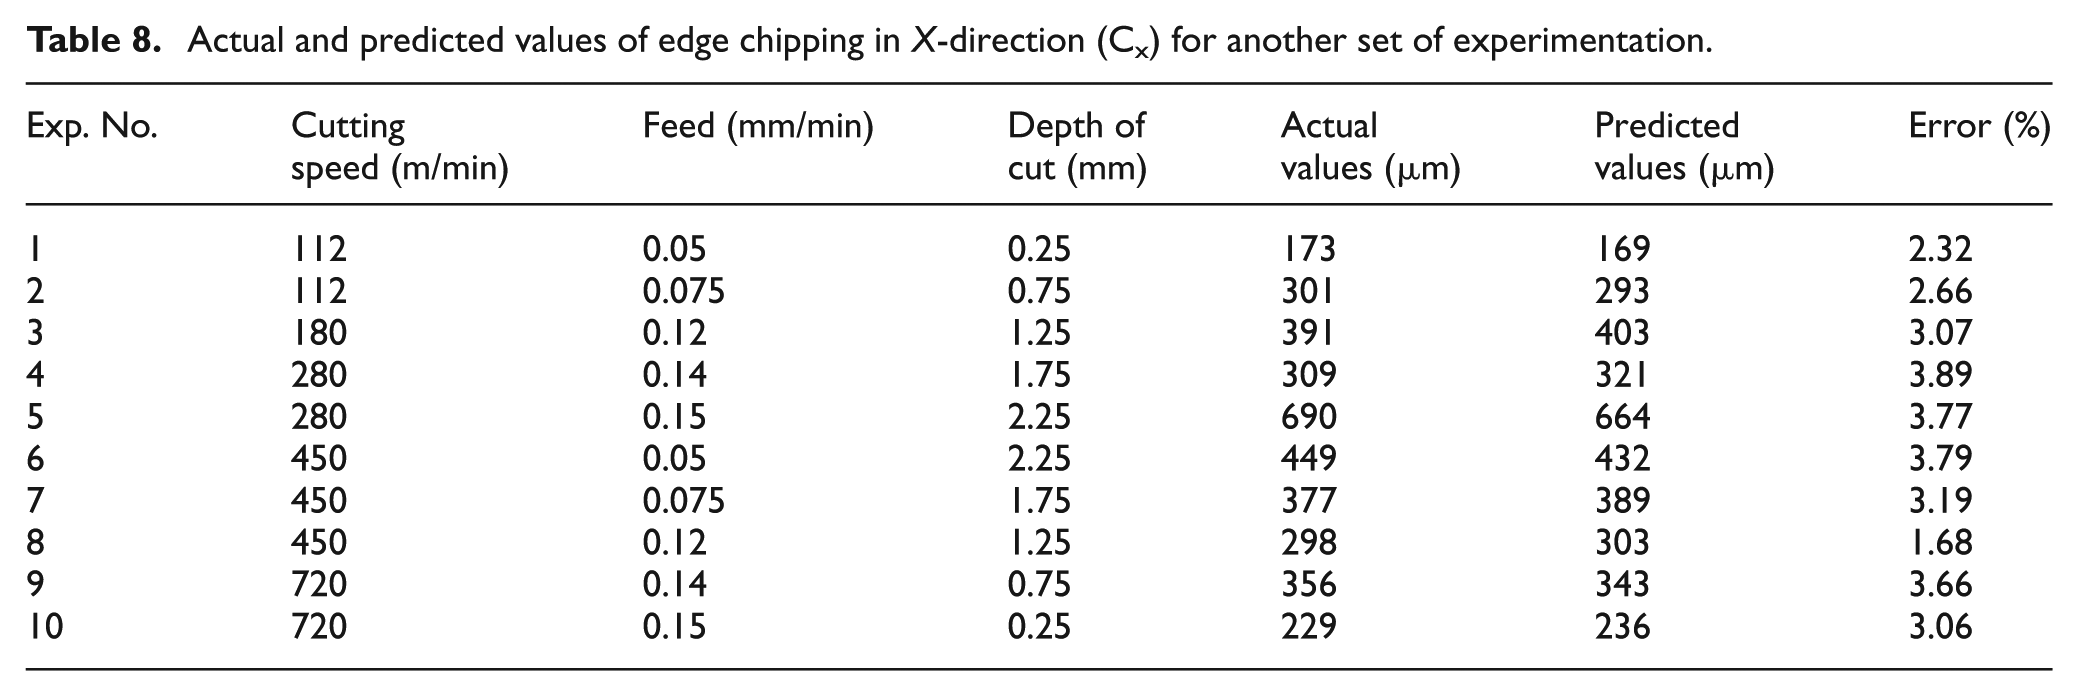
The actual and predicted values of each tested variable are compared for analysis and it is seen that the error between the results was at an acceptable limit of 0%–4%. To validate this, the experiment is repeated for 10 different combinations of the machining parameters, and in each case the edge chipping and crater wear values are measured. The comparison of the actual and predicted values of edge chipping in X-direction (Cx) is presented in Table 8. The results have shown the same phenomenon where the error was up to 4% as shown in histograms (Figures (13)–(15)).
Actual and predicted values of edge chipping in X-direction (Cx) for another set of experimentation.
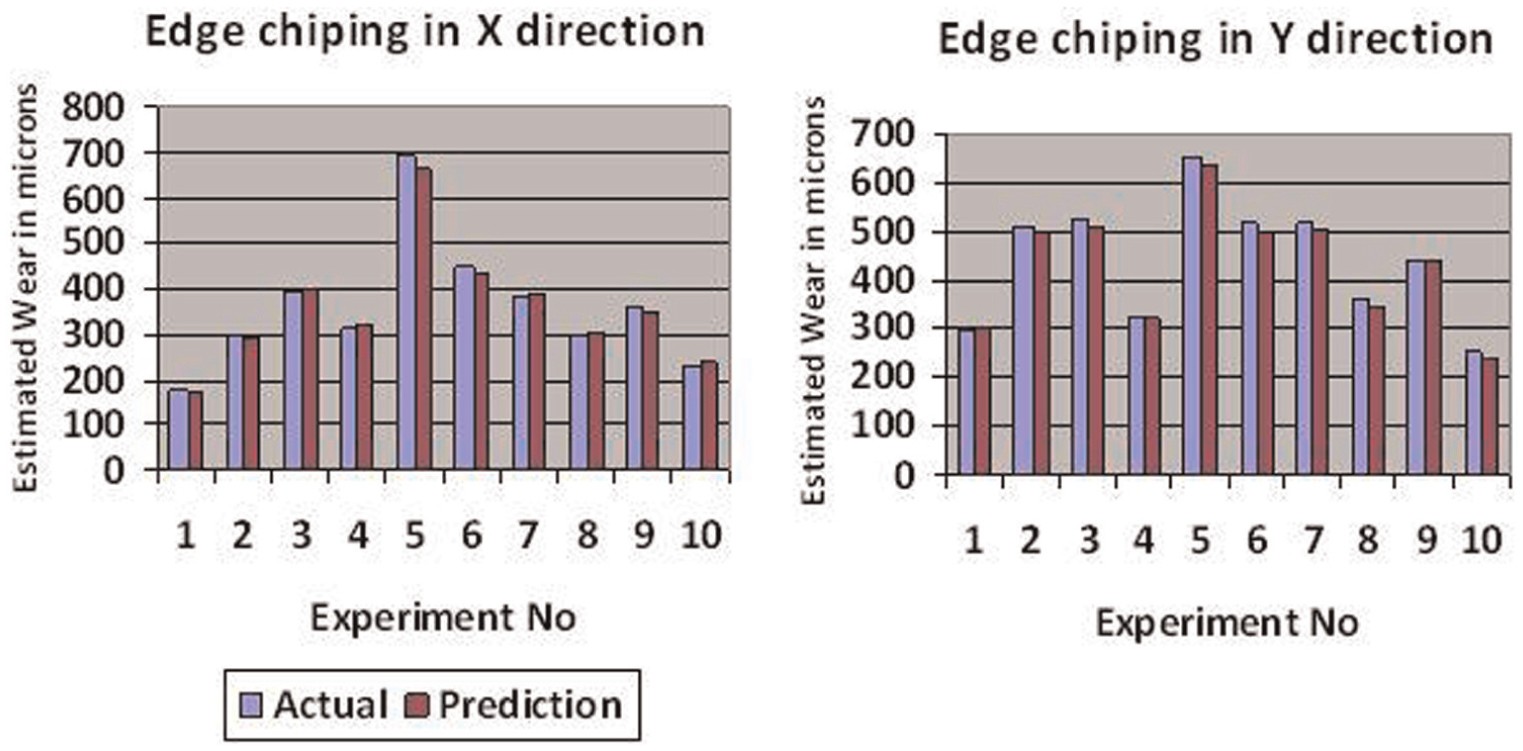
Histogram of actual versus prediction plot for edge chipping in X- and Y-directions for another set of experimentation.
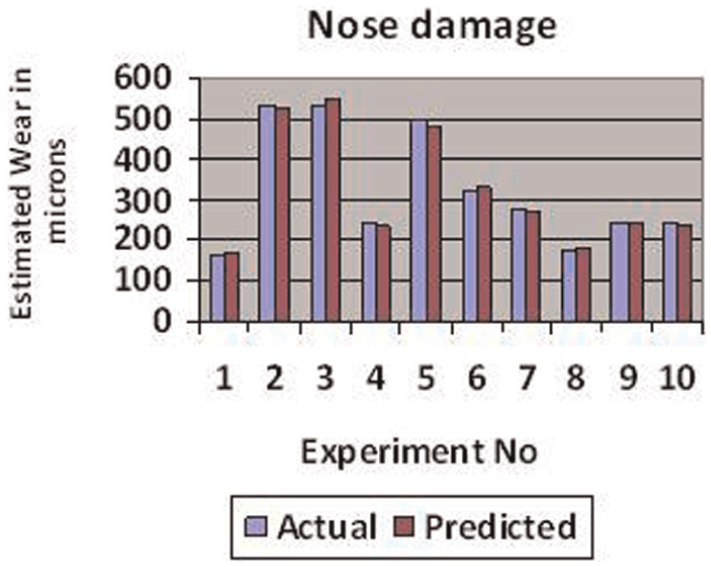
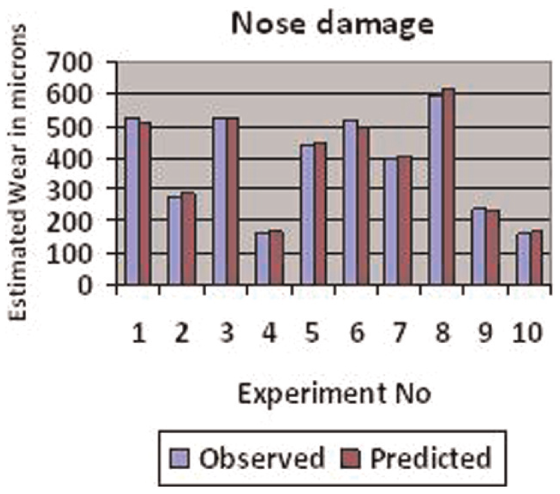
Histogram of actual versus prediction plot for nose damage for another set of experimentation.
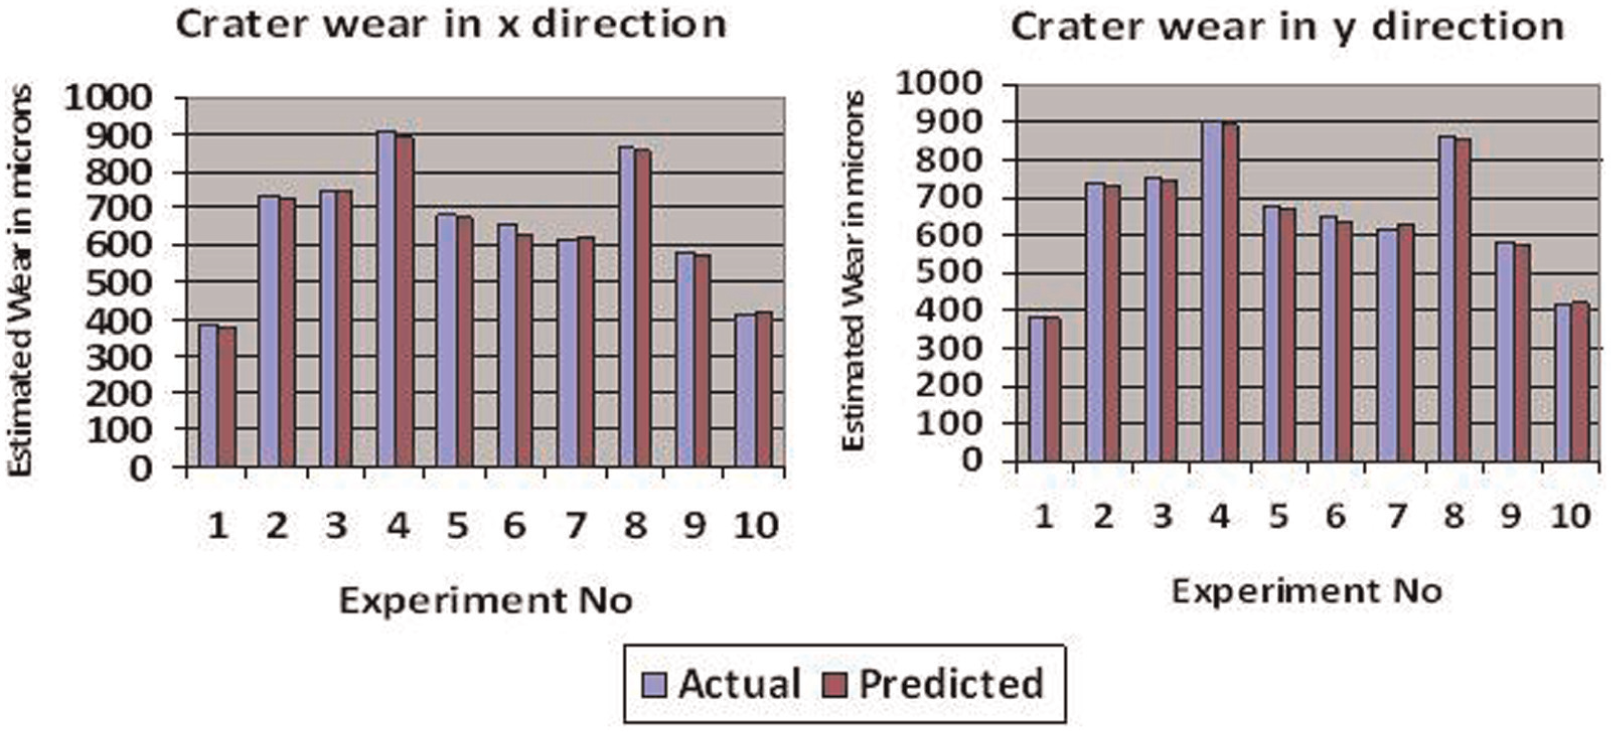
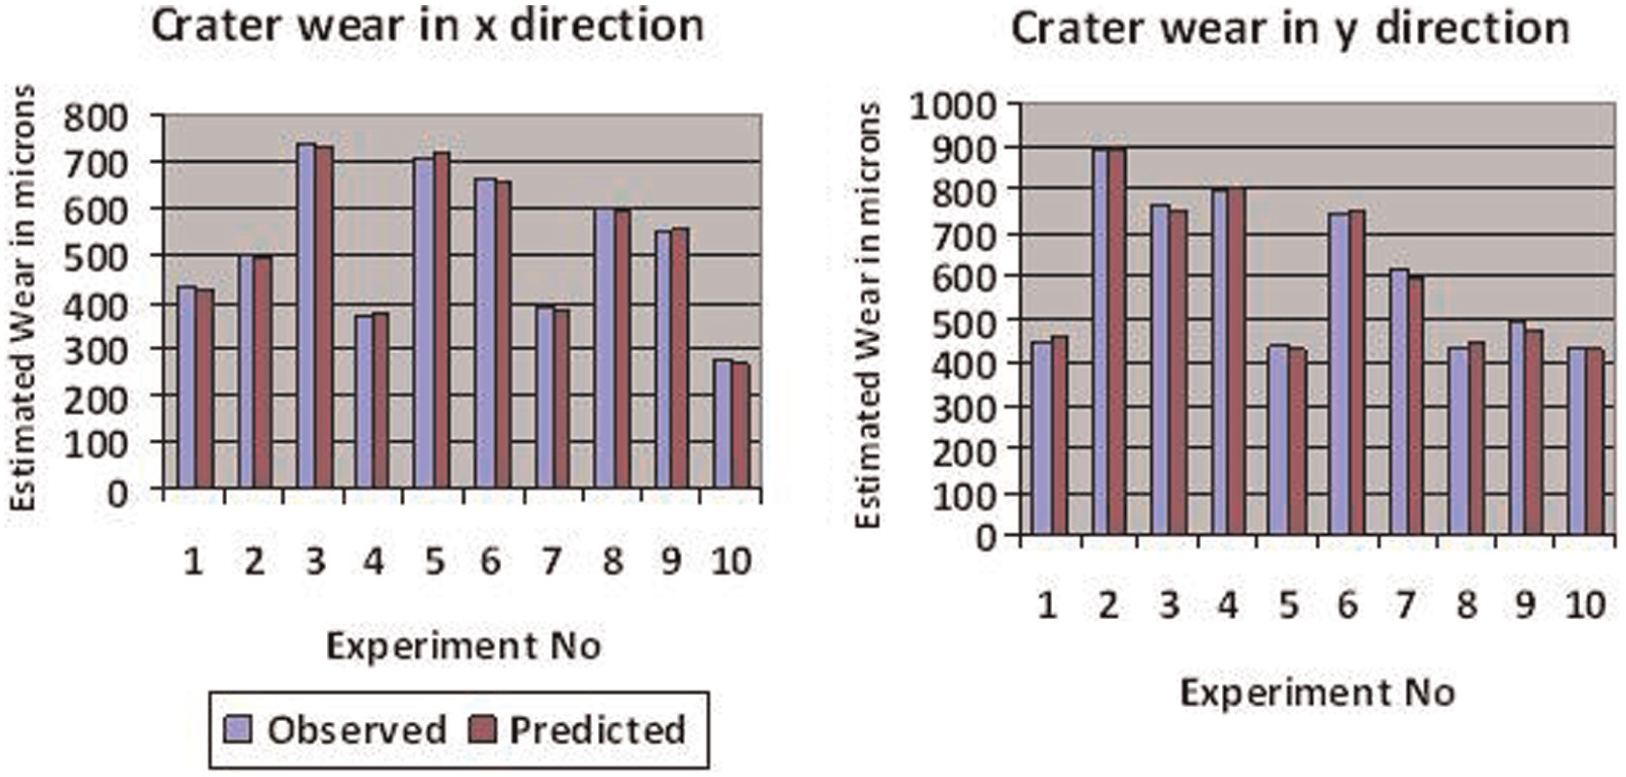
Histogram of actual versus prediction plot for crater wear in X- and Y-directions for another set of experimentation.
Taguchi design of experiments was helpful to arrange up the machining combinations without repetitions. Micro images were used to navigate the damaged surface area of the tool and to examine the type of wear at different locations. A diagonal separation method, an empirical method, was applied to quantify the damaged surface area, making the computational work easy. Based on the chipping and wear phenomena, the respective zones were identified. Analysis of rake face of the WC insert shows that the average area of crater wear was about 2.65 mm2 under low machining conditions and 2.325 mm2 under medium machining conditions. It is likewise mentioned that both edge chipping and crater wear slightly have increased under medium machining conditions as compared to low machining conditions. High machining conditions have shown that the average area of crater wear is about 2.25 mm2 which is less than low machining conditions.
Mamdani FIS model has been successfully developed as expected to predicted response by optimizing the fuzzy variables on MATLAB environment. The error obtained for the fuzzy model in all the cases is within the permissible limit.
Conclusion
In this article, identification, characterization and location of actual wear zones/regions on the rake face WC tools in terms of hard and soft zones close to the cutting edge were studied. An empirical method called diagonal separation technique was used to locate and measure the two-dimensional (2D) wear data, such as edge chipping, crater wear and nose damage values along the side and end cutting edges (X- and Y-directions). The main objective of the study is to determine the locations of various types of wear zones along the cutting edges. Then, a fuzzy model was developed and properly trained to predict the wear data. The repeatability of the established fuzzy model was good. The actual prediction of the fuzzy model in comparison with the experimental results showed that the average error of edge chipping, nose damage and crater wear was around 2.37% (X-direction), 3.01% (Y-direction), 2.86%, 2.66% (X-direction), and 1.89% (Y-direction), respectively.
The result of this study could be extended to develop a mathematical model with different machining conditions and the influence of significant factors and their ranking can be studied.
Footnotes
Acknowledgements
The authors acknowledge GMR Institute of Technology, Rajam, India, for providing technical facilities and assistance.
Declaration of conflicting interests
The author(s) declared no potential conflicts of interest with respect to the research, authorship and/or publication of this article.
Funding
The author(s) disclosed receipt of the following financial support for the research, authorship, and/or publication of this article: This work was supported by the DST-SERC (SR/S3/MERC/023/2009), Government of India.