
Abstract
A feedback control system for quality characteristics is one of the most crucial components in Taguchi’s on-line quality management. In this article, three problems in Taguchi’s on-line quality feedback control system are discussed. Furthermore, countermeasures for improving the system are proposed. First, the quality loss of products that are out of control is reestimated by approximating the probability density of their quality characteristic value to a linear distribution. Second, the quality loss of products that are under control is reestimated by approximating the probability density of their quality characteristic value to a normal distribution. Third, the decreased profit resulting from a process shutdown, which is excluded in Taguchi’s on-line quality feedback control system, is considered in calculating the adjustment cost. The management cost and quality loss constitute the total quality cost. In the improved on-line quality feedback control system, the optimal measurement interval and optimal administrative boundary are calculated by minimizing the total quality cost using an iterative method. An example of the adjustment of the administrative boundary and the measurement interval for manufacturing automobile parts is presented to illustrate the effectiveness of the improved on-line system.
Introduction
During the design, operation, and management of a manufacturing system, decisions are made according to quality. Chryssolouris 1 proposed a tetrahedral decision-making model for manufacturing systems comprising cost, time, quality, and flexibility, which are the main factors affecting decision-making. These factors were used as objective functions during the design and operation of manufacturing systems. On the basis of the tetrahedral model, Arimoto et al. 2 proposed a comprehensive evaluation and decision-making model for manufacturing systems. Liu and Sun proposed a pentagonal decision-making model which contains cost, time, quality, flexibility, and environment. In this model, the environment includes many factors such as ecology, resources, occupational health, and safety, reflecting the strong relationship between modern manufacturing systems and the current concerns regarding resources, the environment, and population worldwide. 3 Research has shown that people pay considerable attention to quality in manufacturing systems.
The design and management of on-line quality feedback control systems for quality control in a manufacturing system have been a topic of continuing discussion. Box and Alberto 4 proposed automatic process control, in which a feedback control technique is used in manufacturing systems to compensate for deviations from the target process and reduce fluctuations to achieve the design goal. Lin et al. 5 achieved the optimization of a stability process control using the parameter design of Taguchi’s quality engineering. Dasgupta et al. 6 proved the effectiveness of a feedback control model by optimizing the parameter design of the control system. Using canned soft drinks as an example, Dasgupta and Jeff Wu 7 studied the advantages of quality feedback control using the robust parameter design. Jun and Guo 8 proposed a novel process quality control system that combined hardware and software techniques and involved computer technology and on-line detection technology; the control system was based on mathematical statistics and a control method. Islam and Liu 9 proposed a robust adaptive fuzzy output feedback control system for a mechanical manipulator gunner, thereby advancing research on applications of quality feedback control systems.
Researchers have also conducted several studies on human intervention in quality feedback control systems when automatic control technology is not applicable in manufacturing systems. The main focus of these studies was to identify the optimal administrative boundary and optimal measurement interval in quality feedback control systems; these parameters reflect the economic characteristics of process quality control. First, regarding the determination of the optimal administrative boundary, Shewhart 10 mapped the world’s first control chart and presented statistical process control (SPC) theory. Unfortunately, the assumption of uncorrelated or independent observations in SPC is not even approximately satisfied in some manufacturing processes. Later, Alwan and Roberts 11 and Wang et al. 12 conducted studies on modeling and fitting time-series effects and serial correlated interactions of SPC. MacGregor and Kourti 13 and Ferrer 14 conducted detailed studies on SPC with multiple variables. Yasir et al. 15 proposed a novel framework using multivariate statistical process control (MSPC) to complete control system with fault detection and correction. Through a literature survey, Laura and Barrueto 16 and Thor et al. 17 reviewed the application of SPC theory in the emergency department and food processing industries. Moreover, many researchers such as Choi and Lee 18 conducted studies on different aspects of the quality control system and drew various conclusions. Dodge and Roming established sampling inspection theory, which mainly entails effectively controlling the risks between producers and consumers through the use of mathematical statistics theory.
It is generally accepted that the use of SPC theory and sampling inspection has greatly improved the process of quality control in manufacturing systems.19–22 However, these theories statistically set the control boundary of the quality target as an external variable, and they do not provide a detailed explanation from the viewpoint of economics. Researchers such as Hald have emphasized that many factors such as the testing fee, prior distribution of the quality characteristics of the inspected product, economic loss of accepting unsatisfactory products, and effect of rejecting satisfactory products could influence sample inspection. Moreover, theoretically, a Bayesian sampling program can be used to reduce the total quality cost. However, researchers have focused on probability and risk studies and still treated the administrative boundary or the specification limit as an independent and exogenous variable.
Feigenbaum 23 proposed a quality cost model that linked product quality and an enterprise’s economic efficiency and systematically analyzed the quality cost during and after the manufacturing process, improved the theory of quality control, and altered the concept of quality control during business administration. Omachonu et al. 24 and Schiffauerova and Thomson 25 have conducted many supplemental studies on defining and measuring quality cost from different perspectives. These comprehensive studies have examined management cost and economic loss by focusing on the corporate level and on the basis of accounting requirements. However, they did not consider individual products.
Taguchi’s on-line quality feedback control system improved the quality cost model. On the basis of his theories of system design, parameter design, and tolerance design and by considering the quality loss function and signal-to-noise ratio, Taguchi developed an on-line quality feedback control system. Taguchi also considered the theory of total cost minimization, system-integrated administrative cost (including measurement cost and adjustment cost), and quality loss (including loss of controlled and uncontrolled products) to determine the optimal measurement interval and optimal administrative boundary.26–29 Taguchi’s on-line quality feedback control system is a crucial component of his theories and improves the economy of quality control. Hence, it is widely used globally. Several researchers have used Taguchi’s on-line quality feedback control system.30,31 However, some aspects have been questioned by some academic scholars, and Taguchi’s on-line quality feedback control system is not sufficiently rigorous.32,33 Researchers are attempting to improve it, but their focus is mainly on the quality loss function and not on the on-line quality feedback control system.34,35 A few scholars have identified problems related to the distributional assumption of a product’s quality characteristic value and the estimation of the rate of nonconformance in Taguchi’s on-line quality feedback control system; these problems greatly affect the effectiveness of the system.
In this study, problems in Taguchi’s on-line quality feedback control system were analyzed to construct a more effective system for process quality control. An example of an adjustment of the administrative boundary and measurement interval for manufacturing automobile parts is presented to illustrate the effectiveness of the improved on-line quality feedback control system.
Taguchi’s on-line quality feedback control system and its problems
Taguchi’s on-line quality feedback control system
Taguchi’s on-line quality feedback control system is generally used to determine whether a manufacturing procedure must be changed after the inspection of product quality characteristics. It consists of two modules: sampling inspection and procedure adjustment. If the quality characteristics of the products are within the administrative boundary, the procedure remains unchanged; otherwise, the procedure is changed to ensure that the products are satisfactory and within the administrative boundary.
On the basis of the management cost, quality loss, and overall economic analysis of process quality control, Taguchi established a comprehensive quality cost function for his on-line quality feedback control system and determined the optimal process condition (the optimal measurement interval and the optimal administrative boundary) that provided an effective guidance for process quality control. This theory later served as a basis of Taguchi’s on-line quality feedback control system. The technological procedure of Taguchi’s on-line quality feedback control system is shown in Figure 1.
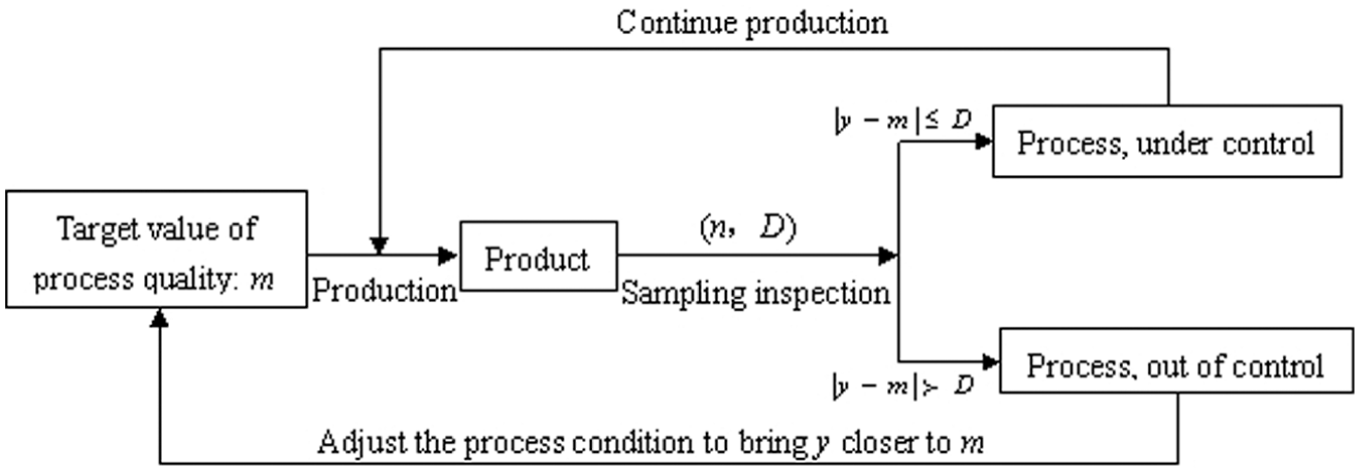
Taguchi’s on-line quality feedback control system.
The variable y is the real value of the quality characteristics, m is the target value, and
The objective of this on-line quality feedback control system is to solve two problems: determining the optimal measurement interval n and obtaining the optimal administrative boundary D. In other words, the objective is to identify an effective program for determining n and D. Relevant variables (n, l, m, D, and Δ) in Taguchi’s on-line quality feedback control system are shown in Figure 2.
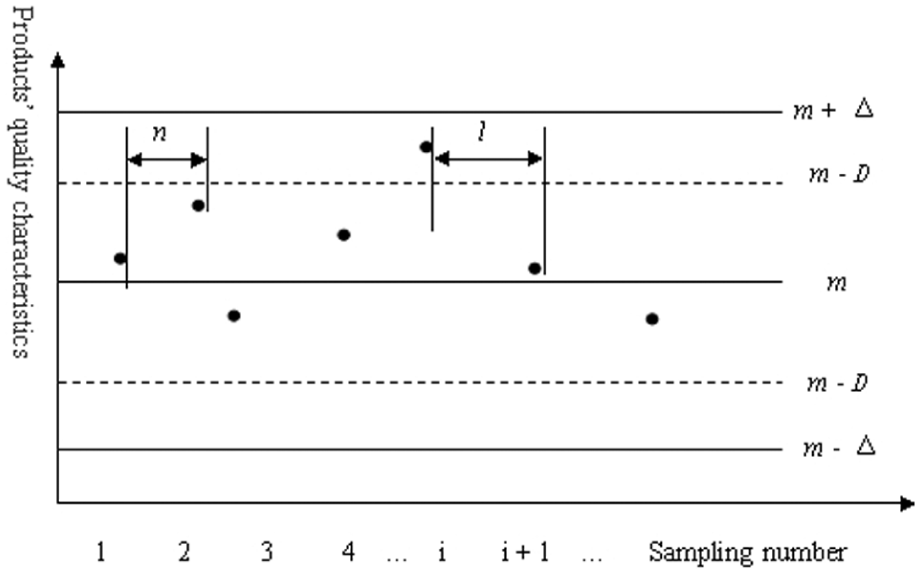
Relevant variables n, l, m, D, and Δ in Taguchi’s on-line quality feedback control system.
The parameters in Figure 2 are defined as follows:
A: quality loss of the nonconformant product outside the specification limit
B: measurement cost for each unit of a product, including the equipment fee, the time cost of inspection staff, and necessary accessories.
C: adjustment cost for each unit of a product, referring to the total cost of the adjustment required for restoring an out-of-control process to the normal state during a process shutdown, namely, when the quality characteristic value y for the product being produced is beyond the administrative boundary
n0: current measurement interval.
u0: current average adjustment interval.
D0: current administrative boundary.
l: time lag. In other words, it is the measurement time required when the process is diagnosed as abnormal on the basis of sample tests conducted for determining the number of defective items produced when the production process is stopped (in a given procedure, the longer the diagnostic time, the greater the L value).
D: optimal administrative boundary.
When y for a product in production is beyond the specification limit

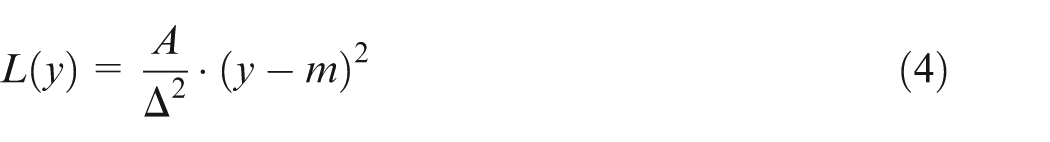
and the quality loss A caused by the function

Therefore, Taguchi’s quality loss function is
Because B is the measurement cost and n is the measurement interval, the measurement cost per unit of a product is B/n. Because C is the adjustment cost and u is the average adjustment interval, the adjustment cost per unit of a product is C/u. Hence, the sum of B/n and C/u is the management cost per unit of the product.
If it is assumed that the quality characteristic values of products under control (their quality characteristic values within the administrative boundary
When the quality characteristic value exceeds the administrative boundary
According to equation (1) and the measurement error variance
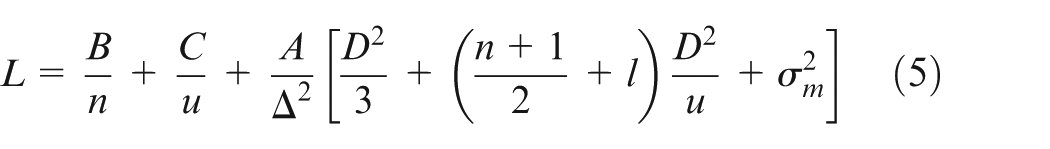
When the values of n, u, and D are changed to current values n0, u0, and D0, according to equation (5), the total quality cost for the current condition becomes
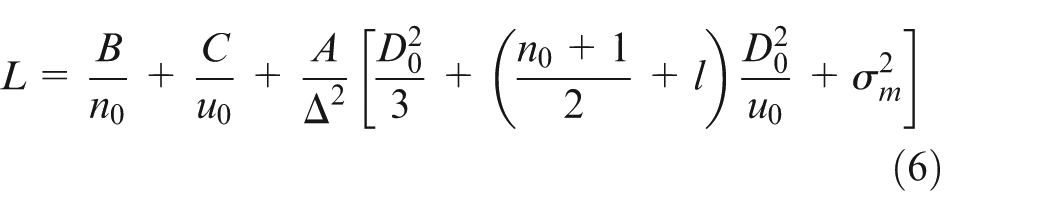
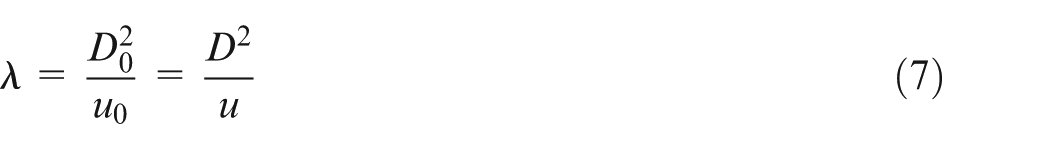
If the variations in the quality characteristic values of products are considered to be caused by the overlapping of independent fluctuations and show a random distribution or Brownian motion, and that the effects of the positive and negative sides are identical, then it can be assumed that the adjustable boundary u is proportional to the square of the administrative boundary D, that is
Therefore, equation (5) can be converted to
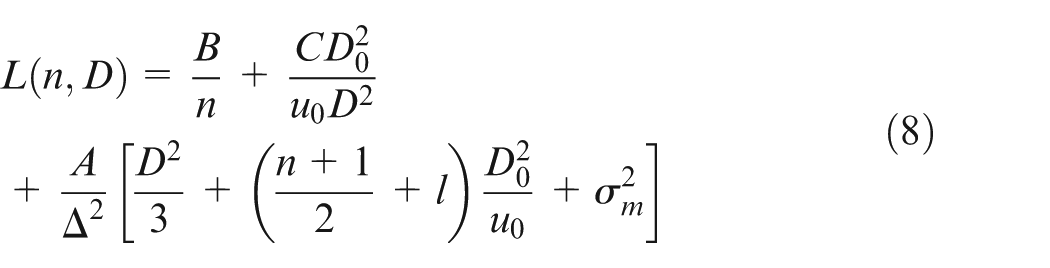
Here, there are two unknown parameters: the measurement interval n and the administrative boundary D.
According to the relation
Then, n and D can be calculated using the following expressions
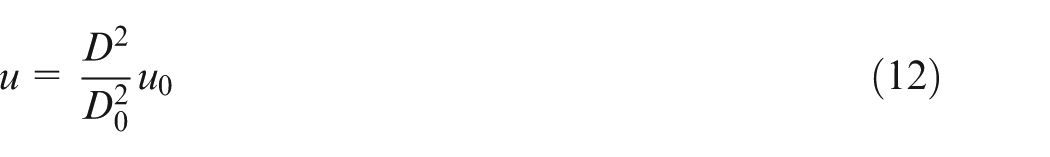
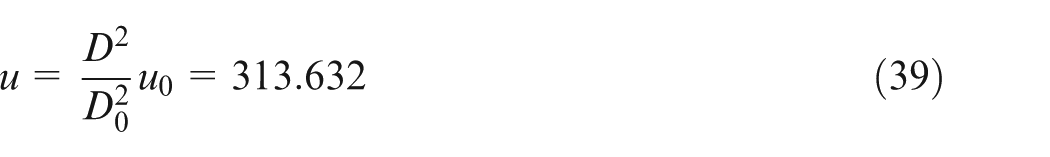
According to equation (7), the optimal adjustment interval u can be calculated as follows
Problems in Taguchi’s on-line quality feedback control system
Taguchi’s on-line quality feedback control system is a highly effective tool. However, there are problems in its practical use.
First, when products are out of control, their quality characteristic values are regarded as being within the administrative boundary
Second, the sum of the under-control product ratio (which is 1) and the out-of-control product ratio
Third, when the quality characteristic values of the out-of-control products exceed the administrative boundary
Optimization of Taguchi’s on-line quality feedback control system
Assumption of the distribution of products’ quality characteristic values
Without loss of generality, it is often assumed that the tolerance of products during production is given by
Assuming that the quality characteristic values of products during production follows the normal distribution, the probability density curve is given as
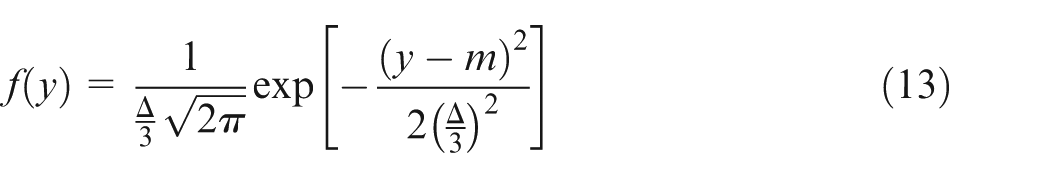
Therefore,
Normal distribution curve of product quality characteristic value.
Optimization of Taguchi’s on-line quality feedback control system
Taguchi’s on-line quality feedback control system was optimized to alleviate the aforementioned three problems. Subsequently, the total quality cost function for the improved on-line quality feedback control system was established. The optimal measurement interval n and the optimal administrative boundary D were calculated by minimizing the total quality cost using the iterative method.
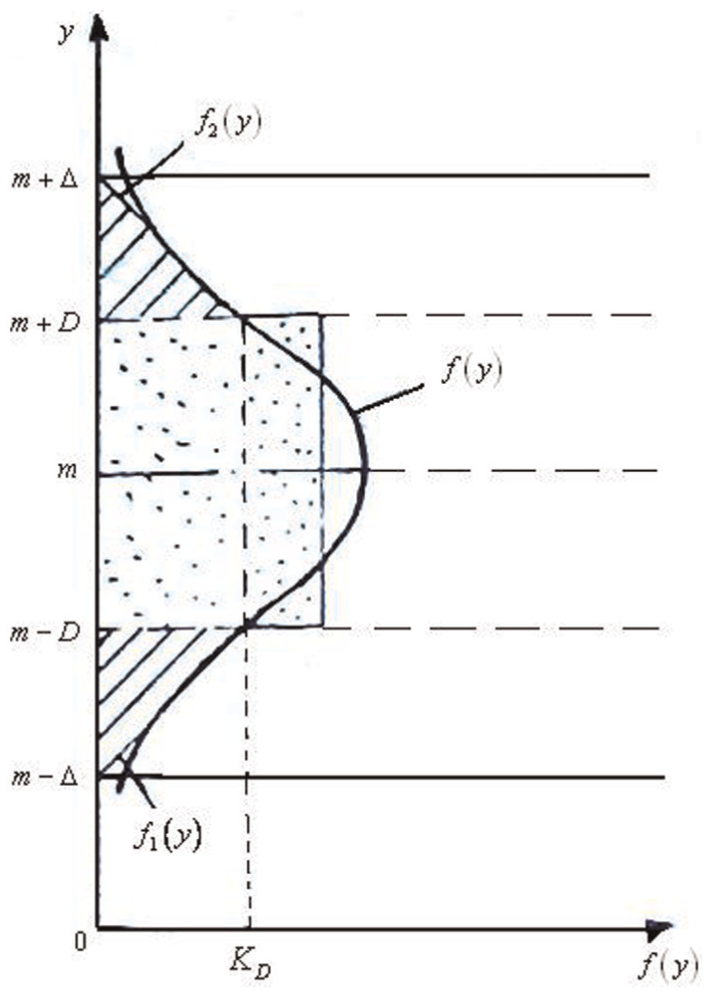
First, approximating the probability density of the quality characteristic value of the out-of-control products as a linear function for reestimating the quality loss of the out-of-control products requires the quality characteristic value to lie within the interval defined by
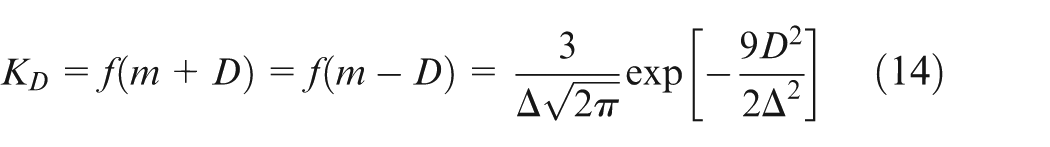
The probability density of the upper or lower limits of the probability density curve of products’ quality characteristic values during production is denoted by KD, and it is calculated as follows
Assuming that f(y) is a linear function in the interval between the administrative boundary and specification limit, the linearity should be
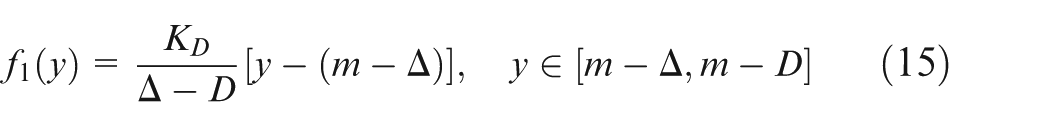
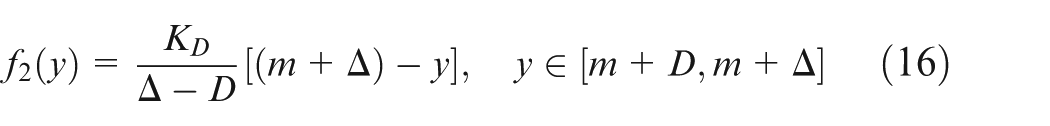
The probability density function can be transformed using formulas (15) and (16)
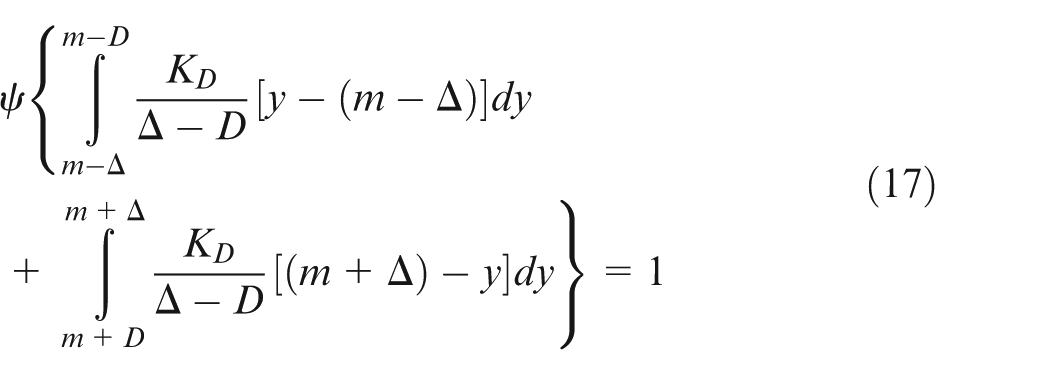
That is
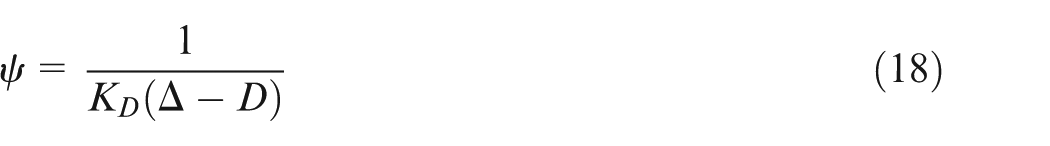
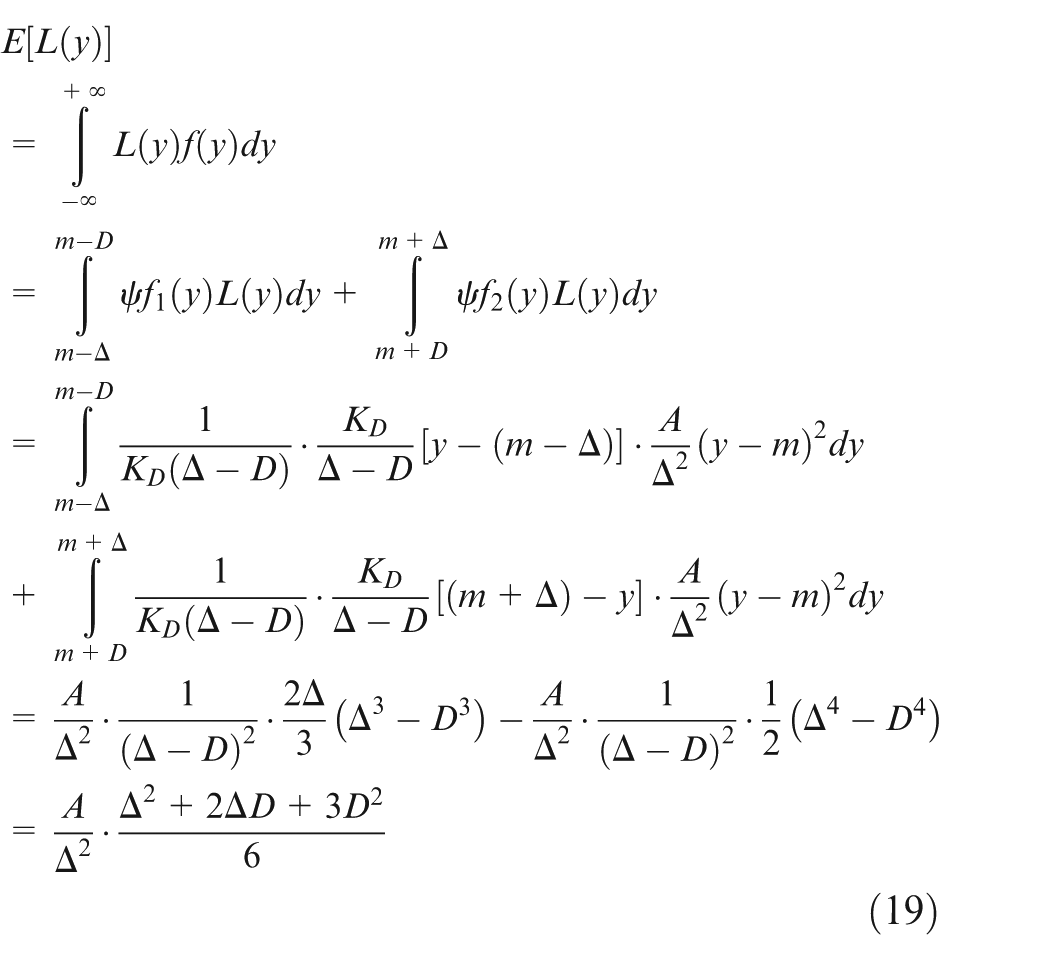
According to this expression, the expected quality loss of which the quality characteristic value falls within the interval
Second, the quality loss of under-control products is reestimated by assuming that the probability density of their quality characteristic value is normally distributed. This also implies that the quality characteristic values fall in the interval defined by m − D and m + D. During the original calculation of the quality loss of under-control products, the interval of the quality characteristic values is assumed to follow an even distribution, and its variance is D2/3; moreover, the under-control product ratio is considered to be 1. However, the probability of the quality characteristic values falling within the management limit interval (m − D, m + D) is not 1, and it should be
Hence, the expected loss of the quality characteristic values falling within the interval (m − D, m + D) should be
Third, it is assumed that C1 is the decreased profit resulting from production shutdown associated with process adjustment, and C1 is used in calculating the quality loss. This implies that the original adjustment cost
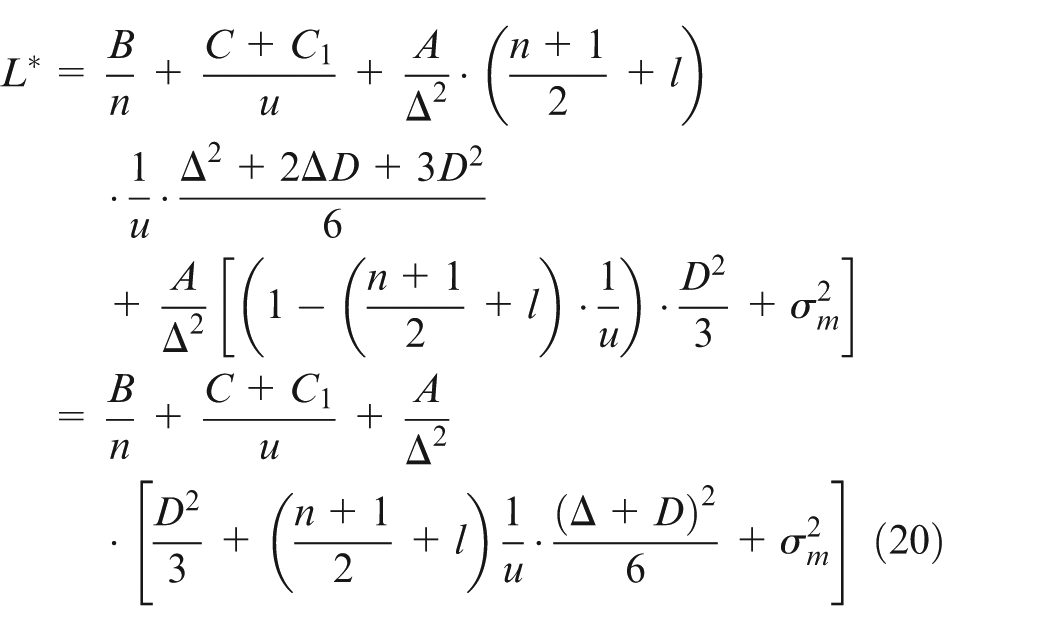
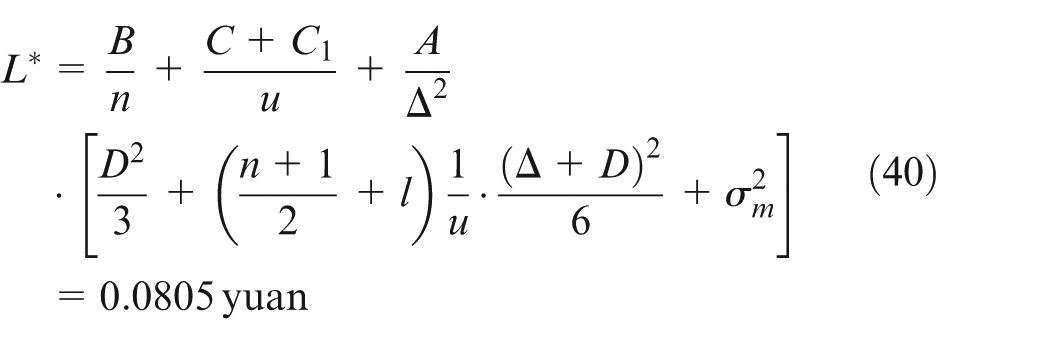
In summary, the total quality cost function per unit of a product in the improved on-line quality feedback control system is as follows
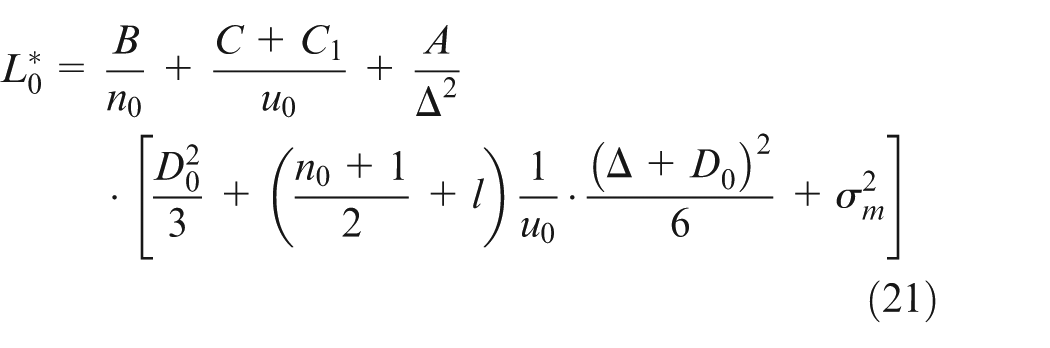
When the values of n, u, and D are changed to the current values n0, u0, and D0 in equation (20), the total quality cost in the current state is
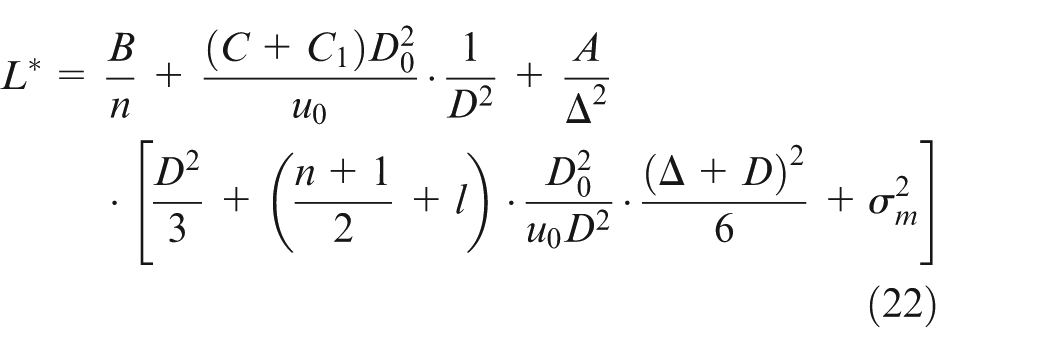
Similar to the assumption in Taguchi’s on-line quality feedback control system, the assumption that the relationship between the adjustment interval u and the square of the management limit is linear was applied to obtain the relation
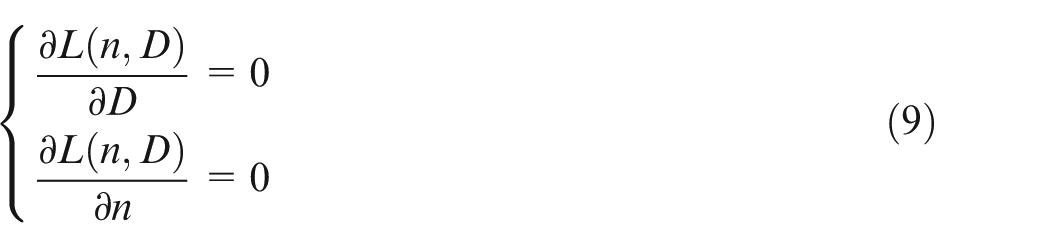
Partial derivatives of n and D are then determined using this formula to obtain the following equation set
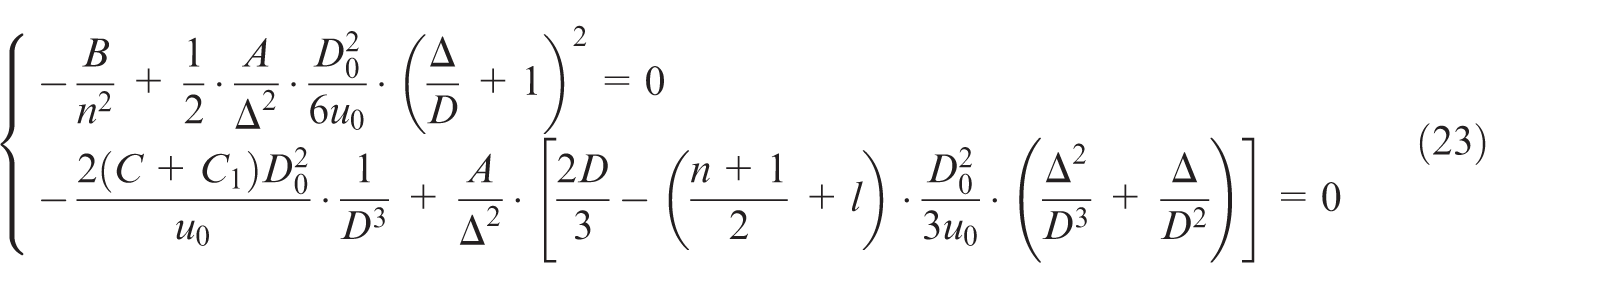
where
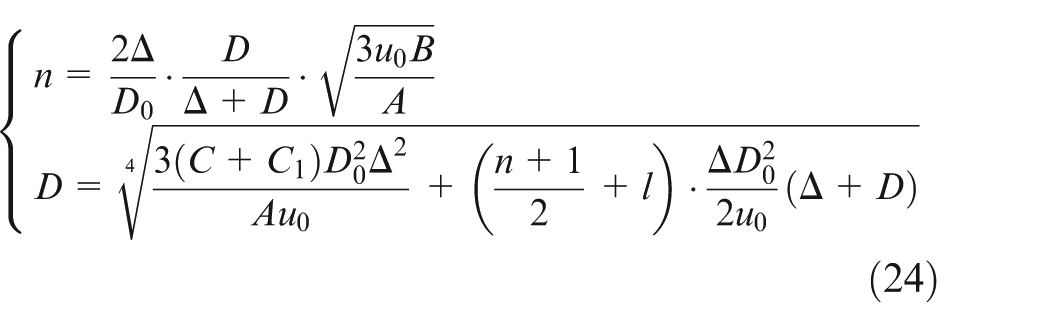
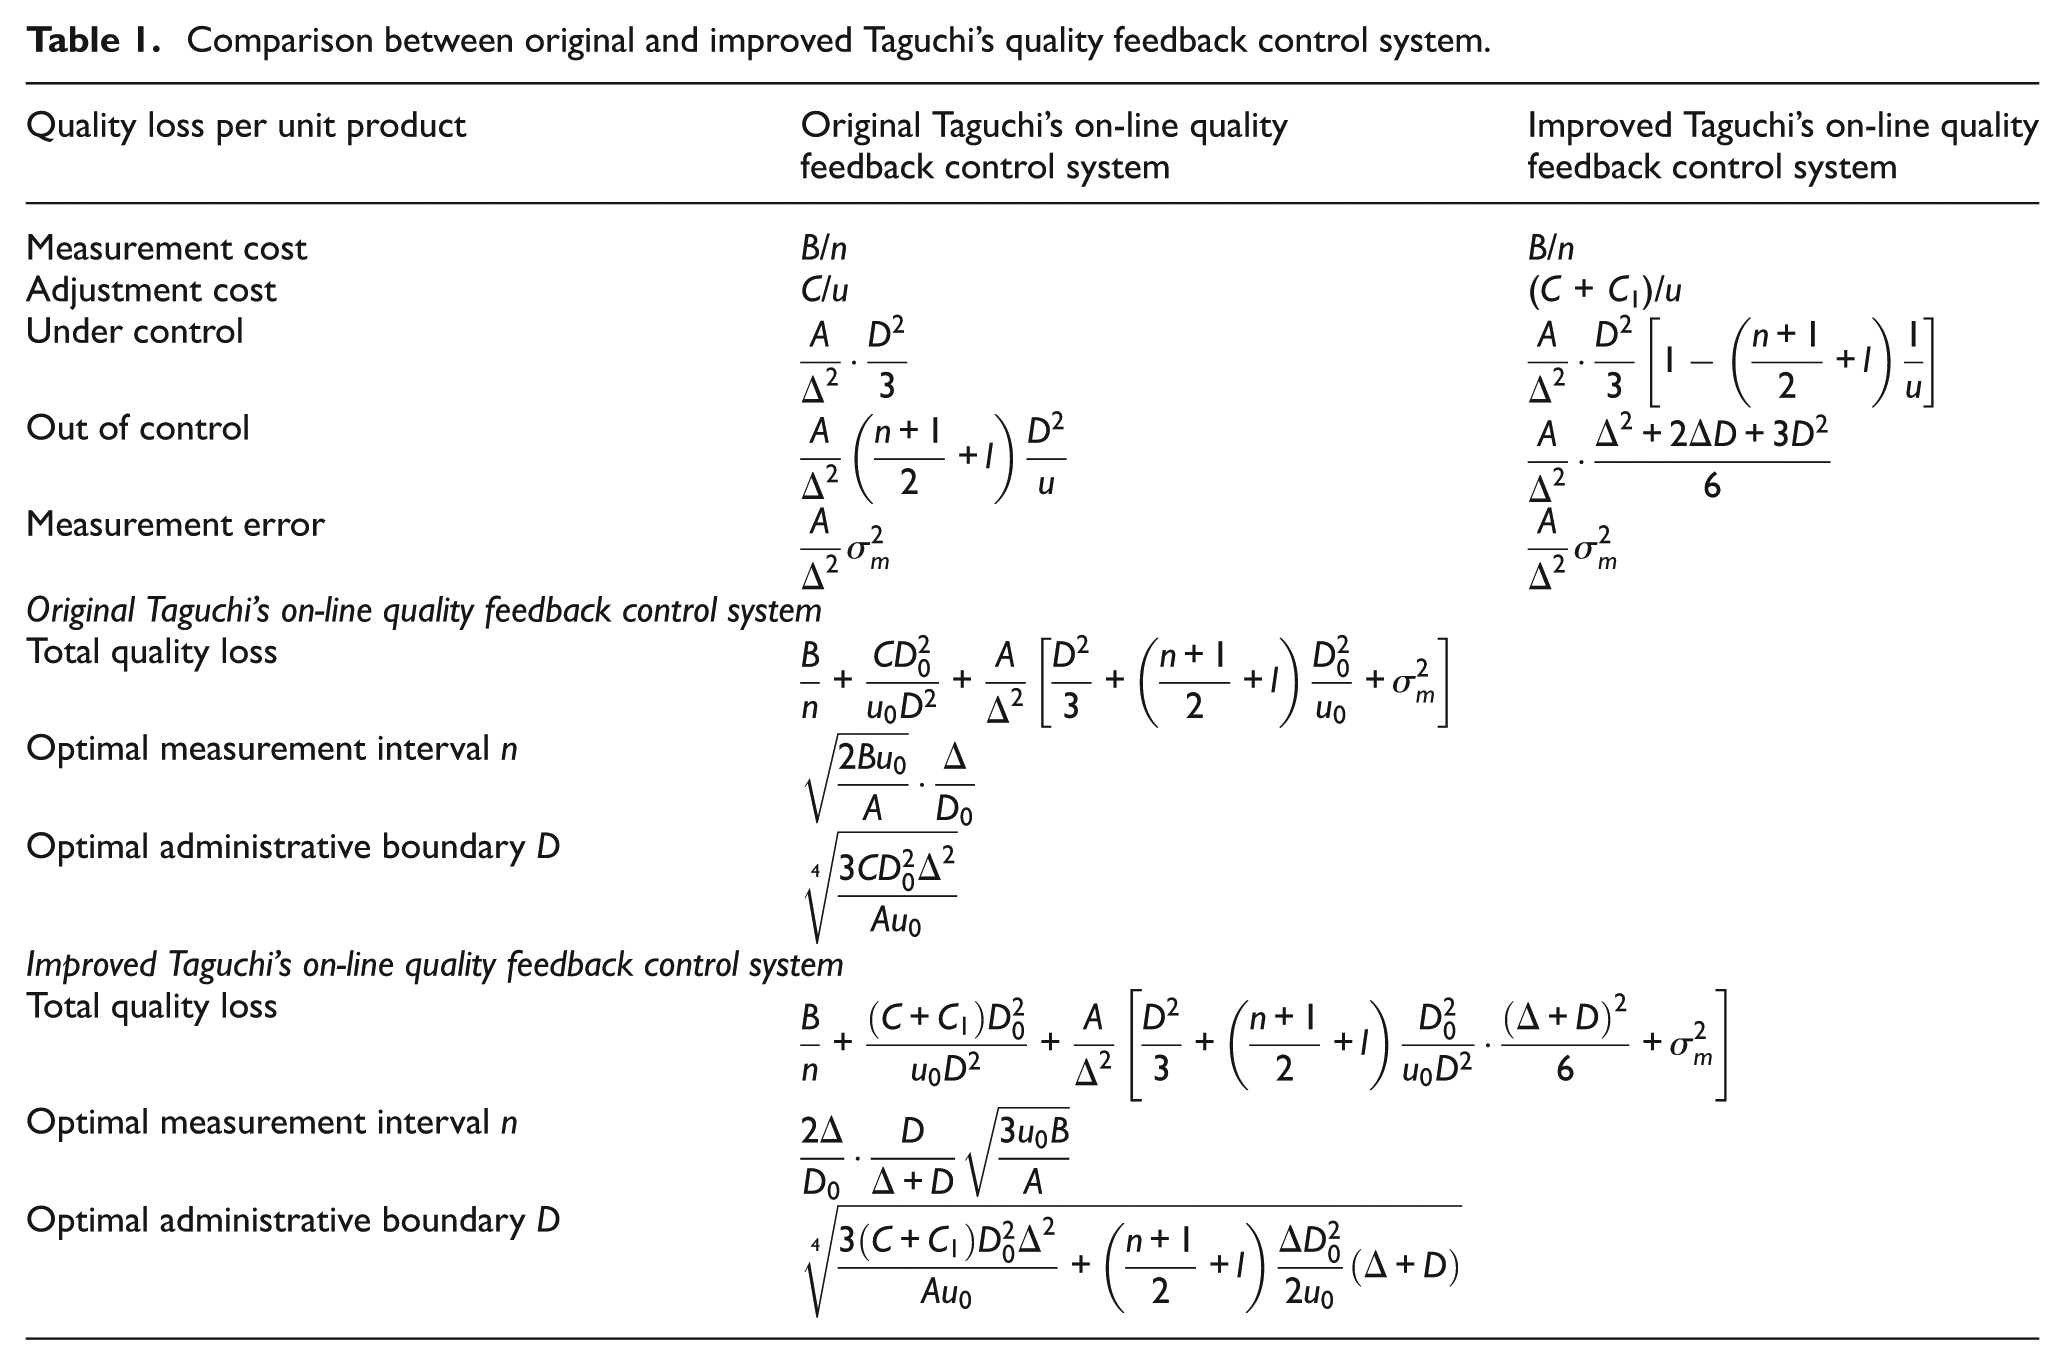
Table 1 shows the comparison between original Taguchi’s on-line quality feedback control system and the improved on-line quality feedback control system.
Comparison between original and improved Taguchi’s quality feedback control system.
However, determining n and D using equation (24) is not easy. The iterative method is used instead to obtain the following expression
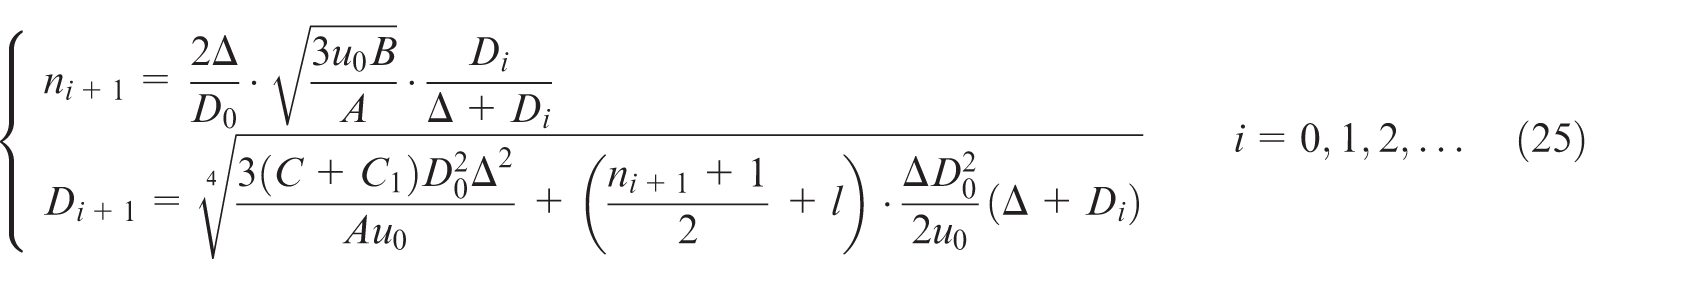
Usually, after several iterations with equation (25), the values of n and D are convergent. After obtaining n and D, equation (12) can be used to predict the average adjustment interval u and to obtain the total cost in the improved on-line quality feedback control system, which is based on equation (20).
Effectiveness of the improved on-line quality feedback control system
Practical problem
Consider the following situation. To strengthen the process quality management of automobile parts in a factory, an automobile part manufacturer decides to monitor the quality of parts and adjusts the process according to monitoring results. In the workshop, one part is produced every minute during one cycle of the process. Therefore, the specification limit of the quality characteristic value of a single part is
This is a typical application of the on-line quality feedback control system during production. Furthermore, to illustrate the effectiveness of the improved on-line quality feedback control system, optimization design (to minimize the total quality cost) was conducted using both Taguchi’s on-line quality feedback control system and the improved on-line quality feedback control system and performed a comparative analysis of the two systems.
Use of Taguchi’s on-line quality feedback control system
According to equation (6), the total quality cost of the initial stage of Taguchi’s on-line quality feedback control system is
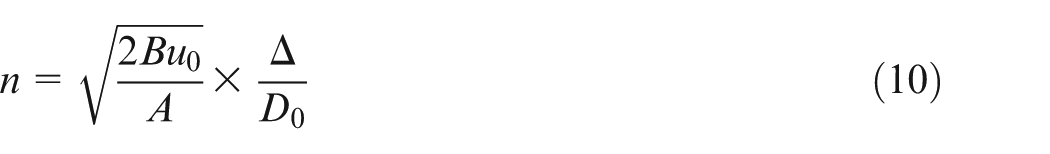
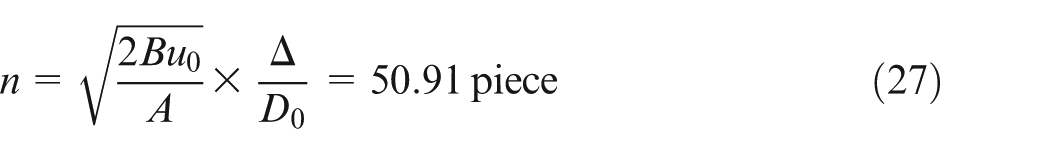
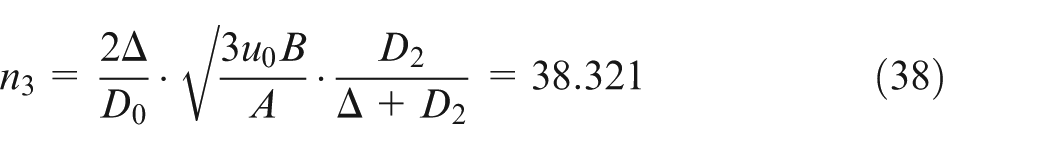
The optimal measurement interval n can be calculated using equation (10) as follows
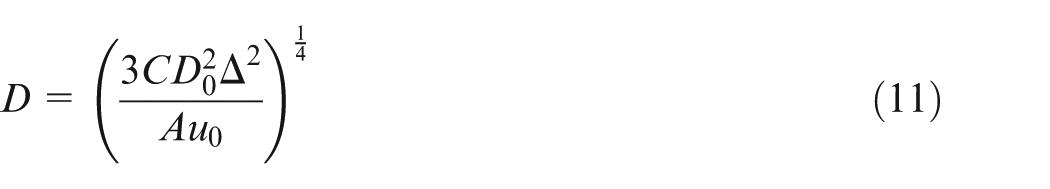
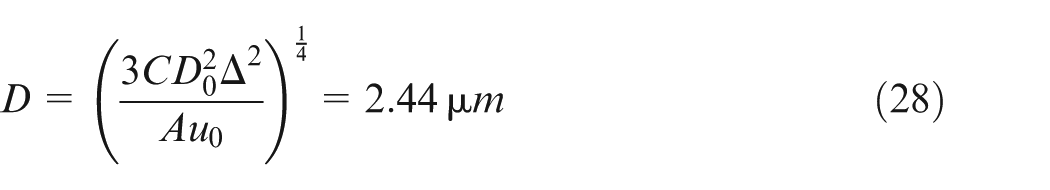
The optimal administrative boundary D can be calculated using equation (11) as follows
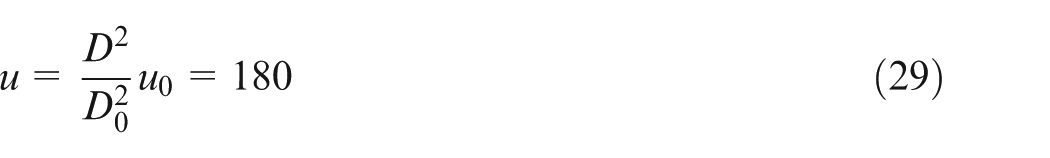
To facilitate the practical application of Taguchi’s on-line quality feedback control system and to simplify the calculation process, n was set as 50 pieces and D was set as 2.5. Thus, according to equation (12), the predictive value of the average adjustment interval in the optimal production condition in Taguchi’s on-line quality feedback control system is
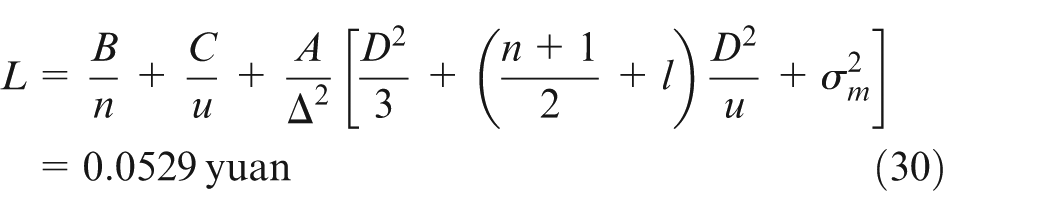
Furthermore, the minimal total quality cost per unit of a product under the optimal production condition in Taguchi’s on-line quality feedback control system can be calculated using equation (8)
This optimization design of the current study can reduce the total quality cost per unit of the product by the following amount

The automobile part manufacturer owns five workshops that can manufacture parts simultaneously. If the number of working hours is considered to be 6 h/day and if the number of working days is 25 days/month, then 1 year later, the reduction in the total quality cost (i.e. the net income can be increased) for Taguchi’s on-line quality feedback control system is

Application of the improved on-line quality feedback control system
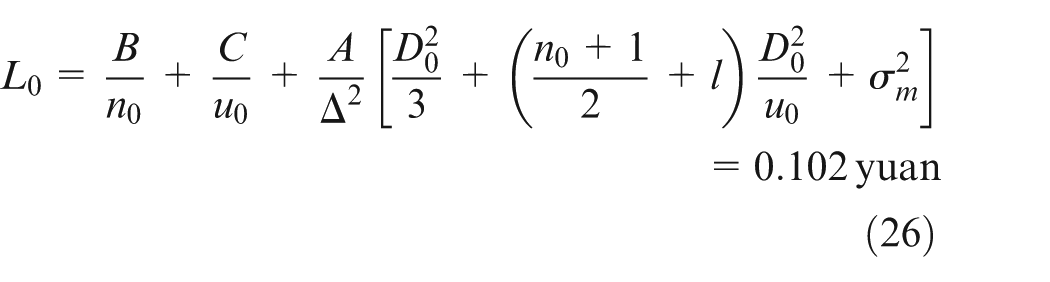
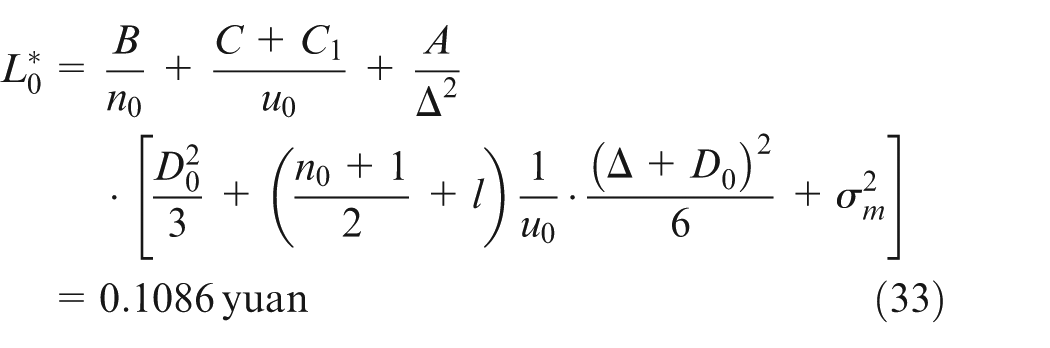
According to equation (21), the current total quality cost per unit of a product when the improved on-line quality feedback control system is used is as follows
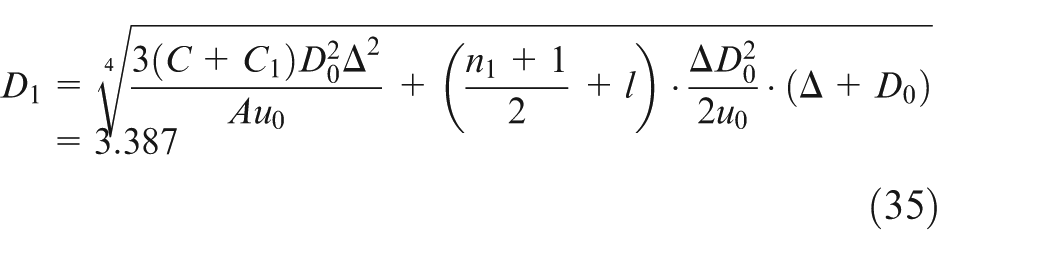
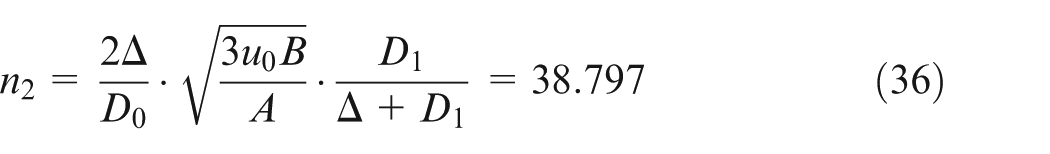
According to equation (25), n and D are calculated using the following iterative method

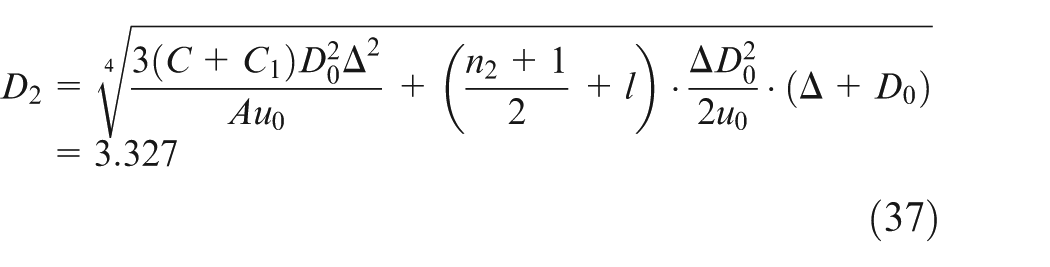
In the aforementioned iteration process, the results for n and D are convergent and restrained at Step 3. For convenience in practical application, n was set as 40 pieces and D was set as 3.3. Thus, according to equation (12), the predictive value of the average adjustment interval in the optimal production condition is calculated using the improved on-line quality feedback control system as follows
The average of the adjustment interval predictive value is 300 pieces.
Furthermore, the minimal total quality cost per unit of a product for the optimal production condition calculated using the improved on-line quality feedback control system (i.e. using equation (22)) is as follows
Using this optimization design, the total quality cost per unit of a product can be reduced by

Similarly, the automobile parts manufacturer owns five workshops that can manufacture automobile parts simultaneously. Because the number of working hours is 6 h/day for 25 days/month, over 1 year, applying the improved on-line quality feedback control system reduces the total quality cost (i.e. increases the net income) by

Comparison of the on-line quality feedback control system before and after improvement
It is clearly illustrated above that the result of the optimization design of the improved on-line quality feedback control system is not superior to that of Taguchi’s on-line quality feedback control system. The reason for this result is related to the three problems in Taguchi’s on-line quality feedback control system and the chosen values of D and Δ. A more detailed explanation is as follows.
1. Differences in the optimal administrative boundary. The ratio between the optimal administrative boundary before and after the improvement of the on-line quality feedback control system is
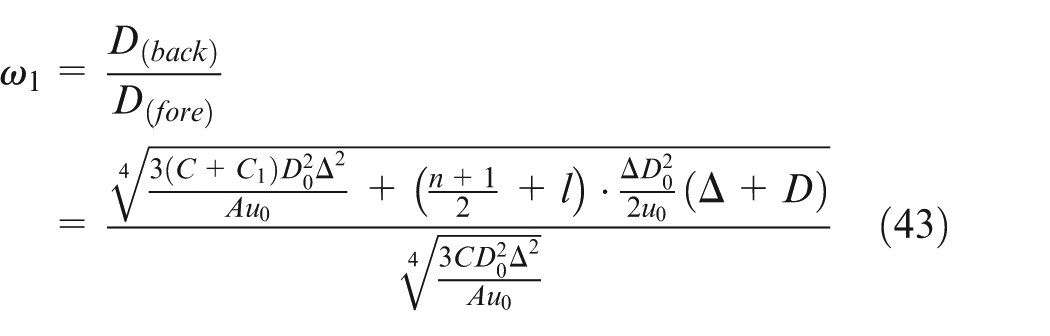
Evidently,
2. Differences in the fluctuations of the out-of-control products. This can be obtained by calculating the difference between the fluctuations of out-of-control products before and after the improvement
When When When When 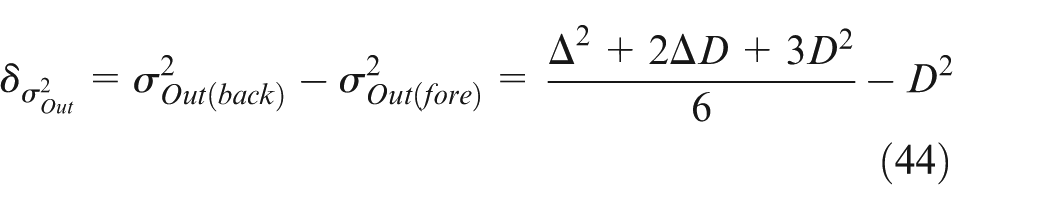
When the specification limit
Figure 3 shows that when the administrative boundary
3. Difference in the optimal measurement interval. The ratio between the optimal measurement interval before and after the improvement of the on-line quality feedback control system is calculated as follows
If If If 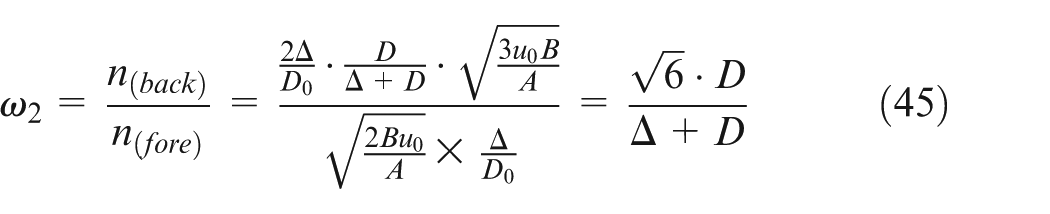
Hence, because the fluctuation of the out-of-control products is too small, the optimal measurement interval obtained from Taguchi’s on-line quality feedback control system is not ideal. In this scenario, because
In summary, the reduced total cost after the optimization design in the improved on-line quality feedback control system is smaller than that in Taguchi’s on-line quality feedback control system. This is not because the improved on-line quality feedback control system is inferior, but because the calculation of the total cost in Taguchi’s on-line quality feedback control system is not ideal. Moreover, the design of the specification limit
Conclusion
In this study, three problems in Taguchi’s on-line quality feedback control system were identified. First, when products are out of control, Taguchi’s system considers their quality characteristics to be on the administrative boundary (either
Footnotes
Declaration of conflicting interests
The author(s) declared no potential conflicts of interest with respect to the research, authorship, and/or publication of this article.
Funding
The author(s) received no financial support for the research, authorship, and/or publication of this article.