
Abstract
In this article, a comprehensive geometrical–mechanical–thermal predictive model is developed for thermal contact conductance between two flat metallic rough surfaces. The rough surface was characterized by Weierstrass–Mandelbrot fractal function. The micro-morphology was measured by laser microscope to identify the fractal parameters that were then applied to mechanical and thermal modeling. A new contact mechanics model was then proposed to calculate the contact parameters, and different contact scales between asperities and three modes of deformation, elastic, elastic–plastic and fully plastic, were taken into account. The normal contact pressure, which should be equal to the exterior load, was formulated as a function of the fractal parameters, the maximum contact area and the material physical properties of the given surface. Based on the contact mechanics model, first a single pair of contacting asperities was proposed and then multi-contacting asperities were combined to get total thermal contact conductance. The influences of contact load, surface roughness, asperity top radius and contact area as well as the temperature on the thermal contact conductance were investigated by using the proposed model. The investigation results showed that thermal contact conductance increases with the contact load and contact area. The larger the surface roughness, the smaller is the thermal contact conductance. Finally, the experiments were conducted to validate the effectiveness of the thermal contact conductance modeling. This geometrical–mechanical–thermal predictive model was compared with the two existing predictive models and a series of experimental data. The results showed good agreement, demonstrating the validity of the model and providing certainty for further study on the heat transfer between contact surfaces.
Keywords
Introduction
As a result of manufacturing processes, real engineering surfaces are not perfectly smooth and relatively rough when viewed microscopically. The real contact occurs only on microscopic contacting points, which results in the heat flux passing through the contacting interface by some discrete contacts, which leads to much lower temperature drop across the interface. The cause is the existence of the thermal contact conductance (TCC) between the contacting interfaces. Many scholars have developed analytical, the experimental and numerical models to predict TCC since 1960s because of its important role in many fields, such as aircraft structural joints, microelectronics cooling, boundary lubrication, nuclear reactor cooling and precision engineering. However, no satisfactory model is available at present, and it is difficult to predict TCC because of the strongly nonlinear relationship between TCC and many other factors, such as surface morphology, interface pressure, contact area, contact deformation modes, material physical properties and temperature, among which the surface topography is a major determinant. TCC is a complex interdisciplinary problem, including geometry, mechanical and thermal sub-problems. And the core of a TCC analysis is its mechanical issue.
The geometrical issue is the foundation for TCC analysis. And there are two methods to characterize the topology of rough surfaces, namely, the methods based on experiments and theoretical models. Five types of instruments are presently available for measuring the surface topography according to Liu et al.:
1
optical measurements, stylus-type surface profile-meter, atomic force microscope (AFM), scanning electron microscope (SEM) and scanning tunneling microscope (STM). But the characterization results with different resolutions of measuring instruments are different. Namely, the characterization results based on the experimental methods are not unique. Then, scholars switch their research interest to the characterization methods based on theoretical models. Namely, the theoretical characterization models are established based on various mathematical methods, such as statistical theory, stochastic process theory, Cantor set theory and fast Fourier transform (FFT). Greenwood and Williamson
2
proposed the application of statistical parameters to characterize rough surfaces, such as the root mean square (RMS)
The mechanical issue is the core of TCC analysis. Elastic, elastic–plastic and plastic deformations occur on the asperities. There are three kinds of mechanical models about joint surfaces, namely, elastic, elastic–plastic and plastic models. Abdo 7 proposed an elastic contact model and the model assumed that the contact of two rough surfaces can be simplified as the contact between a flat surface and an equivalent rough surface comprising spherical asperities. However, in this model only elastic deformation was taken into account. Then, elastic–plastic contact model was proposed. Lin and Lin 8 proposed an elastic–plastic mechanical model, in which the elastic–plastic deformation state of contacting asperities was considered. Sepehri and Farhang 9 proposed an elastic–plastic contact model of joint surfaces to consider asperity’s shoulder–shoulder contact. However, the elastic and plastic deformations of the contacting asperities were ignored. Jackson and Green 10 presented statistically elastic–plastic contact model between two rough surfaces using the results of a previous finite element (FE) analysis of an elastic–plastic sphere in contact with a rigid flat. But one of the major shortcomings of the elastic–plastic models was that the deformation state of the asperities was either fully plastic or elastic deformation. Goerke and Willner 11 proposed a numerical model that can be used to describe the elastic–plastic normal contact of isotropic fractal surfaces. The plastic contact model was first proposed by Abbott and Firestone 12 and the actual contact area was simplified as the deformed area of the contact interface between the rough surface and a supposed rigid smooth surface, resulting in the disappearance of the deformation volume. Other plastic contact models calculated the actual contact area by the fully plastic model, resulting in a larger TCC.13–15 It can be seen that the whole deformation process of contacting asperities was ignored and the change process of asperity’s deformation was separated by the above contact models. Namely, the whole deformation process from elastic deformation to elastic–plastic deformation and the occurrence of plastic deformation were split. Therefore, it is essential to propose a comprehensive contact model to take the complete deformation process of the asperities into account.
In this article, TCC is defined as
The framework of this article is as follows. The method to characterize the surface profile and identify fractal parameters is proposed in section “Fractal surface characterization and parameter identification,” which lays the foundation for the mechanical and thermal modeling. Section “Modeling for contact mechanics” analyzes the elastic, elastic–plastic and plastic contact mechanics of two contacting rough surfaces, which is the core part of TCC modeling. Section “Modeling for TCC” proposes the TCC modeling method based on the discussion of sections “Fractal surface characterization and parameter identification” and “Modeling for contact mechanics.” Section “Experimental validation” identifies the fractal parameters and conducts the experiments to validate the effectiveness of the comprehensive TCC modeling. Section “Results and discussion” introduces some analysis and discussion about the comprehensive TCC prediction method. Section “Conclusion” presents the conclusions obtained from the above analysis.
Fractal surface characterization and parameter identification
Fractal surface characterization
The characterization of fractal surface is essential to TCC analysis. The change in the surface morphology is a non-stationary stochastic process with intrinsic fractal property, that is, continuous everywhere but not differentiable. The Weierstrass–Mandelbrot 27 (W-M) function in fractal geometry is the most commonly used function to characterize the rough surface morphology. W-M function can be utilized to characterize the behavior of rough surfaces with disorder, non-stationary random and self-affinity
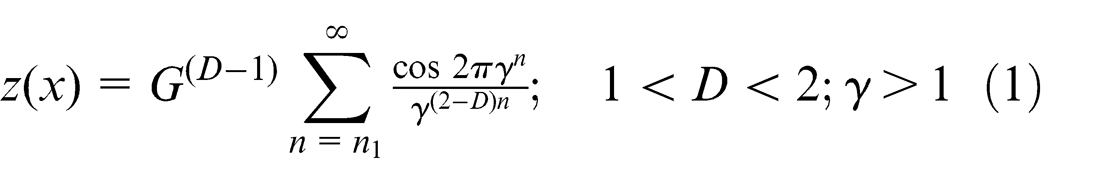
where D is the fractal dimension of the profile of the surface, G is a scaling constant, the frequency expression is
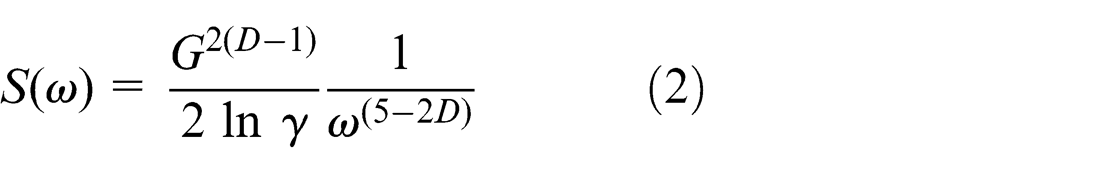
For the W-M function, the power spectrum is given by Majumdar and Tien 19
The W-M function also follows the relationship

It is obvious to find that the two scale-invariant parameters G and D in equation (1) are scale independent and can be estimated by plotting the power spectrum of the fractal surface, where D is the slope and G is obtained from the slope and intersection with the longitudinal axis. Figure 1 illustrates a 3D fractal surface topography and its contour plane generated from equation (1) with D = 1.64, G = 9.46e−6 m, L = 1 µm andγ = 1.5. It can be seen from equations (2) and (3) that W-M function is a self-similar function, which is not sensitive to the sampling length and the resolution of the measurement instrument. Therefore, the W-M function can be applied to characterize the surface topography.
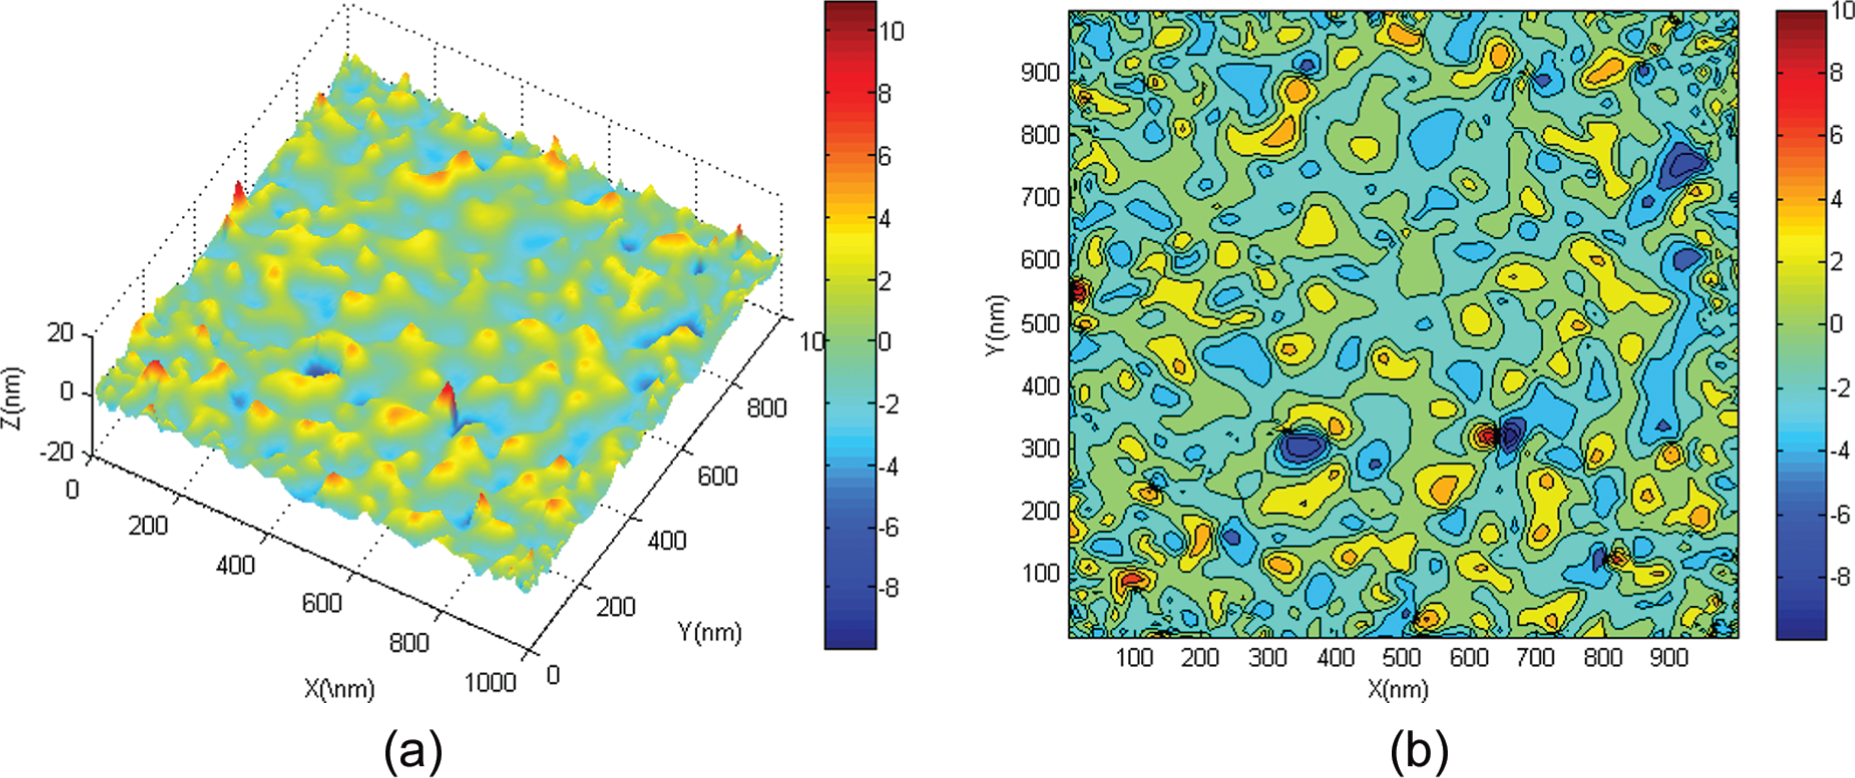
A 3D fractal surface topography generated using W-M function: (a) micro-morphology and (b) contour plane.
Fractal parameter identification
The power spectrum of W-M function takes logarithm on both the sides, then

Assuming that

Namely, the power spectrum function W-M function is a straight line in the double logarithmic coordinates. Then
Modeling for contact mechanics
Distribution of contact points
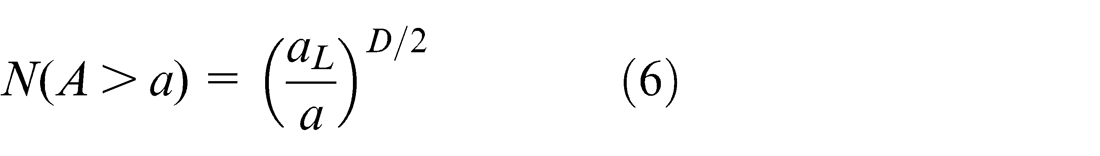
If the maximum area of a contact is aL , then the number of the asperities whose contact area is larger than a
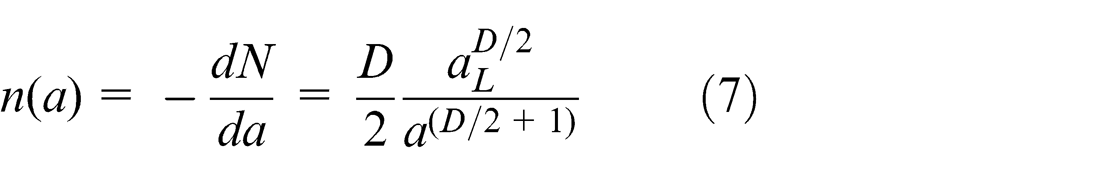
The number of asperities whose area is between a and a + da can be expressed as
Deformation properties of the contact interface
In order to determine the contact parameters of the asperities, it is essential to investigate the contact state of asperity. Namely, three modes of deformation: elastic, elastic–plastic and plastic deformation.
When the maximum of Hertz pressure reaches 0.6H, plastic flow begins to occur on the contact asperities. The critical deformation
28
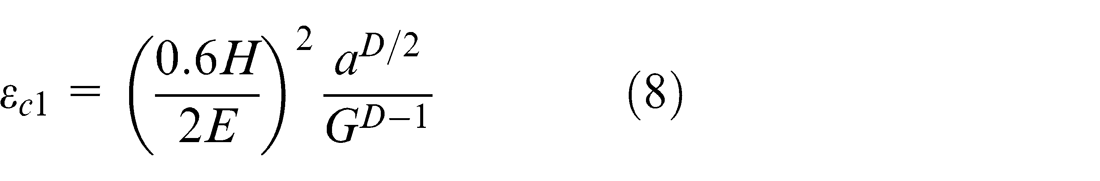
where H denotes the micro-hardness of the softer material, a denotes the contact area of the asperities and E denotes the equivalent elastic modulus, namely
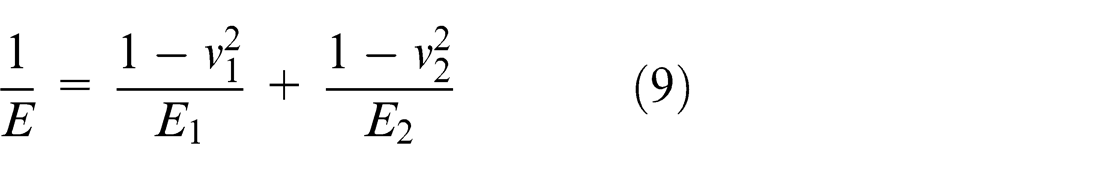
where subscripts 1 and 2 refer to the two contacting surfaces, and E1, E2, v1, v2 denote Young’s elastic modulus and Poisson’s ratio of the two contacting materials, respectively.
According to the relationship
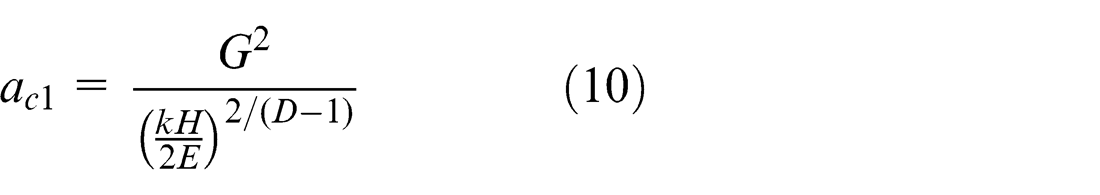
where k = 0.6.
When the minimum of contact pressure reaches H, plastic flow occurs on the surface. The critical deformation
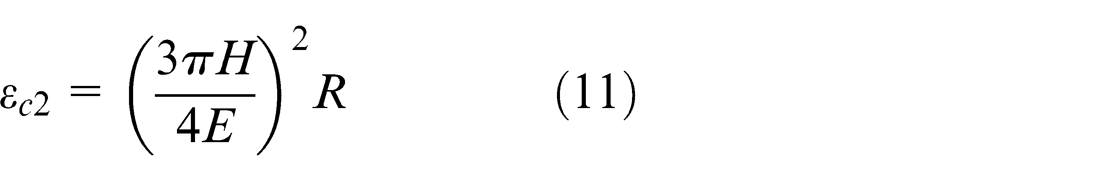
where R denotes the asperity top radius, 29 which can be expressed as
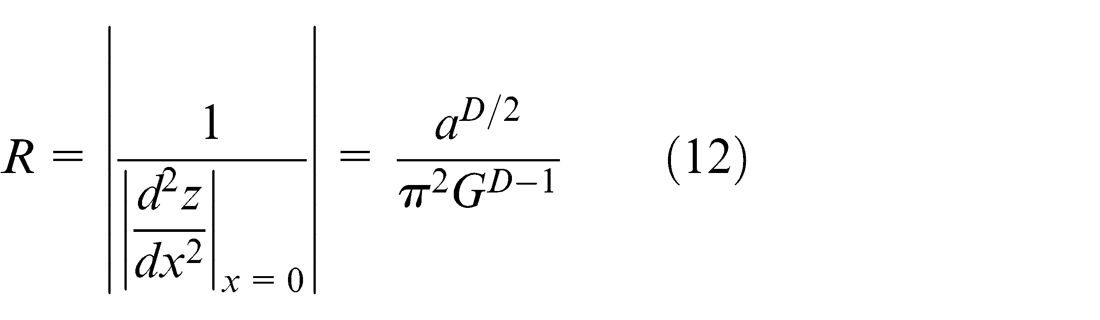
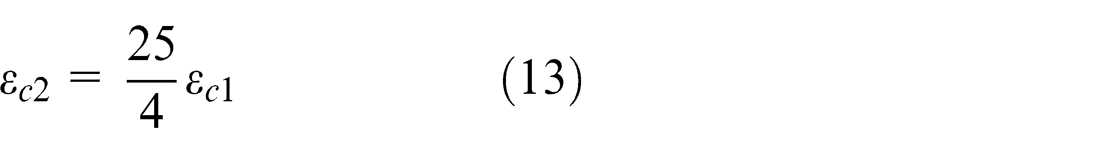
It can be seen that the asperity top radius changes with the variation in the contact area. The contact areas of the asperities are different, resulting in different top curvature radius. According to equations (8) and (11), the relationship between
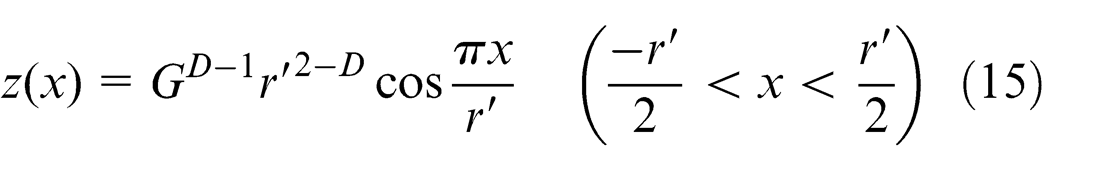
According to the relationship
If the detail in a smaller scale is ignored and the first term of the W-M function is taken, the profile of rough surfaces can be expressed as equation (15) in the range of
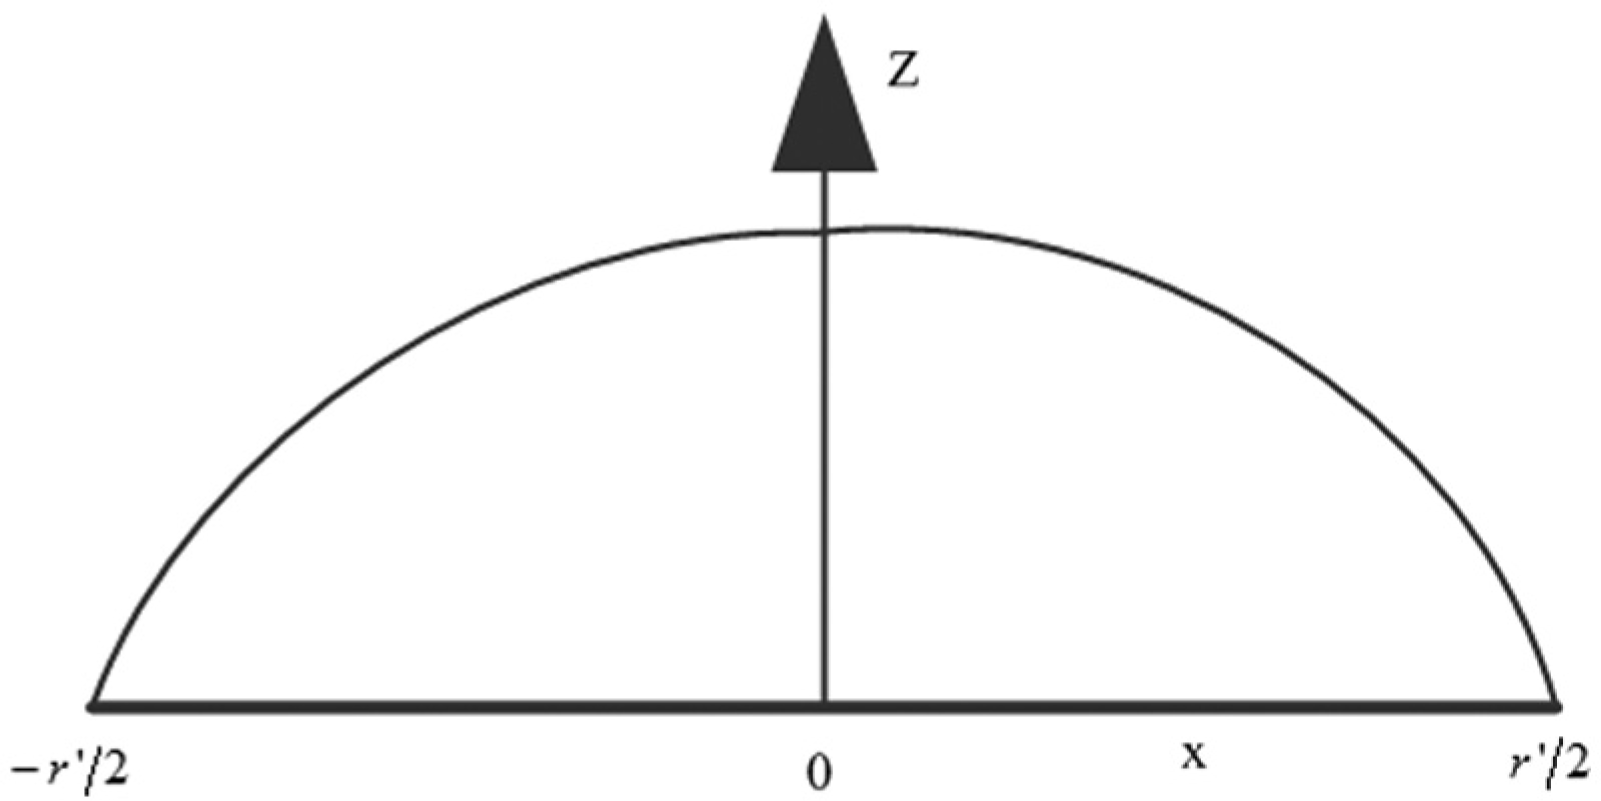
Geometry of a contact spot of length scale
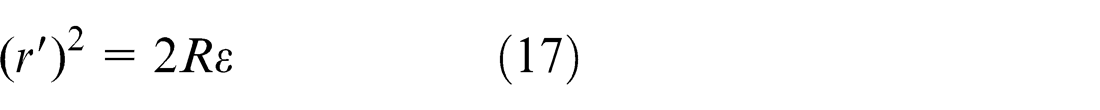
Figure 3 schematically illustrates an asperity truncated by a supposed rigid plane. The relationship between the real contact area a (
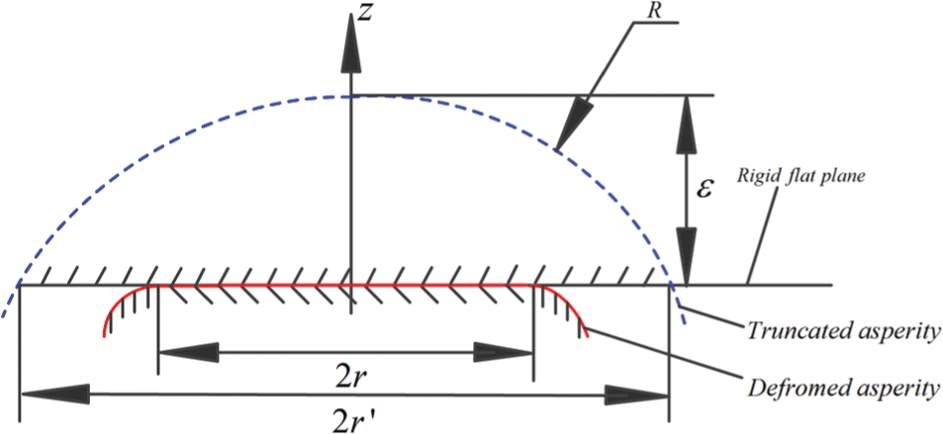
Schematic diagram of the contact between an asperity and a rigid plane.
Consider a contact whose area is a, and assuming that
The deformation of asperities depends on the peak-to-valley amplitude of the W-M function
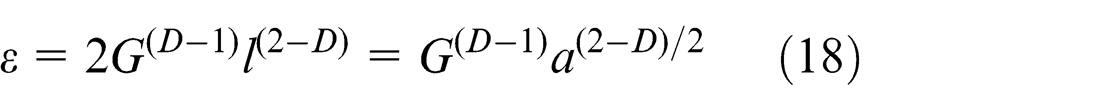
The relationship between
Elastic contact
When the normal deformation

By eliminating normal deformation
where the contact area is half of the geometric cross-sectional area, namely,
Elastic–plastic contact
When the deformation of the asperity is moderate, namely,
The actual contact area acep
, the average contact pressure Pcep
and the load on the surface

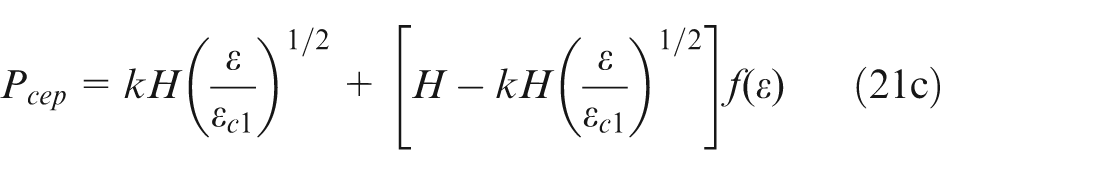
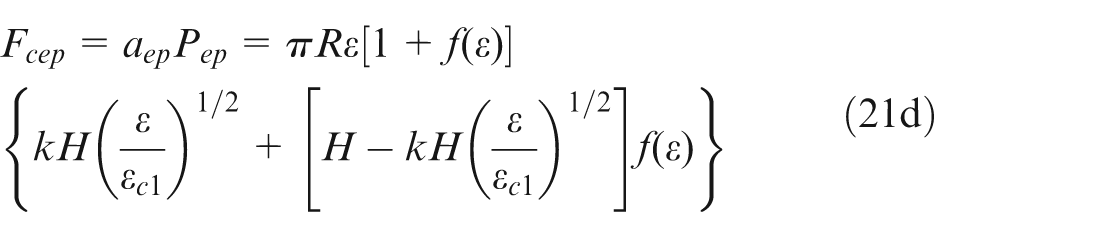
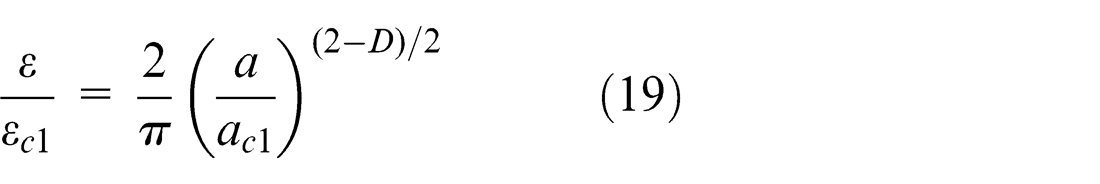
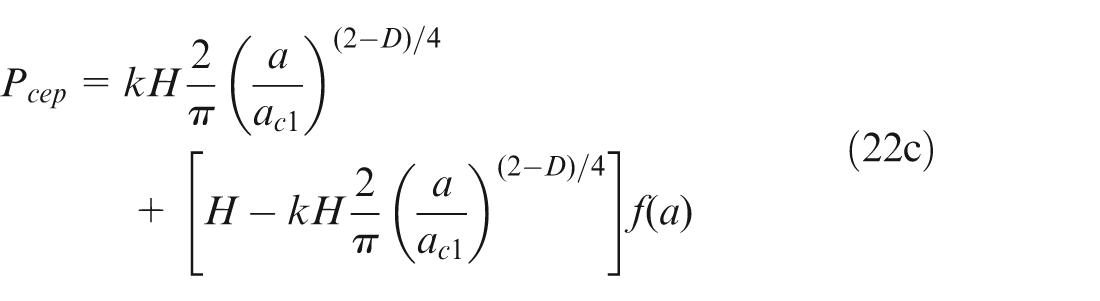
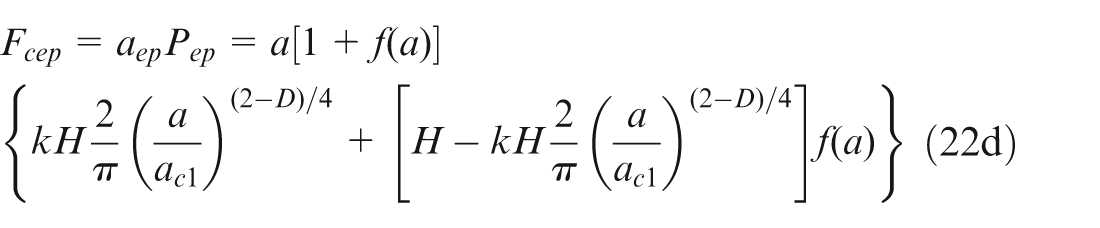
Equation (21a) can be written as equation (22a) according to equation (19)
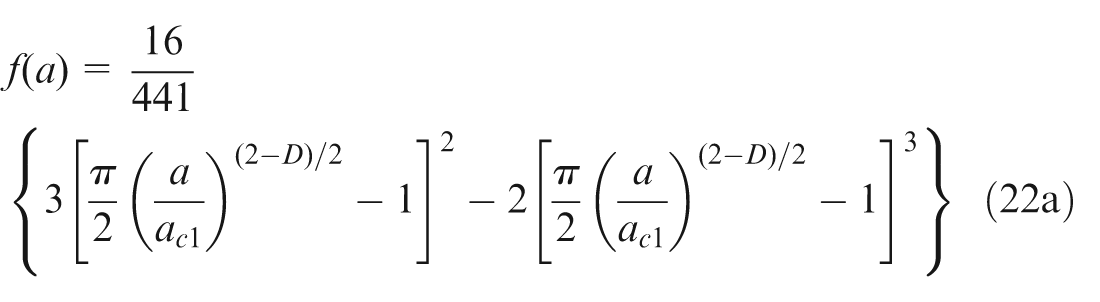
Therefore, equations (21b)–(21d) can be obtained according to equation (22a)

Fully plastic contact
When the deformation of the asperity is relatively large, namely, satisfy a > ac 2, fully plastic deformation occurs on the asperities. The contact pressure Pcp of each asperity is H. The contact area of each asperity acp and the load of each contact point Fcp can be calculated


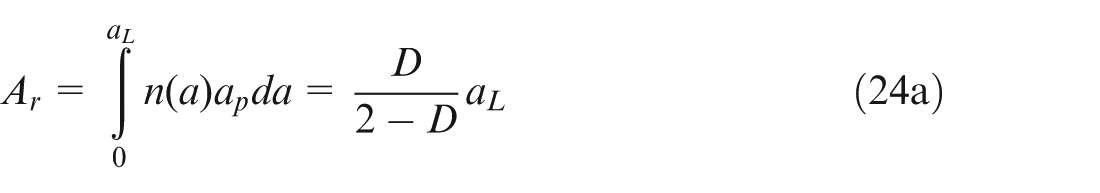
Actual contact area Ar
Based on the parameters of aL, ac
1 and ac
2, the total contact area Ar
can be calculated. If the maximum contact area is smaller than the critical plastic area, that is
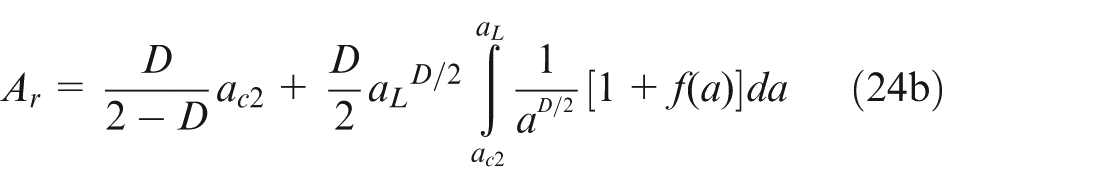
If the maximum contact area is greater than the critical plastic contact area ac
2 and smaller than the critical elastic contact area ac
1, that is,
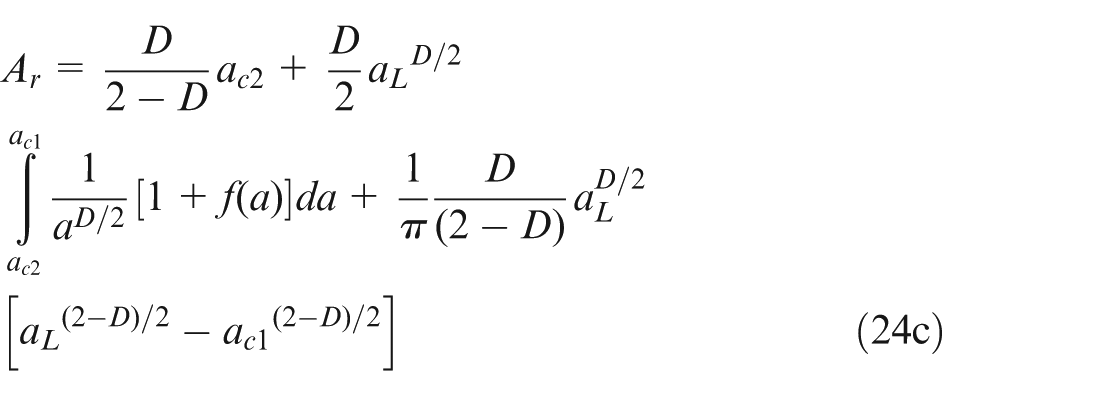
If the maximum contact area is greater than the critical elastic area ac
1, that is,
Load on the contact interface
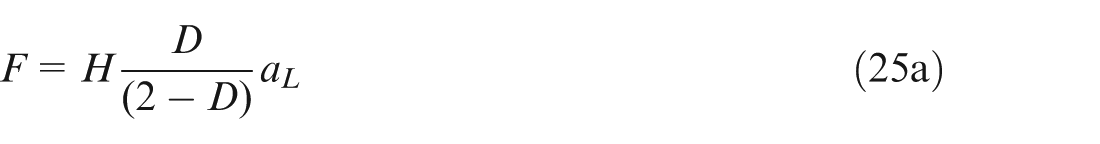
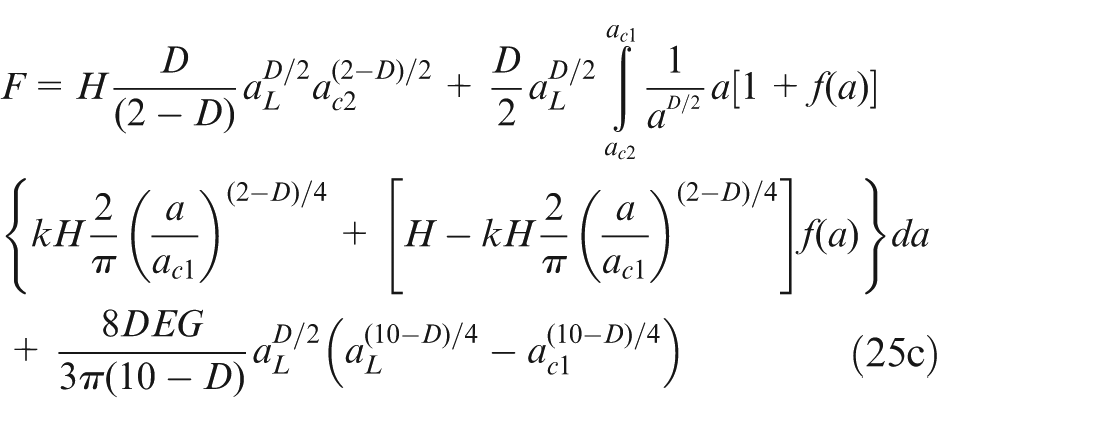
Through the above analysis, the load on each asperity can be obtained, by integrating the load on the contact interface from 0 to the maximum contact area aL , the load distribution over the entire contact interface can be obtained. When the fractal dimension D is not equal to 1.5, the load over the whole contact interface can be divided into three cases:
If
If
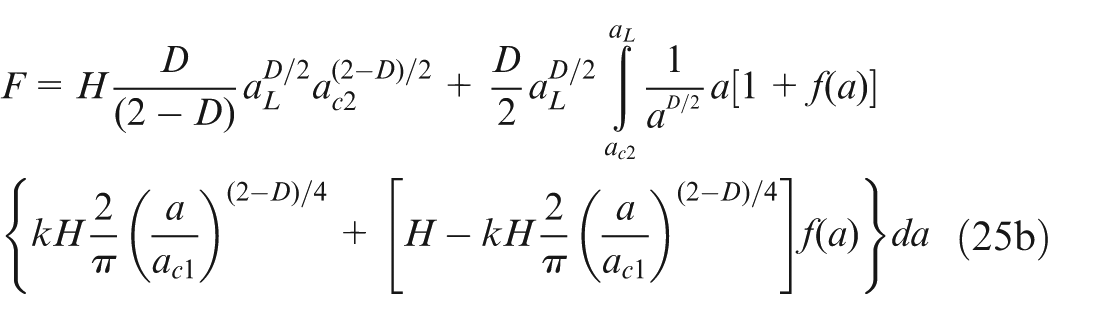
If
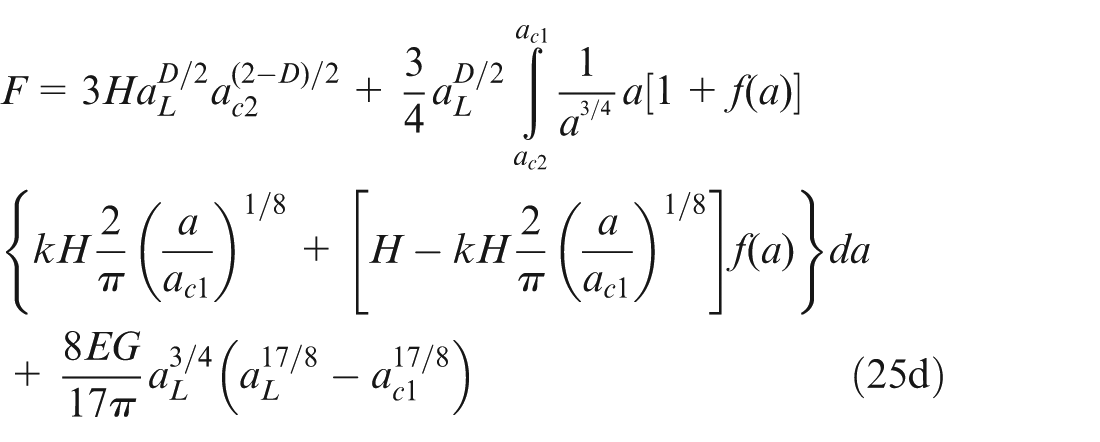
When the fractal dimension D is equal to 1.5, the load over the entire contact interface is given by
In order to keep equilibrium, the total normal contact load yielded by asperity deformation must be equal to the exterior load Fext
, namely, the product of the contact pressure P and the apparent surface Aa
:
Modeling for TCC
It can be seen from the above analysis that the contact of two rough surfaces occurs at finite discrete points, and so does the heat contraction, as illustrated in Figure 4. This is the reason for the existence of thermal contact resistance (TCR) which is reciprocal to TCC. There are three kinds of heat transfer modes, namely, (1) the conduction of the micro-contact asperities, which plays the most important role in heat transfer; (2) the conduction through the medium in the micro-gap between the contacting materials, which can be neglected in most applications because the thermal conductivity of the medium is much smaller than that of the contacting materials and (3) the thermal radiation across the vacuum gap without medium, which is normally ignored.
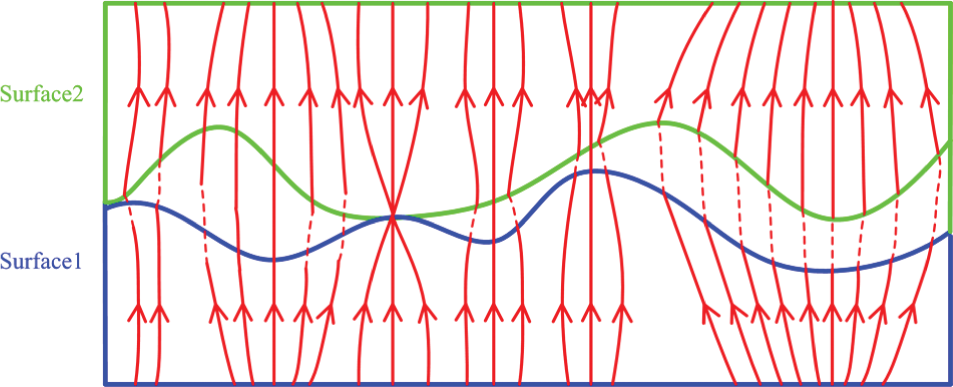
Constriction of heat flow lines through contacting spots.
Thermal conductance of single-contact asperity
A single micro-contact between two rough surfaces is schematically illustrated in Figure 5. Heat flux contracts at the contact interface because of the imperfect contact of two contacting surfaces. Therefore, the less the contact asperities, the heat flux will contract more, and then the greater the TCR and the smaller the TCC will be at a given contact interface.
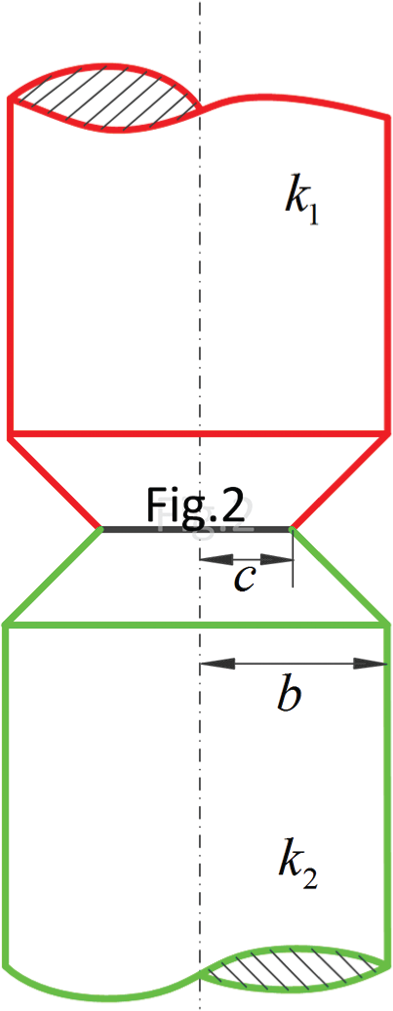
Schematic diagram of a micro-contact spot.
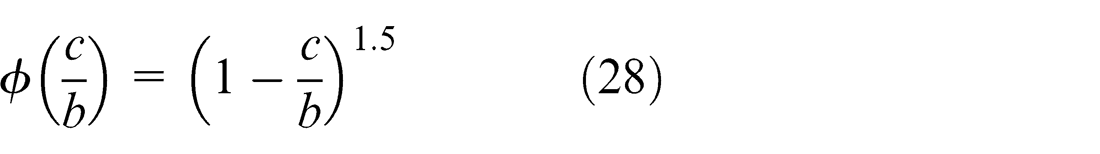
TCR of a single micro-contact can be expressed as equation (26) according to Cooper et al. 13
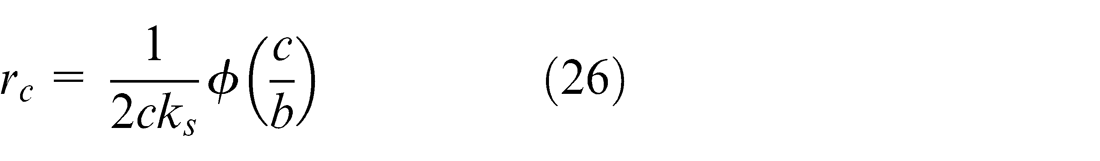
where b and c, which can be calculated by applying equation (27),31,32 are the radii of the contact area and the heat flow channel, respectively
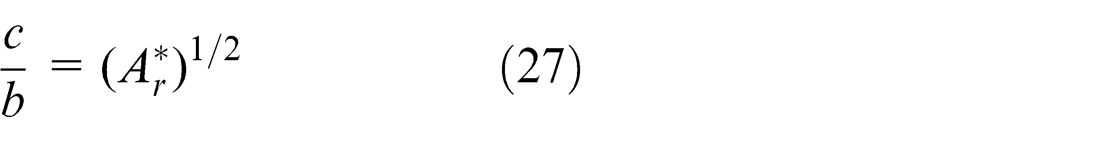
where Aa
denotes the nominal contacting area calculated by Aa
= L2, and
And ks is the equivalent thermal conductivity determined by
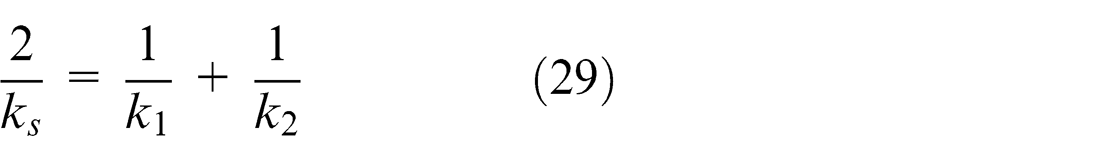
where k1 and k2 denote the thermal conductivity of the two contacting materials, respectively.
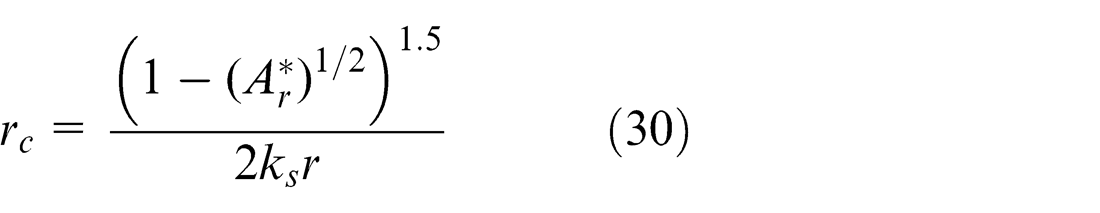
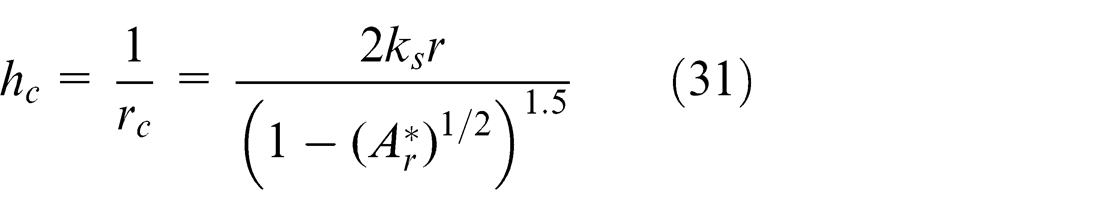
By replacing c with the asperity’s radius r, equation (26) can be rewritten as
Then, TCC (hc ) of a signal micro-contact is simply expressed as
Thermal conductance fractal model of multiple points
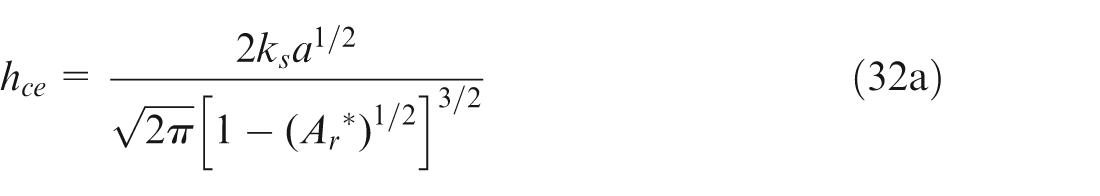
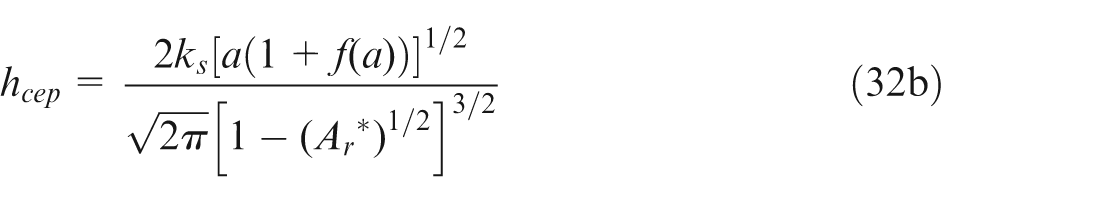
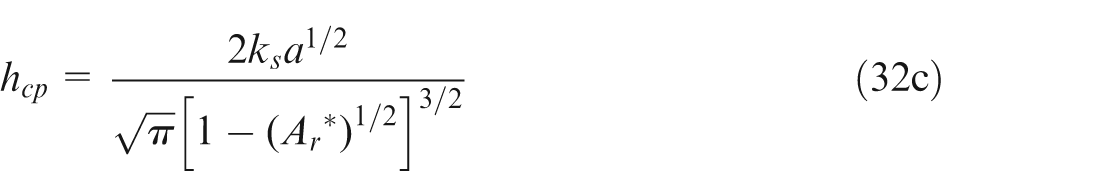
Elastic–plastic, elastic and plastic deformations occur on asperities according to Mikić; 33 TCC of a single micro-contact asperity in elastic, elastic–plastic and fully plastic deformation states, that is, hce, hcep and hcp , respectively, can be obtained by applying equation (32)
TCC of the total contact asperities
At a given mean surface separation distance, when the fractal dimension D is not equal to 1.5, the total TCC can be given by
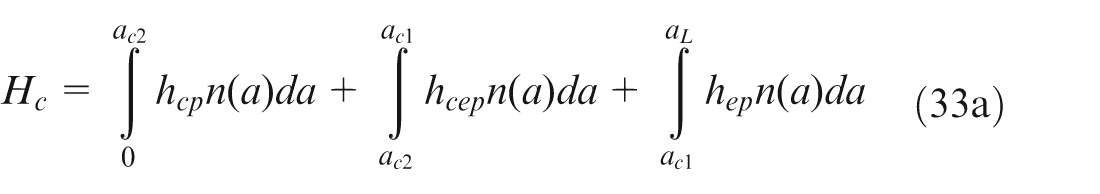
If
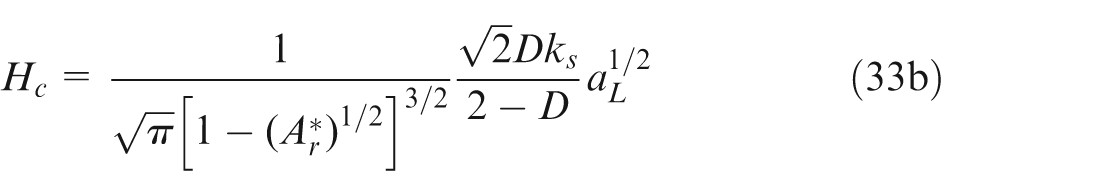
If
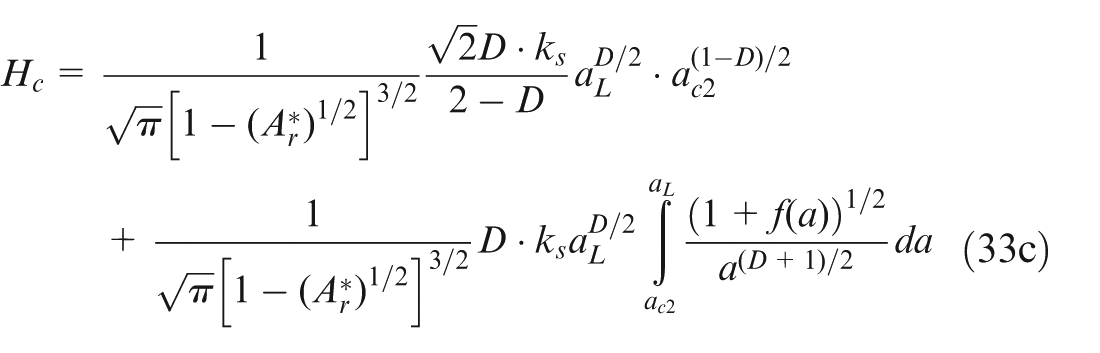
If
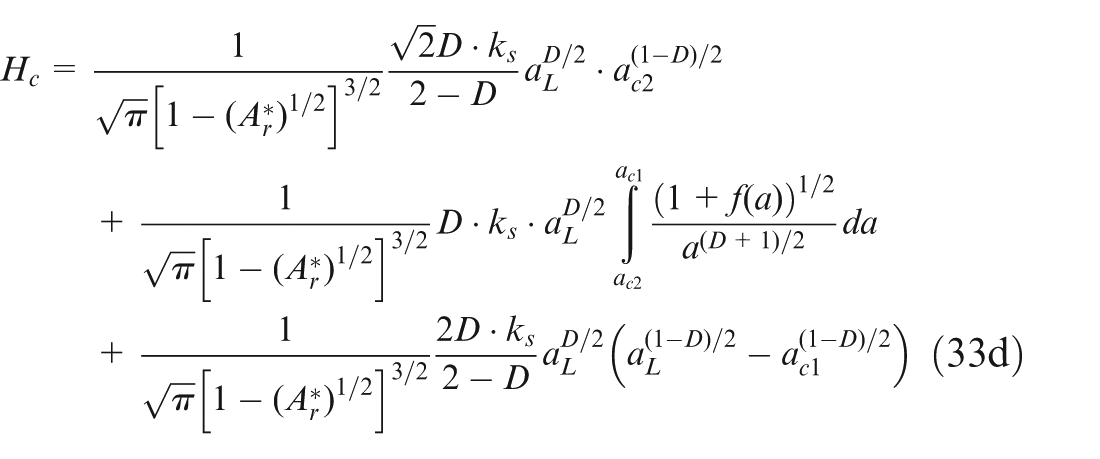
When the fractal dimension D is equal to 1.5, then the total TCC can be expressed as
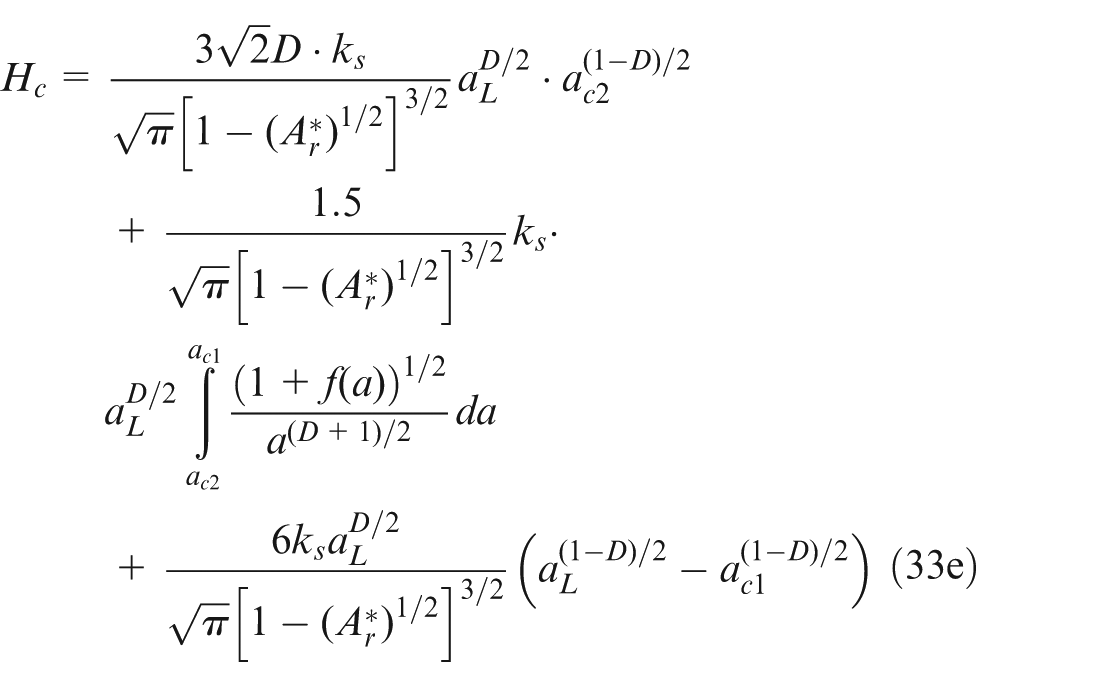
It can be seen from equation (33) that TCC is a function of D, G, ac
1, ac
2,
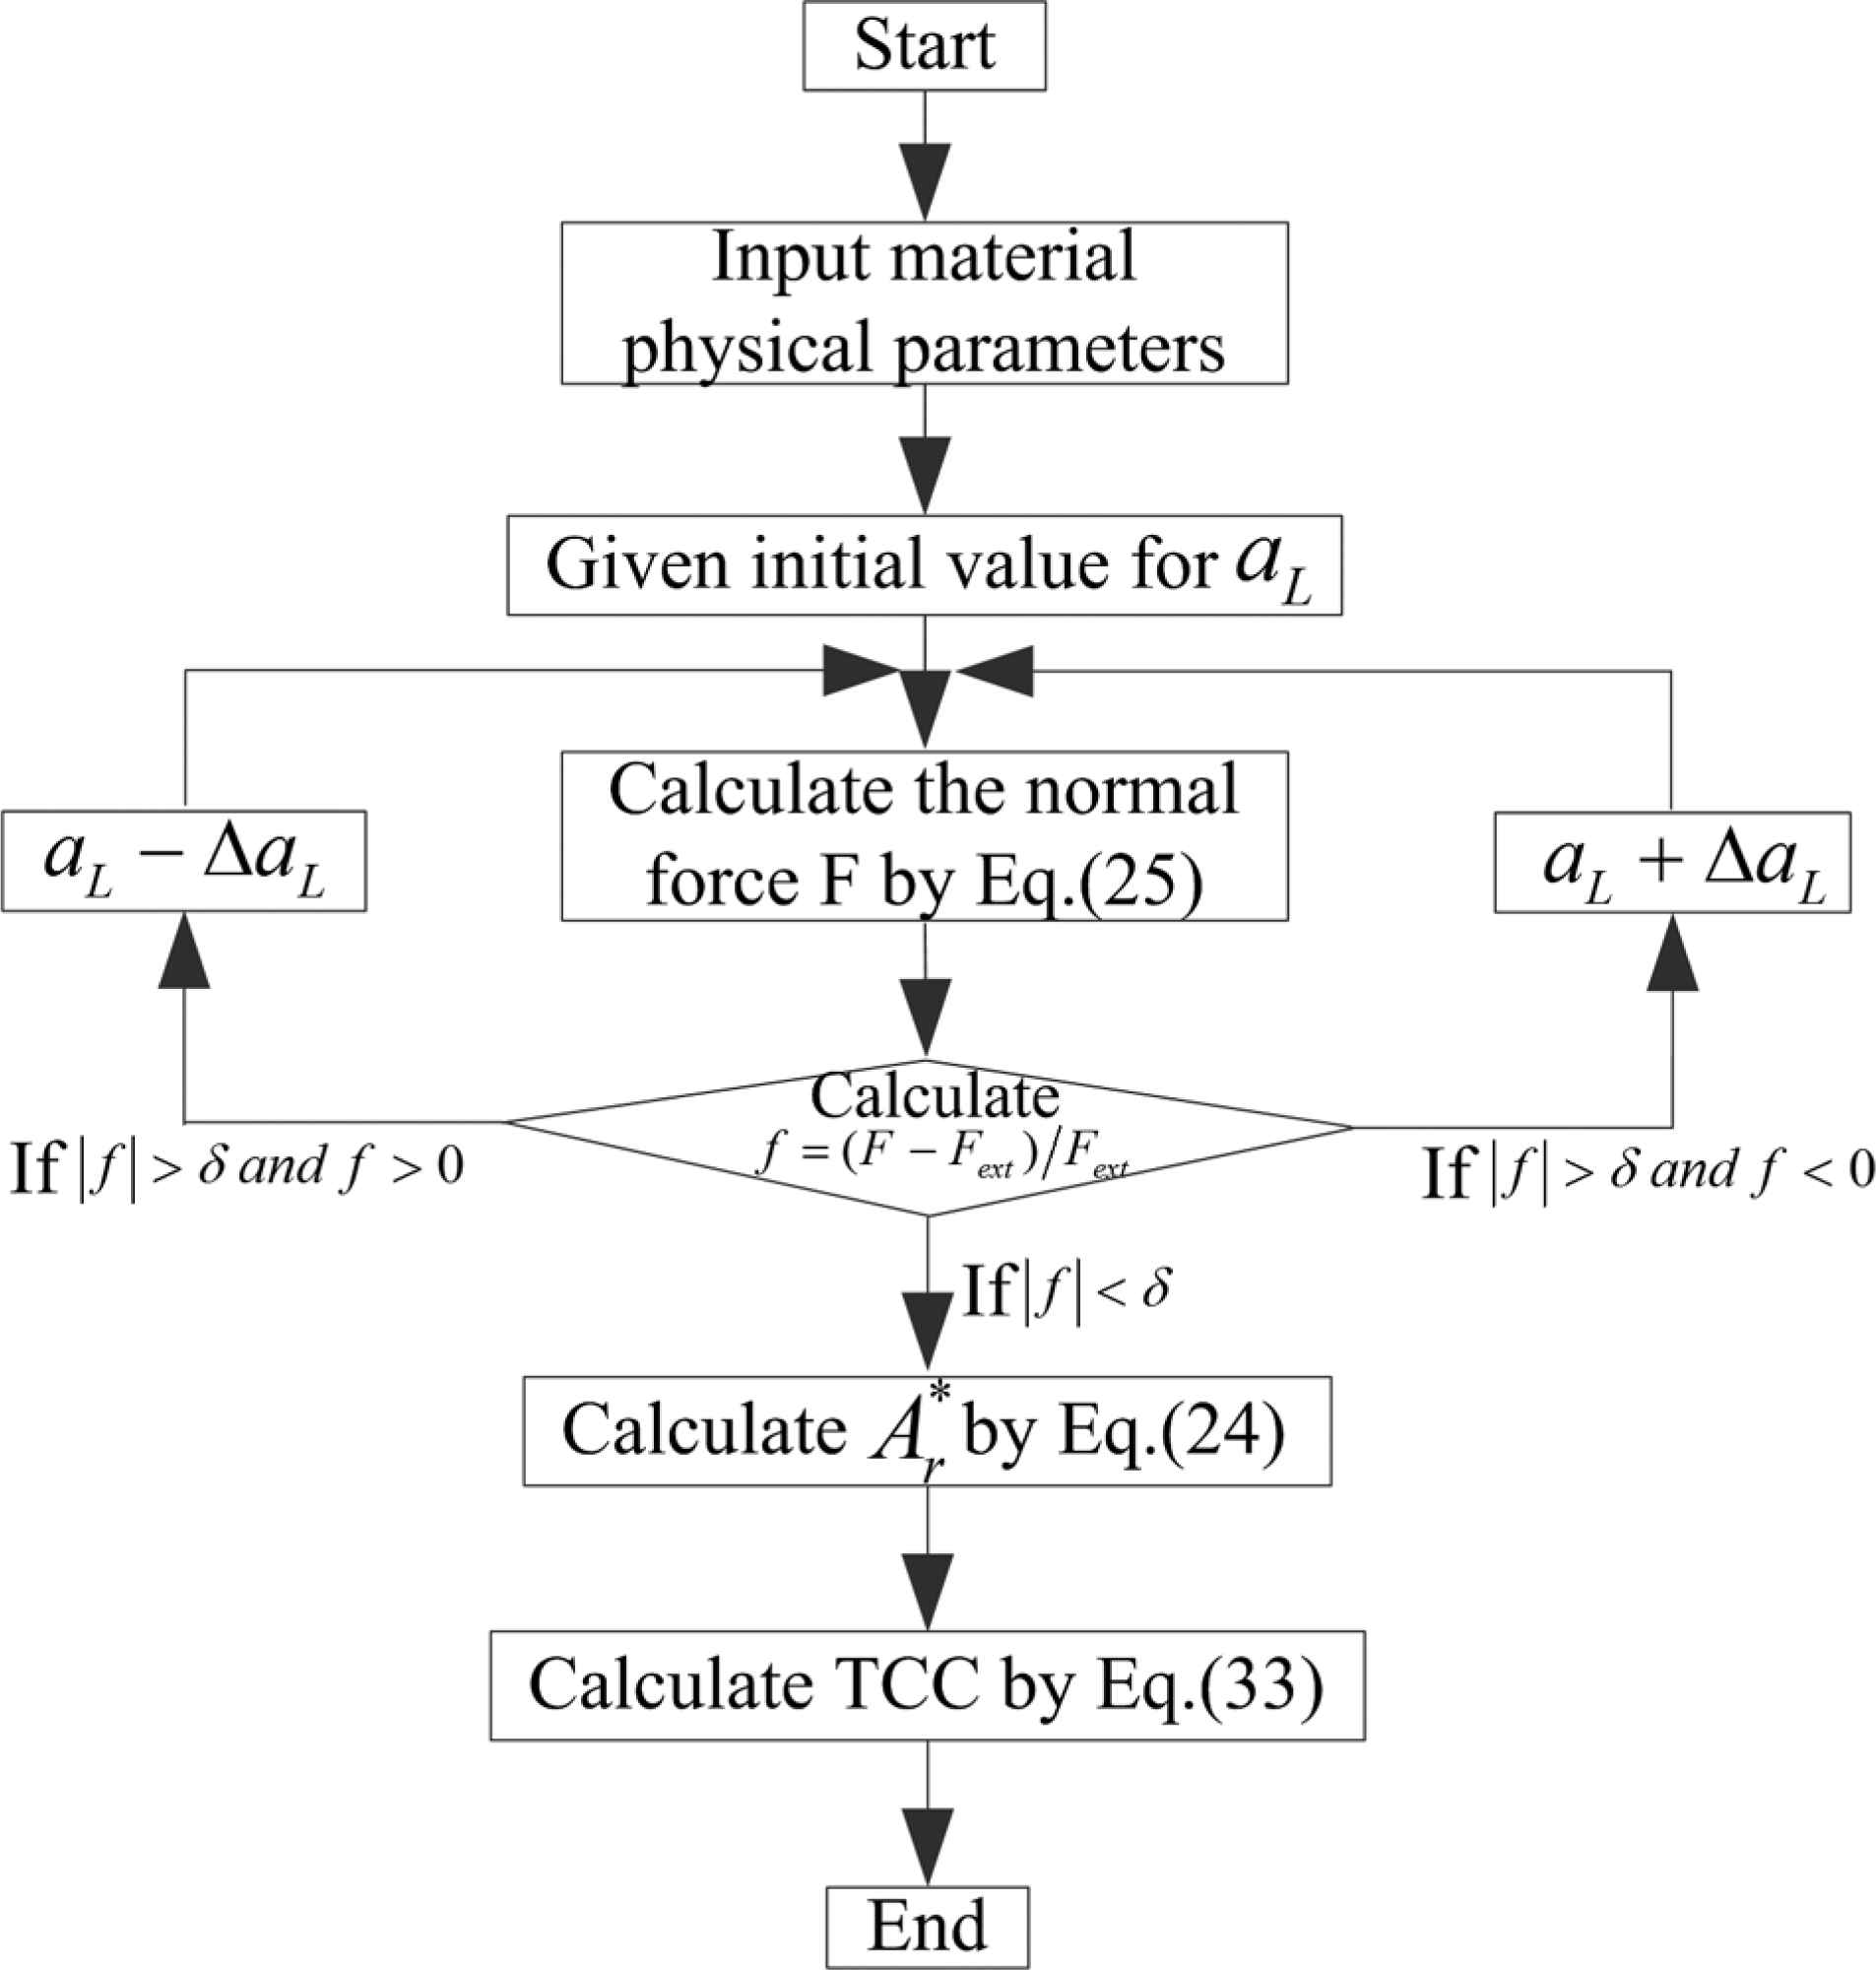
Computational algorithm for TCC.
Experimental validation
Test specimens
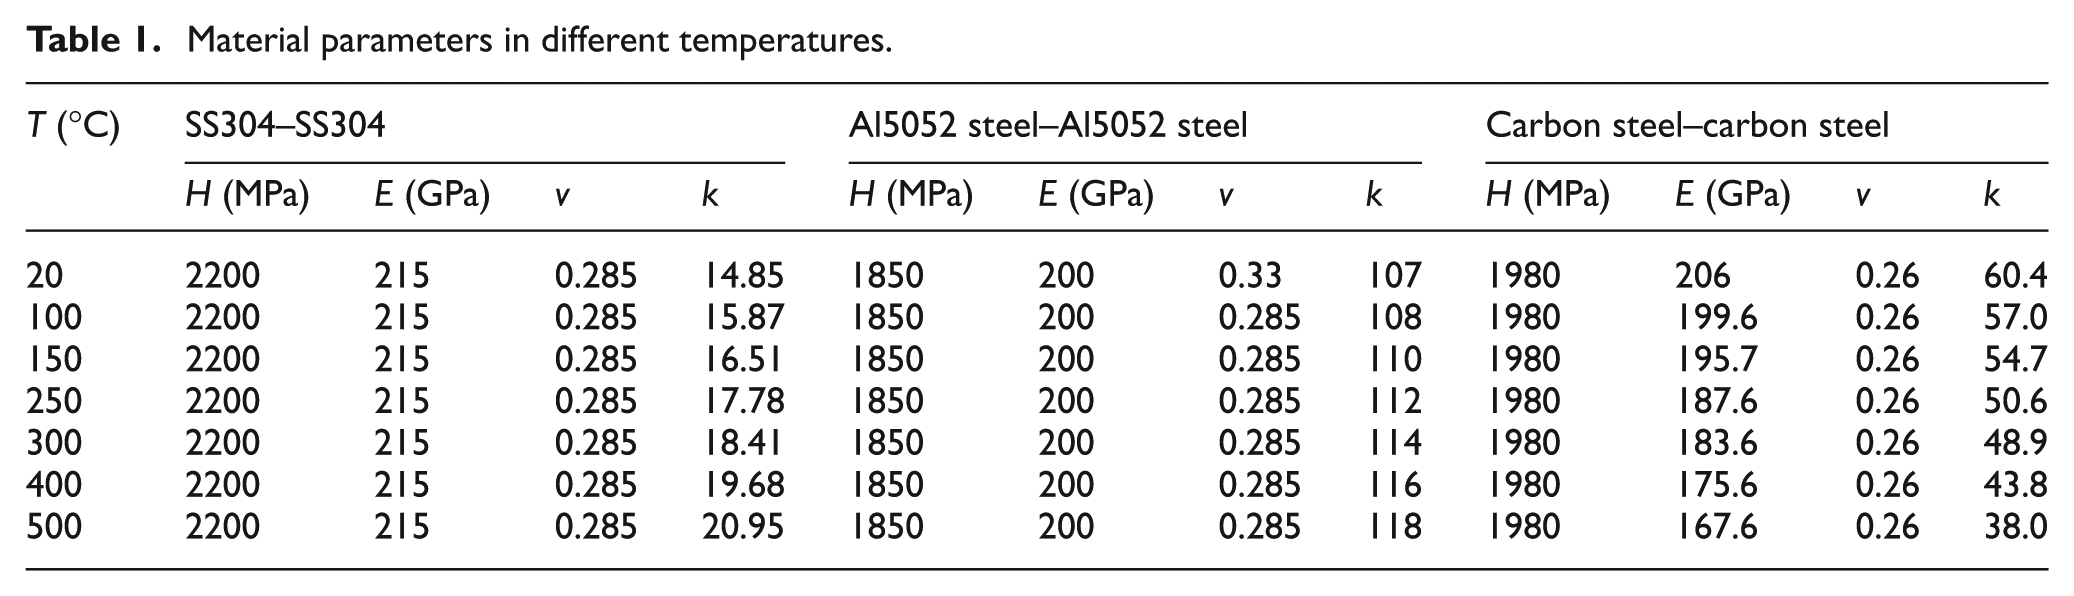
Stainless steel 304, Al5052 steel and carbon steel were chosen as the test materials because of the wide use of them. All test specimens were machined into 45-mm-long cylindrical rod with a diameter of 25 mm. The flat contact surfaces were prepared with different finish processes by grinding and blast-ground treatments. Each surface was measured by an Olympus laser microscope.
The physical parameters of the test specimens in different temperatures are listed in Table 1.
Material parameters in different temperatures.
Experimental setup
The rough surface morphology was measured by an Olympus laser microscope LEXT OLS4000, as shown in Figure 7.
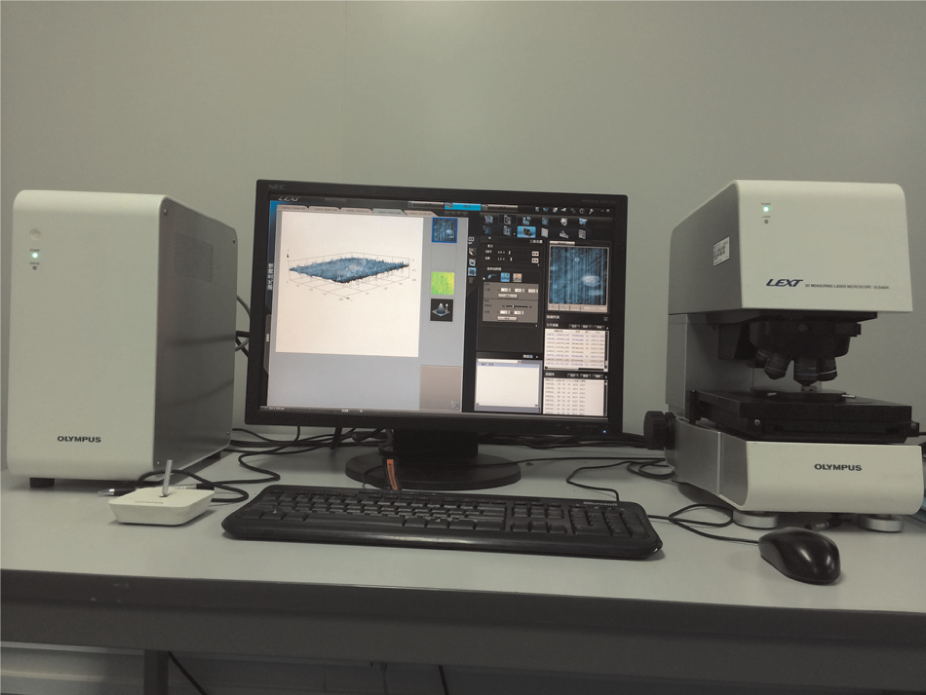
Olympus LEXT OLS4000 laser microscope.
The experimental setup to measure TCC was developed to fit inside the vacuum chamber as shown in Figure 8. The test chamber consisted of a steel base plate and a steel bell jar enclosing the test column. The test column consisted of, from top to bottom, the loading mechanism, the heater block, the load cell, the upper and lower test specimens, the Armco iron flux meter and the heat sink (cold plate). The load was applied to the center of the load cell. The power of the heaters could be adjusted. The cold plate consisted of a hollow copper cylinder, and the cooling was implemented using a closed-loop water–glycol bath in which the coolant temperature could be set.
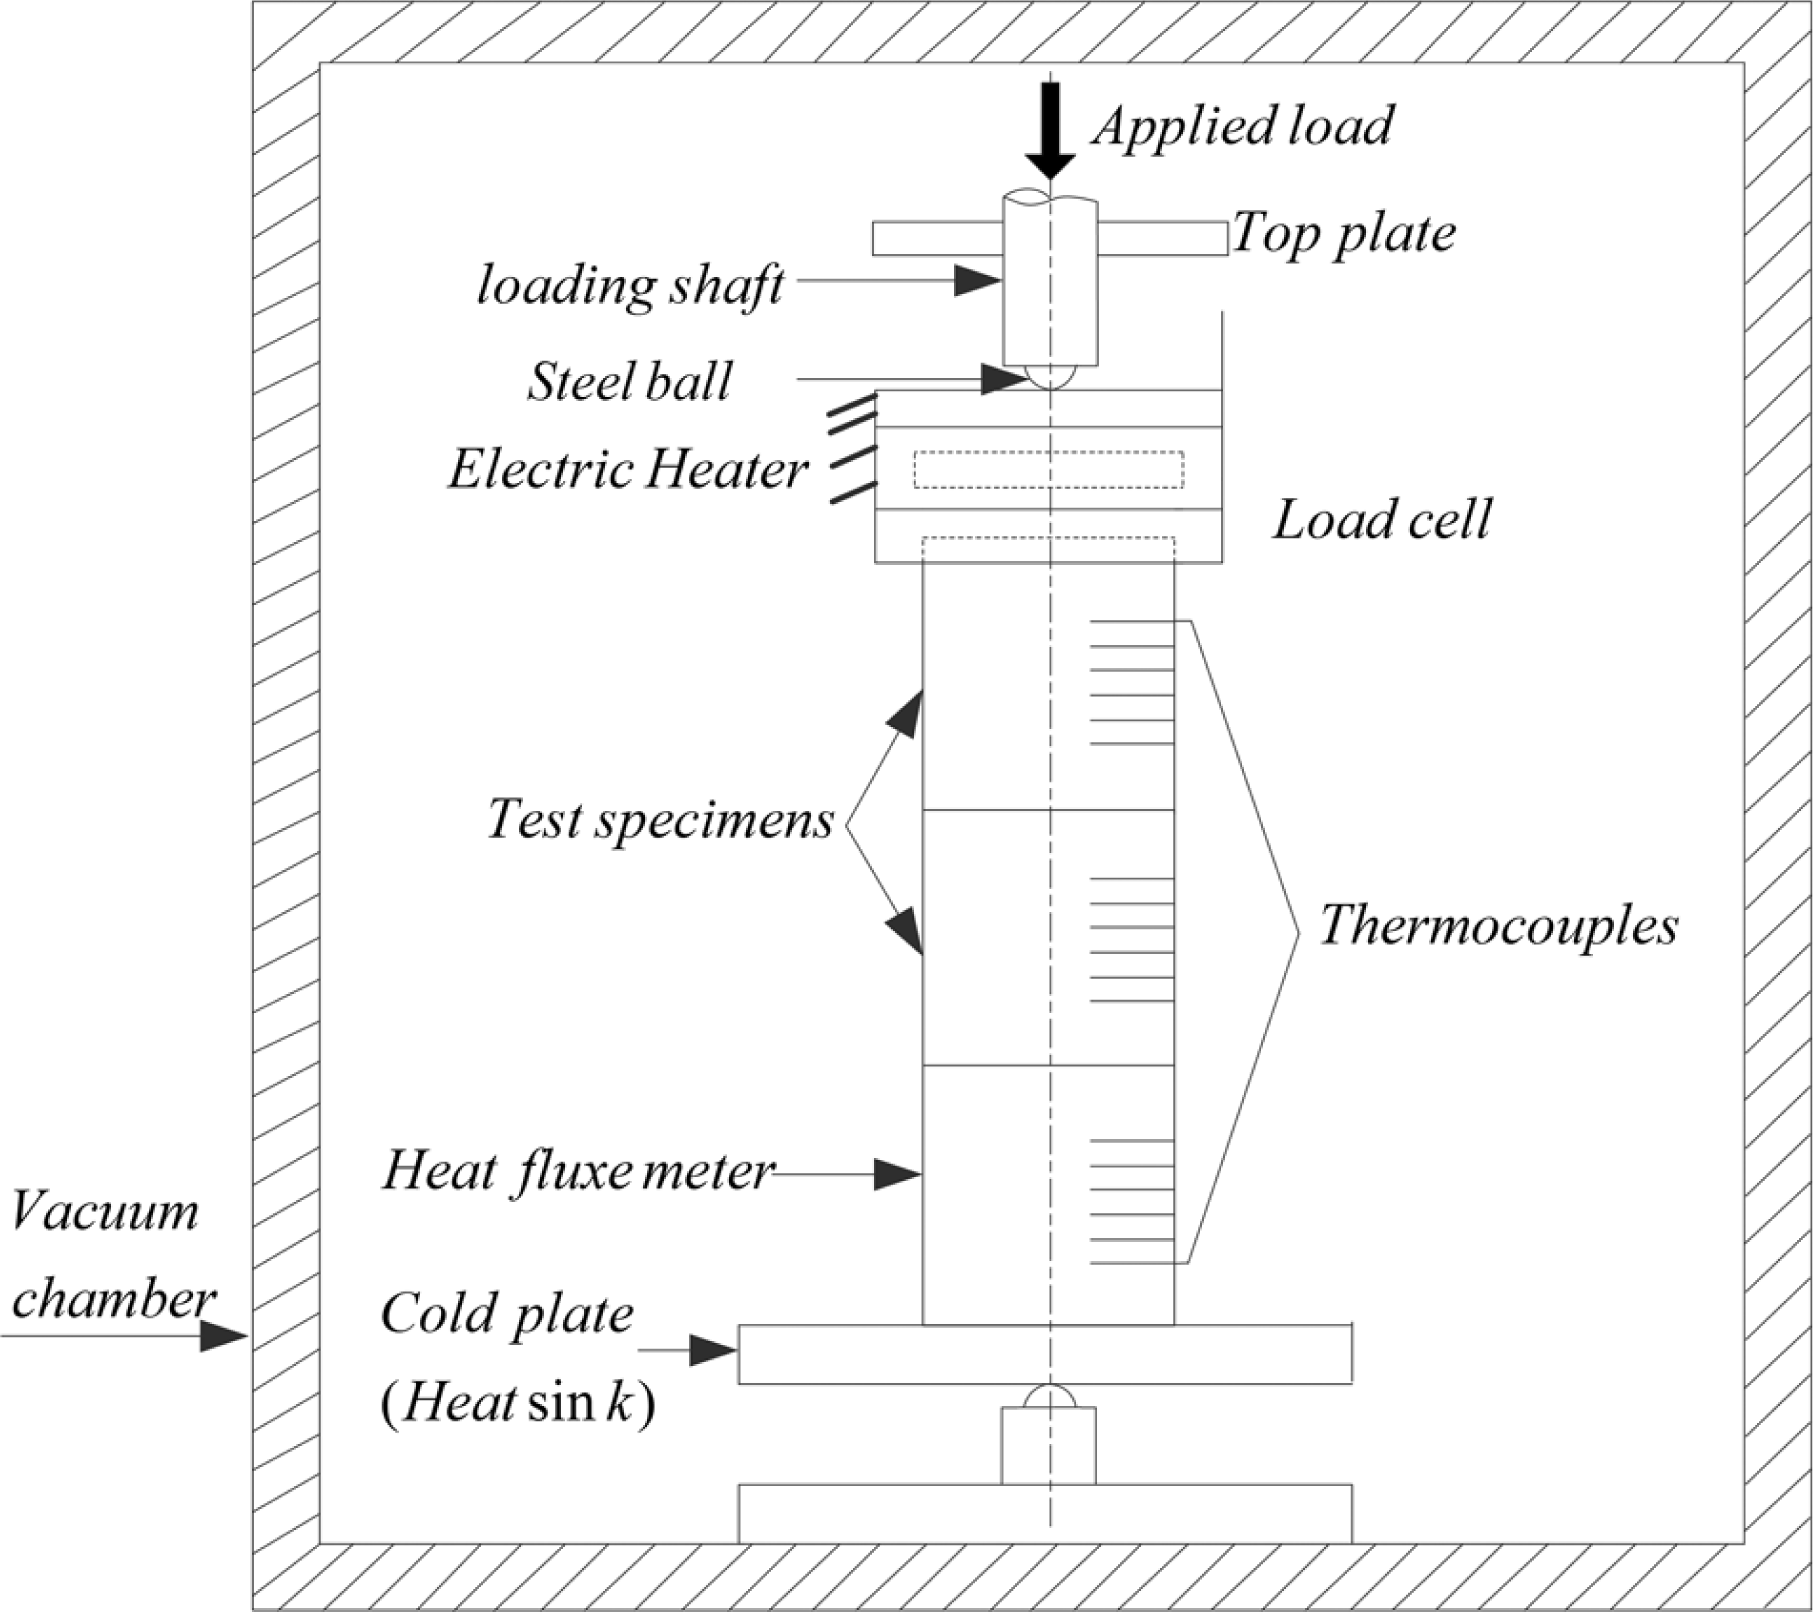
Experimental setup.
Experimental validation
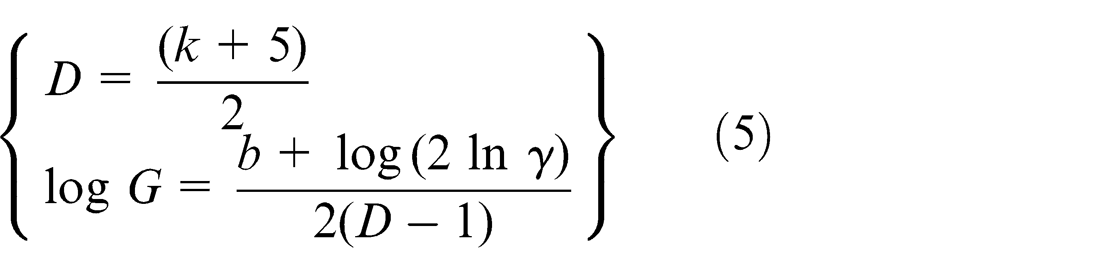
Identification of fractal parameters
The fractal parameters D and G can then be obtained from the experimental data and equation (5) by means of curve-fitting. The 3D rough topography of stainless steel 304, Al5052 steel and carbon steel is measured by the Olympus laser microscope, respectively. The topography of carbon steel is shown in Figure 9 and the machining trace can be seen clearly. The profile height along the X-direction is shown in Figure 10, and its value is the data source to identify fractal parameters G and D.
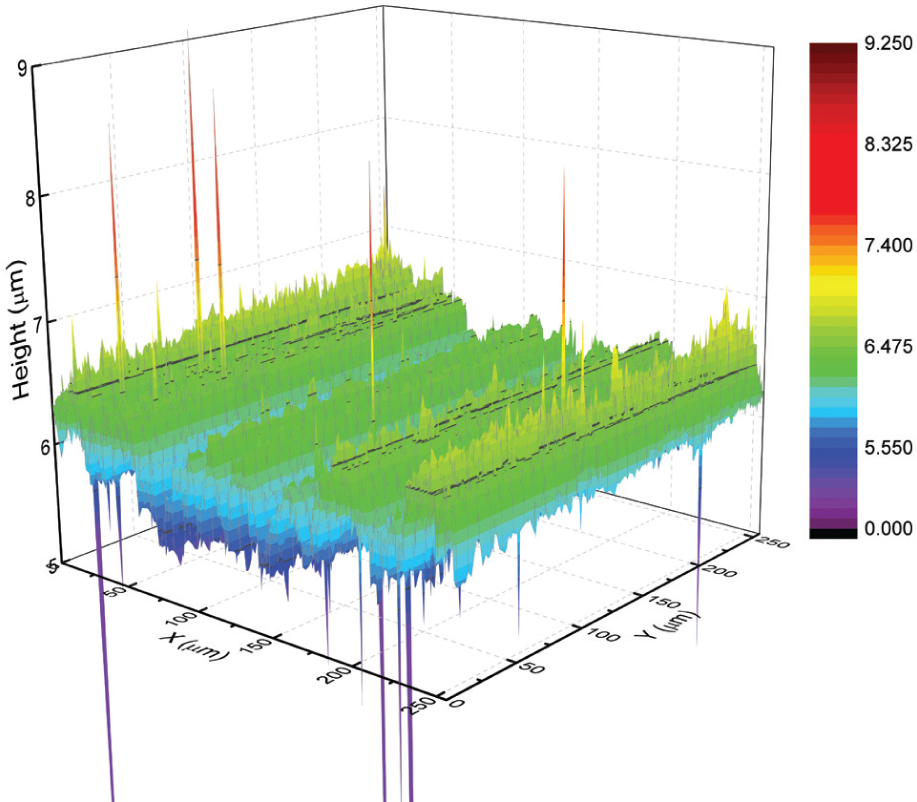
3D rough topography of stainless steel 304.
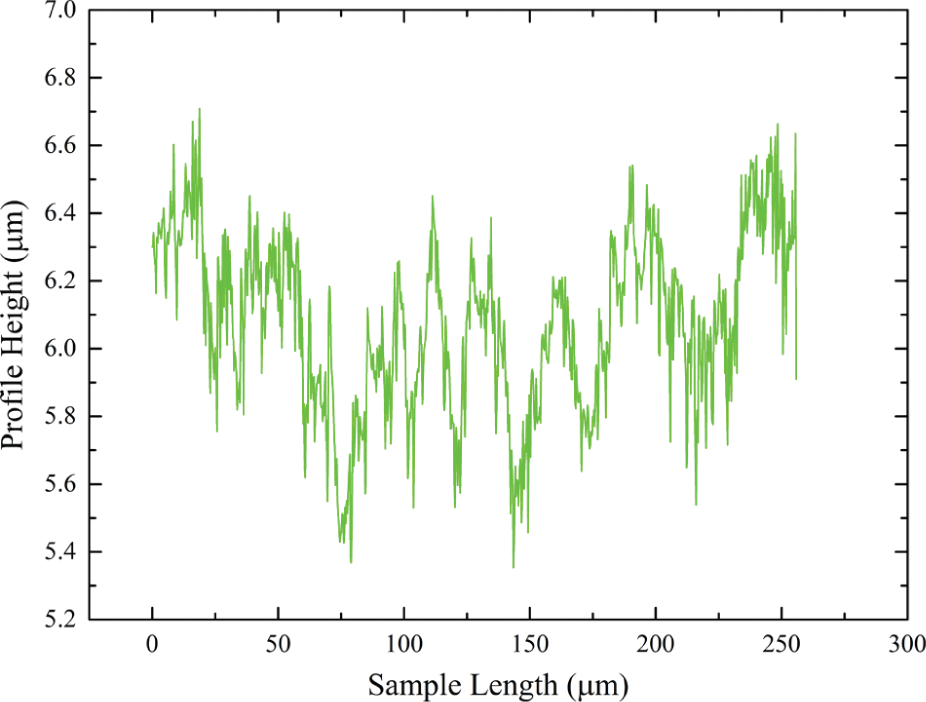
Profile height of X-direction.
In this article, the power spectral method shown in section “Fractal surface characterization and parameter identification” is utilized to identify the fractal parameters. The power spectrum of the W-M function is calculated by combining the data shown in Figure 10 and equation (2), as shown in Figure 11. It can be seen that the power spectrum is close to a linear function in higher frequency range, while in lower frequency range the error is relatively large. The main reason is that the lower frequency range corresponds to a relatively larger scale, and the surface morphology in the scale corresponding to lower frequency is susceptible to the machining methods, namely, the machining traces are obvious in the lower frequency range. Therefore, the data in the high frequencies are taken as the data source to identify the fractal parameters G and D, and the least squares fitting is used to obtain a straight line, as shown in equation (4a), and the fractal parameters can be calculated according to equation (5), which can be used as the input parameters for the TCC computational algorithms.
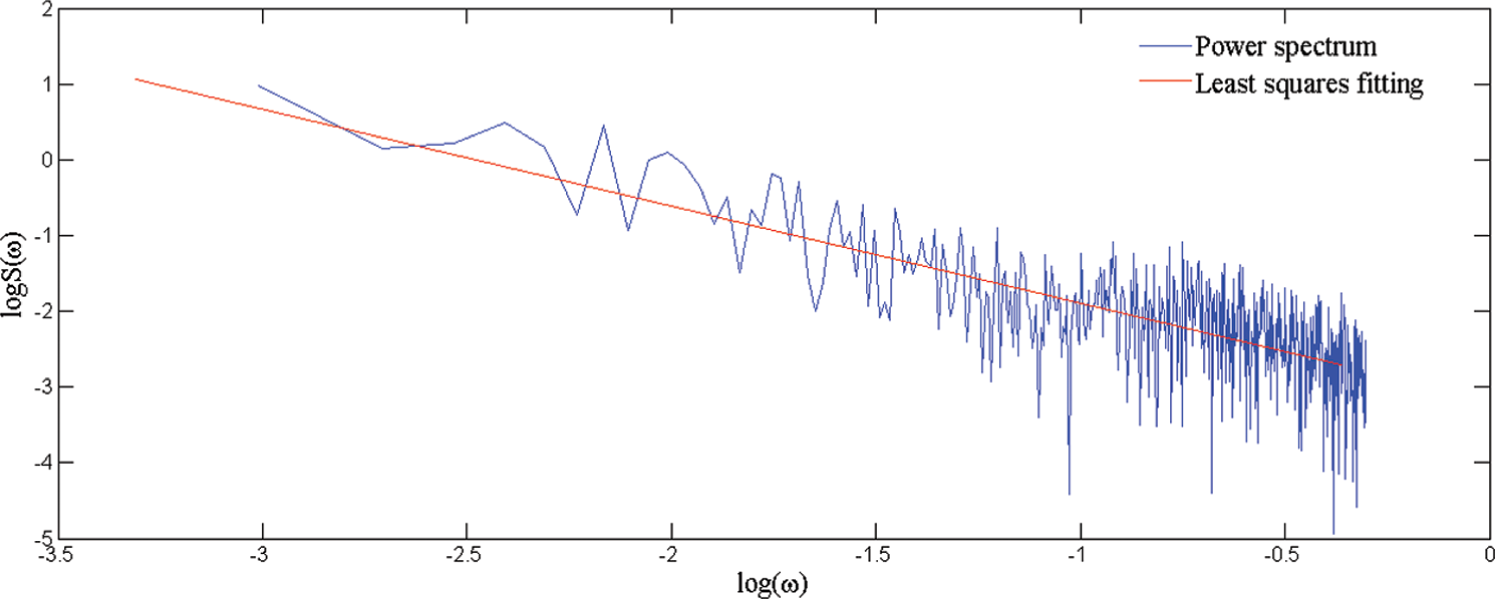
The power spectrum of X-direction morphologies.
The 3D rough topography of each surface is measured three times. The fractal parameters D and G are obtained by averaging the value of the three experiments. Assuming that g = −log (G), the results are shown in Table 2.
Relationship between fractal parameters and Ra .
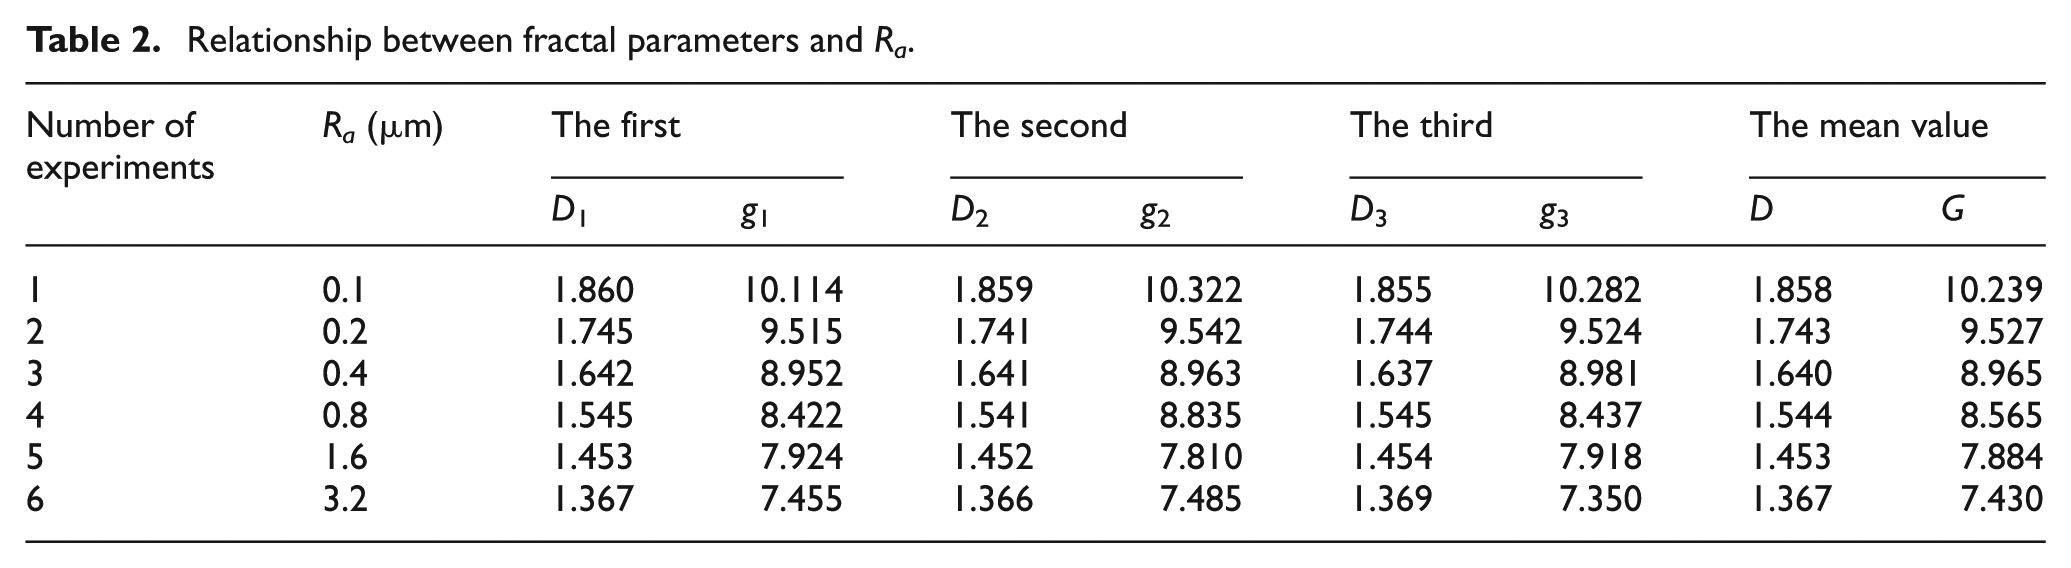
The mapping between the fractal parameters and roughness Ra can be obtained by means of curve-fitting of Table 2
Experimental validation
The experimental TCC of a particular pair of test specimens was determined from the estimated heat flux Q and the temperature drop across the interface
The temperature drop
where
In order to validate the effectiveness of the proposed predictive model of TCC, the present predictive model is compared with the experimental data and the existing correlations of Zou et al. 34 and Jackson et al., 35 as shown in Figure 12.
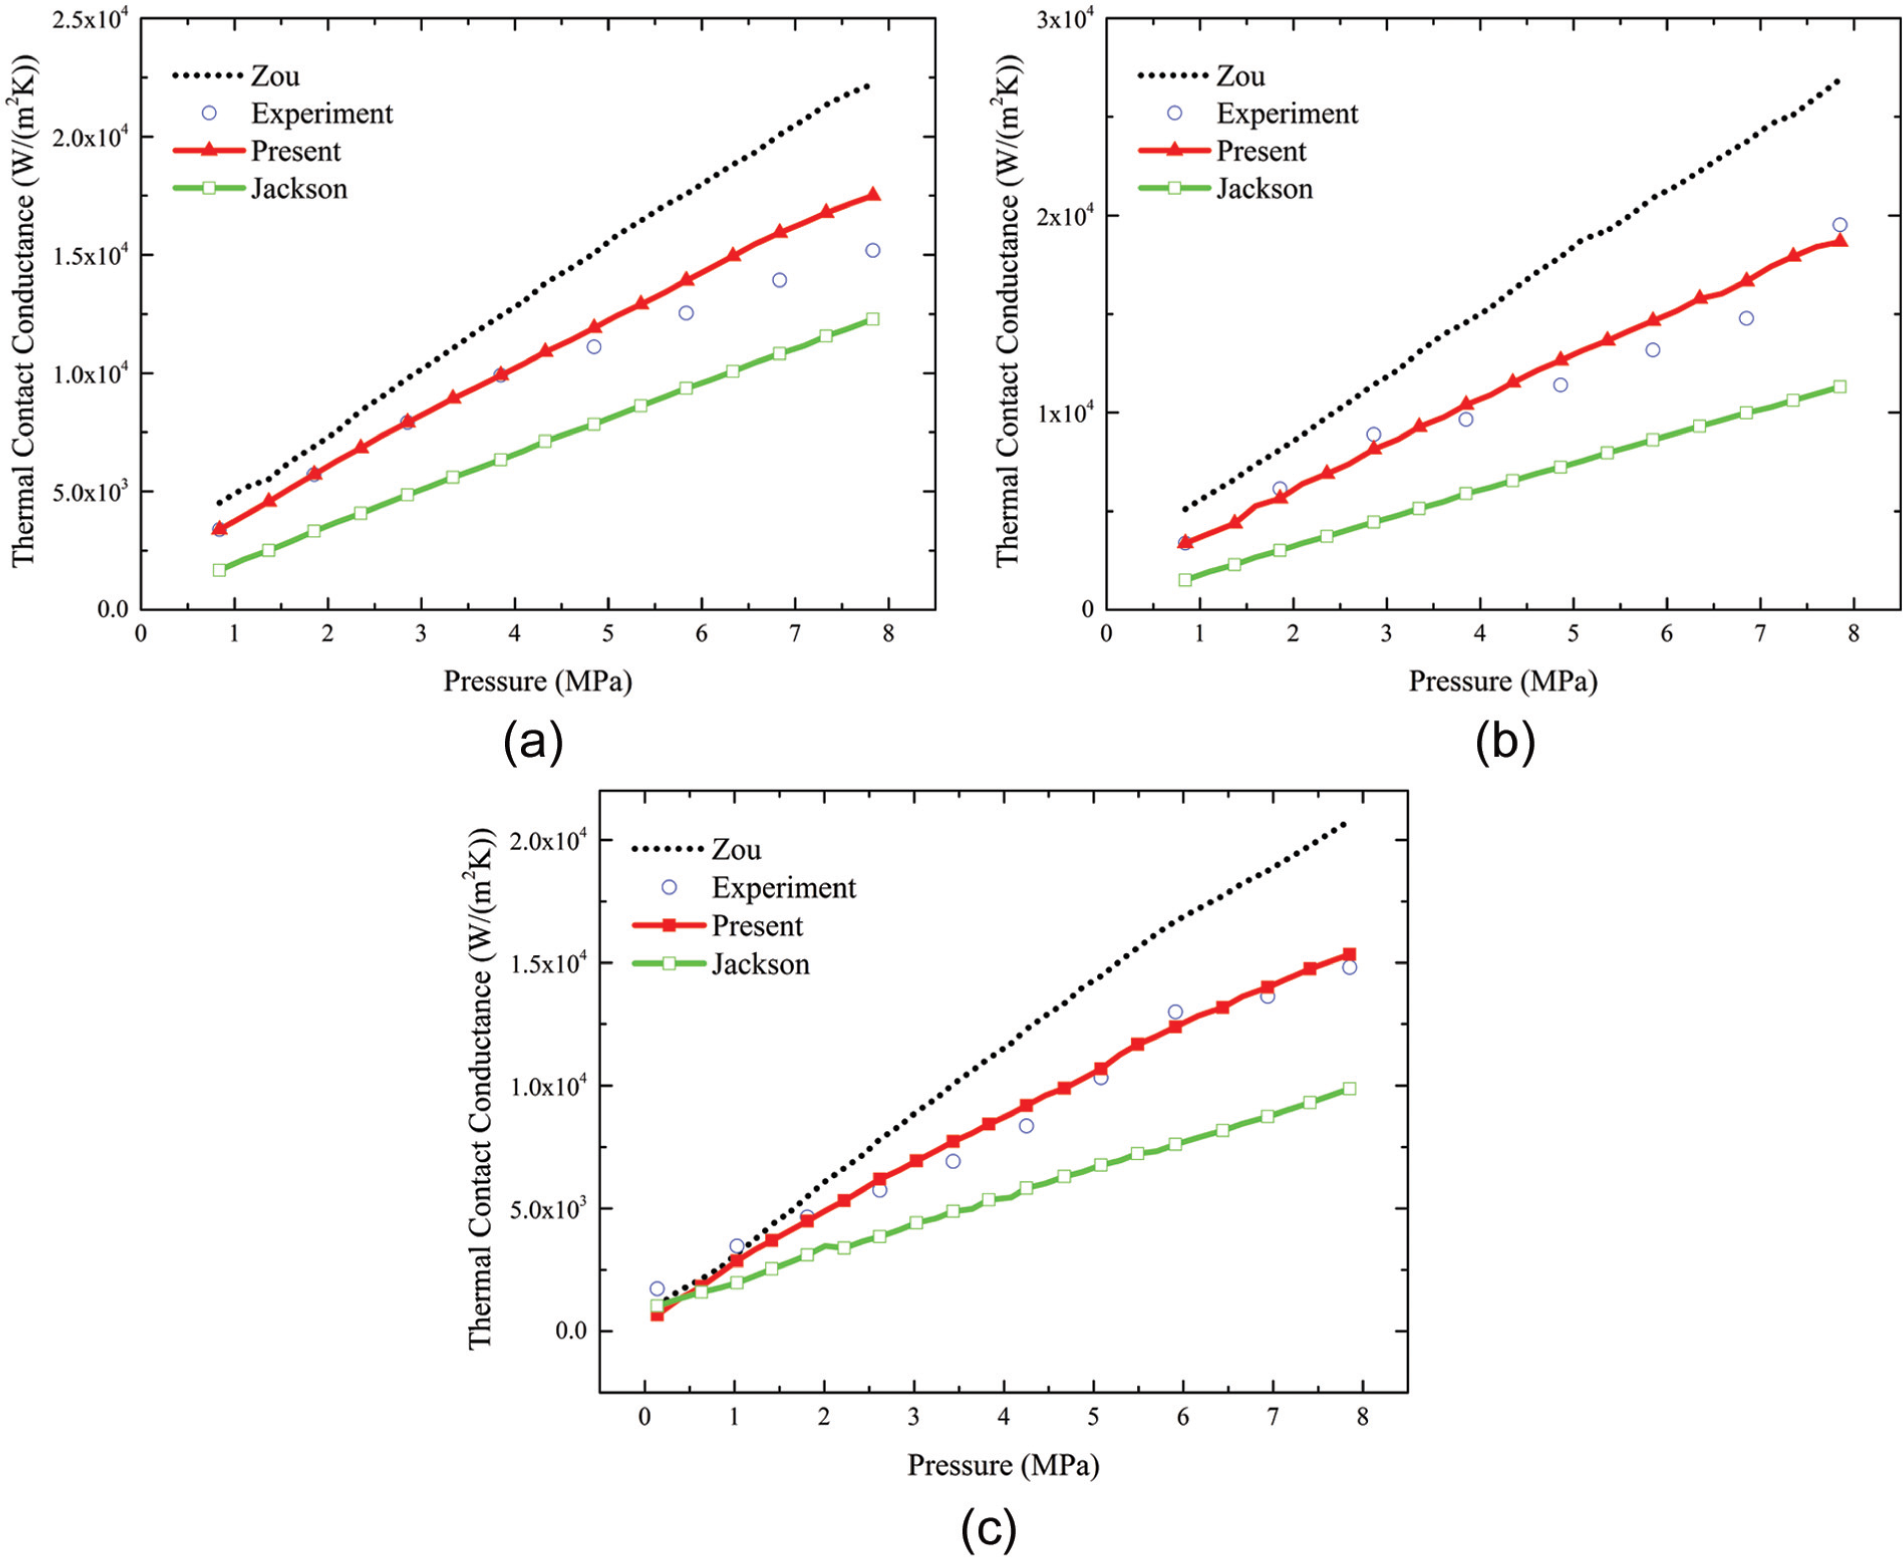
Comparison of predictions by algorithm with existing models and experimental data for test: (a) Al5052, (b) SS304 and (c) carbon steel.
It can be seen that the present predictive model agrees better with the experimental data than the correlation of Zou et al. 34 and Jackson et al. 35 and has a good prediction of TCC throughout the range of the contact pressure. The present predictive model has an average deviation of 7.8% for the test pair No. 1, 11.8% for the test pair No. 2 and 6.2% for the test pair No. 3 from the experimental data, respectively. In fact, it is assumed in Zou et al. 34 that only elastic and plastic deformations happen on the contacting asperities. Namely, the transition from the elastic deformation to plastic deformation is ignored. However, elastic and plastic deformations occur on the contacting asperities when the loads applied on the asperities are moderate. Therefore, it is unreasonable to ignore the elastic–plastic deformation of the asperity. Moreover, the influence of thermal contraction conductances on the value of TCCs is ignored in Jackson et al. 35 The model assumed that the heat transfer of joint surfaces is only influenced by the spread conductance and the complete deformation process of the asperities is neglected in this model. Namely, it can be seen that the assumptions made by both Zou et al. 34 and Jackson et al. 35 models deviate from the fact, resulting in the lower accuracy of the TCC prediction.
The deviation between the present model and experimental data increases with the load. The plastic deformation of the contact asperities accounts for the highest proportion in the actual contact area Ar , greater than 80%, while other asperities are under elastic and elastic–plastic contacts. This is consistent with the conclusion shown in Cooper et al., 13 namely, most of the contacting area is under plastic deformation.
TCC becomes larger as the load increases. The reason is that the increased load will aggravate the deformation of the asperities according to equation (24), namely, the real contact area Ar increases, and the thermal conductivity of the solid is much greater than the gap (air or vacuum) between the asperities, which results in a larger TCC.
Results and discussion
It can be seen from equation (33) that both the contact load and total TCC are influenced by the real contact area
Influence of contact load
It can be seen from Figure 12 that TCC increases with the interface pressure. As the contact pressure increases, more asperities enter into contact. The new formed contact area brings an increase in TCC. So, it can be concluded that the effect of interface pressure on TCC is achieved by changing the actual contact area. Actually, contact pressure is essential to the prediction of TCC. Therefore, it is meaningless to predict TCC without clarifying contact pressure.
Influence of surface roughness
In Figure 13, TCC was calculated by varying the mean roughness while other parameters remain constant. It can be seen that TCC depends on the mean roughness. It is shown that TCC decreases rapidly with the mean roughness in the range between 0 and 5. However, when the value of the mean roughness is bigger than 5, the TCC begins to decrease slowly. This is because the rougher the surface, the fewer are the contacting asperities, and the smaller the contacting area will be. Namely, the heat flux contract more obvious at the contact interface while the surface roughness increases, and it is more difficult for the heat to flow through the contact interface. Therefore, it can be concluded that the effect of surface roughness on TCC is achieved by changing the number of the contacting asperities. Besides, a higher value of D or a lower value of G results in a higher value of TCC.
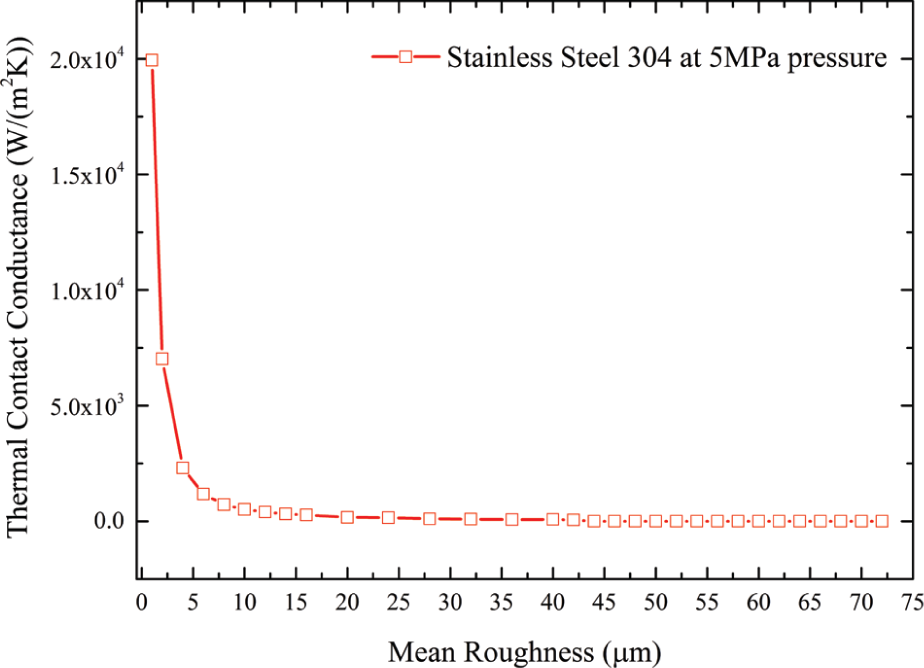
Influence of surface roughness on TCC.
Influence of asperity top radius
As expected, TCC was found to be larger with an assumption that the top curvature radius varies from asperity to asperity in Figure 14. The reason is that the asperity top curvature radius results in the difference in the maximum contact area aL , which determines the contact states of the asperities. Compared with the assumption of average asperity top curvature radius, the assumption of different asperity top curvature radius is more consistent with the actual situation because different scales of the asperities result in different contact areas. That is, the deformation of the asperities is more realistic.
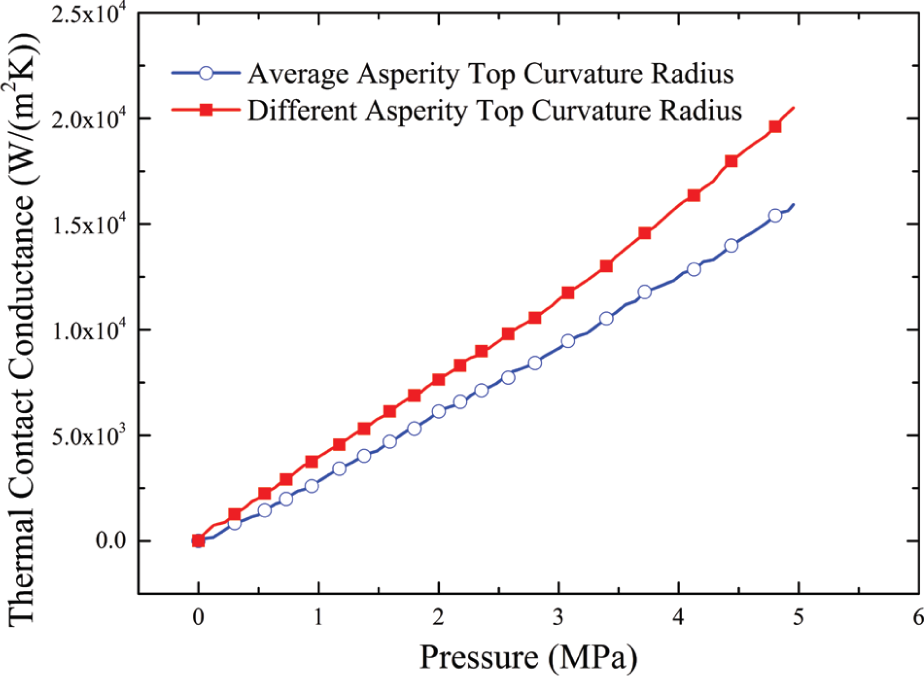
Influence of asperity top radius on TCC.
Influence of contact area
In Figure 15, TCC was found to be larger under the assumption that the contact area varies from asperity to asperity. This is because the contact area of every asperity has an influence on the actual contact area Ar , which has an influence on the maximum contact area, as shown in equation (24), and determines TCC, as shown in equation (33).
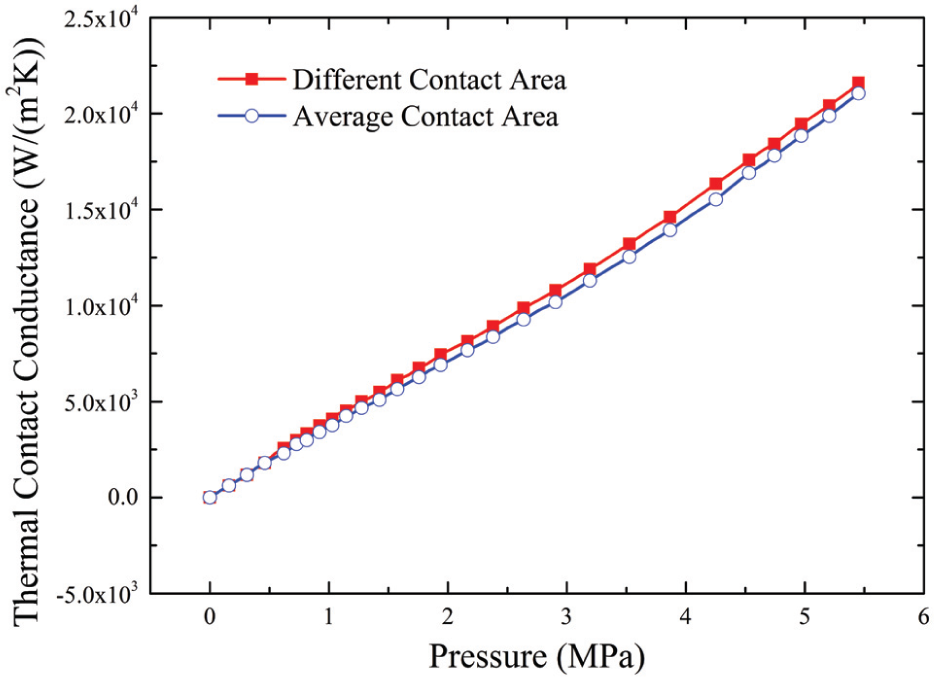
Influence of contact area on thermal contact conductance.
Influence of temperature
The influence of temperature on the dimensionless actual contact area (contact rate) is shown in Figure 16. It can be seen that the higher the temperature, the bigger is the contact rate of the interface. The reason is that the yield strength decreases with temperature so that the asperities deformed more easily when the temperature rises up, resulting in more asperities in contact. Therefore, the contact rate increases with the temperature. It can be concluded that the effect of the temperature on the contact rate is achieved by changing the physical parameters of the material.
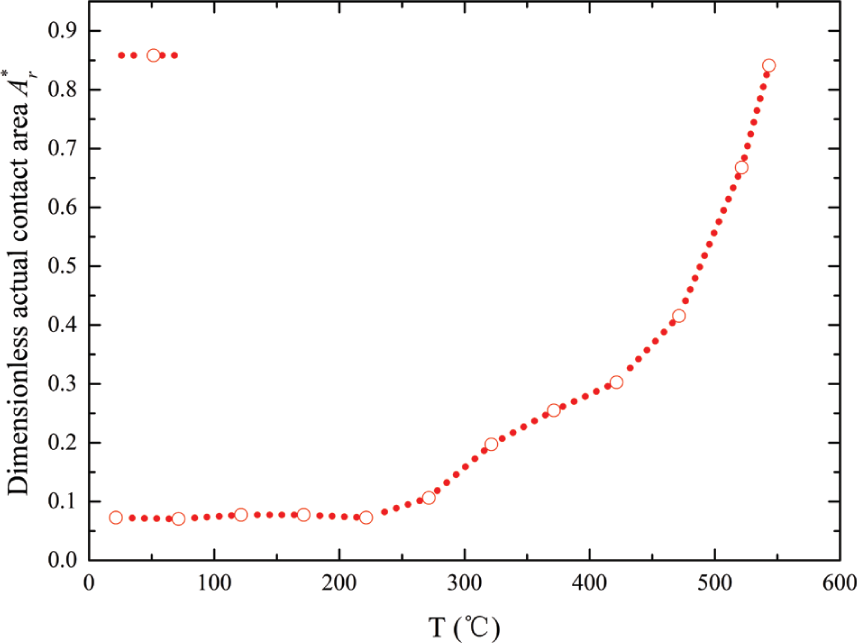
Influence of temperature on the dimensionless actual contact area.
The influence of the temperature on the TCC is shown in Figure 17. It can be seen that the higher the temperature, the greater the TCC at the interface. The actual contact area increases with the temperature, namely, heat flows through the contact interface more easily. Therefore, TCC increases with the temperature.
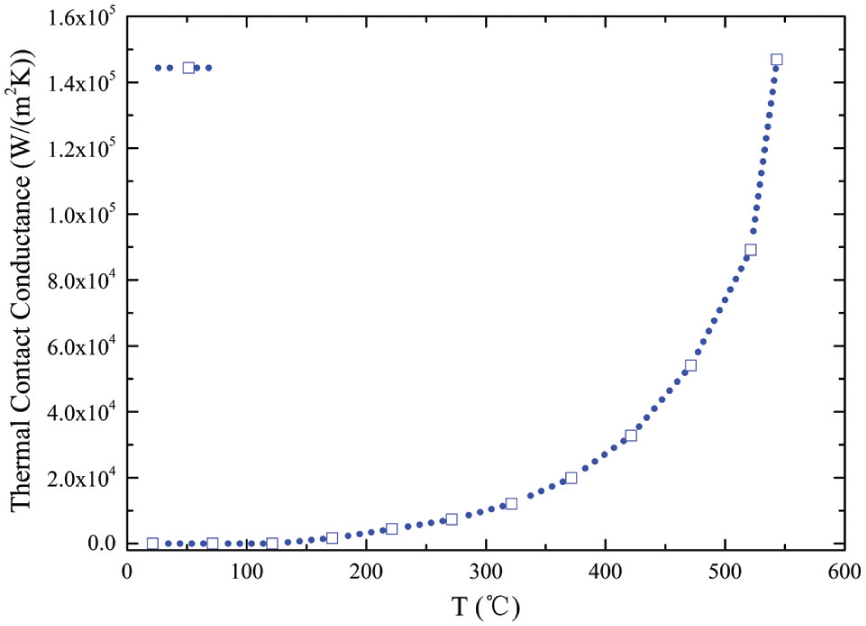
Influence of temperature on thermal conductance.
Conclusion
A comprehensive geometrical–mechanical–thermal model of TCC in vacuum environment was developed. In the model, the geometrical, mechanical and thermal behaviors of contacting asperities were investigated. The contacting surface topography was characterized by the W-M function with its multi-scale fractal behavior to describe the disorder, random and self-affinity characteristics of rough surfaces. The combined effect of elastic, elastic–plastic and fully plastic deformation was considered to develop the contact mechanics model which takes the whole deformation process of asperities into account. Based on the idea of Mikić model, the model to predict TCC was proposed. With the knowledge of the surface topography and material physical properties for a given contact pressure, TCC of the two contacting surfaces can be predicted. The fractal parameters are identified by measuring the surface topography. And the mapping between mean roughness and fractal parameters was established to facilitate the use of the W-M function. Compared with Zou et al. 34 model and Jackson et al. 35 model, the results showed good agreement, demonstrating the validity of the model. Based on the presented model, the main conclusions can be summarized as follows:
TCC increases with the increase in interface pressure. Therefore, it is meaningless to predict TCC without clarifying contact pressure.
Mean roughness is a main factor that has a significant effect on TCC. A higher value of mean roughness results in a lower value of TCC. Besides, a higher value of D or a lower value of G results in a higher value of TCC.
The influence of asperity top curvature radius on TCC is small. And the different asperity top radii are more consistent with the actual situation.
TCC increases with the total real contact area and contact load.
The effect of the temperature on the TCC can be explained by the enlargement of the actual contact area.
Numerical results from the present model show satisfactory agreement with the experimental data.
Footnotes
Declaration of conflicting interests
The author(s) declared no potential conflicts of interest with respect to the research, authorship, and/or publication of this article.
Funding
The author(s) disclosed receipt of the following financial support for the research, authorship, and/or publication of this article: This research was supported by the National High Technology Research and Development Program of China (grant no. 2012AA040 701).