
Abstract
Surface integrity determines the performance and quality of the end product. It often needs to change the input parameters, such as cutting parameter, cutting tool geometry and material, and tool coating, to obtain the best machining surface integrity. This article presents and demonstrates the effectiveness for the multi-objective optimization of cutter geometric parameters for surface integrity of milling Ti-5Al-5Mo-5V-1Cr-1Fe titanium alloy via grey relational analysis coupled with the Taguchi method, entropy weight method, and analytic hierarchy process. The main influence factors are chosen as radial rake angle, primary radial relief angle, and helix angle, while surface roughness and residual stress are taken as performance characteristics. Based on the Taguchi method, an L16 (43) orthogonal array is chosen for the experiments. The effect of cutter geometric parameters on surface roughness and residual stress is analysed by signal-to-noise ratio. Then, the multiple objectives optimization problem is successfully converted to a single-objective optimization of grey relational grade with the grey relational analysis. The weight coefficient for grey relational grade is determined by entropy weight method integrated with analytic hierarchy process. The results show that the order of importance for controllable factor to the milling surface integrity, in sequence, is radial rake angle, primary radial relief angle, and helix angle. The validation experiment verifies that the proposed optimization method has the ability to find out the optimal geometric parameters in terms of milling surface integrity.
Keywords
Introduction
The use of titanium and its alloys has increased recently due to their superior properties and improvements in machinability. Manufacturing of titanium alloys that are critical structural components of the aerospace industry is also a point of emphasis. Their poor machinability often results in unfavourable accuracy of the machined product dimensions or end product quality issues such as surface integrity and lower lifetime proneness. The final manufacturing process is decisive about the product surface quality, so it should be controlled and optimized. This study investigates the surface integrity of finish milling Ti-5Al-5Mo-5V-1Cr-1Fe titanium alloy and explores possible way to adjust cutter geometric parameters to achieve better surface integrity.
Many researches focused on the machined surface integrity in recent years. The research of Sun showed that the machined surface exhibits an anisotropic nature for end milling Ti-6Al-4V, and the
These literature surveys focus on the surface integrity and provide practical approach to obtain the optimal process parameters. But it also has heighted the dearth of information available to understand the effect of cutter geometric parameters on surface integrity. In addition, it is challenging to obtain excellent surface integrity without losing production efficiency for the cutting parameter optimization. A large material removal rate improves production efficiency, but maybe generates unfavourable surface integrity properties. 8 Hence, it is the advantage to obtain a better surface integrity by optimizing the cutter geometric parameters.
Many researches indicated that cutter geometry has significant influence on the machining process and quality characteristics. Different combinations of cutter geometric parameters might produce large variations in the final product quality. For instance, a variable pitch or helix milling tool can be used to reduce the cutting force and improve the machined surface quality by suppressing the machining chatter.9–12 Zain et al. 13 applied the genetic algorithm and regression model to find the optimal solution of the cutting conditions (radial rake angle, cutting speed, and feed rate) that yielded the minimum value surface roughness. Wang et al. 14 built an analysis model of parameters affecting performance in high-speed milling of AISI H13 tool steel considering cutter geometric parameters and cutting parameters. Their experimental results indicated that the contributions of tool grinding precision, geometric angle, and cutting conditions to the performance characteristics are 11.8%, 9.8%, and 73.1%, respectively. Arunachalam et al. 15 studied the effect of insert shape, cutting edge preparation, type and nose radius on both residual stresses, and surface finish. They suggested that coated carbide cutting tool inserts of round shape, chamfered cutting edge preparation, negative type and small nose radius (0.8 mm), and coolant would generate primarily compressive residual stress.
From the above analyses, it can be seen that cutter geometric parameters influence the machining process and performance significantly. Therefore, this study attempts to determine the influence weight of these factors on multiple surface integrity properties. Considering the structure complexity and variety of mill, the current technique’s challenge is to design the various cutter geometric parameters that yield optimum surface integrity, which is a multi-objective optimization problem.
The grey relational analysis (GRA) with the Taguchi method (grey–Taguchi) is an effective approach to solve the multi-objective optimization problem. This method has been widely applied in recent years for optimal process parameter design of multiple performance characteristics.16–23 In the traditional machining, Kopac and Krajnik 24 applied the grey–Taguchi method to the robust design of flank milling parameters dealing with the optimization of the cutting loads, milled surface roughness, and the material removal rate. They obtained optimal parameter combination of coolant employment, number of end mill flutes, cutting speed, feed, axial depth of cut, and radial depth of cut. Tsao 25 adopted the grey–Taguchi method to optimize the milling parameters on A6061P-T651 aluminium alloy with multiple performance characteristics. Haq et al. 26 optimized drilling parameters with the considerations of multiple responses such as surface roughness, cutting force, and torque for drilling Al/SiC metal matrix composite with the GRA in the Taguchi method. Köklü 27 focused on the optimization of the continuous and interrupted cylindrical grinding of AISI 4140 steel considering the effect of workpiece speed, depth of cut, and the number of slots on the surface roughness and roundness error using the grey-based Taguchi method.
To sum up, even though the effect of process parameters on the machined surface integrity has been accumulated a lot, results are mainly dependent on complicated factors. Furthermore, the factors that these studies focused on are very dispersed and the surface integrity is not integrately evaluated. The multi-objective optimization of radial rake angle, primary radial relief angle, and helix angle for milling surface integrity is not yet available. More empirical studies should be carried out to test the impact and optimization processes of different combination of cutter geometric parameters. Therefore, this research focuses on the mill geometry optimization and machined surface integrity for milling Ti-5Al-5Mo-5V-1Cr-1Fe titanium alloy and introduces the grey–Taguchi method to search the optimal cutter geometric parameters. The design factors are selected as radial rake angle, primary radial relief angle, and helix angle, while the surface integrity are evaluated by surface roughness and surface residual stress. Additionally, the influences of cutter geometric parameters on surface integrity are analysed with the Taguchi method. Then, the correlations between the factors and surface integrity are studied using the GRA method. Finally, a validation experiment verifies the effectiveness of this approach. The multi-objective optimization flow diagram of cutter geometric parameters using a modified grey–Taguchi method is illustrated in Figure 1.
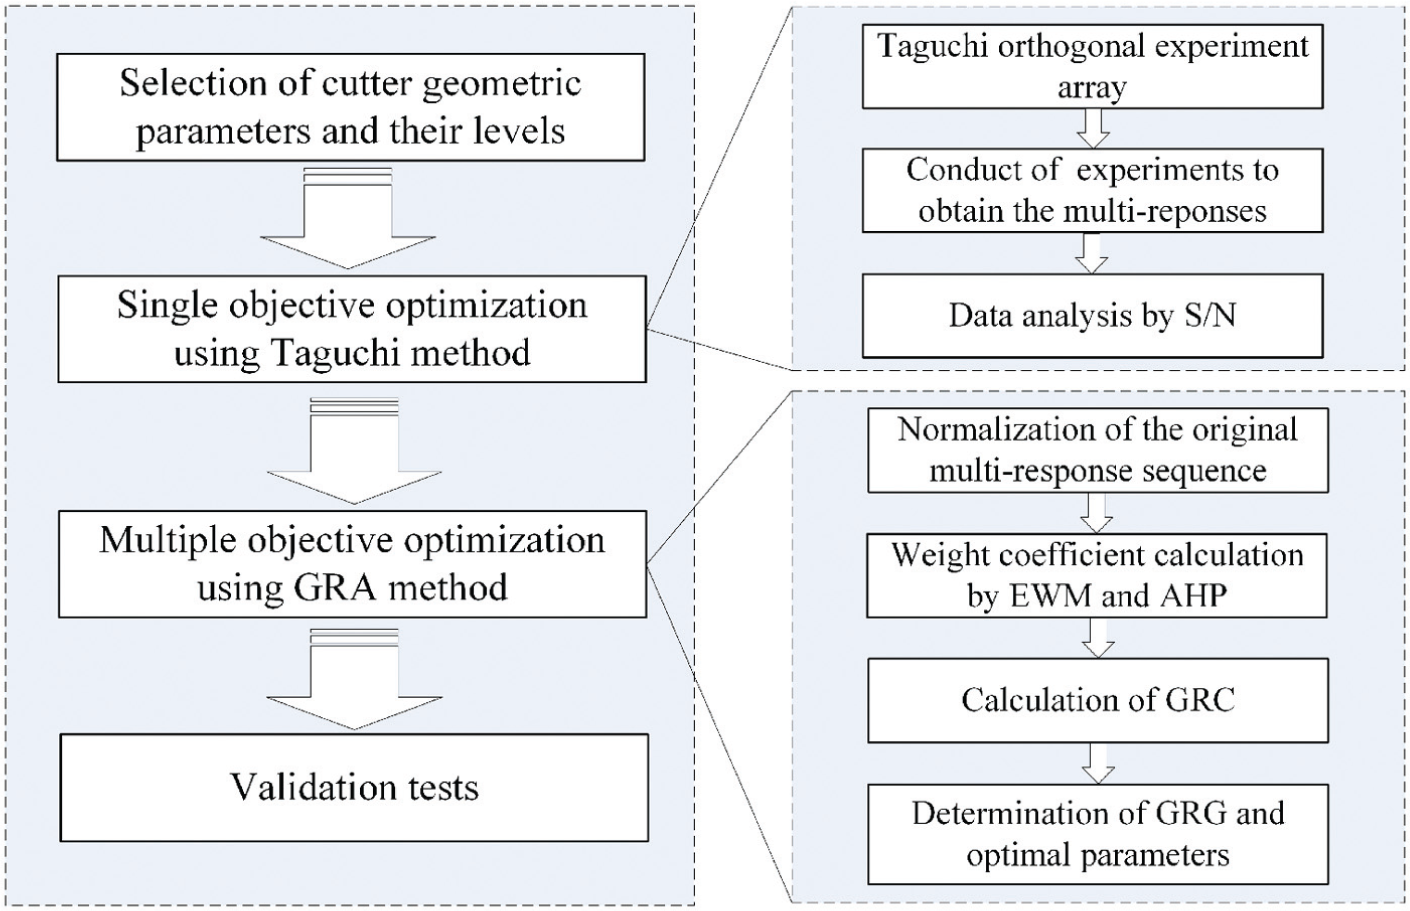
Multi-objective optimization flow diagram of cutter geometric parameters.
Experimental procedure
Machining setup
A set of milling experiments is conducted in a three-coordinate vertical computer numerical control (CNC) machining centre—JOHNFORD VMC-850 with maximum spindle speed of 8000 rpm, maximum feed rate of 12 m/min, and spindle power of 10 hp. The workpiece material used in all experiments is Ti-5Al-5Mo-5V-1Cr-1Fe titanium alloy. The chemical composition is Al: 4.4-5.9wt%, Mo: 4.0-5.5wt%, V: 4.0-5.5wt%, Cr: 0.5-1.5wt%, Fe: 0.5-1.5wt%, C: 0.1wt%, Si: 0.15wt%, Zr: 0.3wt%, N: 0.05wt%, H: 0.015wt%, O: 0.2wt%, and the rest of Ti. The shapes of workpieces are oblong blocks with the size of 71 mm × 55 mm × 49 mm. The cutters are four-flute toroidal end mills with the carbide body K40, diameter of 12 mm, circular arc radius of 2 mm, and uncoated edge. To reduce the influence of tool wear, a fresh cutter is used in each experiment. The milling parameters in each experiment are fixed at the level with spindle speed s = 500 r/min, axial milling depth ap = 5 mm, radial milling depth ae = 1 mm, and feed rate fz = 0.035 mm/z. The overhang length of toroidal end mill is fixed as 44 mm. All cutting experiments are performed in down milling using emulsified liquid. Figure 2 shows the milling process.
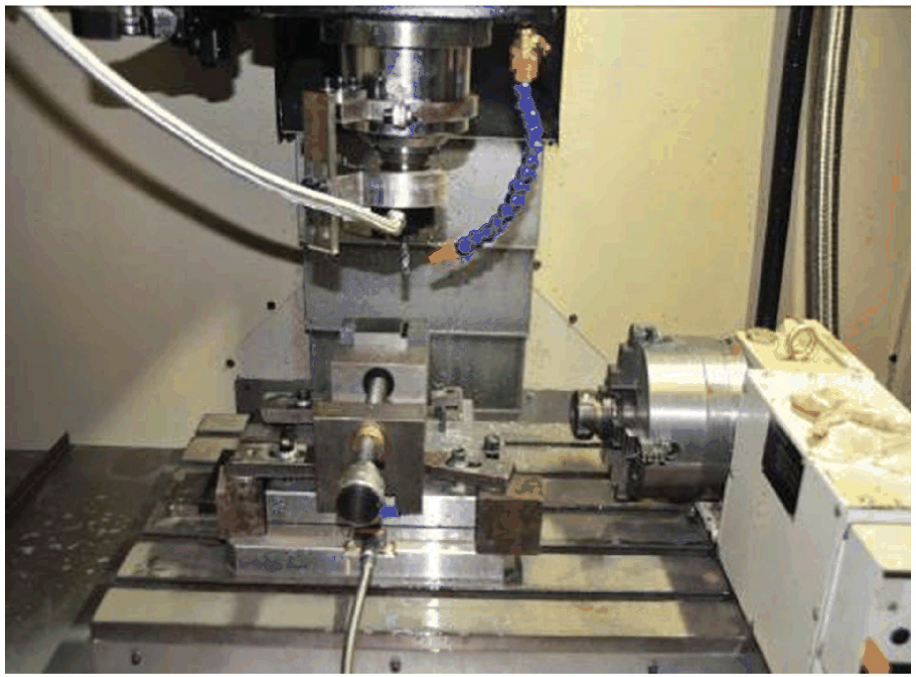
Milling process.
Experimental design
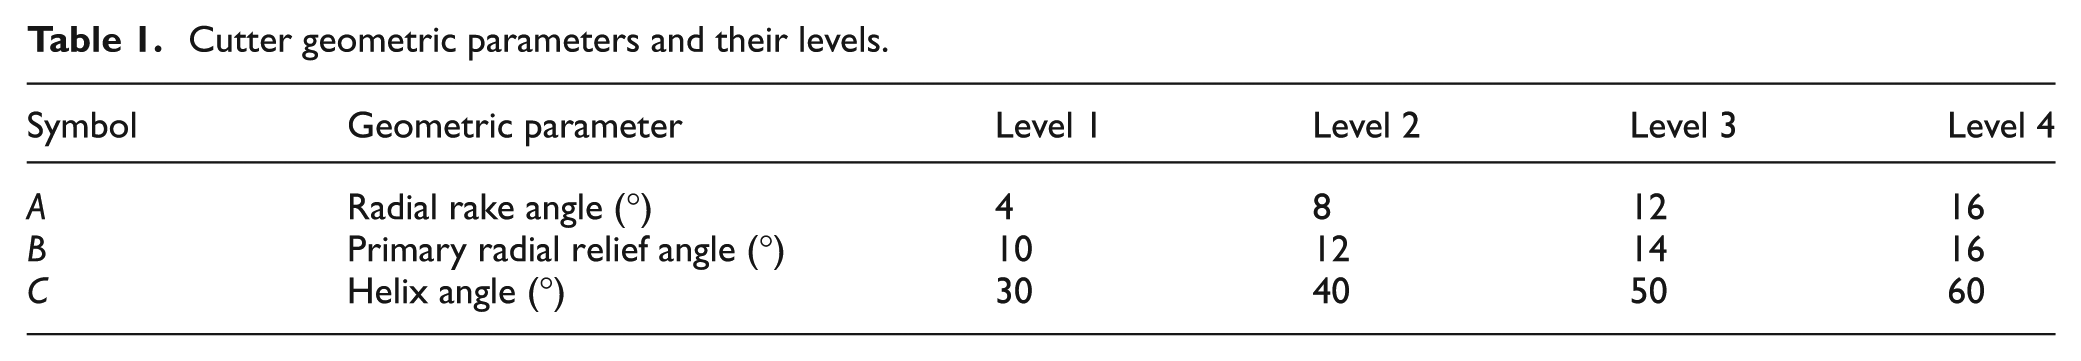
This study discusses the relationship between cutter geometric parameters and the surface integrity of milling Ti-5Al-5Mo-5V-1Cr-1Fe titanium alloy in order to obtain the optimal geometric parameter combination. First, the objective performance characteristics are focused on two aspects: surface roughness and surface residual stress. The performance characteristics for surface roughness contain the surface roughness of machined bottom surface and side surface, denoted as SRb and SRs respectively. The residual stresses are the surface residual stress of machined bottom surface and side surface, denoted as RSb and RSs , respectively. The machined bottom surface is formed by the end edges, while the machined side surface is formed by the side edges. Next, the control process parameters having influence on the surface integrity properties are radial rake angle (A), primary radial relief angle (B), and helix angle (C). Table 1 lists the cutter geometric parameters and their levels. Figure 3 diagrammatizes these three kind of angles. Radial rake angle indicates the angle of the flute face with respect to a line drawn from the cutting edge at the outer diameter to the centre of the tool. Most toroidal end mills are ground with positive rake angles. In application, larger positive rake angles are used on softer materials, and smaller positive rake angles are used on harder materials. Primary radial relief angle is ground for the length of cut to provide clearance behind the cutting edge. In general, larger relief angle is favoured for softer materials, and smaller relief angle are used for harder materials. Helix angle is defined as the inclination of the cutting edges with respect to the axis of the tool. Then, these experiments are conducted with a three controllable four-level factors and four response variables. Therefore, the Taguchi orthogonal array L16 (43) is used to reduce the number of experiments, as shown in Table 2.
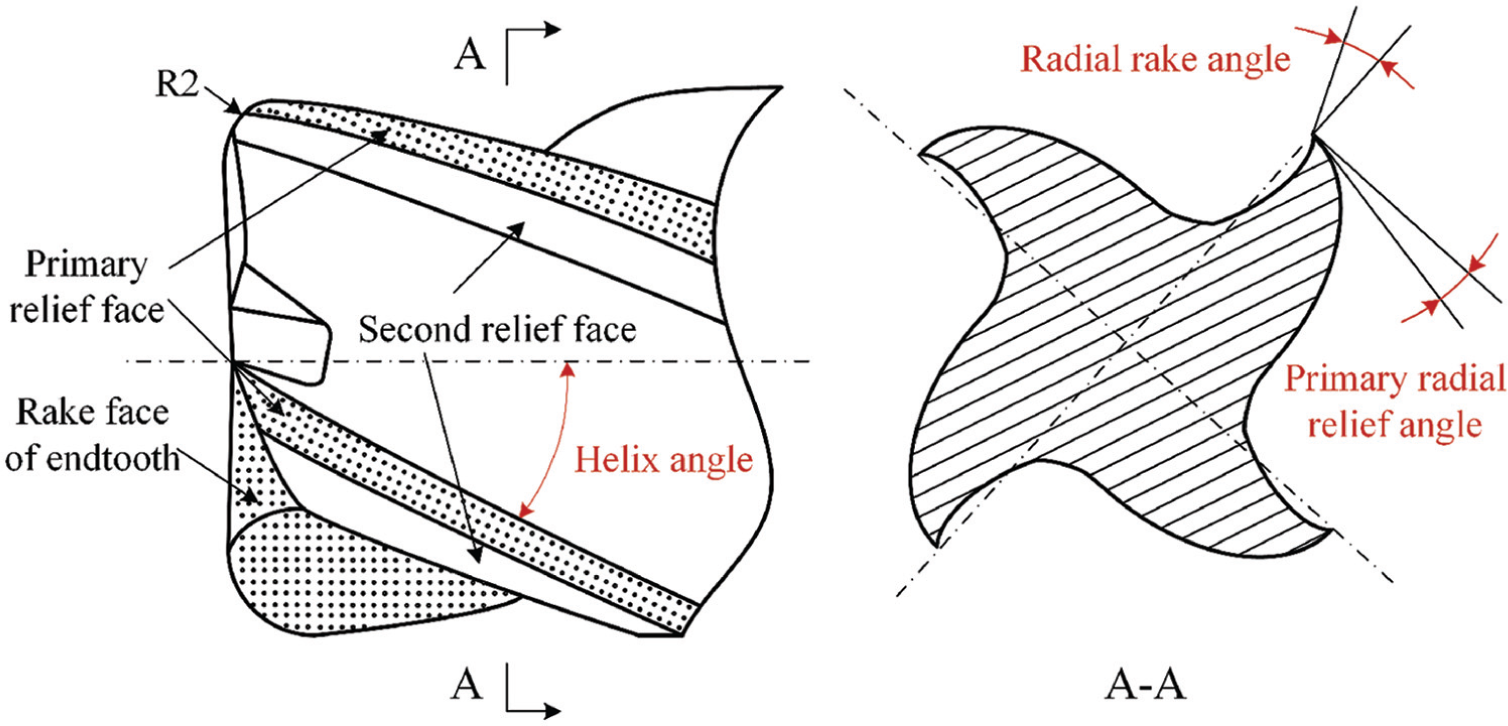
Geometrical parameters of a toroidal end mill.
Cutter geometric parameters and their levels.
Taguchi L16 (43) orthogonal array and experimental results.
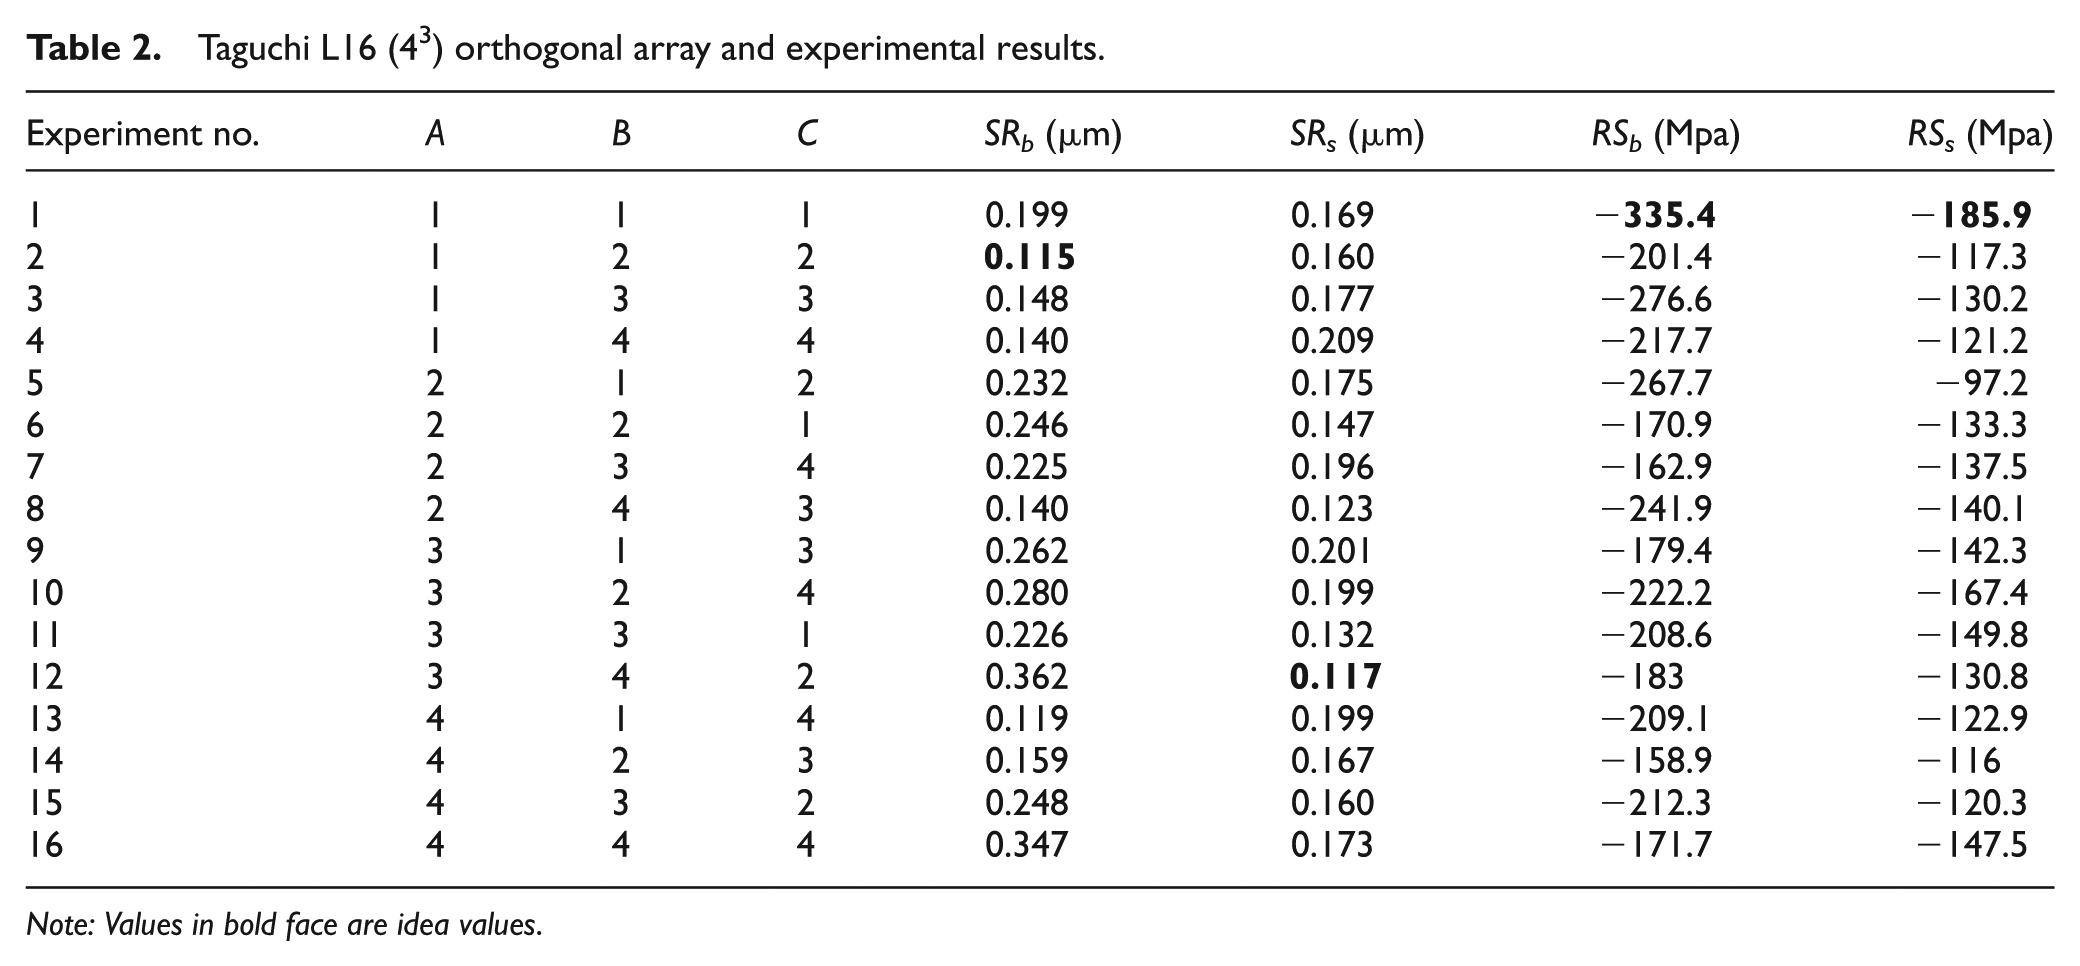
Note: Values in bold face are idea values.
Measurement procedure
Surface integrity includes the mechanical properties, such as residual stress, hardness, and microstructural changes, and topological parameters such as surface roughness. In this study, the surface roughness and residual stress are taken as assessment criteria for surface integrity of milling Ti-5Al-5Mo-5V-1Cr-1Fe titanium alloy. The expressed surface roughness in this article is the arithmetic mean deviation of the surface roughness profile Ra. The surface roughness of machined surface is measured in feed direction by surface roughness tester MarSurf M 300 C, made by MAHR Co. Ltd, as shown in Figure 4. An average value of five measurements of surface roughness is used to evaluate geometric accuracy of machined surface. Measuring residual stress is very difficult. X-ray diffraction (XRD) method stands out as the reliable, nondestructive, and easily accessible technique. In this method, the surface residual stress is measured in PROTO LXRD MG2000, made by PROTO Co. Ltd, with Gu-Kα radiation using XRD method. Figure 5 illustrates the measurement process of surface residual stress. The surface residual stress in feed direction is used to evaluate the physical property of machined surface. An average of two measurements of surface residual stress is taken as the results.
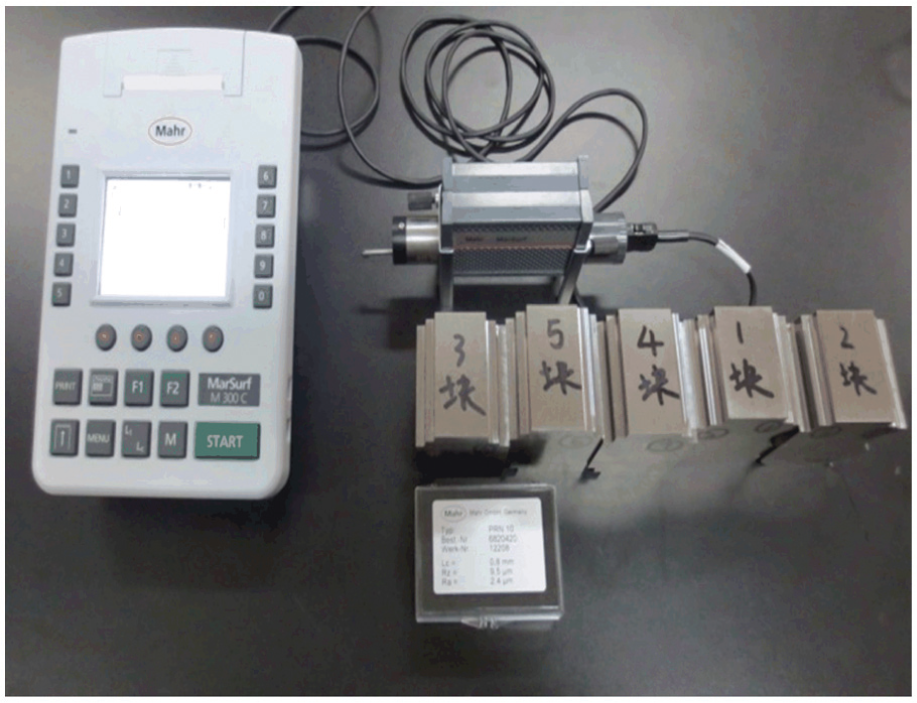
Surface roughness measurement.
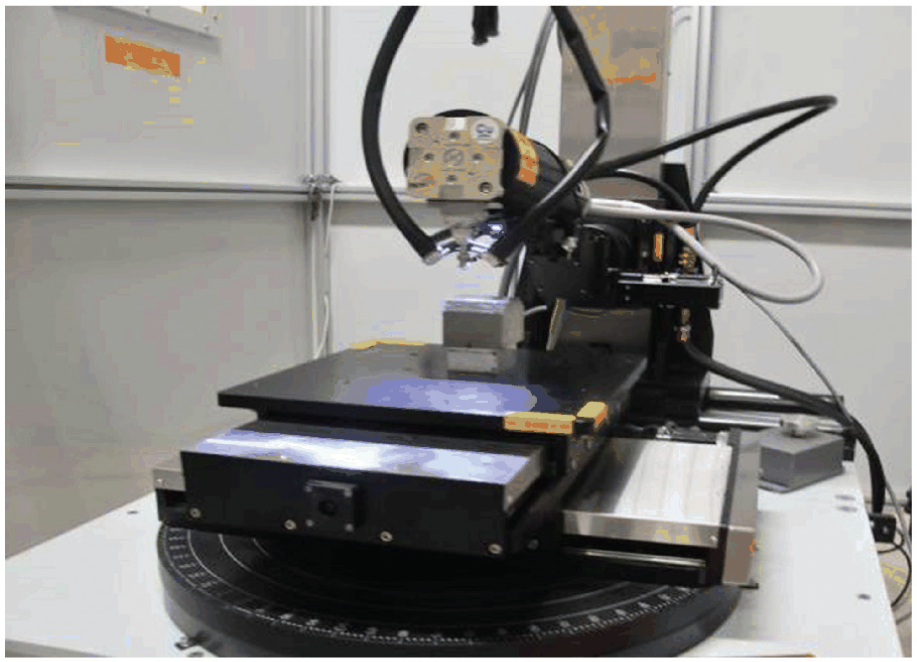
Surface residual stress measurement.
Experimental results and discussion
Analysis of signal-to-noise ratio for single performance characteristic
Table 2 shows the measurement results of surface roughness and residual stress for the 16 experiments. Negative sign of residual stress only represents that the residual stress is compressive and is not taken in the calculation. In order to study the effect of cutter geometry on the surface integrity, the Taguchi method is used to seek the optimal level combination of cutter geometric parameters for single surface integrity property.
The Taguchi method is a simple and effective solution for parameter design and experiment planning. 28 In this method, Taguchi recommended analysing the performance of process response using signal-to-noise (S/N) ratio, in which the largest value of S/N is required. There are three types of S/N ratio—the larger-the-better model (LBM), the smaller-the-better model (SBM), and the nominal-the-better model (NBM). 29
LBM
Maximum response characteristic means that the target extreme value is infinity. The S/N ratio is as below
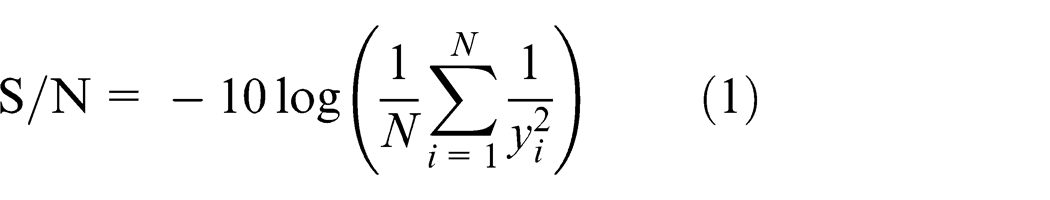
where yi is the response value of the ith test and N is the number of measurements in each test.
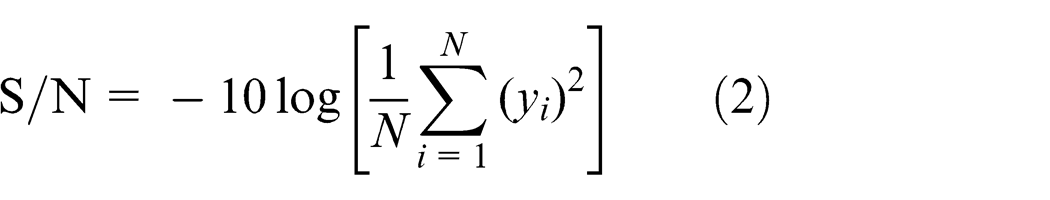
SBM
Minimum response characteristic means that the target extreme value will be 0. The S/N ratio with a smaller-the-better characteristic is defined as follows
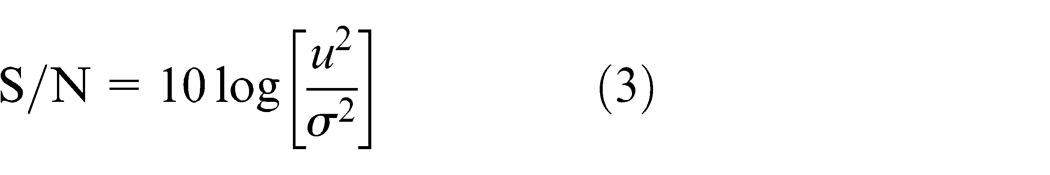
NBM
Targeted response characteristic means that the response result is the target value. The S/N ratio can be expressed as below
where
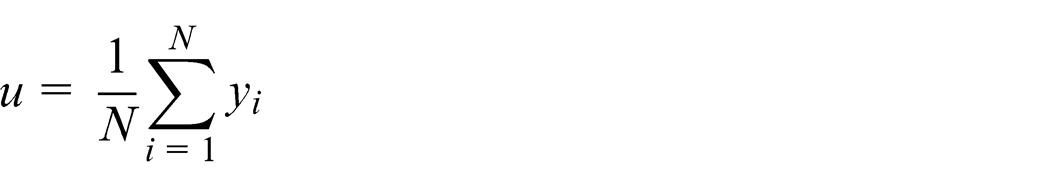
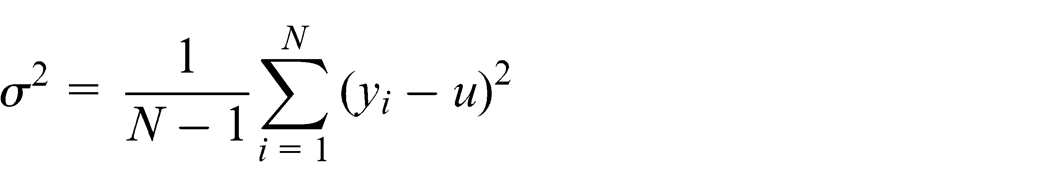
and
Obviously, smaller values of surface roughness are desirable. Thus, the data sequences have a smaller-the-better characteristic and the SBM, and equation (2) is used to calculate the S/N ratio. Higher tensile residual stress tends to present potential risk in terms of crack initiation and propagation, and fatigue failure of end products, but the compressive residual stress has the opposite effect. Now that all these measurement results present compressive surface residual stresses, and the LBM of S/N ratio can be used to calculate the S/N ratio for surface residual stress.
Table 3 shows the results of S/N ratio. A higher S/N ratio value represents that the response value is closer to the expected performance characteristic. According to this criterion, it is obviously observed that experiment no. 2 has the maximum S/N ratio for bottom surface roughness. It means the optimum combination of cutter geometric parameters is A1B2C2 among the experiment arrays. Side surface roughness has a higher S/N ratio in experiment no. 12 than that in the others. Therefore, the design factors A3B4C2 should be selected if only considering the side surface roughness for milling Ti-5Al-5Mo-5V-1Cr-1Fe titanium alloy. As to the surface residual stress, the largest value can be obtained from experiment no. 1 at levels A1B1C1 among the 16 experiments.
The S/N ratio of the experimental results.
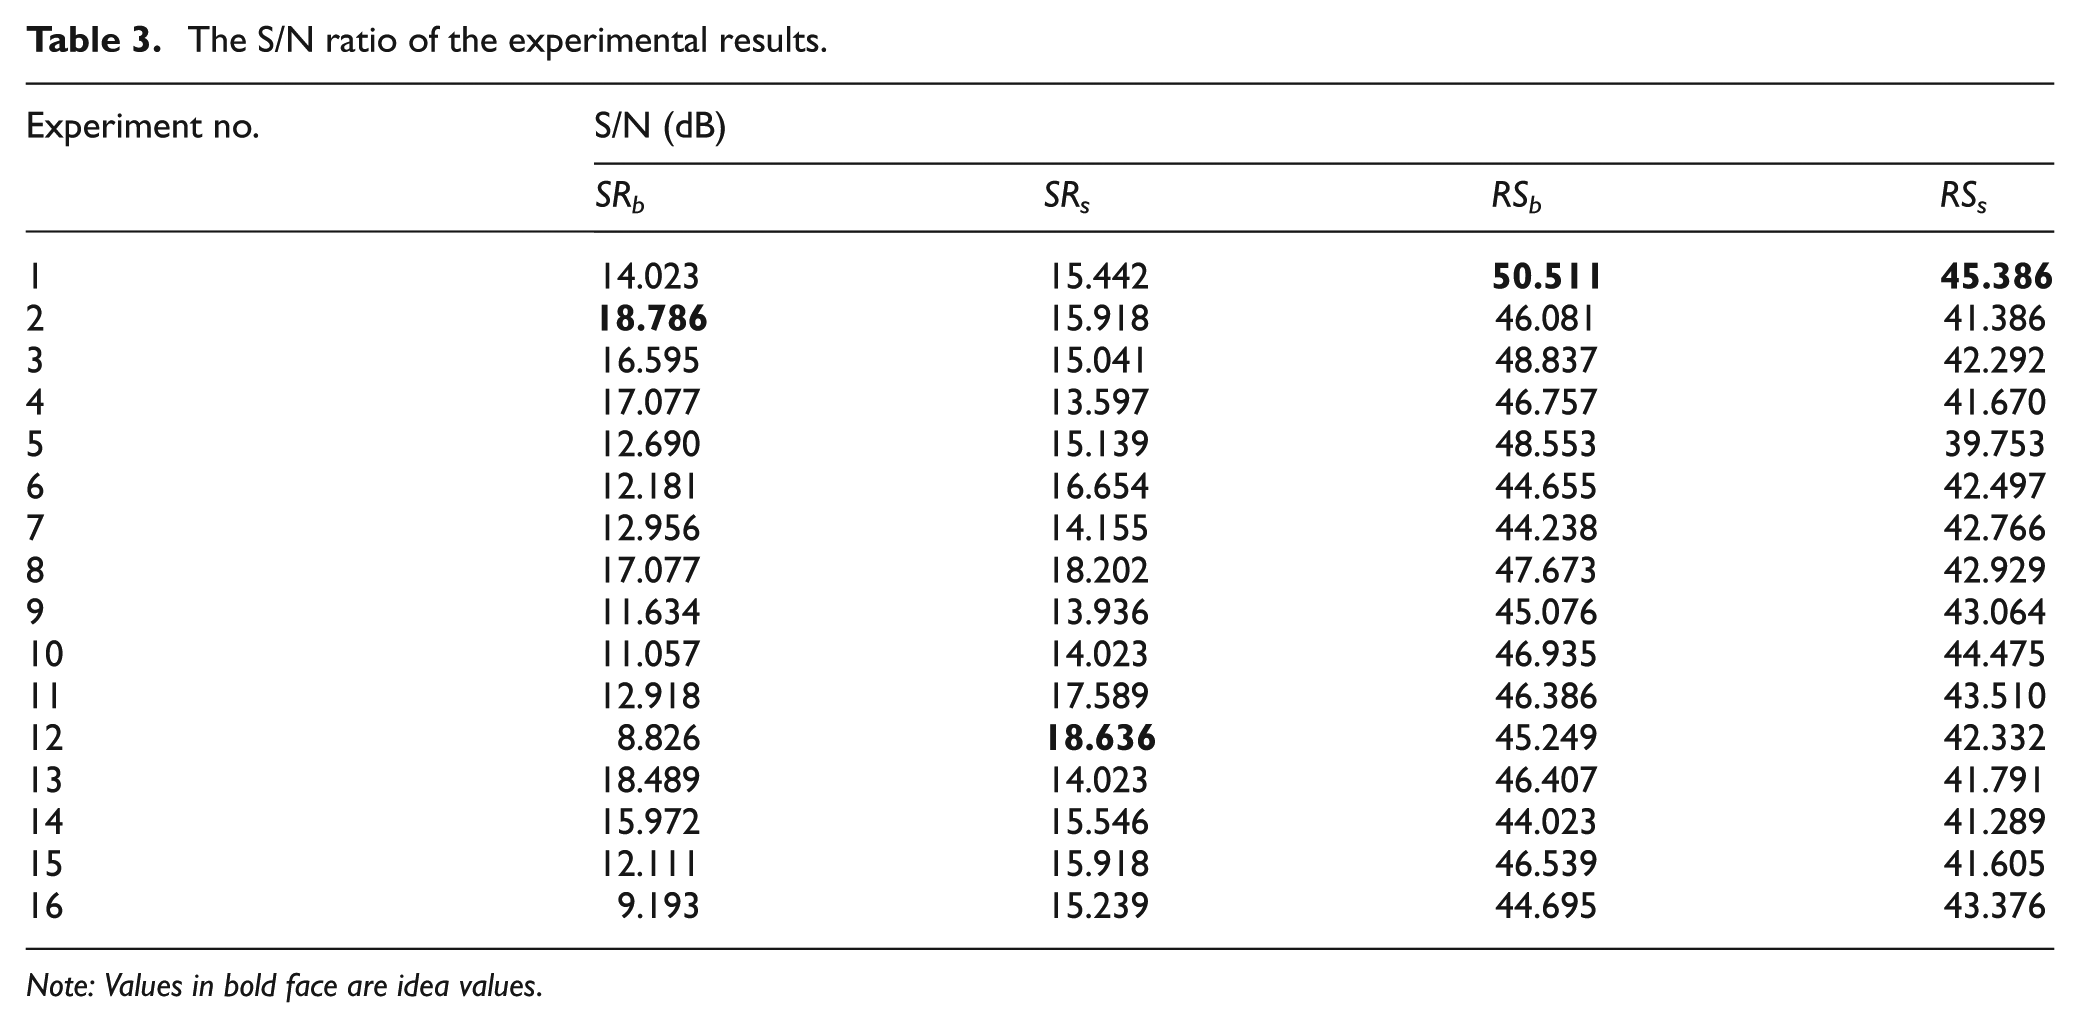
Note: Values in bold face are idea values.
The response table for the Taguchi method is used to calculate the mean S/N ratios for each factor level. First, group the S/N ratios by factor level for each column in the orthogonal array. Next, take their average. For example, the S/N ratio for A at level 1 can be calculated as follows
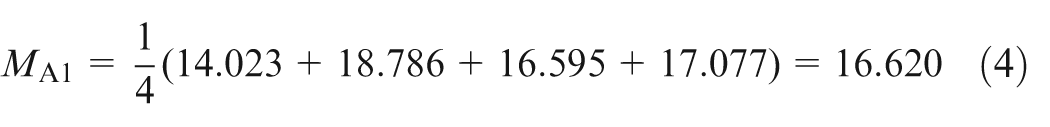
The mean S/N ratios for each cutter geometric parameter level are calculated using the same process method.
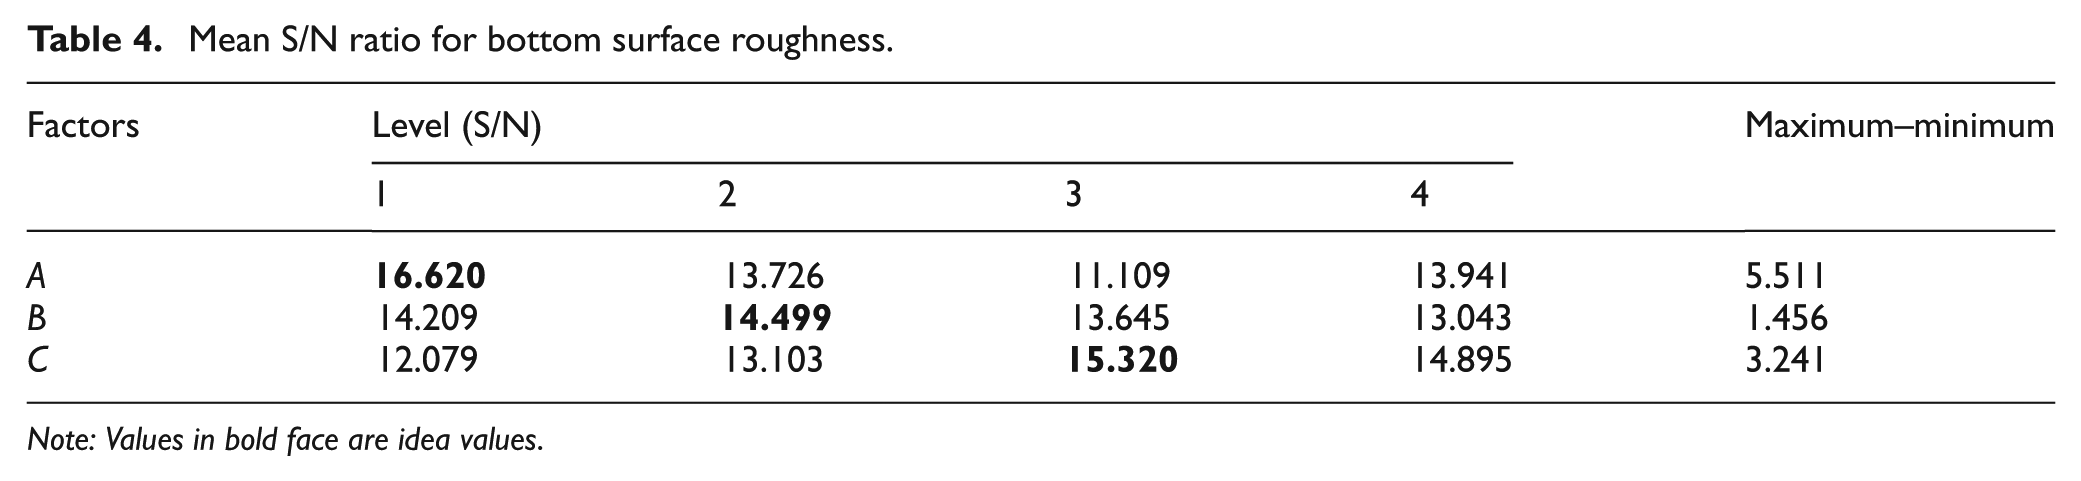
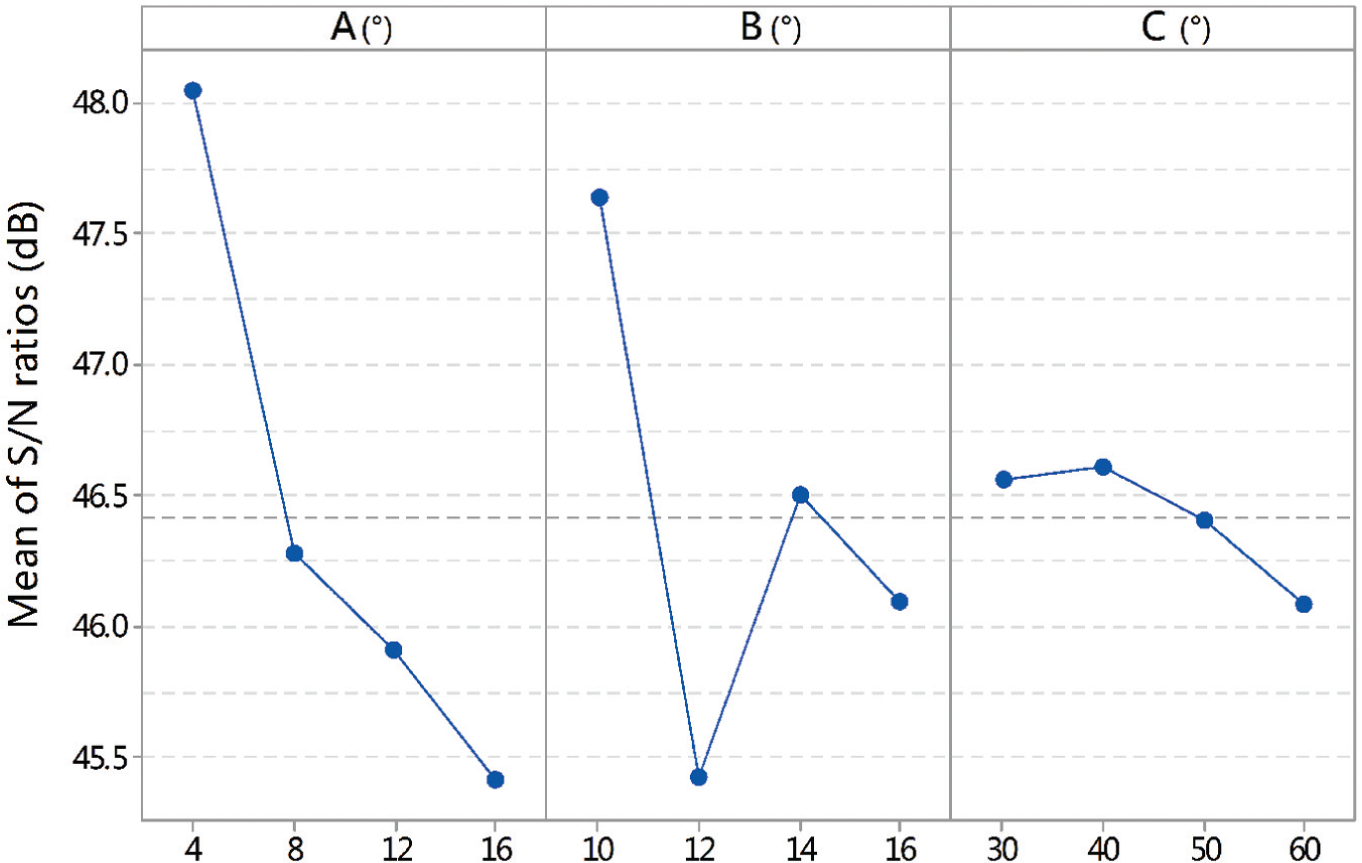
Based on the data presented in Table 4, the optimal combination of parameters is A1B2C3 for the bottom surface roughness, namely, radial rake angle is 4°, primary radial relief angle is 12°, and helix angle is 50°. Figure 6 shows the fluctuation of mean S/N ratio of bottom surface roughness with the change in cutter geometric parameters. The bottom surface roughness increases with the radial rake angle and primary radial relief angle on the overall trend. The reason could be that larger rake angle and relief angle weaken the cutter which leads to stronger cutter wear and increases vibration in axial direction. Simultaneously, a radial rake angle also provides a better bottom surface finish since it aids the chip to flow out from the workpiece. 30 Therefore, the bottom surface roughness has obvious decrease when radial rake angle reaches 16°. From the figure, it can be observed that the bottom surface roughness decreases as the helix angle increases.
Mean S/N ratio for bottom surface roughness.
Note: Values in bold face are idea values.
S/N response graph for bottom surface roughness.
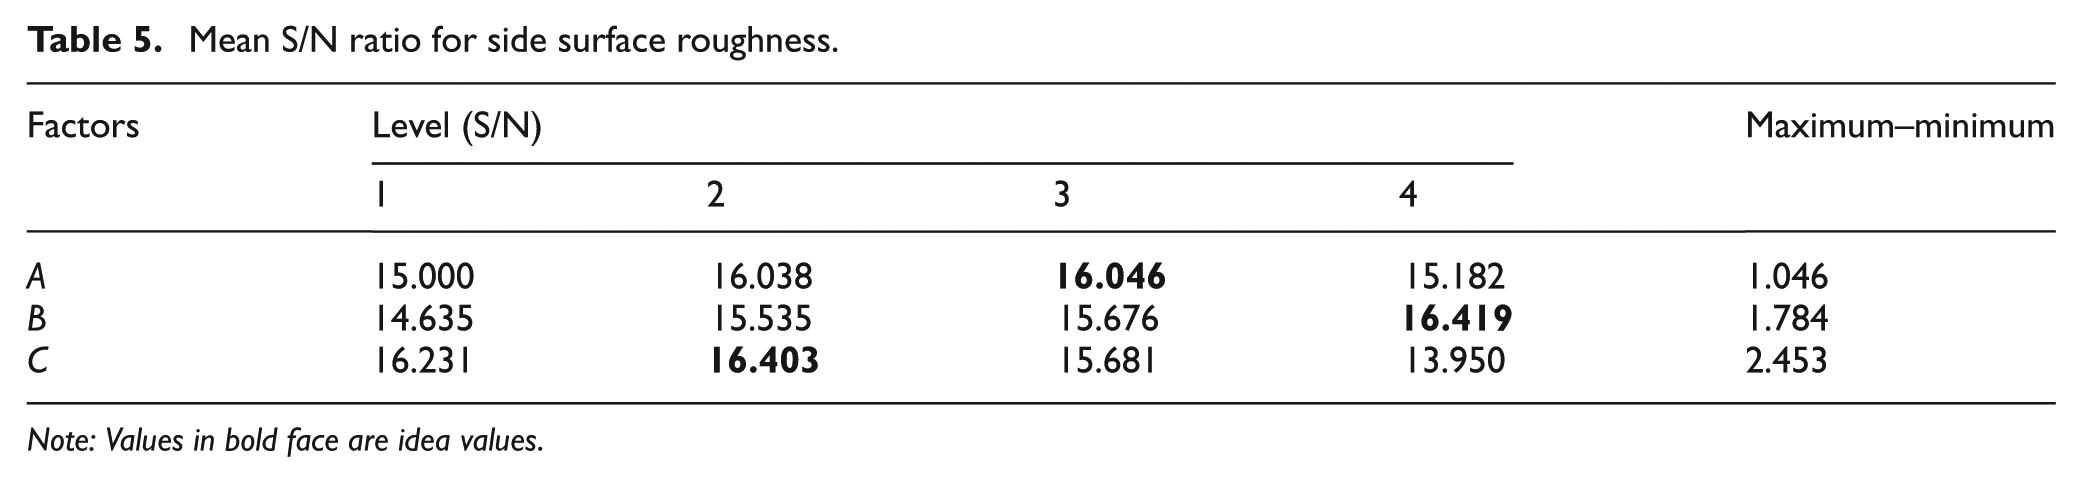
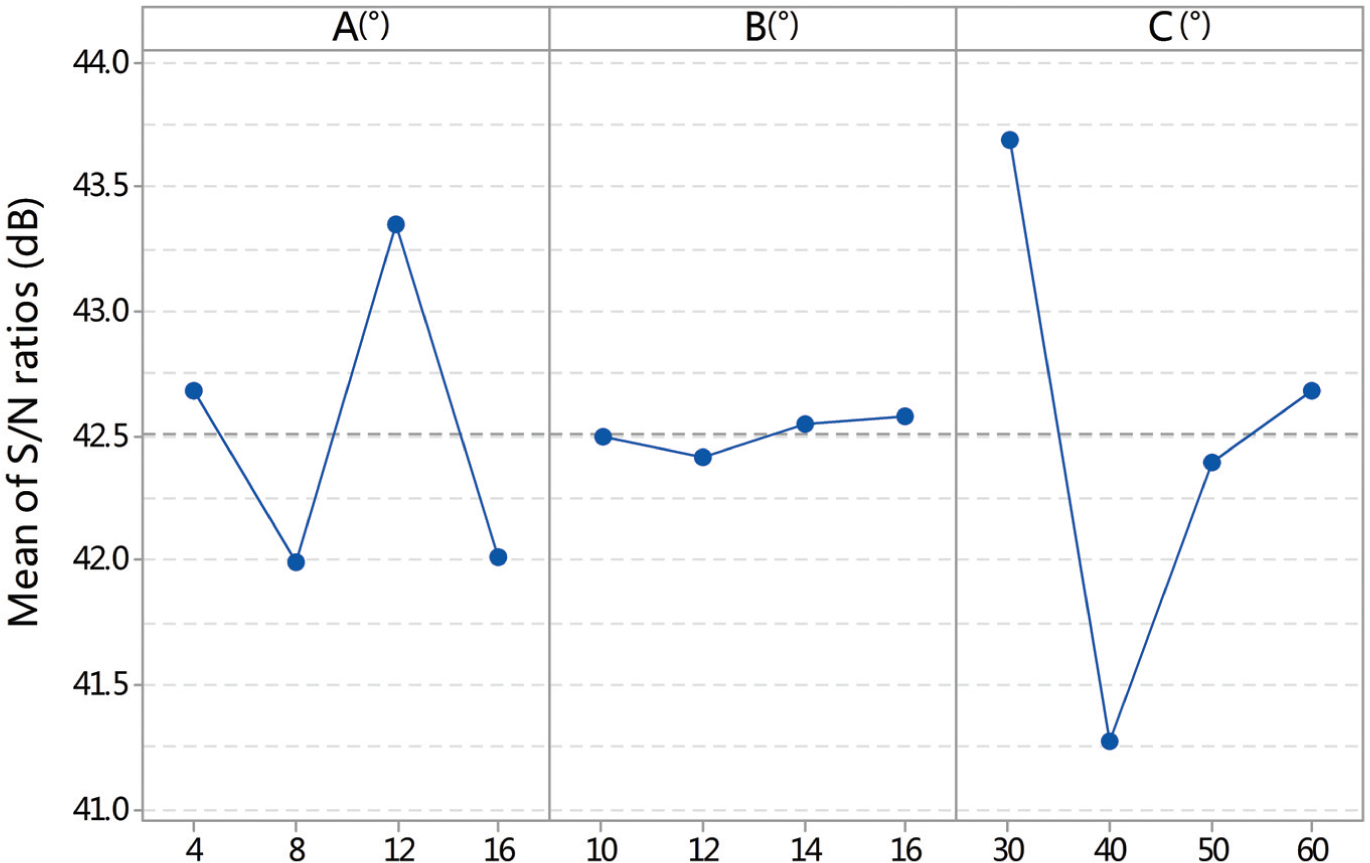
From Table 5, the optimum cutter geometric parameters for side surface roughness are as follows: radial rake angle of 12°, primary radial relief angle of 16°, and helix angle of 40°. The mean S/N ratio plot of side surface roughness with respect to radial rake angle, primary radial relief angle, and helix angle is shown in Figure 7. According to parallel shear zone theory, larger positive radial rake angle provides higher shear angle. 31 It also produces sharper cutting edges on the periphery, which leads to diminishing peripheral milling force or lateral cutting force. But the excessive rake angle weakens the cutter and possibly increases acceleration amplitude in feed direction. 32 Therefore, the side surface roughness first decreases approaching a value at a radial rake angle of 12° and then increases. The side surface roughness decreases with primary radial relief angle due to the fact that larger relief angle weakens the friction effect between radial relief surface and side surface of the workpiece by shortening the contact length. It can be observed from Figure 7 that as the helix angle increases, the side surface roughness also increases. A possible reason is that higher helix angle leads to more roughness heterogeneity bands due to the grinding errors and high eccentricity of the cutters used in experiment. 33
Mean S/N ratio for side surface roughness.
Note: Values in bold face are idea values.
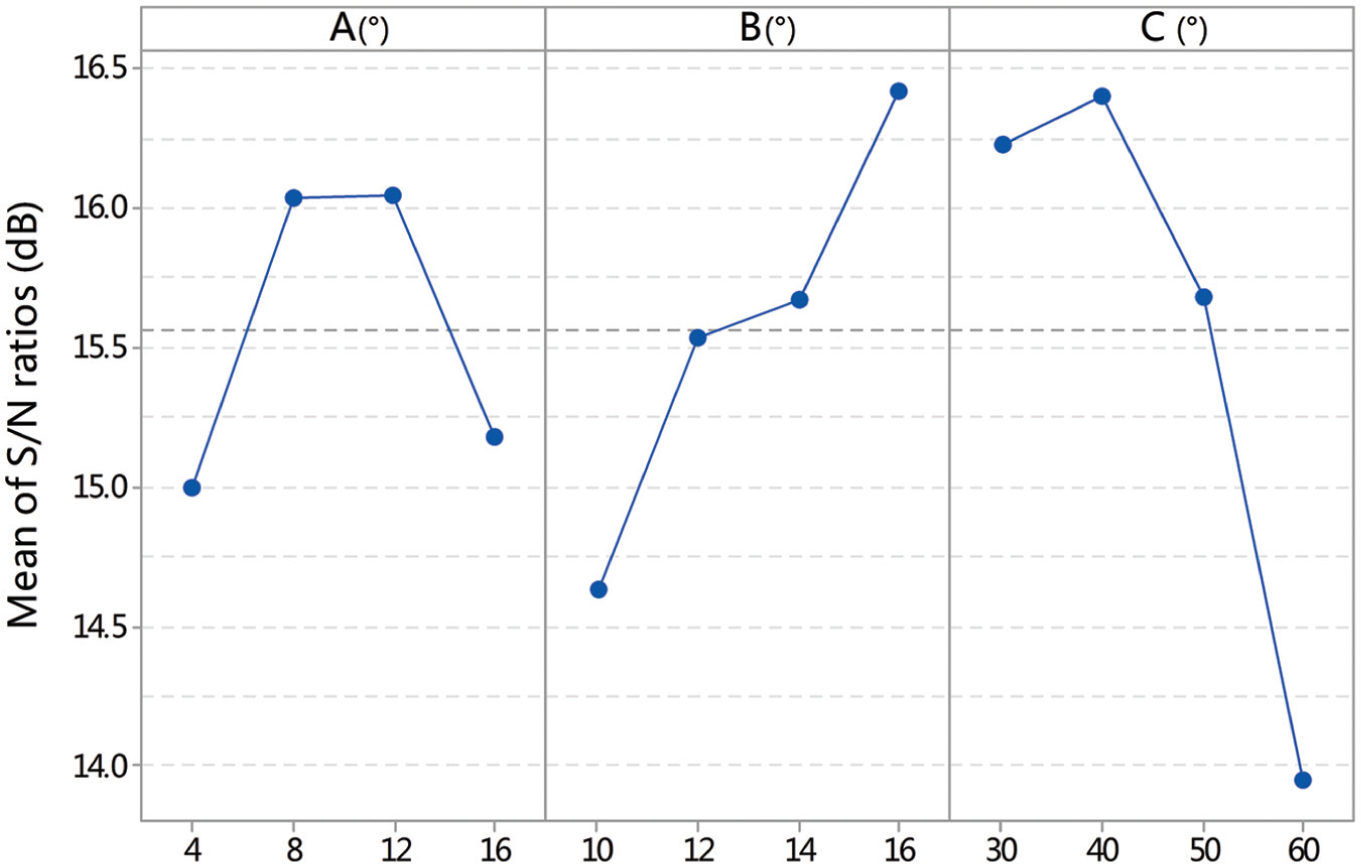
S/N response graph for side surface roughness.
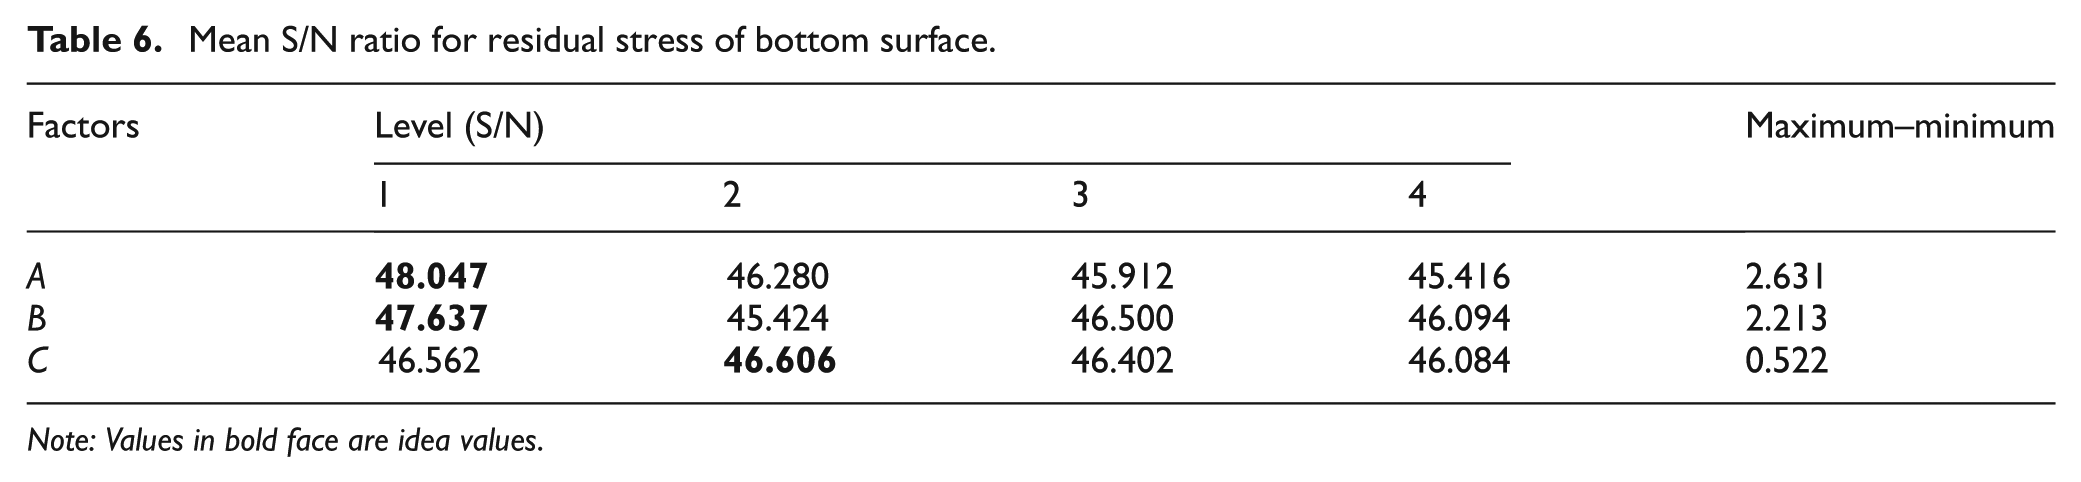
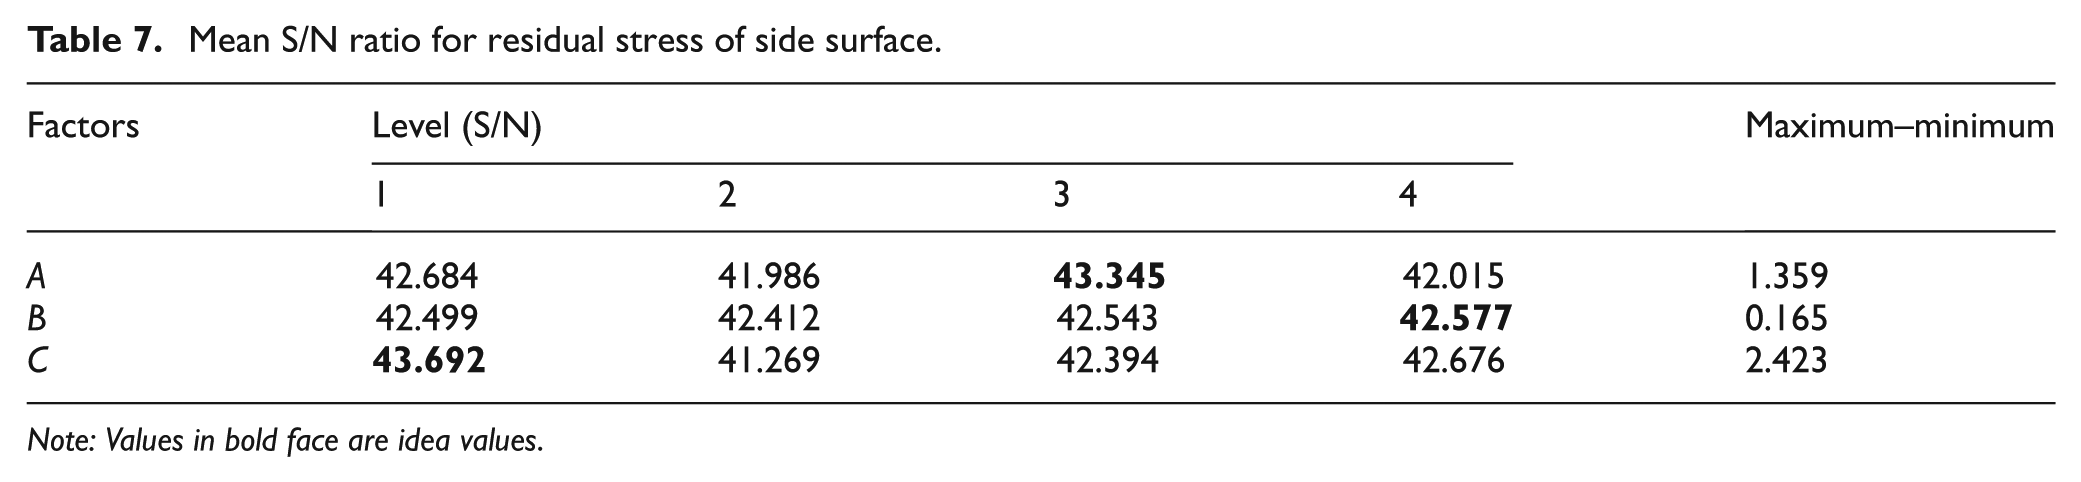
As to the residual stress, Tables 6 and 7 illustrate the results of mean S/N ratio for the machined bottom and side surface. According to the Taguchi method, the maximum compressive residual stress can be obtained for bottom surface and side surface at the parameter levels A1B1C2 and A3B4C1, respectively. The mean S/N ratios at each level are plotted as a response graph shown in Figures 8 and 9. It can be seen that the residual compressive stress of the bottom surface monotonically decreases with the radial rake angle. But the other residual stress curves show no obvious regularity. Generally, cutting residual stress can be affected by mechanical loading and thermal effects. 34 In cutting process, mechanical load caused by cutting force induces residual compressive stress, while thermal load caused by cutting temperature induces residual tensile stress. Larger cutting force leads to higher cutting temperature. Therefore, residual compressive stress may increase or decrease with the change in cutting force caused by varying these cutter geometric angles.
Mean S/N ratio for residual stress of bottom surface.
Note: Values in bold face are idea values.
Mean S/N ratio for residual stress of side surface.
Note: Values in bold face are idea values.
S/N response graph for residual stress of bottom surface.
S/N response graph for residual stress of side surface.
Multi-objective optimization of cutter geometric parameters
Analysis of S/N ratios is available for single-objective optimization problem, but ineffective for multi-response characteristics. It often exists in multi-objective optimization problem that the higher S/N ratio for one performance characteristic may correspond to a lower S/N ratio for another. So, it is essential to evaluate overall S/N ratios in multi-objective optimization problem. In this study, the multiple performance characteristics are evaluated using the GRA, which converts a multiple response process optimization into a single-objective optimization of the grey relational grade (GRG).
In the GRA, the performance characteristics are first normalized, ranging from 0 to 1. This experiment data process is called grey relational generation. The second step is to calculate the grey relational coefficient (GRC) based on the normalized experimental data, which represents the correlation between the desired data sequence and the actual experimental data sequence. Finally, the GRG sequence can be obtained from the weighted average of the GRC. The surface integrity of milling Ti-5Al-5Mo-5V-1Cr-1Fe titanium alloy is evaluated by the GRG.
Grey relational generation
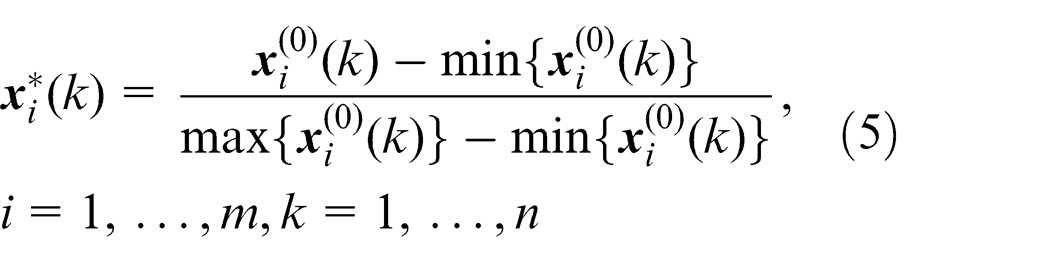
In the GRA, raw data preprocessing is the first step, which is known as grey relational generation. If the purpose is the larger-the-better, then the normalized results can be expressed as
where
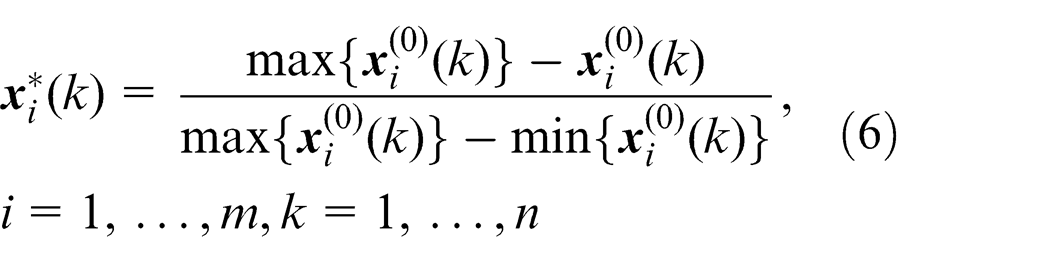
If the target value of the original sequence is the smaller-the-better performance characteristic, then the original sequence is normalized as follows
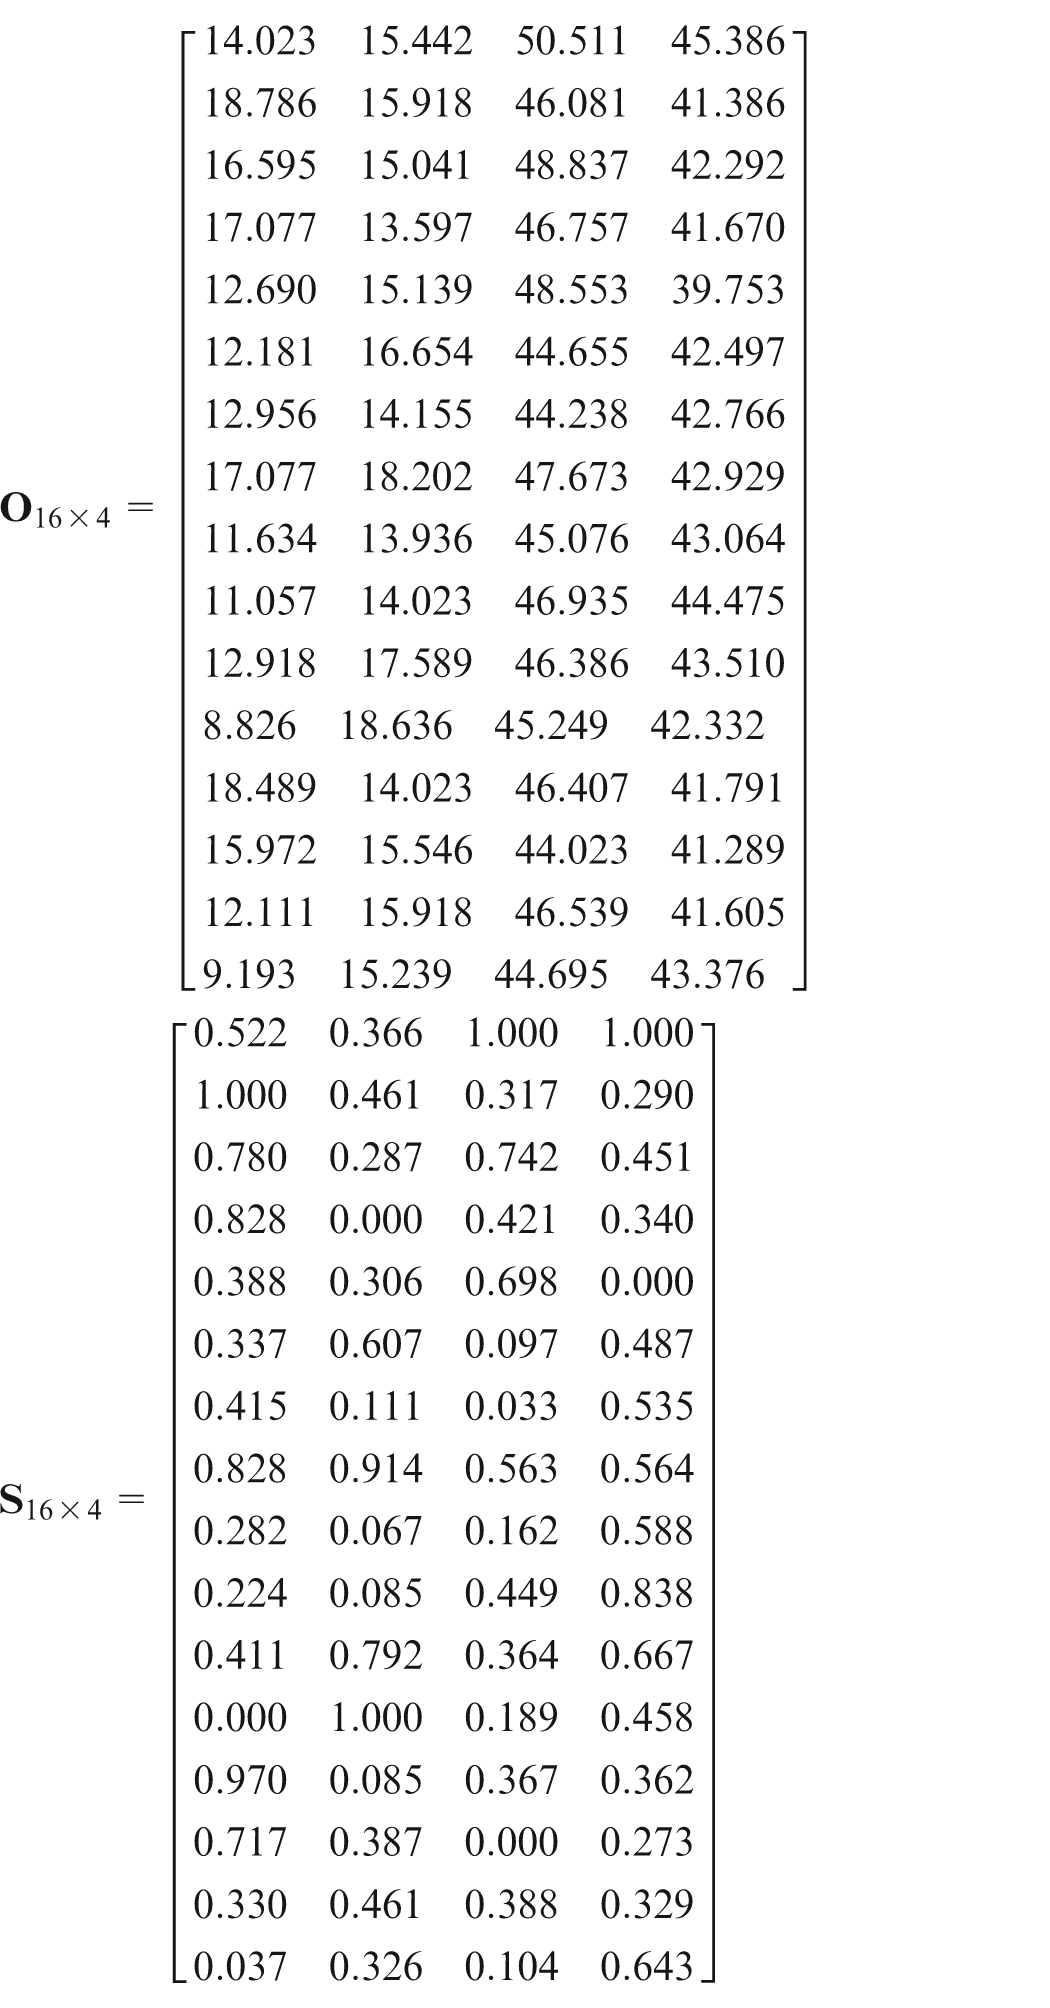
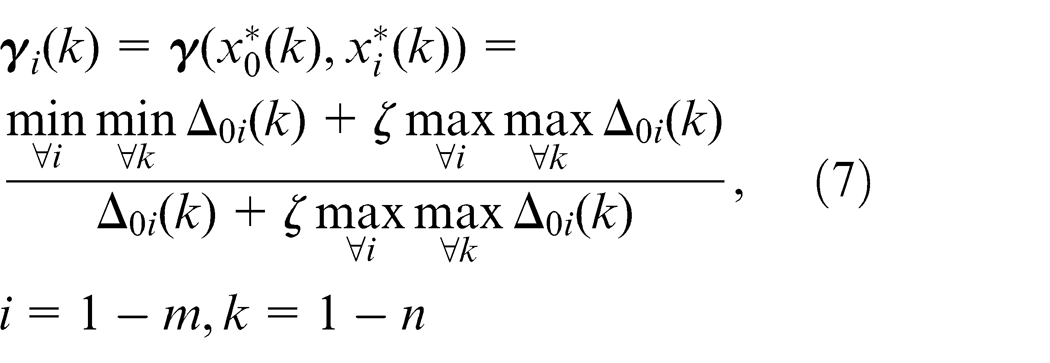
As mentioned above, a larger S/N ratio is desirable and the “larger-the-better” is adopted. Consequently, equation (5), a linear normalization, is used to preprocess the origin response characteristic sequences. The values of the surface roughness and surface residual stress are set to be the origin sequence
GRC
After obtaining the normalized sequence, the next step is to calculate the GRC. In the GRA, a higher value of the GRC, ranging from 0 to 1, corresponds to intense relational degree between the desired performance characteristics and the actual performance characteristics. The GRC is defined as follows
where


where
The reference sequence indicates the expected sequence. According to the normalized results, the reference sequence should be taken the maximum as follows

The comparability sequence

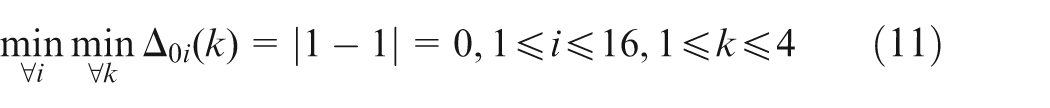
The value of ζ is smaller and the identification ability is larger. In this study, it is set as 0.5.
17
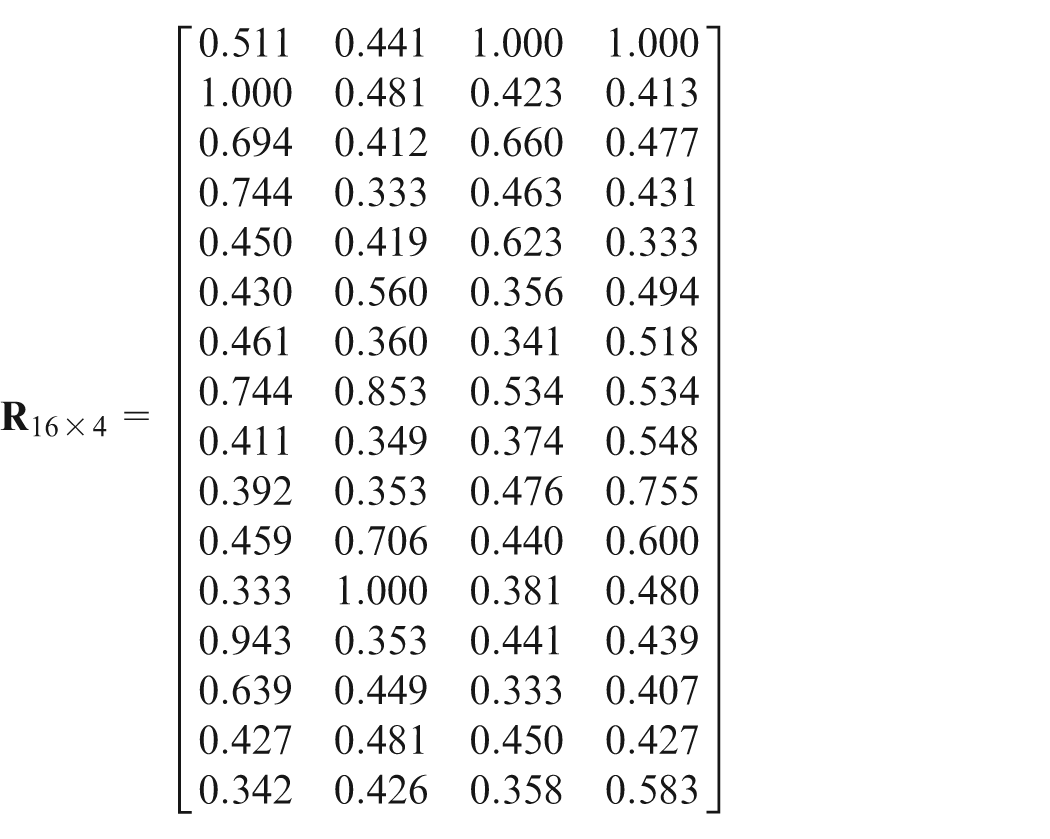
With equation (7), it is easy to obtain the GRC matrix
Weight coefficient
In order to obtain the GRG sequence, the weight of multi-performance characteristics needs to be determined. It is also the weight of the column vector of matrix
The process of determining weight of multi-performance characteristics is as follows:
Step 1. Calculate the objective weight by EWM.
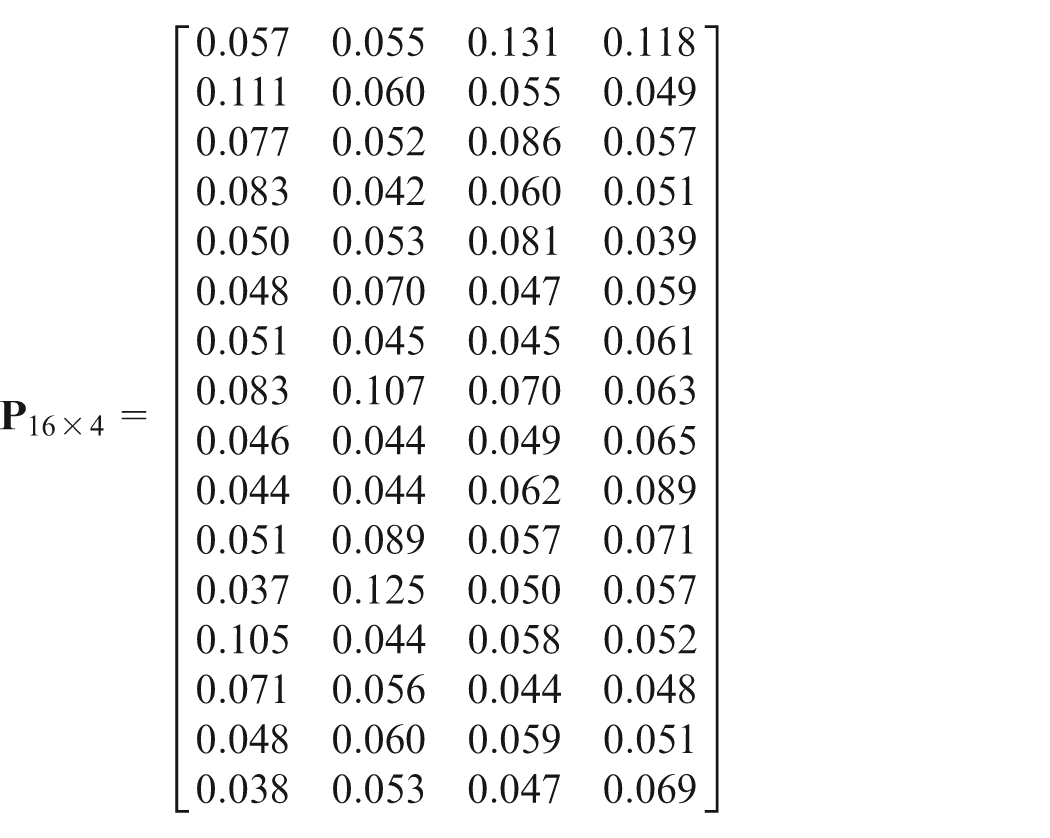
First, calculate the weight of ith experiment for each performance characteristic by equation (12). In other words, calculate the weight of ith row by column. The matrix
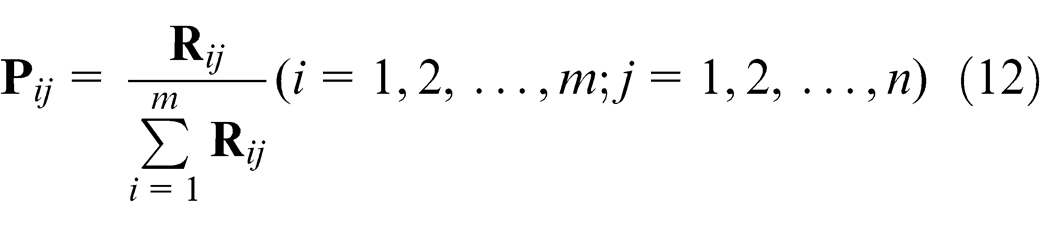
where the
Second, calculate entropy value of the jth performance characteristic. The entropy row vector
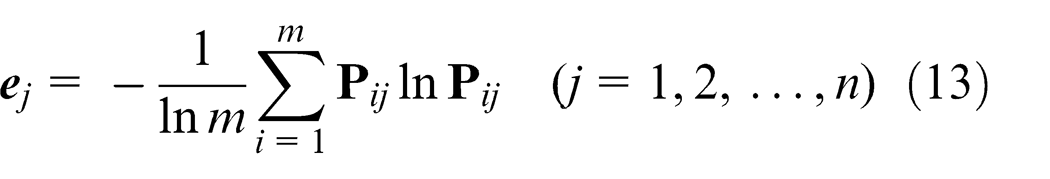
where

Finally, determine the entropy weight vector
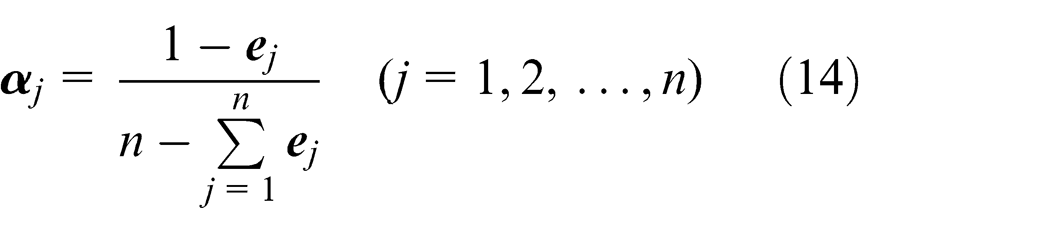
where

Step 2. Calculate the subjective weight by AHP.
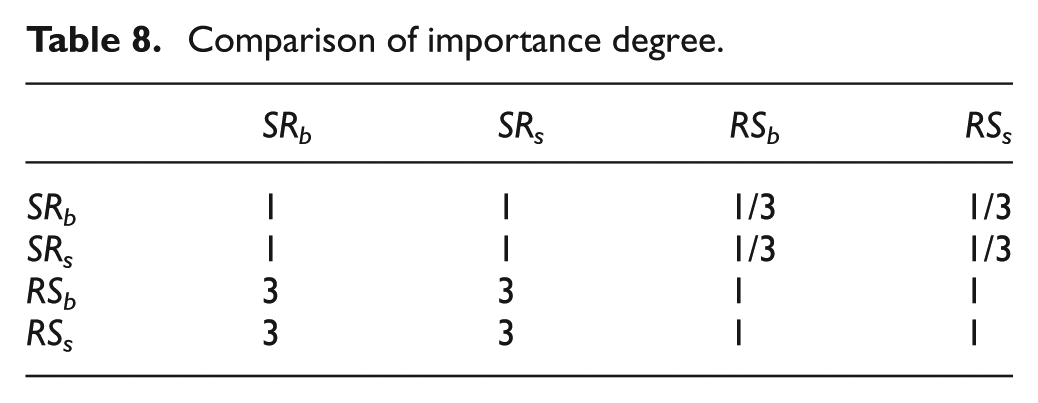
The subjective weight depends on the specialistic evaluation on the specific engineering problems. Table 8 shows the relative importance degree by pairwise comparison of the multi-performance characteristics. Therefore, the judgment matrix
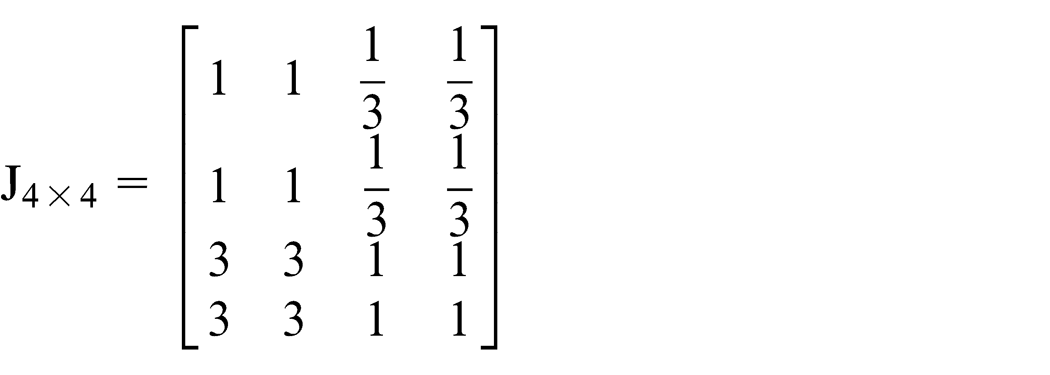
Comparison of importance degree.
The weight vector

Step 3. Determine the amalgamative weight vector.
The amalgamative weight of each performance characteristic can expressed as follows
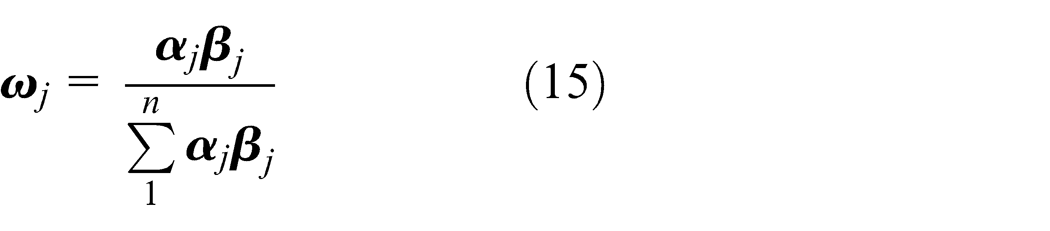
where
The amalgamative weight vector

GRG
The GRG expresses the correlation between the comparability sequence and the reference sequence. A higher GRG presents that the corresponding multi-performance characteristics are closer to the ideal value. The GRG ranges from 0 to 1 and equals to 1 when the two sequences agree with each other completely. The GRG can be expressed as follows
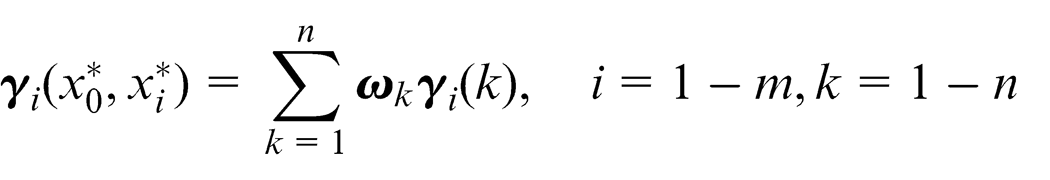
or
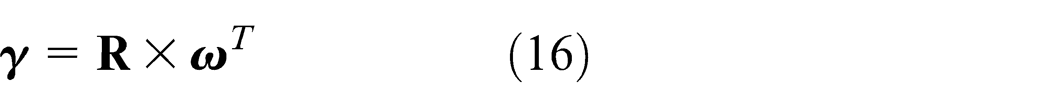
where
The GRG is used to evaluate the overall surface integrity. The parametric combination with highest GRG implies that the corresponding experimental run is closest to the optimal value of the desired multiple performance characteristics.
23
The GRG vector
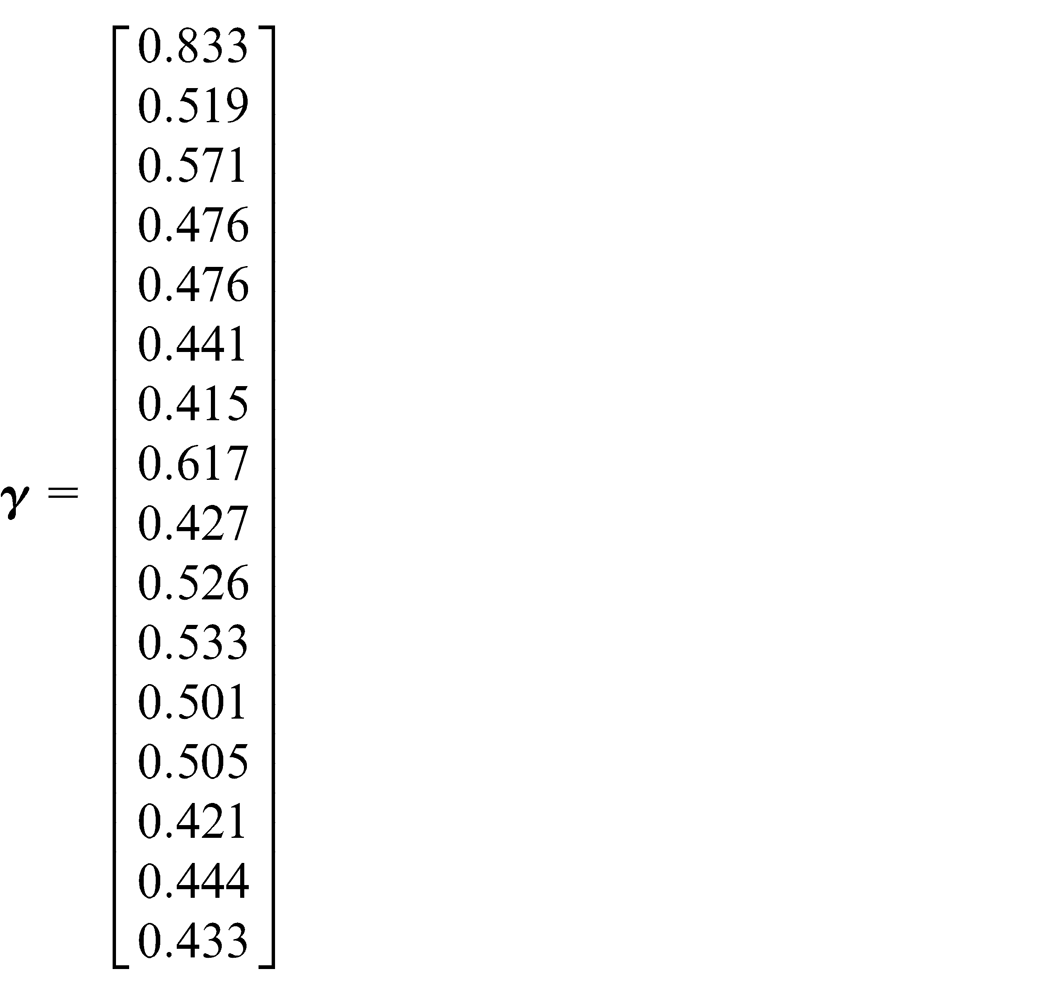
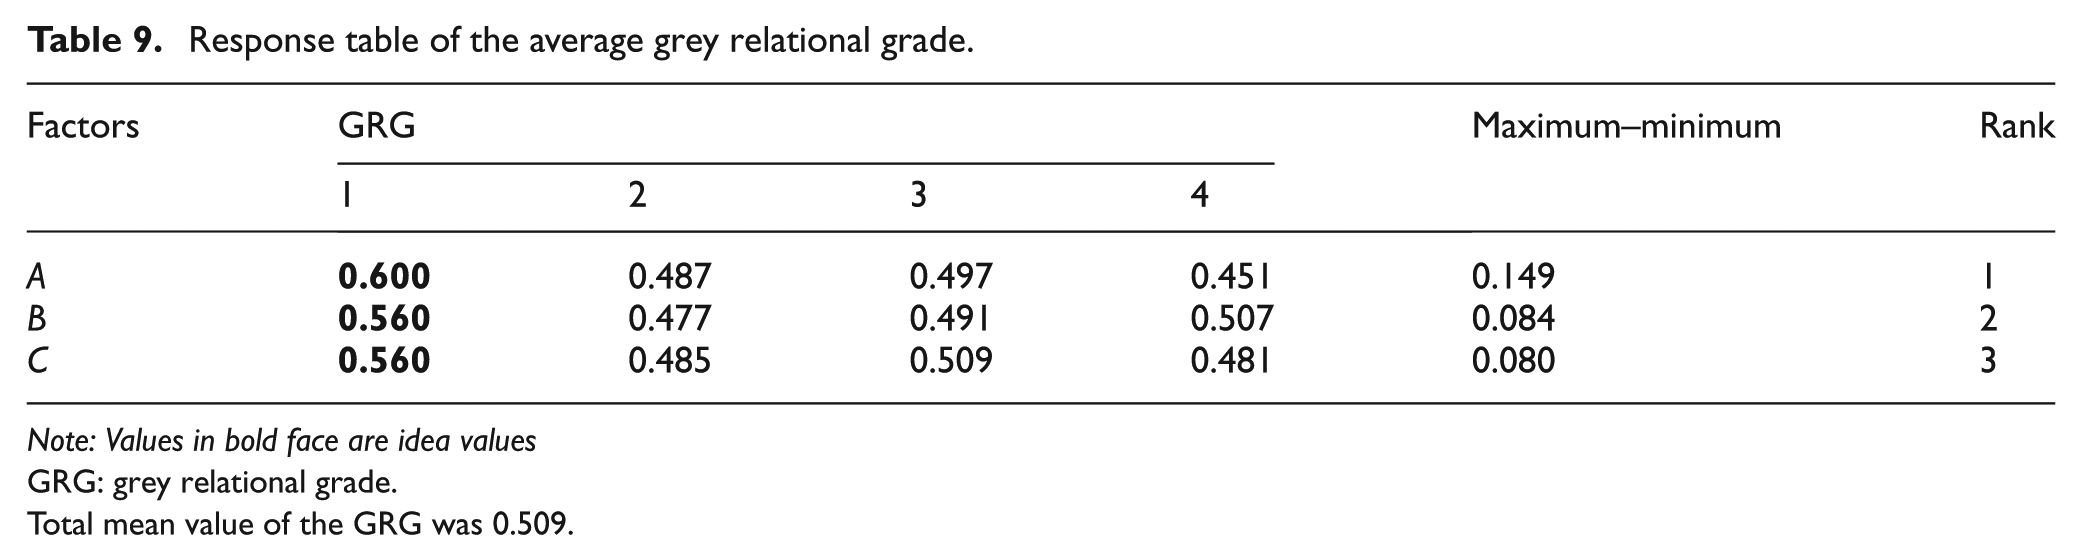
The average GRGs for each factor level have been calculated using the process approach similar to that of the mean S/N ratios, as shown in Table 9. The average of GRG at each level is plotted as a response shown in Figure 10. Since the GRG reflects the level of correlation between the comparability and the reference sequences, a larger GRG represents the comparability sequence exhibiting a stronger correlation with the reference sequence [1, 1, 1, 1]. Based on this basic criterion of grey system theory, one can select a combination of the design factor levels that provide the largest average performance characteristics. As listed in Table 9, the combination of A1, B1, and C1 exhibits the largest value of the GRG for the design factors A, B, and C, respectively. Consequently, A1B1C1 with a radial rake angle of 4°, primary radial relief angle of 10°, and helix angle of 30° is the optimum cutter geometric parameter combination.
Response table of the average grey relational grade.
Note: Values in bold face are idea values.
GRG: grey relational grade.
Total mean value of the GRG was 0.509.
Response graph of average grey relational grade.
From Table 9, the difference between the maximum and minimum values of the GRG of the cutter geometric parameters is 0.149 for A, 0.084 for B, and 0.080 for C. These difference values reflect the level of effect of cutter geometric parameters on the performance characteristics. In other words, the comparison among the difference values will qualitatively give the level of significance of the control factors over the milling surface integrity. It can be easily observed that the maximum value among 0.149, 0.084, and 0.080 is 0.149, which means radial rake angle has the most remarkable effect on the multiple performance characteristics among the cutter geometric parameters. That is to say the order of optimization for cutter geometric parameters should be A (radial rake angle) > B (primary radial relief angle) > C (helix angle) in this study.
Validation tests
The estimated GRG
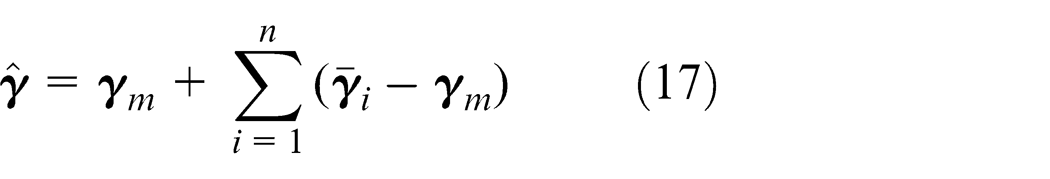
where
Generally, the GRG under optimal parameters can be calculated by equation (17) in grey–Taguchi method. As mentioned above, the GRG reaches its maximum value at A1B1C1 which coincidentally corresponds to experiment no. 1 in the Taguchi orthogonal array L16 (43). Therefore, one more validation test is superfluous. The effectiveness of the modified grey–Taguchi method can be verified by comparing the response results of the parameter combination A1B1C1 and initial parameter combination. The initial cutter geometric parameters are selected as A2B1C2 with a radial rake angle of 8°, primary radial relief angle of 10°, and helix angle of 40° according to engineering experience.
Table 10 illustrates the comparison of the experimental results using the initial and optimal cutter geometric parameters. Under the condition with the levels A1B1C1 of the optimum parameters, the GRG has been improved by 0.357; the bottom and side surface roughness are decreased to 0.199 (an improvement of 14.2 %) and 0.169 μm (an improvement of 3.40 %), respectively; and the compressive residual stress of bottom and side surface is improved from 267.7 and 97.2 MPa to 335.4 and 185.9 MPa, respectively. In summary, it is clearly shown that the surface integrity of milling Ti-5Al-5Mo-5V-1Cr-1Fe titanium alloy can be significantly improved by optimization of cutter geometric parameters.
Comparison results of the initial and optimal cutter geometric parameters.
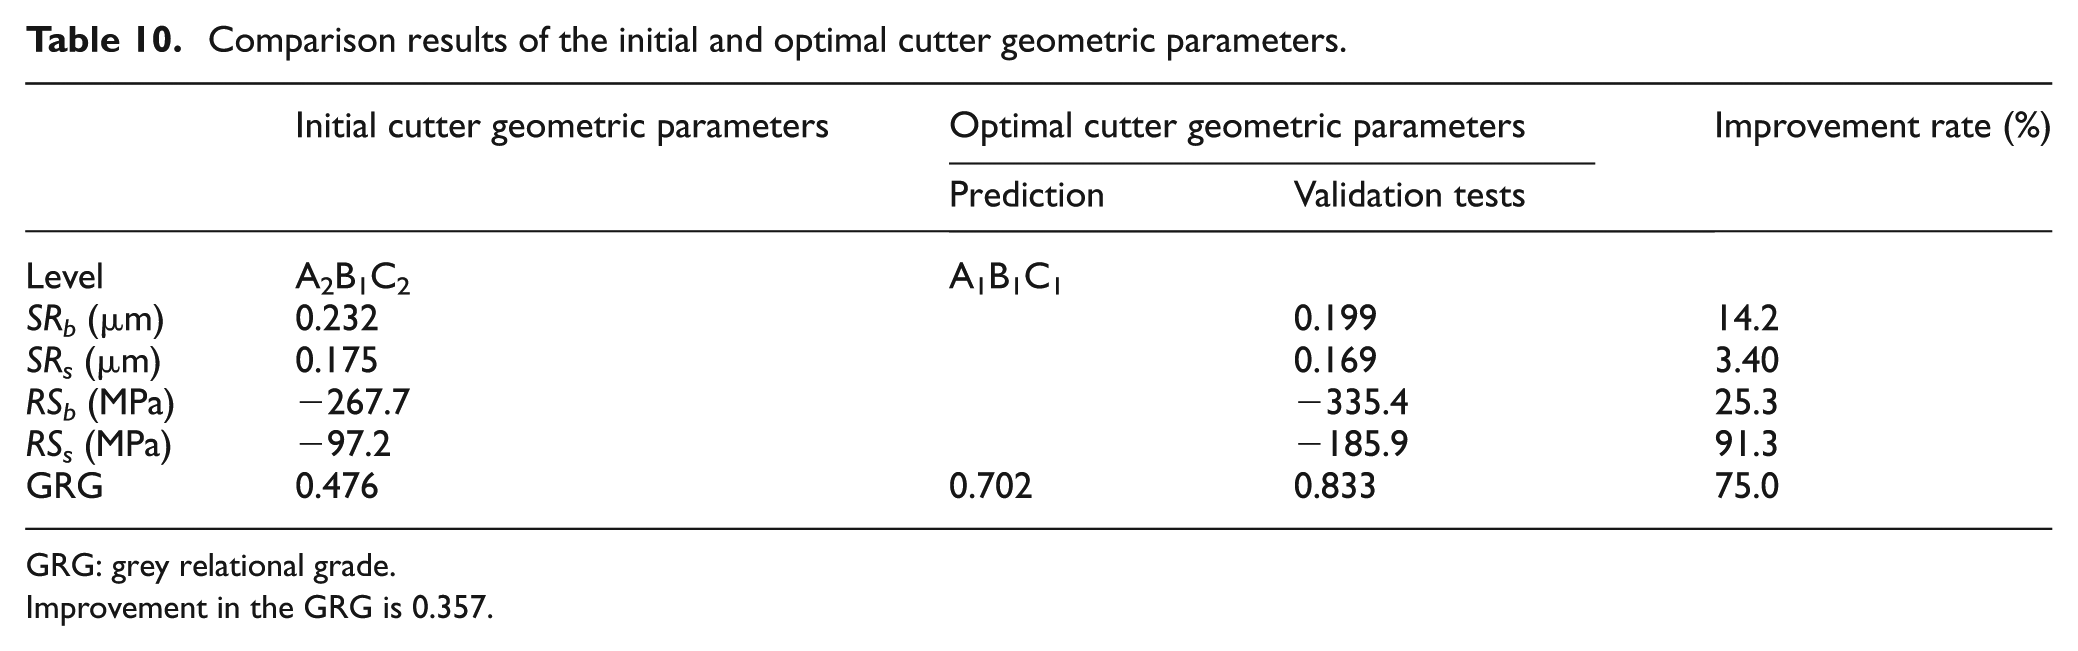
GRG: grey relational grade.
Improvement in the GRG is 0.357.
Conclusion
This study applies the GRA integrated with the Taguchi method, EWM, and AHP to optimize the cutter geometric parameters in terms of surface integrity for milling Ti-5Al-5Mo-5V-1Cr-1Fe titanium alloy. Conclusions are summarized as follows:
The validation experiment indicates that the grey–Taguchi method is an effective approach of multi-objective optimization to the cutter geometry for machined surface integrity. With this method, the GRG of the multiple performance characteristics is significantly improved by 0.357.
With the analysis of S/N ratio, the optimum radial rake angle, primary radial relief angle, and helix angle for bottom surface roughness are 4°, 12°, and 50°, respectively; the optimal controllable factors for side surface roughness are radial rake angle of 12°, primary radial relief angle of 16°, and helix angle of 40°; the optimum radial rake angle, primary radial relief angle, and helix angle for residual stress of bottom surface are 4°, 10°, and 40°, respectively; the optimal controllable factors for residual stress of side surface are radial rake angle of 12°, primary radial relief angle of 16°, and helix angle of 30°.
The radial rake angle is the most significant control factor for the milling surface integrity among the three cutter geometric parameters. The largest value of GRG is obtained at the combination of cutter geometric parameters with a radial rake angle of 4°, primary radial relief angle of 10°, and helix angle of 30° It is the recommended levels of cutter geometric parameters in terms of surface roughness and residual stress for milling Ti-5Al-5Mo-5V-1Cr-1Fe titanium alloy.
Footnotes
Appendix 1
Declaration of conflicting interests
The author(s) declared no potential conflicts of interest with respect to the research, authorship, and/or publication of this article.
Funding
The author(s) disclosed receipt of the following financial support for the research, authorship, and/or publication of this article: This work was supported by the National Science and Technology Major Project of China (no. 2013ZX04001081) and the Doctorate Foundation of Northwestern Polytechnical University (no. CX201514).