
Abstract
This article presents a crystal plasticity methodology to evaluate the AA1050 sheet formability. In order to determine the orientation distribution of the crystals, initial texture of the material is measured through X-ray diffraction technique. Also, the stress–strain behavior of the material is determined by performing tensile test. In order to simulate the path-dependent crystal plasticity behavior of body-centered cubic crystal structures, a UMAT subroutine that employs the rate-dependent crystal plasticity model along with the power law hardening was developed previously by the authors and linked to the finite element software ABAQUS. This subroutine was further developed to simulate face-centered cubic crystal structures. The second-order derivative of sheet thickness variations with respect to time is considered as the instability factor, and forming limit diagram of the material is predicted. In order to assess the validity of formability prediction results for face-centered cubic materials, forming limit diagram of AA1050 sheet is also experimentally extracted by conducting hemi-spherical punch test. It is observed that the predicted forming limit diagram is in agreement with the experimental results. Finally, the prediction accuracy in different regions of forming limit diagram is discussed and some suggestions for further improving the accuracy are made.
Keywords
Introduction
Aluminum alloy 1050 is a popular grade of aluminum which is used for general sheet metal work where moderate strength is required. It has excellent corrosion resistance, high ductility and high reflective finish and is used in applications such as chemical process plant equipment, food industry containers and lamp reflectors.
Various sheet metal forming processes (such as hydroforming,1,2 incremental forming3,4 and conventional stamping methods 5 ) are employed to manufacture different sheet metal parts. For simulation of these processes, forming limit diagram (FLD) of the employed material is required which can be determined experimentally 6 or numerically. 7 Numerical FLD predictions can be performed based on macroscopic (phenomenological) or microscopic (physical) approaches. Macroscopic approaches cannot predict the effects of initial material texture on its formability. In order to evaluate the effects of initial texture on the material formability, simulation should be done using the crystal plasticity models which are a branch of microscopic approaches. As some examples, Yang et al. 8 simulated the effects of different pre-strains on the formability limits of Al5052 by the crystal plasticity approach. Steglich et al. 9 investigated the mechanical behavior of magnesium sheet alloy AZ31 by means of mechanical testing and numerical simulation. They performed a biaxial test using a cruciform specimen and a hydraulic bulge test in addition to the common tensile tests. Hoc et al. 10 conducted some experimental studies on interstitial-free (IF) steel sheets at different scales to study the effects of strain path on IF steel formability.
Zhuang et al. 11 performed some experiments to study the occurrence of localized thinning in the hydroforming of stainless steel micro-tubes. They also investigated the effects of microstructure and grain orientation on the formability of stainless steel micro-tubes in this forming process. Xu et al. 12 simulated the anisotropy behavior and texture evolution of two ferritic stainless steel sheets AISI409L and AISI430 by phenomenological and crystal plasticity–based constitutive models and tried to better understand the plastic behavior of these two materials. Hoffmann et al. 13 suggested some micro scale experiments to validate the crystal plasticity model for deep drawing steel DC04 in addition to macro scale experiments.
Signorelli et al. 14 studied the role of crystallographic texture on the forming limit strains of an electro galvanized steel sheet experimentally. Green et al. 15 used a biaxial testing apparatus to study the elastic–plastic behavior of a 1145 aluminum sheet alloy and compared their observations with the crystal plasticity simulation results. Narayanasamy et al. 16 studied the relevance of various crystallographic textures—resulted from annealing at different temperatures—on the formability of AA5052 sheet and determined the temperature which leads to the best formability. In other similar works, Savoie et al. 17 and Wu et al. 18 performed some experiments on three differently annealed aluminum sheets and measured and compared their initial textures and FLDs. Palumbo et al. 19 studied the forming limits of Mg alloy AZ31 in warm conditions at constant equivalent strain rate by experimental and numerical methods.
All the reviewed crystal plasticity–based simulations require the initial material texture in the form of orientation distribution function (ODF) and a stress–strain curve as the input experimental data. There are few experimental works like Ramos et al.20,21 and Hajian and Assempour 22 which completely provide the required experimental input and verification data for a specific material. This article provides the complete set of required experimental input data for the crystal plasticity formability simulation of AA1050 sheet. In addition, forming limits of AA1050 sheet are predicted by the rate-sensitive crystal plasticity approach. Finally, experimental and numerical FLDs are compared and some suggestions for further improving the accuracy are made.
Experimental procedure
Texture measurement
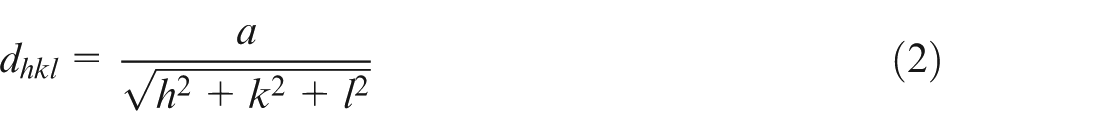
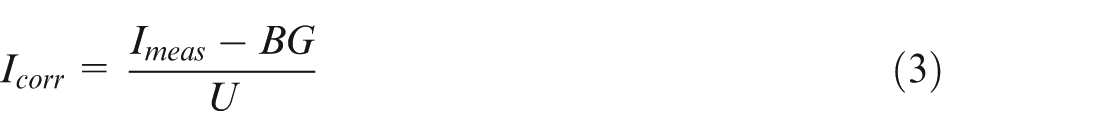
Experimental measurement of texture by X-ray diffraction (XRD) technique is physically based on the Bragg’s law presented in relation (1)

where
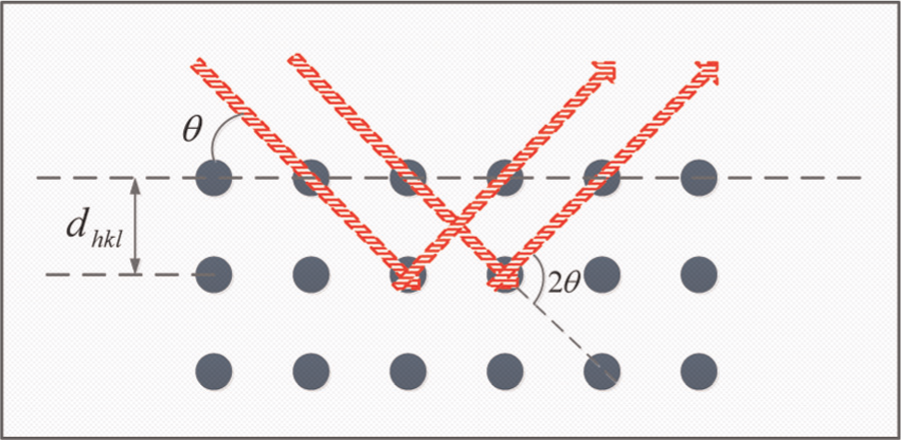
Geometrical condition of radiation to and reflection from atoms in (hkl) crystallographic planes.
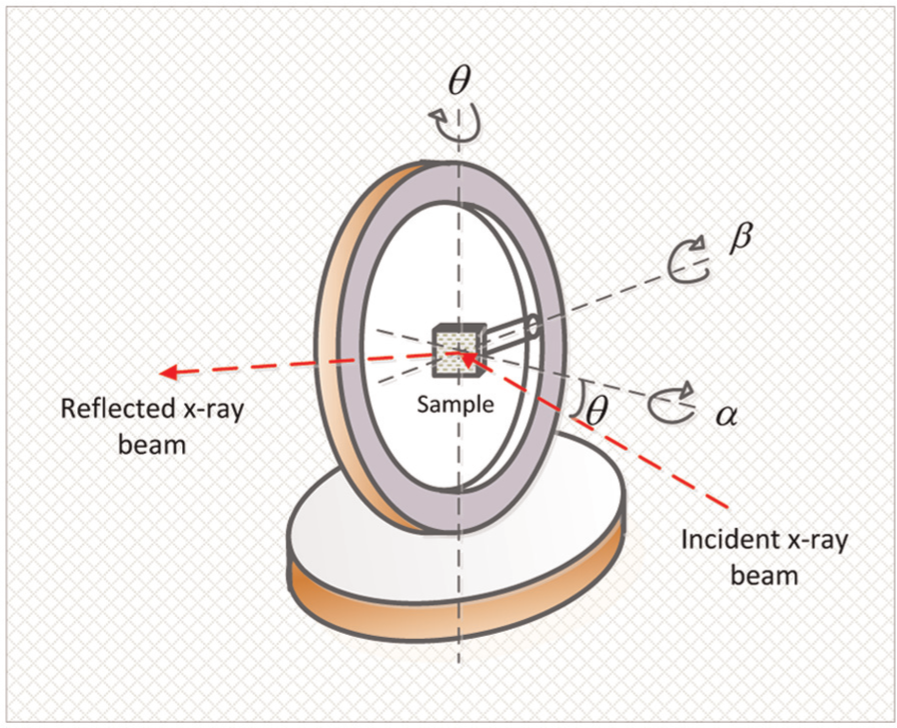
Schematic presentation of tool and sample in XRD test.
where
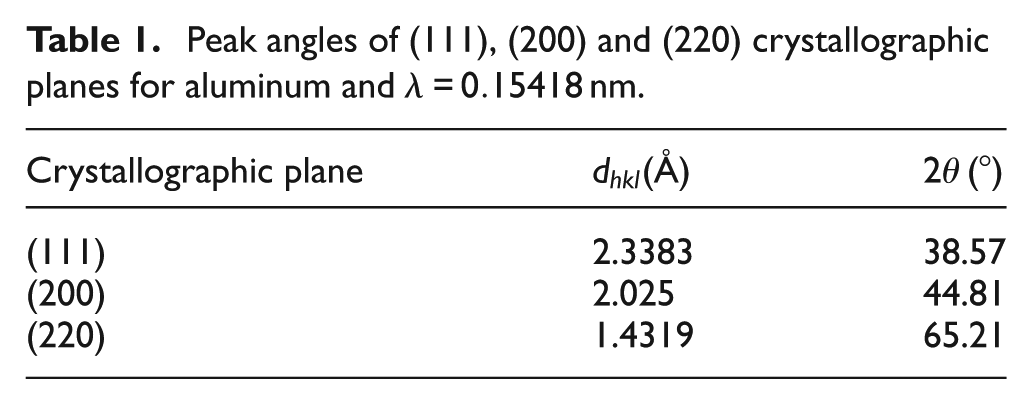
AA1050 sheet is used in this work. Lattice constant
Peak angles of (111), (200) and (220) crystallographic planes for aluminum and
In order to determine the texture of the material, one
where
Tensile test
The tensile test is carried out to measure the stress–strain behavior of the material. For this purpose, a sample with dimensions shown in Figure 3 is prepared according to the ASTM E8-04 standard. The load–displacement curve is measured at a loading rate of
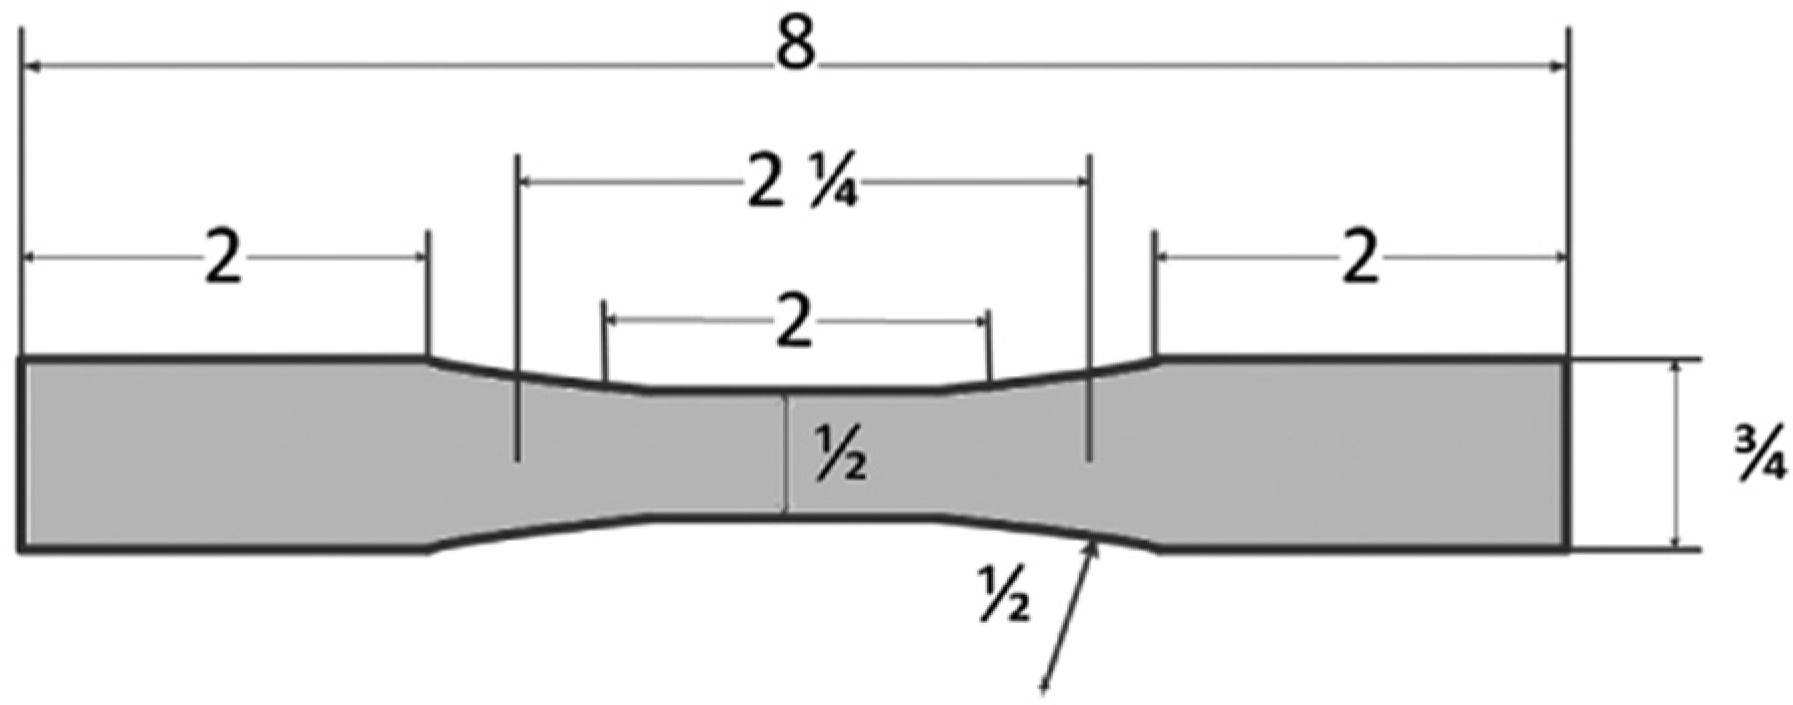
Dimensions of the tensile test sample (in).
FLD
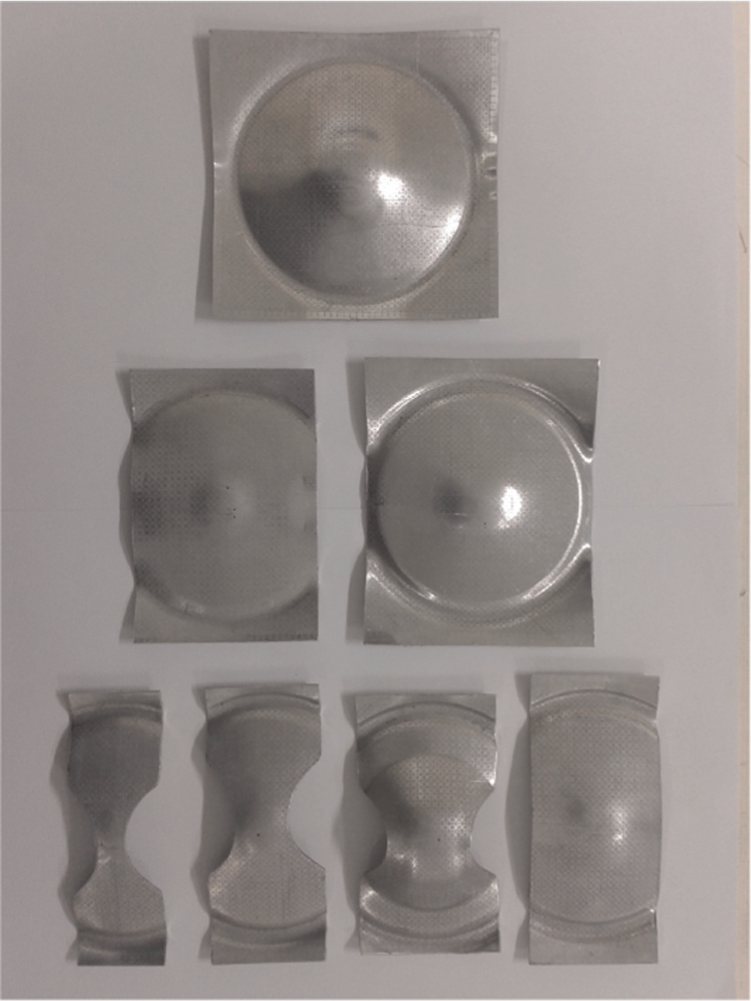
Hemi-spherical punch test is performed for samples with different aspect ratios to measure forming limits of AA1050 sheet of 1 mm thickness. The initial geometry of the sheet samples used in the test is presented in Figure 4.
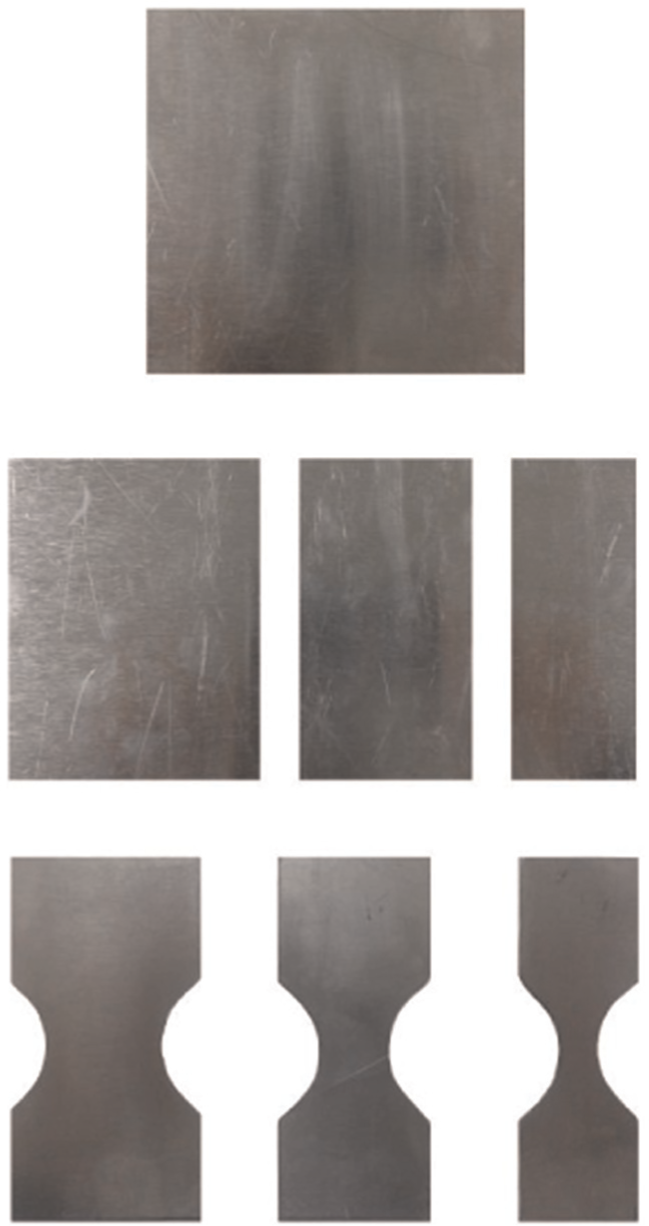
Initial geometry of the sheet samples of FLD test.
The square geometry—aspect ratio = 1—is designed to produce a strain path at the right-hand side of the FLD. In this region, appropriate lubrication improves the loading symmetry and enables us to approach to the more equi-biaxial strain paths. The high aspect ratio samples are designed to produce a strain path at the left-hand side of the FLD. These samples are prone to tear from blank holder edge. In order to prevent sample edges from tearing, an amount of the material is removed from two middle sides of the samples. In this way, the central part of the sample is weakened and necking occurs in this region.
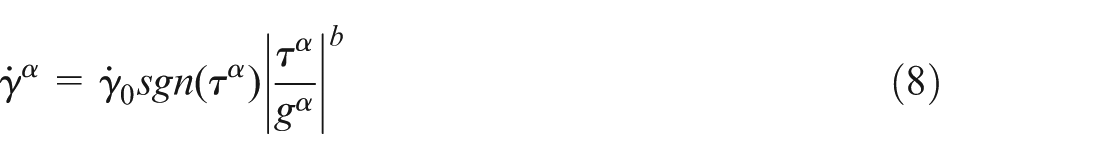
In order to measure the principal strains after necking, a pattern of circle grids of 0.1 in diameter is etch-printed on the initial sample surfaces. The circles deform to some ellipses and the diameters are used to measure the average principal strains in each circle. The samples are drawn with a punch travel rate of
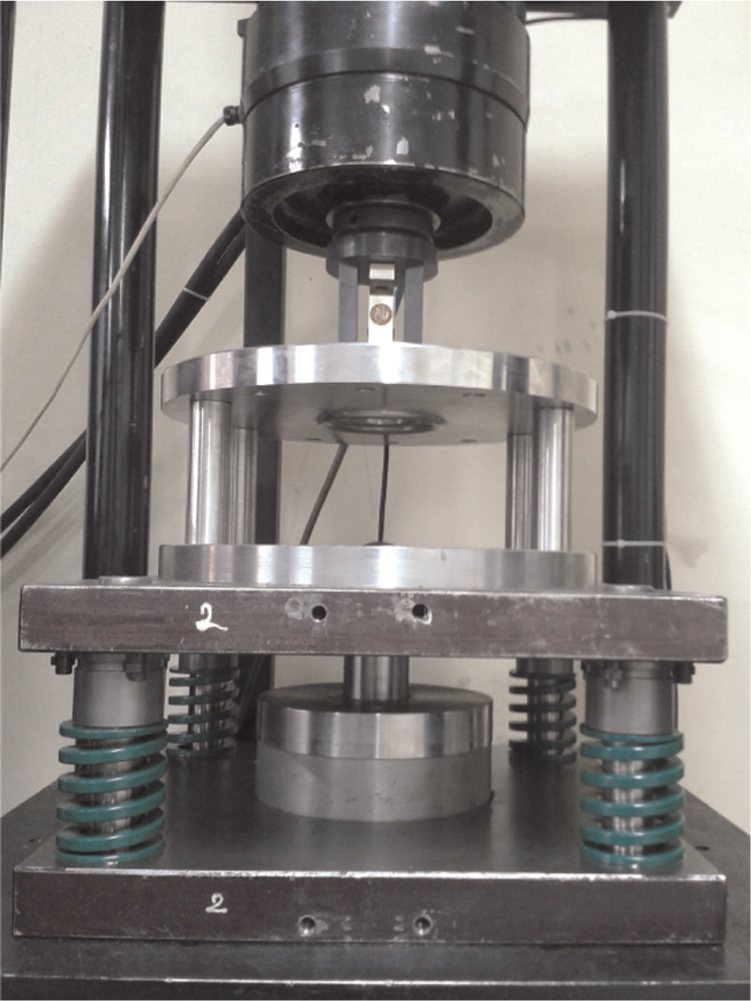
The employed hydraulic press with the complete set of die, punch and blank holder.
The sheet samples after necking are presented in Figure 6. The strains of each sample at the initiation of necking is measured and represented on the plane of principal strains to construct FLD. The resulted experimental FLD along with the numerical prediction are presented in the “Results” section.
Sheet samples after necking.
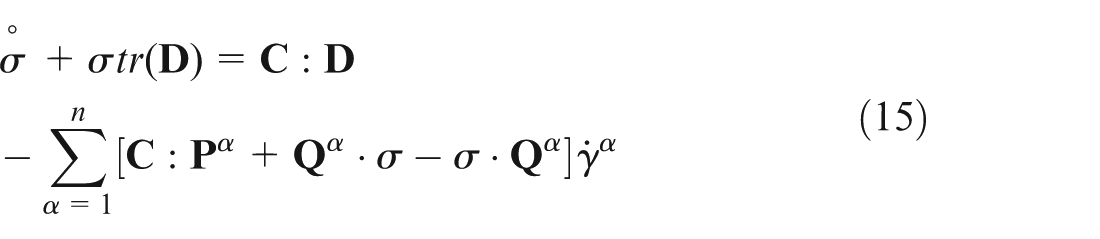
Constitutive relations
Stress–strain relations
The total deformation of the material at the crystal scale is considered to be composed of two parts 25

in which
and so, the rate of deformation tensor
where

The interested reader can refer to Hajian and Assempour 22 for detailed description.
Also, the rate-dependent relation between shear stress in the slip system and the corresponding shear strain rate in the form of power law is
where

where
In which the variations of the function
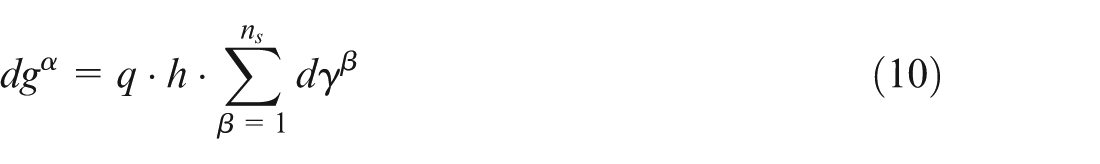
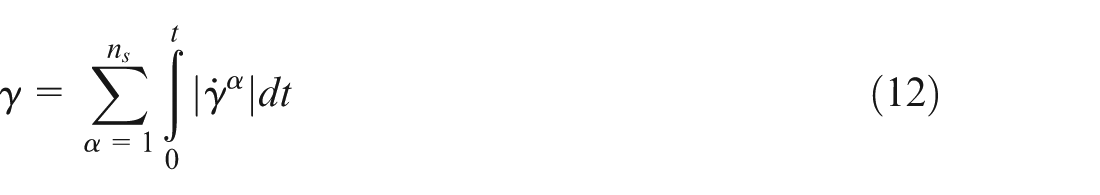
where the hardening rate is
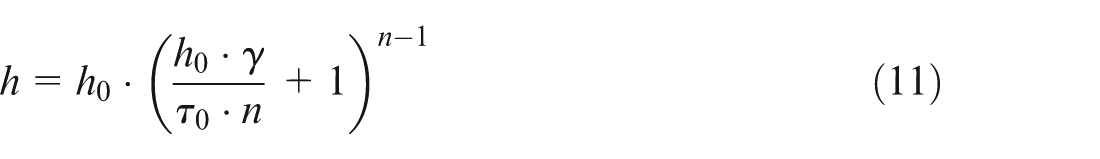
and the total cumulative shear strain is
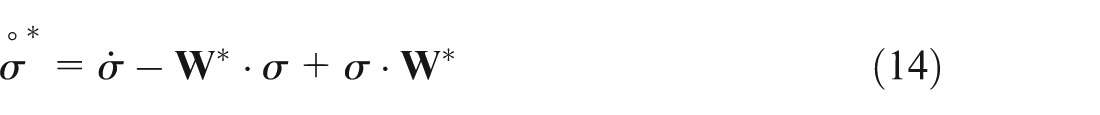
To extend the stress–strain relation from rigid plastic to the elastic–plastic state, Hill and Rice 27 suggested the following hypo-elastic equation for the elastic behavior at the crystal scale
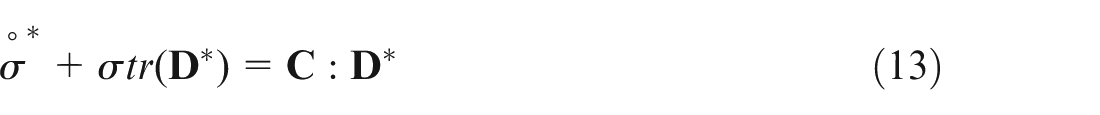
where
where
where

Solution method
Finite element model
In order to simulate the crystal plasticity behavior of the material, a user material was developed by Hajian and Assempour 22 in the form of a Fortran subroutine. This subroutine was linked to the non-linear finite element software ABAQUS. This work enabled us to simulate an arbitrary plastic deformation considering the initial texture of the material and its texture evolution. In this subroutine, the rate-dependent crystal plasticity constitutive equations are solved for the magnitudes of slips on 12 slip systems. To do this, a semi-implicit time integration method was employed as follows
where using relation (8) and the Taylor expansion method,
where
FLD calculation
The algorithm of calculation of FLD points is presented in Figure 7. In this algorithm, a rectangular sheet geometry is simulated by employing our developed user subroutine. In a manner like Marciniak–Kuczynski (M-K) method, a groove is added to the sheet to enable the simulation to capture necking of the material. The sheet is discretized into 702 elements and is loaded in two in-plane directions by applying displacement-type boundary conditions. In order to produce various strain paths on the FLD, the loading ratio
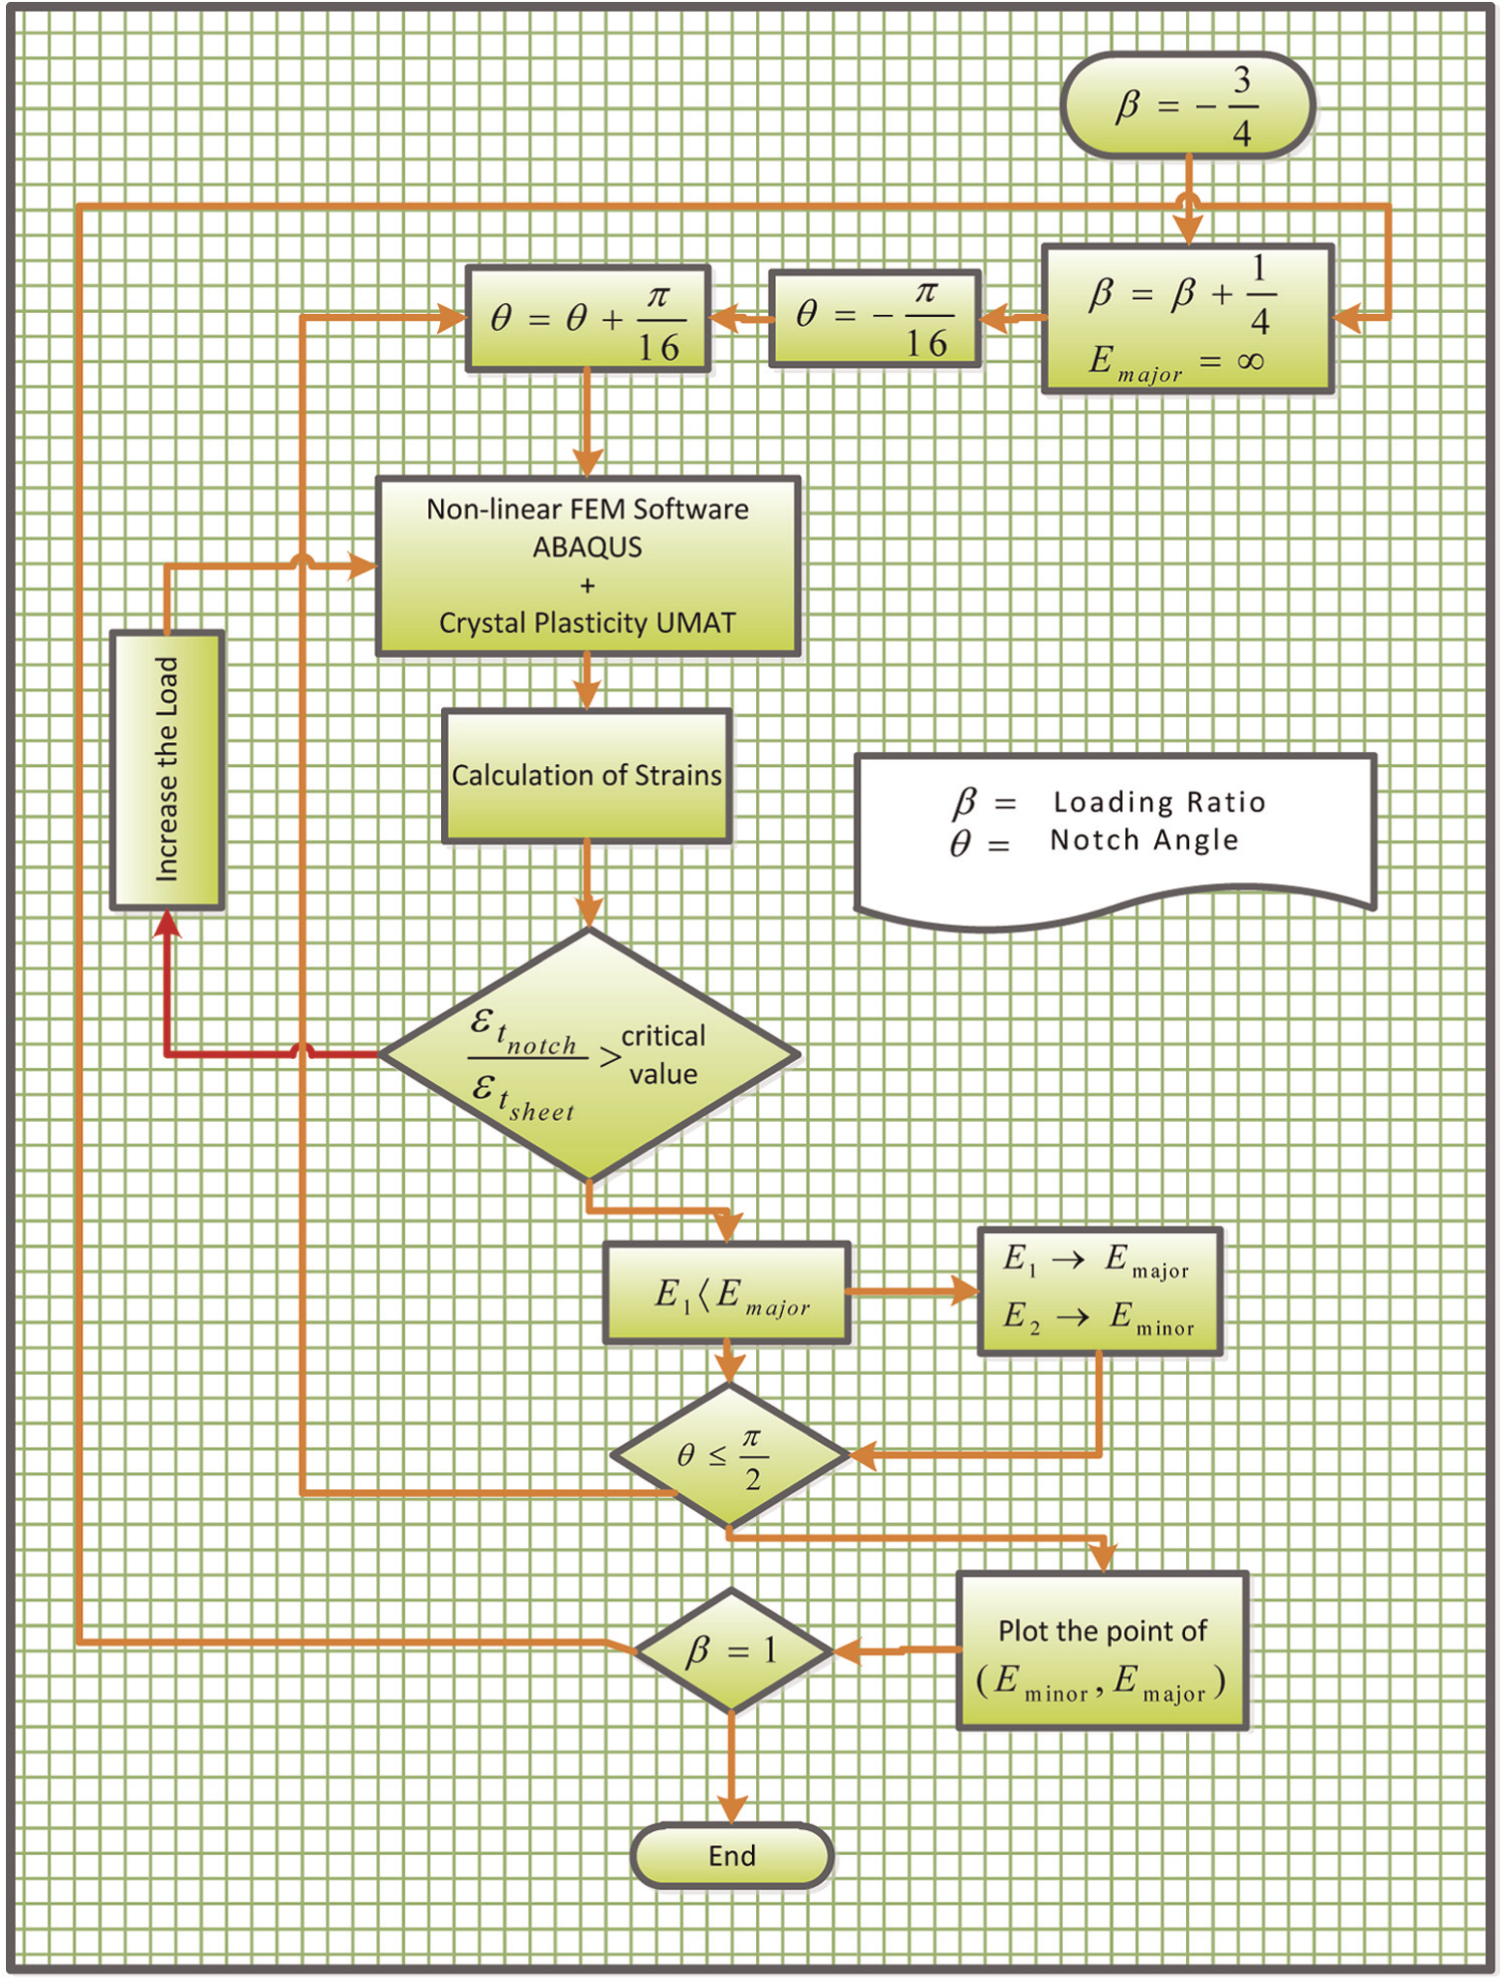
FLD calculation process.
Results and discussions
The complete set of required experimental input and verification data for crystal plasticity–based prediction of FLD of AA1050 sheet along with the results of numerical FLD calculation is presented in this section. To this end, the initial texture of the material was measured in terms of
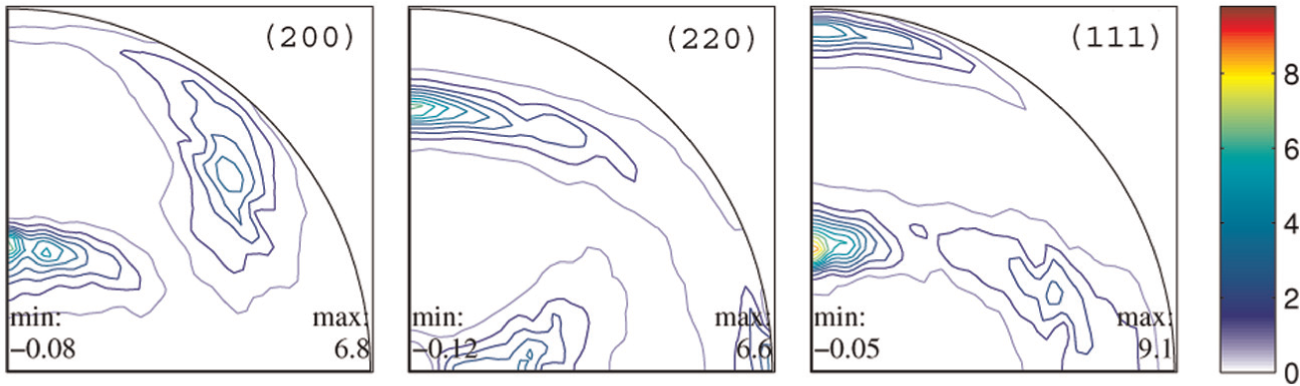
The corrected stereographic pole figures of the employed AA1050 sheet.
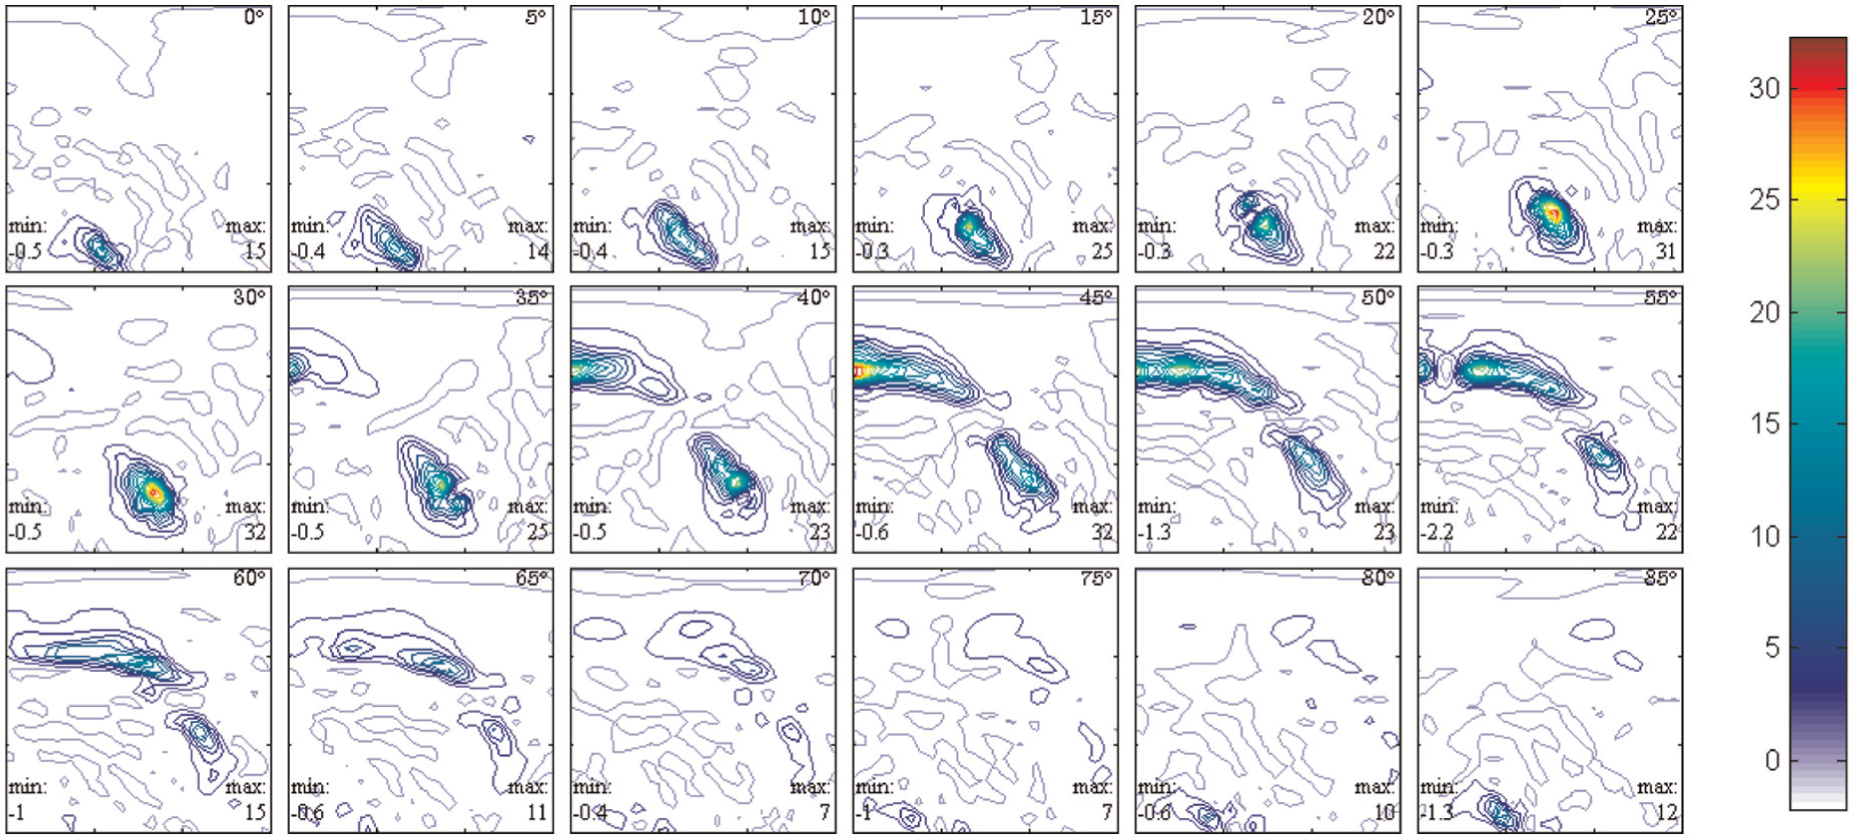
Orientation distribution function of the employed AA1050 sheet.
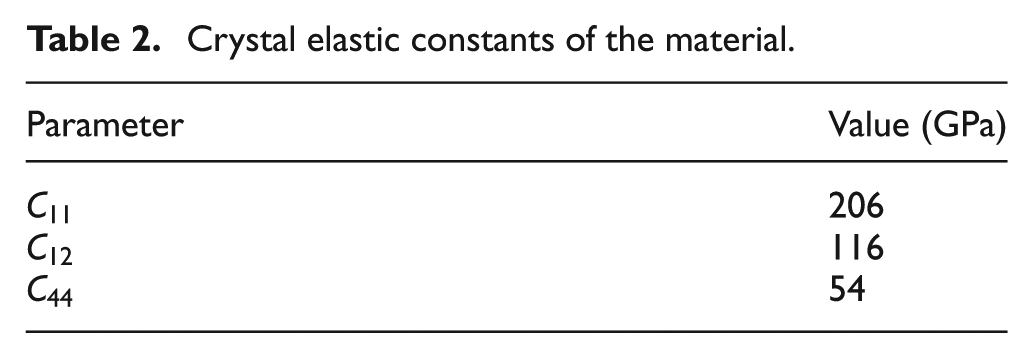
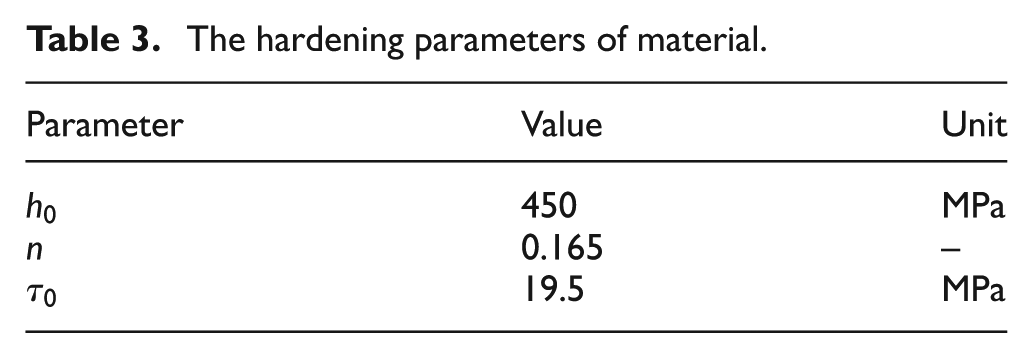
The crystal elastic constants of the material are presented in Table 2. The hardening parameters of the material have been extracted by fitting the simulated stress–strain curve to the experimental data as shown in Figure 10. The values of these parameters have been reported in Table 3. Also, the rate sensitivity exponent
Crystal elastic constants of the material.
The hardening parameters of material.
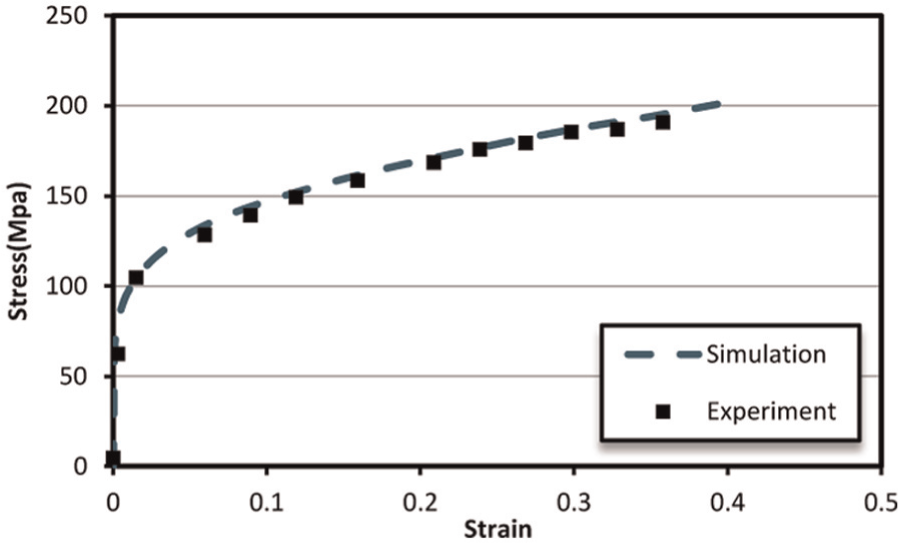
The resulted stress–strain of the material.
The thickness distribution of the material is computed for various strain paths and FLD of the material is calculated following the procedure described in section “FLD calculation.”
The experimentally measured forming limit curve including fail, safe and neck points along with our crystal plasticity–based prediction of neck points are presented in Figure 11. The experimental points at the right-hand side of FLD are obtained from sufficiently lubricated square samples. The lubrication helps us to reach a symmetrical situation in the two principal loading axes.
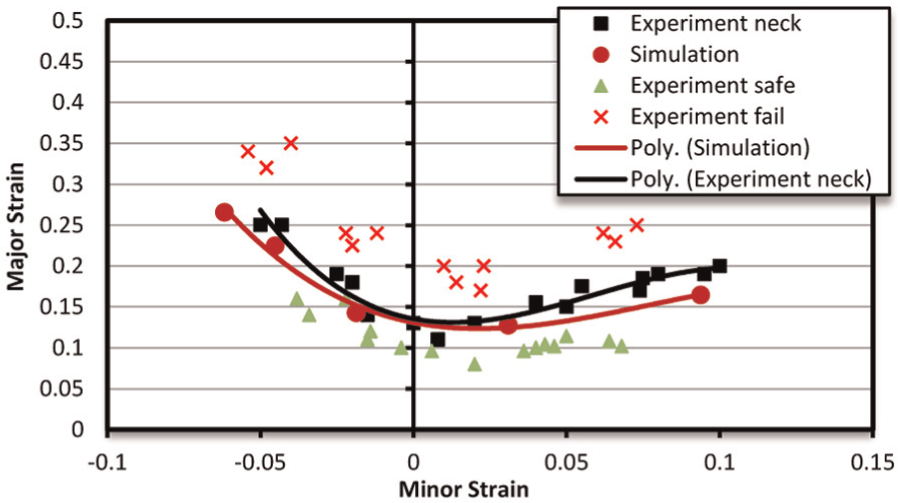
Resulted FLD from experiment and simulation.
The percent errors of FLD prediction with respect to the experimental results are shown in Figure 12. It is observed that computational results satisfactorily predict the experimental FLD. Although the prediction accuracy seems acceptable, some differences yet exist between numerical and experimental results. There are some reasons for these differences. In this research, just slip on the slip systems of the crystal has been considered, which is the main mechanism of plastic deformation. But there are some other mechanisms that accommodate the plastic deformation, such as twinning and grain boundary sliding. Another reason is that the Taylor model has been selected for the scale transition among the microscopic and macroscopic scales.
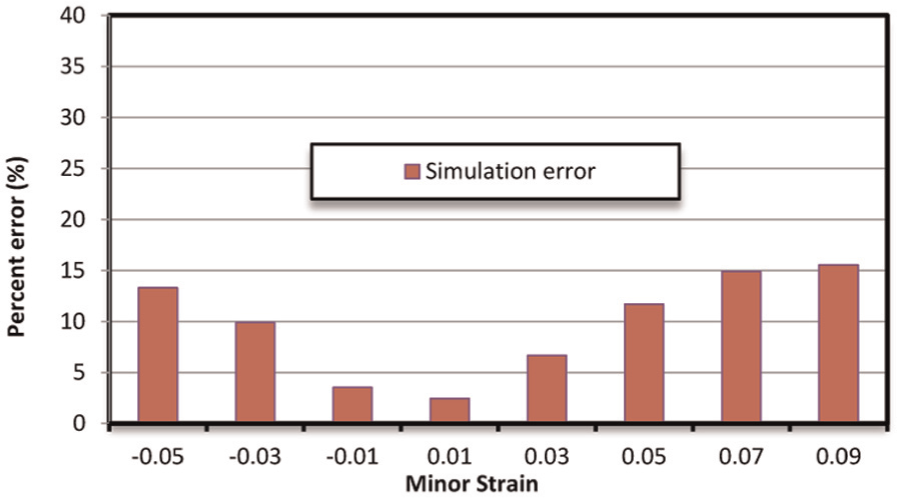
Percent errors of FLD prediction with respect to experimental results.
Adding the effects of twinning and grain boundary sliding into the model and employing more advanced models of scale transition can further improve the results. Improving the currently developed tool for crystal plasticity–based prediction of forming limits and investigating the effects of various texture components on the formability of face-centered cubic (FCC) sheet metals will be studied in a future work.
Conclusion
A crystal plasticity methodology to evaluate the AA1050 sheet formability was presented in this work. In order to determine the orientation distribution of the crystals, the initial texture of the sheet material was measured through XRD technique. Also, the stress–strain behavior of the material was obtained by conducting tensile test. The results of texture measurement by XRD and tensile test were used as the input material properties in the FLD prediction by simulation. The simulations were based on the numerical procedure developed previously by the authors in which a rate-dependent crystal plasticity model along with the power law hardening were employed in a user material subroutine to model the behavior of body-centered cubic (BCC) crystalline solids. The procedure was extended to model the behavior of FCC crystal structures. In order to assess the validity of formability prediction results for FCC materials, FLD of AA1050 sheet was also experimentally extracted by conducting hemi-spherical punch test in different strain paths. Second-order derivative of sheet thickness variations with respect to time was considered as the instability factor to extract forming limits of the material. It was observed that the numerical FLD satisfactorily predicts the experimental curve. Finally, the reasons for the existing differences were discussed and some suggestions to further improve the prediction accuracy were made.
Footnotes
Appendix 1
Declaration of Conflicting Interests
The author(s) declared no potential conflicts of interest with respect to the research, authorship and/or publication of this article.
Funding
The author(s) received no financial support for the research, authorship and/or publication of this article.