
Abstract
Fixture layout optimization is a procedure to optimize position of locators and clamps in order to minimize specified objectives. Deformation of workpiece is a serious problem of concern while designing a fixture. Proper positioning of fixture elements is indispensable to achieve desired machining accuracy, better surface finish and high productivity. In this work, a novel methodology is proposed that incorporates full factorial design of experiments and statistical analysis. Furthermore, the stability of the workpiece is ensured prior to the prediction of objective function. The result of the proposed technique is compared with the results of the genetic algorithm–based optimization technique. A case study has been considered to evaluate the proposed methodology. The objective function determines maximum elastic deformation of the workpiece during the entire machining process. Finite element method is used to formulate the objective functions. The constraints are natural frequency of the workpiece–fixture system and reaction forces. Besides, artificial neural network–based model is developed to predict the elastic deformation of the workpiece–fixture system within the range of design parameters.
Keywords
Introduction
Fixture is a device used to position and hold parts firmly during machining operations. It is commonly used in batch production to save time and to increase productivity. Locators and clamps are the integral components of machining fixtures. Proper arrangement of locators and clamps ensures the dimensional and form accuracies of the products by reducing the elastic deformation of the workpiece.
Optimization of fixture layout and clamping forces has received significant attention among researchers in recent years. Padmanaban et al. 1 used ant colony algorithm (ACA) to optimize the fixture layout with the objective of minimizing the elastic deformation of the workpiece during machining and finite element method (FEM) is used for calculating elastic deformation. Liao 2 presented a genetic algorithm (GA)-based optimization technique to optimize the number of locators and clamps and their position in a sheet metal assembly fixture. Siebenaler and Melkote 3 explored the viability of FEM to predict the elastic deformation of the workpiece using ANSYS and verified the results. Kaya 4 developed a tool using GA integrated with ANSYS to optimize the fixture layout. Padmanaban and Prabhaharan 5 used ACA and GA separately for layout optimization and reported that ACA outperforms GA. Kashyap and DeVries 6 used non-linear optimization technique to optimize the fixture layout of drilling process. Li and Melkote 7 also presented a non-linear optimization technique for optimization of fixture layout. In their study, it is concluded that the elastic deformation of the workpiece contact leads to rigid body motion of the workpiece. However, the elastic deformation of the entire workpiece under machining conditions is ignored. Kulankara et al. 8 presented a GA-based fixture layout design and clamping force optimization. Chen et al. 9 presented a multi-objective optimization technique based on GA and FEM to optimize the fixture layout and clamping force. In this study, both friction and chip removal effects were taken into account. Kaya and Ozturk 10 introduced a workpiece–fixture layout verification approach with the application of frictional contact and chip removal effects using a non-linear finite element technique. Fan and Senthil Kumar 11 presented a hybrid technique to optimize fixture layouts using the Taguchi method and Monte Carlo statistical method. Kumar and Paulraj 12 applied GA along with ANSYS integrated tool to optimize the fixture layout for a drilling application. Dou et al. 13 used particle swam optimization (PSO) algorithm, improved particle swam optimization (IPSO) algorithm, GA and improved genetic algorithm (IGA) to optimize the fixture layout and compared the performances of these algorithms. It is predicted that the IPSO is superior to GA, IGA, and PSO. Abedini et al. 14 presented a GA-based approach to optimize locator position to reduce machining error. Zhihui et al. 15 presented a GA-based approach to optimize the clamping force and fixture layout. Yu et al. 16 presented a vector approach to check the immobilization criterion in the fixture design. Deiab 17 used FEM-based approach to simulate the dynamic behavior of the workpiece under varying fixture layouts. Jeng and Gill 18 presented an automated approach for the prediction of optimal position for the locators and clamps considering geometric limitations. Abedini et al. 19 developed an automated process planning system for setup planning and fixture design. Nasr et al. 20 developed a rule-based approach for automatic fixture system modeling. Vishnupriyan et al. 21 predicted the dynamic motion of the workpiece using an optimized artificial neural network (ANN).
In other optimization problems, integration of FEM and design of experiments (DOE) was applied and proven to be a successful technique. Alaswad et al. 22 used similar technique to optimize the process parameters in bi-layered tube hydroforming. Ko et al. 23 also applied a combination of the Taguchi method with FEM for metal forming process to optimize the design parameters.
In most of the previous research works, fixture layout problem is solved using GA-based optimization technique that extensively increases the computational effort while integrating finite element software with GA code. Furthermore, the elastic deformation of the workpiece is minimized in fixture layout design ignoring the impact of reaction force and resonant frequency on the workpiece–fixture system during machining.
This work exhibits a heuristic procedure to find the optimal position for the locators and clamps in order to reduce the elastic deformation of the workpiece during machining with respect to the deterministic location. Initially, a three-factor full factorial design combination is generated and reaction forces for each layout are evaluated during the machining simulation. The layouts that are showing positive reaction force during the entire machining simulation are recognized as fittest fixture layouts. Subsequently, statistical analysis is performed for the fittest layouts and optimum range for each design parameter is obtained. In order to get the optimum layout, the statistical analysis is iterated for the fittest layouts generated using the optimum range obtained in the previous iteration. The algorithm iterates till the optimum range converges to the optimum value for each parameter. Hence, the proposed approach is named as iterative design of experiments (IDOE).
In the proposed method, the constraints are considered during optimization of fixture layout design, whereas it is noticed from the literature that the optimization algorithms have been used without consideration of the constraints. Furthermore, the negative reaction force and resonance condition are considered as the constraint functions and are ascertained prior to the prediction of the objective function value. Consequently, the dynamic stability of the workpiece is ensured during machining. Hence, the constraints considered in this work are appropriate and not ignorable. Also, the computational efforts are reduced considerably as the unfit fixture layouts are eliminated prior to the prediction of objective function value. This work claims that the attempt of consideration of practical constraints during optimization of fixture layout design would benefit the manufacturing industries.
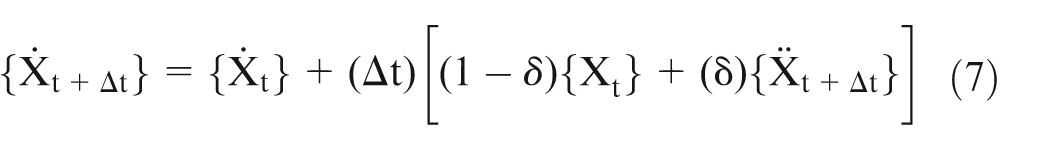
The proposed algorithm is demonstrated with a slot milling operation depicted in the work proposed by Kaya. 4 In the slot milling operation, the axial machining force perpendicular to the workpiece is less dominant and it is not considered for the analysis. Hence, the analysis is reduced to two-dimensional plane-stress problem. The configuration of the workpiece in two dimensions is illustrated in Figure 1 showing the dimensions and the machining direction.
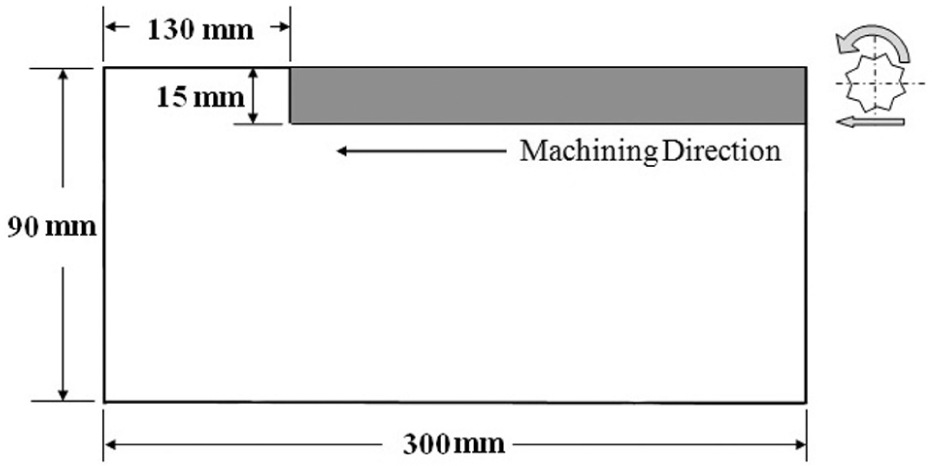
Workpiece configuration.
Modeling and simulation
FEM is an effective tool to predict the elastic deformation of the workpiece under machining conditions at any nodal point. In finite element analysis (FEA), workpiece is considered as an elastic body and subjected to plane stress. Workpiece is discretized into definite number of quadrilateral elements that have 2 degrees of freedom at each node. Locators and clamps are considered as rigid bodies. Locators are modeled as translational constraints that restrict the workpiece movement in normal direction. Clamps are considered as point force acting on workpiece–clamp intersection nodal points. Machining forces are simulated as transient forces that act on machining nodes. The ANSYS software is used for the FEM modeling and analysis. Modal analysis (MA) for predicting natural frequency of the workpiece and transient dynamic analysis (TDA) for simulating machining force is a part of FEA analysis that is briefed in the following sections.
MA
MA is used to determine the vibration characteristics of the structure-like natural frequencies and shape of mode. It helps to study the structural behavior under dynamic loading conditions and to determine the step size of time interval for transient analysis.
The equation of motion for natural frequency is the reduced form of the equation of motion. If there is no damping, the equation of motion is
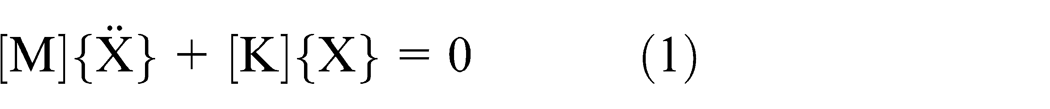
where [M] is the structural mass matrix, [K] is the structural stiffness matrix,
It is the equation of motion for undamped free vibration. The nodal displacement vector is a harmonic equation used for solving equation (1) and it is shown as equation (2)

where
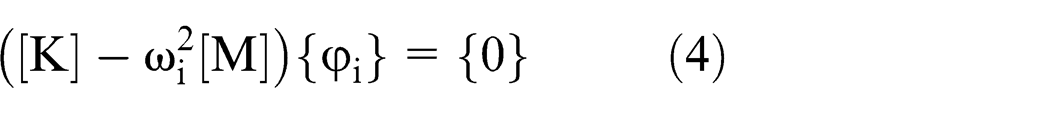
Equation (2) is differentiated to obtain the nodal acceleration vector
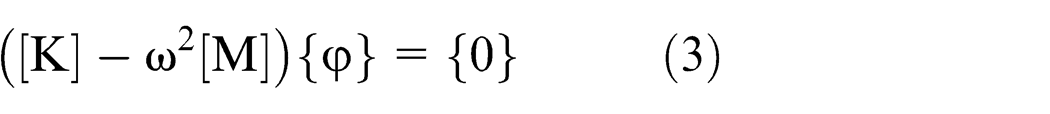
The two possible solutions for equation (3) are
The number of natural frequencies of a model is equal to the number of degrees of freedom (d) of the model and it varies from 1, 2, 3...i...d.“
The determinant value of
TDA
TDA is applied to simulate time-varying machining forces that act on workpiece. The second-order linear differential equation for the transient dynamic response of a structure at time “t” is given by equation (5) and the same equation for
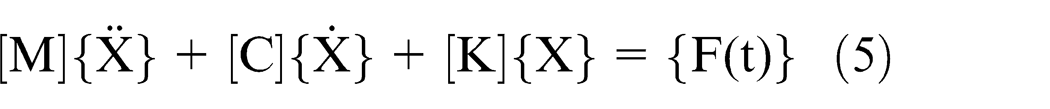

where [C] is the structural damping matrix,
The solution of the above equation gives the deformation of the workpiece with respect to time, where Δt is the small change in time and is called step size. Bathe
24
presented the Newmark’s method of direct integration technique and used the following equations (7) and (8) to compute velocity and displacement in the time interval
The terms “
Proposed methodology
The problem proposed by Kaya 4 is considered for the optimization of the fixture locations. The workpiece deformation is minimized during machining by considering the predominant machining and clamping forces. In order to eliminate cumbersome procedures, the constraints have been formulated and proposed so as to find the ranges of the locators and clamps such that there is no negative reaction forces exerted during machining. The possible and desirable layouts of the locators and clamps have been determined using constraints. The above process is modeled with the aid of MATLAB software. The procedure eliminates most of the undesirable positions of the locators and clamps, thus reducing the computational time. The schematic of fixture components, proposed constraints, objective functions, arrangement of fixturing elements and modeling procedure is briefed in the next subsections.
Schematic of fixture components
In this analysis, a slot milling over a rectangular workpiece of length and height (300 mm × 900 mm) with three locators and two clamps is considered. The thickness is assumed as 10 mm. The orientation of the locators and clamps is denoted by the terms “L” and “C,” respectively. The positions of three locators (LA, LB and LC) from the nearest edge are termed as L1, L2 and L3, respectively. Similarly, the positions of the two clamps (CA and CB) are termed as C1 and C2, respectively. The possible position of the locator LA varies from the left-side vertical edge of the workpiece to the point nearer to the midpoint of the bottom edge. Similarly, the locator LB has the range of its position from the point nearer to the midpoint of the bottom edge to right-side vertical edge. It is evident that the midpoint could not be considered for both the locators as it is impossible to position two locators at a single point. The locator “LC” can be positioned anywhere along the length of the left-side vertical edge. The possible position of the clamps CA and CB is variable and it depends on the depth and length of the slot to be machined. In this case, the clamp CA is assumed to have the point of positioning anywhere within the distance of 75 mm along the right-side vertical edge. The point of positioning of clamp CB is anywhere between the left-side vertical edge and the 130-mm length. The schematic of workpiece with locators, clamps and milling cutter is shown in Figure 2.
Fixture layout.
Optimization strategy
The locators and the clamps have the range of possible positions during the machining process. It is required to predict the deformation and resonance for each position of three locators and two clamps and each configuration is considered to be one layout. In this case, five elements have the possibility to have different positions for a fixture layout. If each element is considered to have three possible positions, then for five components, there will be 243 possible layouts (i.e. three raised to the fifth power). All the possible layouts are analyzed for its feasibility. The layouts that yield the reaction forces as negative are considered to be infeasible layouts and ignored for further analysis. Among the feasible layouts, the deformation of the workpiece and its resonance are determined and recorded.
Furthermore, in view of obtaining the best layout, the range of the positions of locators and clamps is redefined and the same procedure is repeated. The deformation of the workpiece is reduced as the number of iterations progresses. During the process, the frequency of the system is also evaluated and resonance is eliminated. The process is continued until the result converges. In this study, the non-negative reaction force criterion is programmed using MATLAB and it gives the fittest layouts for the next level. Maximum elastic deformation and the natural frequency of all the fittest layouts are computed using FEM. The optimum parameter is chosen based on the objective function values. The proposed IDOE approach for the fixture layout optimization technique is illustrated in Figure 3.
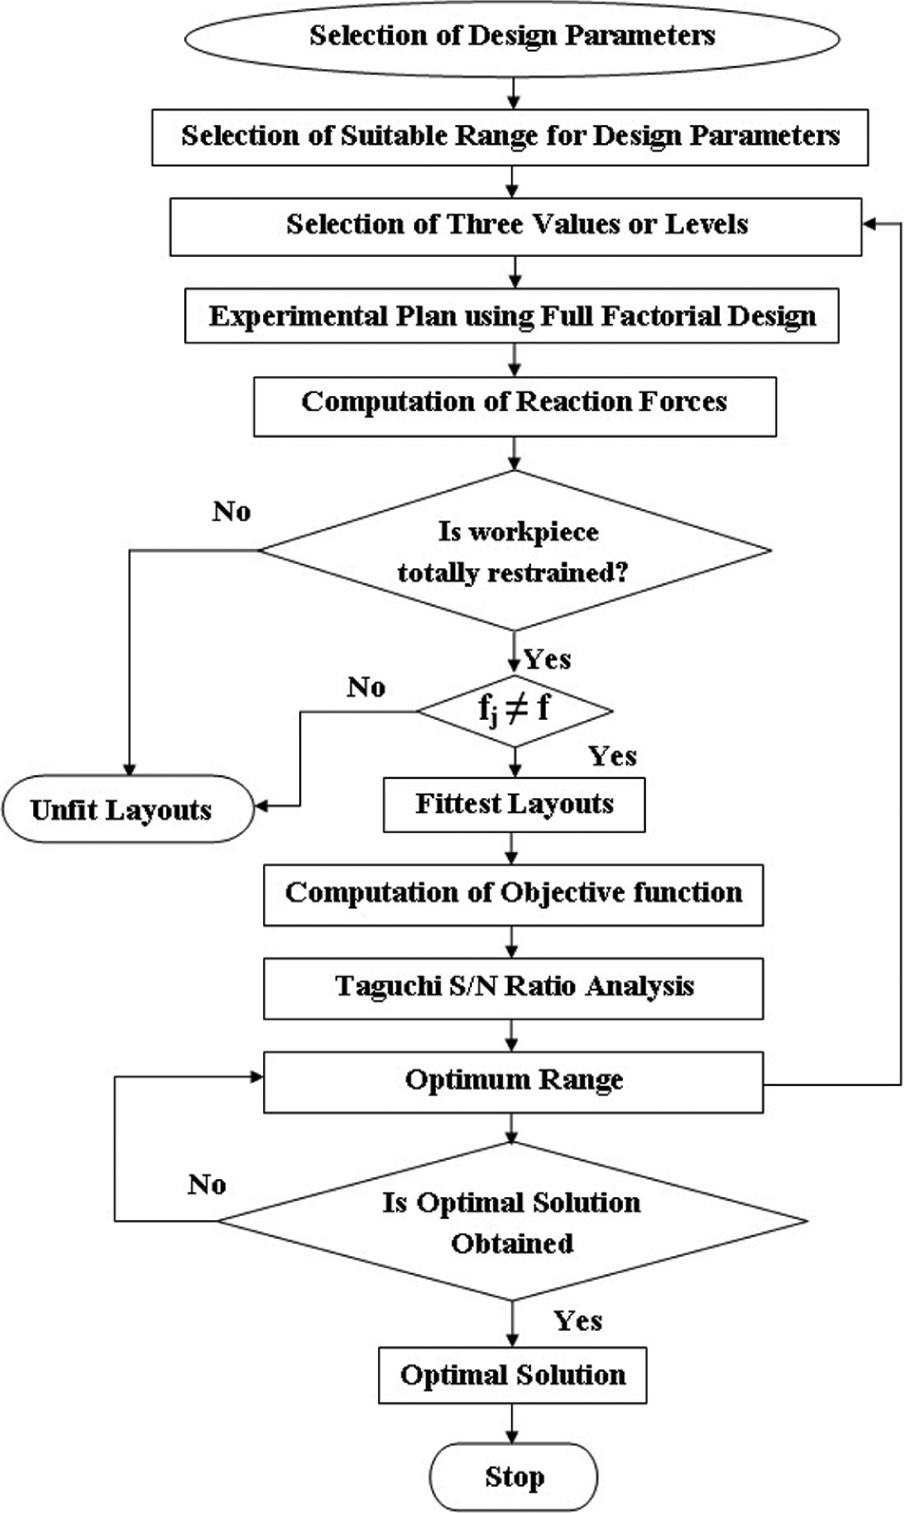
IDOE-based fixture layout optimization procedure.
Constraints
The possible position and its range of locators and clamps are briefed in the previous section. Within the possible movements of locators and clamps, the feasible positions are derived using the proposed constrains. The constraints thus developed are expected to satisfy the following criteria:
The reaction forces at locators are non-negative during machining. Thus, the stability of the system is ensured.
Elimination of resonance of fixture system (the natural frequency of the system does not coincide with induced frequency of the fixture system).
Let us consider that the reaction forces at the locators are termed as
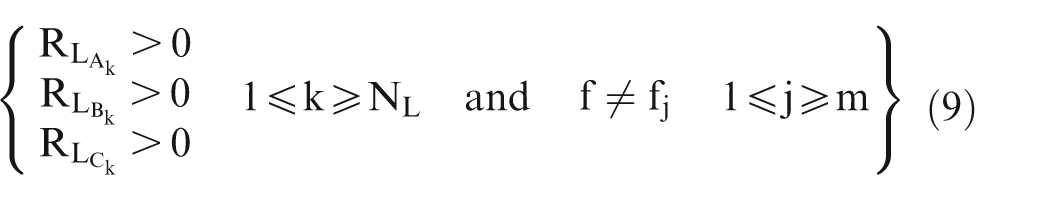
where NL is the number of load steps, m is the number of fittest fixture layouts, fj is the natural frequency of the workpiece–fixture system for the jth layout and f is the induced frequency of the workpiece–fixture system.
The reaction force at each load step of the machining process is obtained using static equilibrium condition, that is, net forces and moments must be 0 (
Formulation of objective function
It is required to minimize the deformation of the workpiece during machining with the support of locators and clamps under machining forces. The deformation of the workpiece depends on the reaction forces at the locators and the forces due to clamping and machining. Furthermore, for any one particular positioning of three locators and two clamps (any fixture layout), there will be a definite constant deformation in the workpiece and it has to be minimized. In order to minimize the deformation, it is required to predict the deformation of the workpiece at different possible layouts. The optimum layout is selected based on the deformation of the workpiece under machining and clamping forces. Hence, the objective function is formulated so as to predict the deformation of the workpiece for a specified layout and should be checked for different possible layouts. The layout that shows minimum deformation is selected as optimum layout.
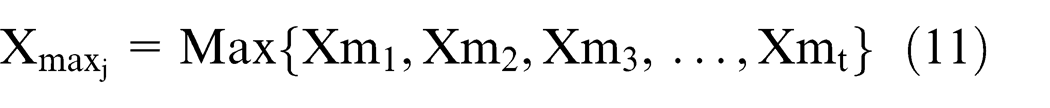
The solution of equation (5) is the displacement of the workpiece during machining. Thus, the objective is formulated so as to minimize the maximum deformation (

In the above equation, the maximum deformation
FEM model
The workpiece is modeled using ANSYS software for carrying out TDA. During modeling, the element length in the tool axial direction is taken as 7.5 mm to accommodate 12 elements. As the radial depth of cut is assumed as 15 mm, two elements are considered for the depth of cut. The cutter is assumed to progress to the length of 170 mm. Hence, the element length in the feed direction is assumed as 7.39 mm up to the length of 170 mm, and for the remaining length, the element length is assumed as 7.22 mm. The four-nodded quadrilateral element available in the ANSYS software that is capable of TDA is taken for modeling the entire workpiece. The total number of nodes thus created is 546 and each node has 2 degrees of freedom. The modeled workpiece component along with its locators and clamps is shown in Figure 4.
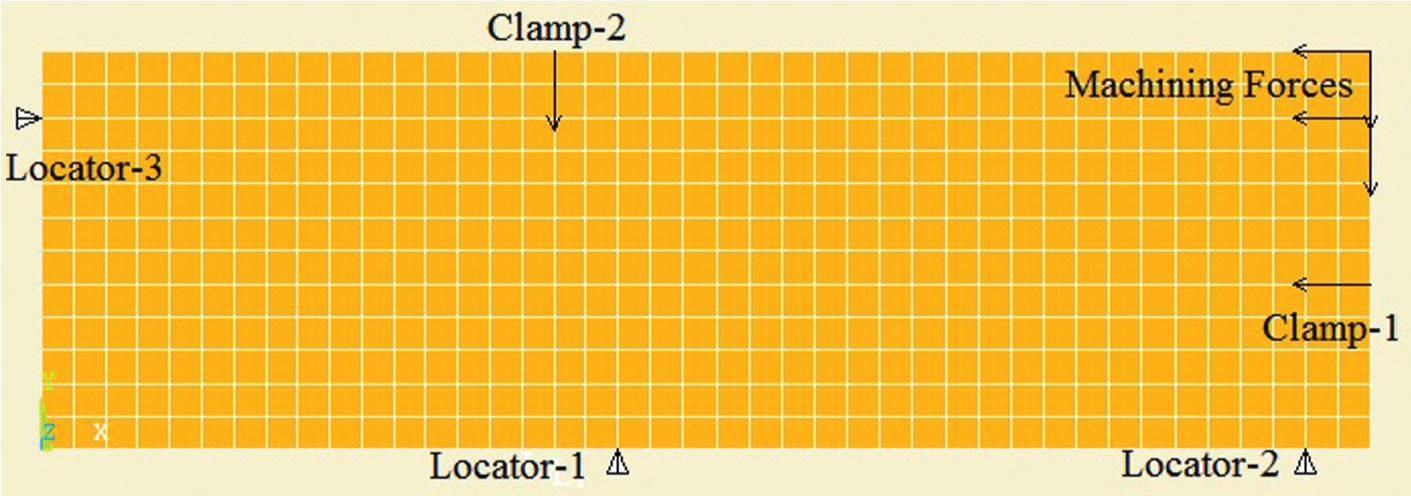
Finite element model and machining force.
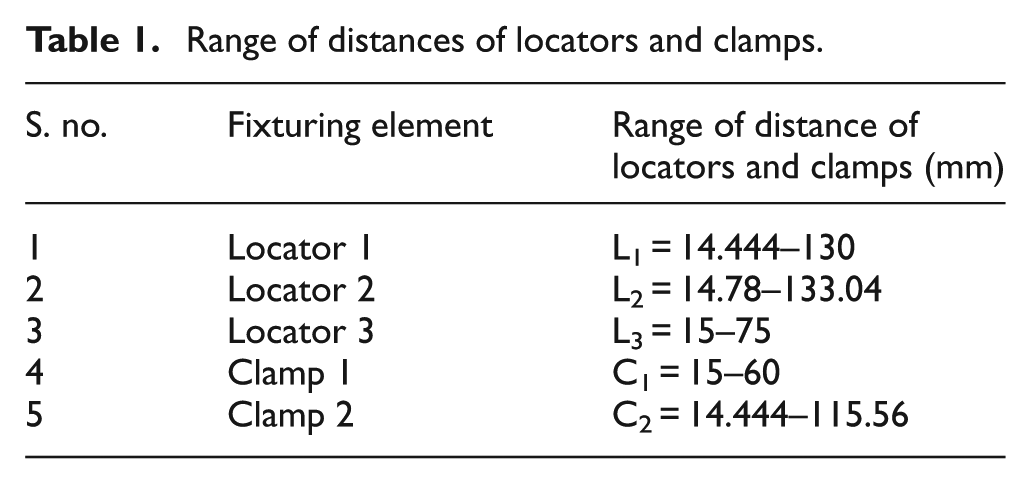
The possible ranges of positioning of the locators and clamps have been briefed in the “Schematic of fixture components” section. The nodes restrict the position of the locators and clamps as it is possible to place them at nodal points only. The range of moving distances of each locators and clamps has been decided and presented in Table 1.
Range of distances of locators and clamps.
FEM simulation
A prestressed TDA is carried out to depict the machining process more logically. In which, the effect of clamp load with the locator support is considered as static load and their combined effect is considered in subsequent machining force analysis. The model is analyzed by simulating appropriate load at the milling cutter location. The entire tool path is divided into 14 load steps. The first load and the last load steps are used to simulate the behavior of the workpiece–fixture system before and after the application of machining forces. The remaining 12 load steps are considered as feed steps that simulate entire machining process. The machining forces 4 are taken as Fx = 100 N and Fy = 286 N. The clamping forces 4 are taken as FC1 = 350 N and FC2 = 200 N. The Young’s modulus and density of the material are taken as E = 2 × 10⁵ N/mm2 and 7800 kg/m3, respectively.
Results and discussion
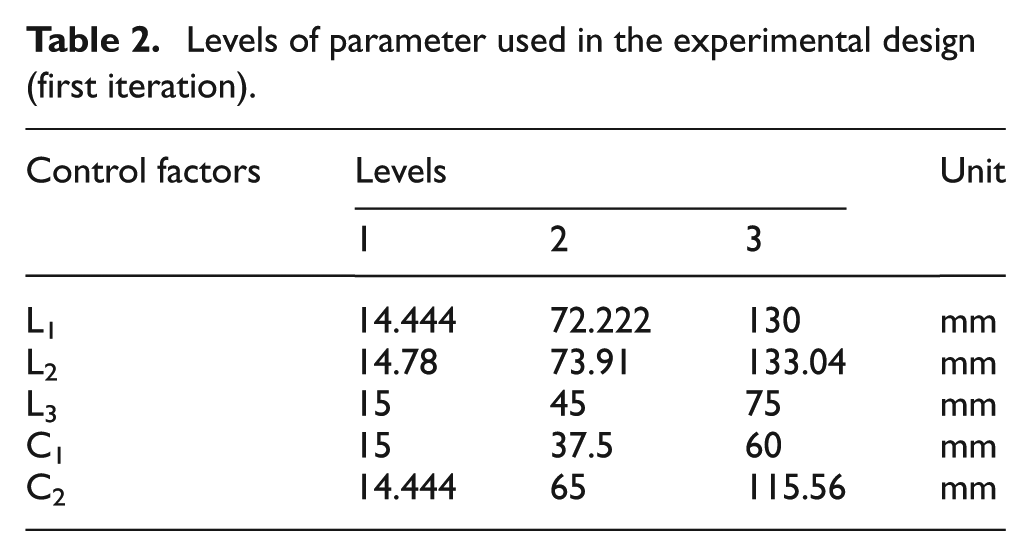
The process parameters and their values at three levels for the first iteration of IDOE are shown in Table 2. The full factorial combinations are tested with design constraints and 66 fittest layouts are obtained subsequently. The objective function values of the fittest layouts are obtained using FEM.
Levels of parameter used in the experimental design (first iteration).
Furthermore, the Taguchi analysis is carried out for customized experimental plan (fittest layouts) which is obtained after the selection of fittest layouts from the full factorial design. In this study, prediction of elastic deformation of the workpiece is the overall objective, and hence, the smaller-the-better signal-to-noise ratio (S/N) is opted and it is given in equation (12)
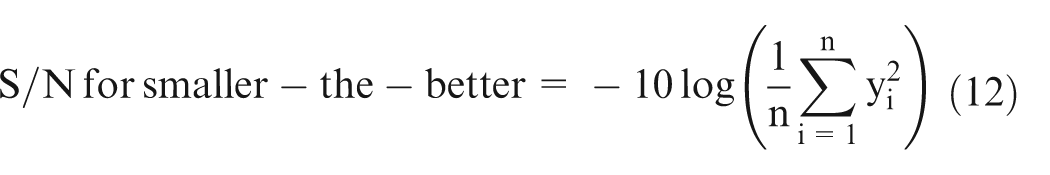
where
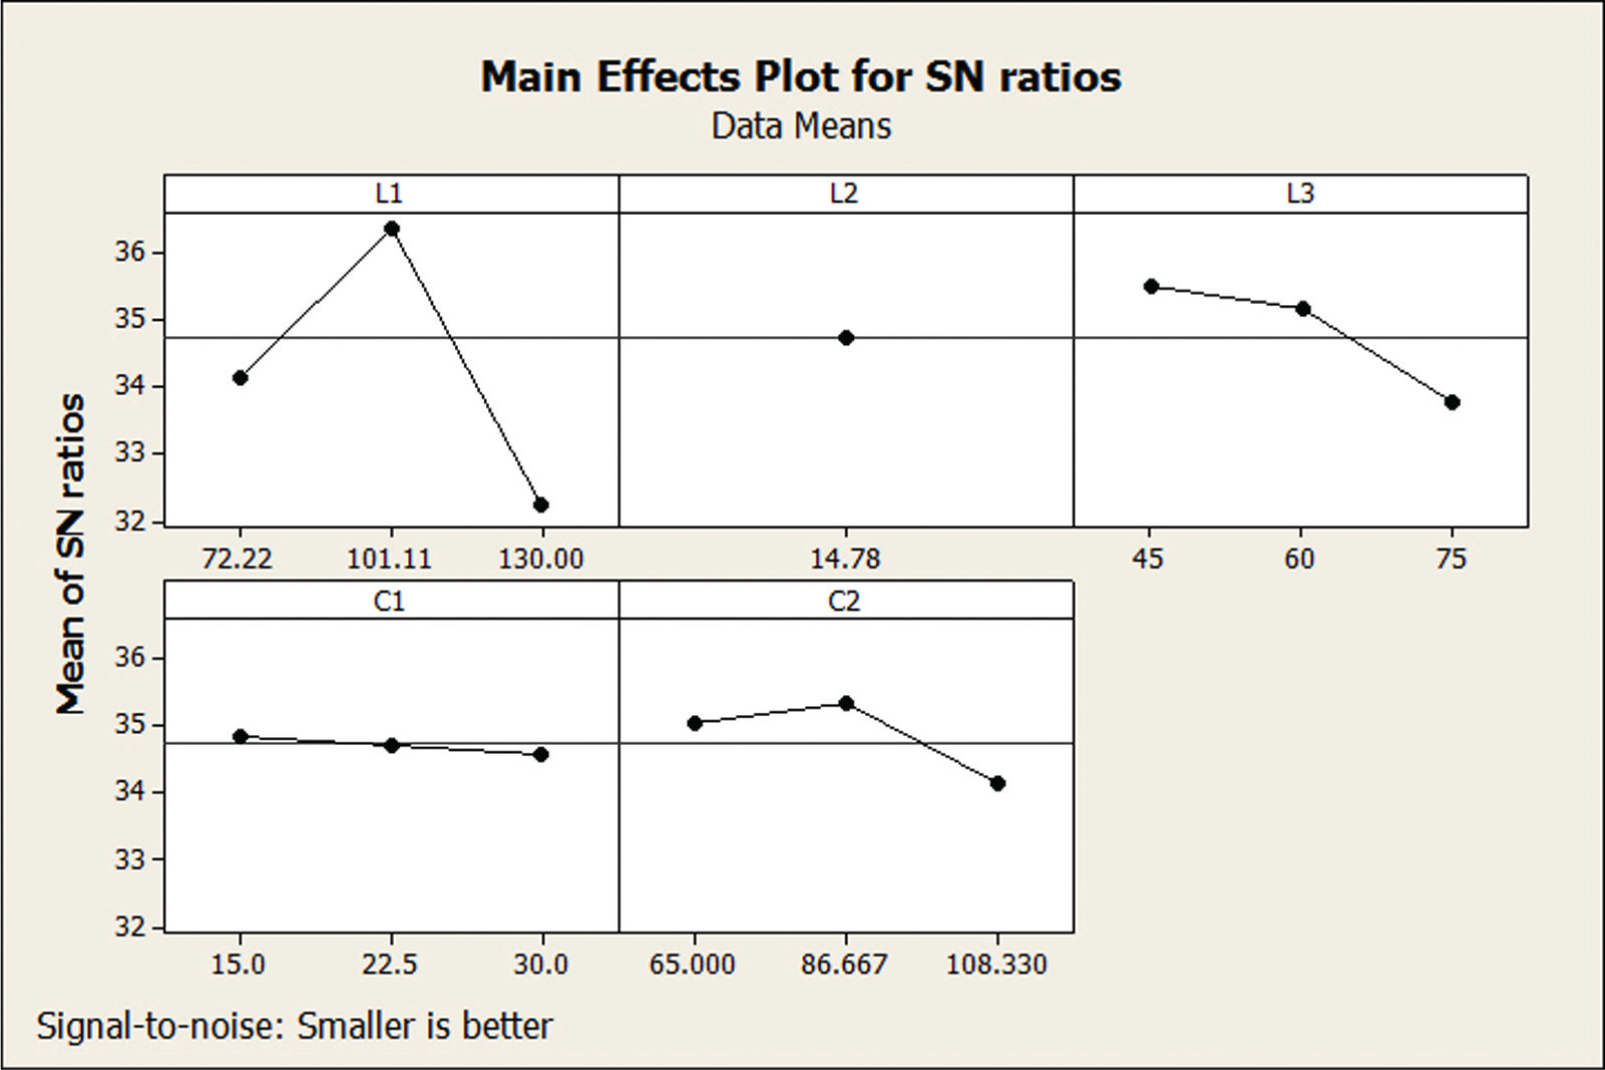
The main effect plots for mean and S/N (Figures 5 and 6) illustrate the effect of the five control factors on elastic deformation of the workpiece for the first iteration of IDOE. It can be seen from the mean effect plot that the elastic deformation tends to decrease, abruptly with decreases in L2. Also, it is observed that increase in L1 causes considerable decrease in response. It is because the effect of dominant component of machining force has to be properly constrained by the locators LA and LB during the entire machining process to reduce the deformation due to bending moment. The factor C2 is not significant when compared to L1 and L2. As the factor C2 is adjusted such that it is in-line with LA, the bending moment causing the deformation is reduced. Hence, the deformation value is less as C2 increases. The factor L3 has reasonable influence on deformation of the workpiece. As L3 increases, it will be nearer to the line of action of the cutting path and resist the deformation due to radial component of the machining force. The factor C1 has very less significant influence on elastic deformation. However, the deformation is less as C1 decreases. This is because as it approaches the lower value, it reduces the deformation due to the rotation of the workpiece in the counter-clockwise direction.
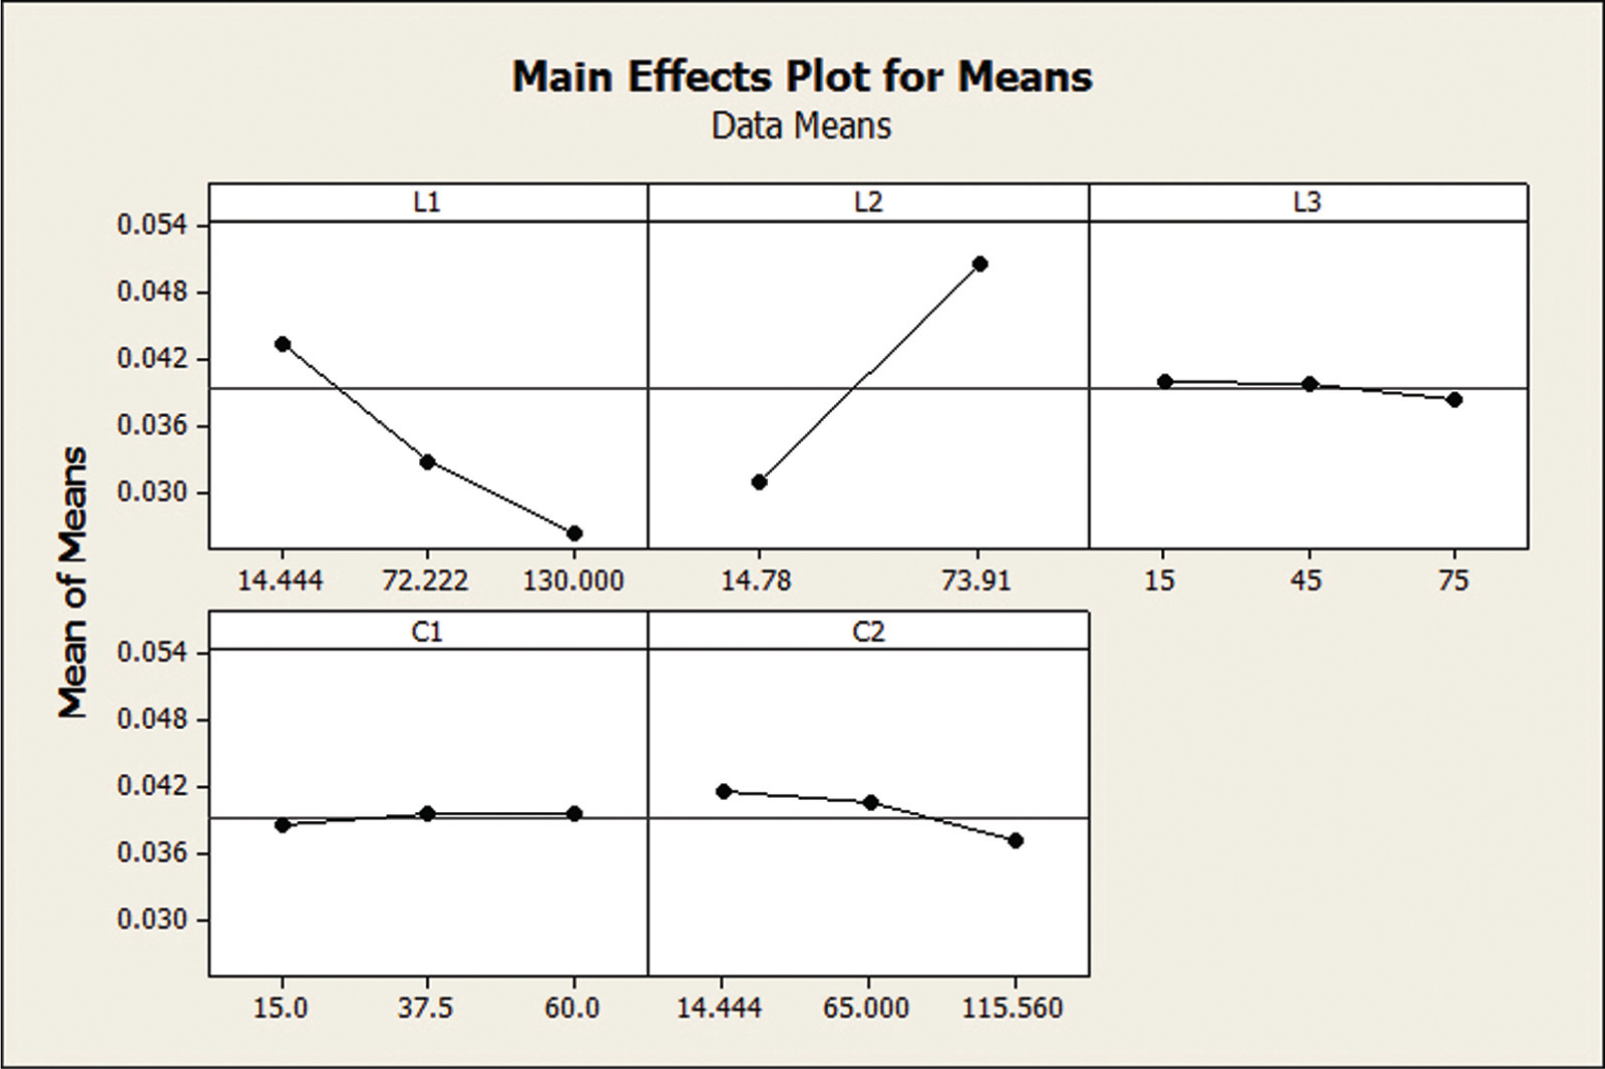
Main effect plot for means (first iteration).
Main effect plot for S/N ratios (first iteration).
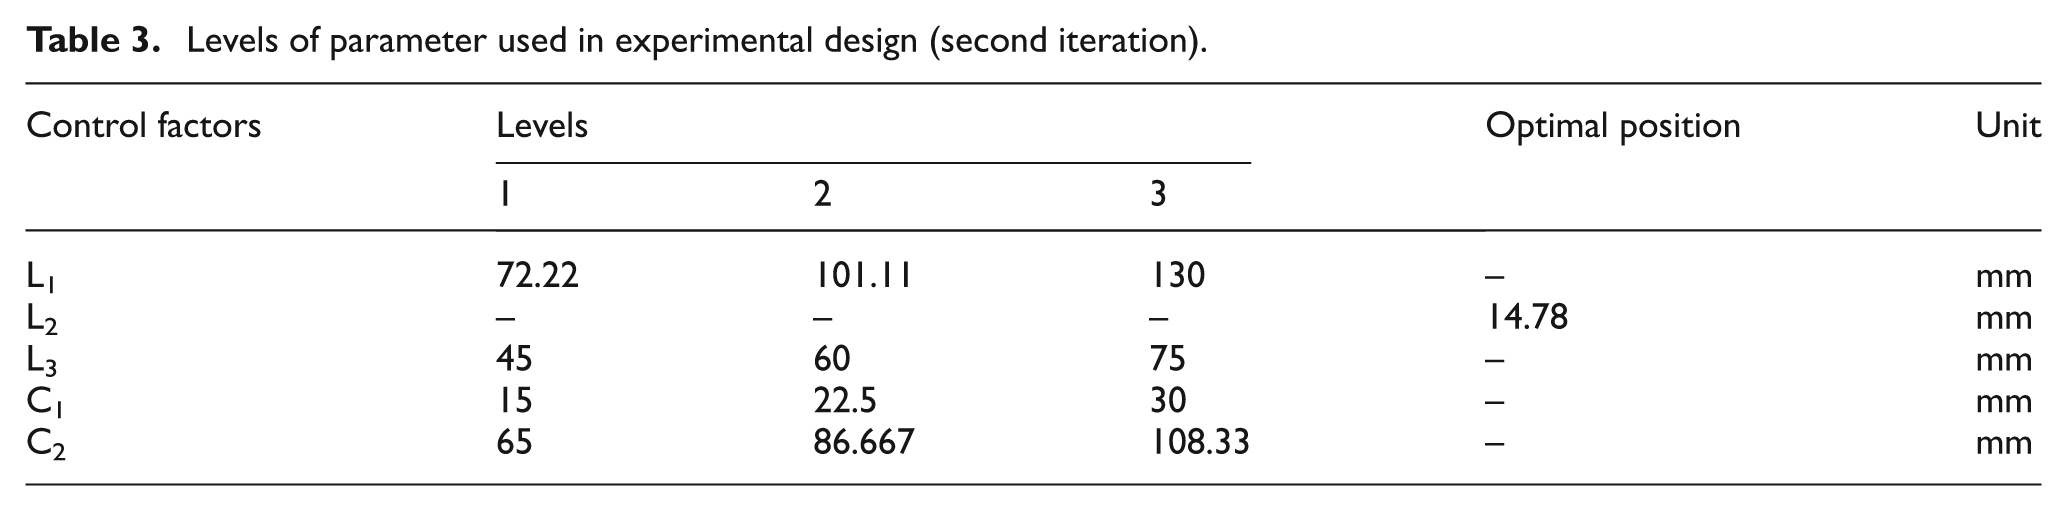
The prediction obtained from IDOE is used for further improvement of the quality of the machined part. The results obtained from IDOE give the best range for the parameters. In the first iteration, the optimum value is not obtained, and hence, the second iteration is done. In this process, the parameter L2 is not varied as there is no hope for improvement. The other four process parameters and their values at three levels for the second iteration of IDOE are shown in Table 3. In the second iteration, four factors each at three levels have totally 81 (i.e. three raised to the fourth power) possible combinations. The combinations are tested for non-negative reaction force criteria and 47 fittest layouts are obtained for the second iteration. The objective function value of the 47 fittest layouts is obtained using FEM.
Levels of parameter used in experimental design (second iteration).
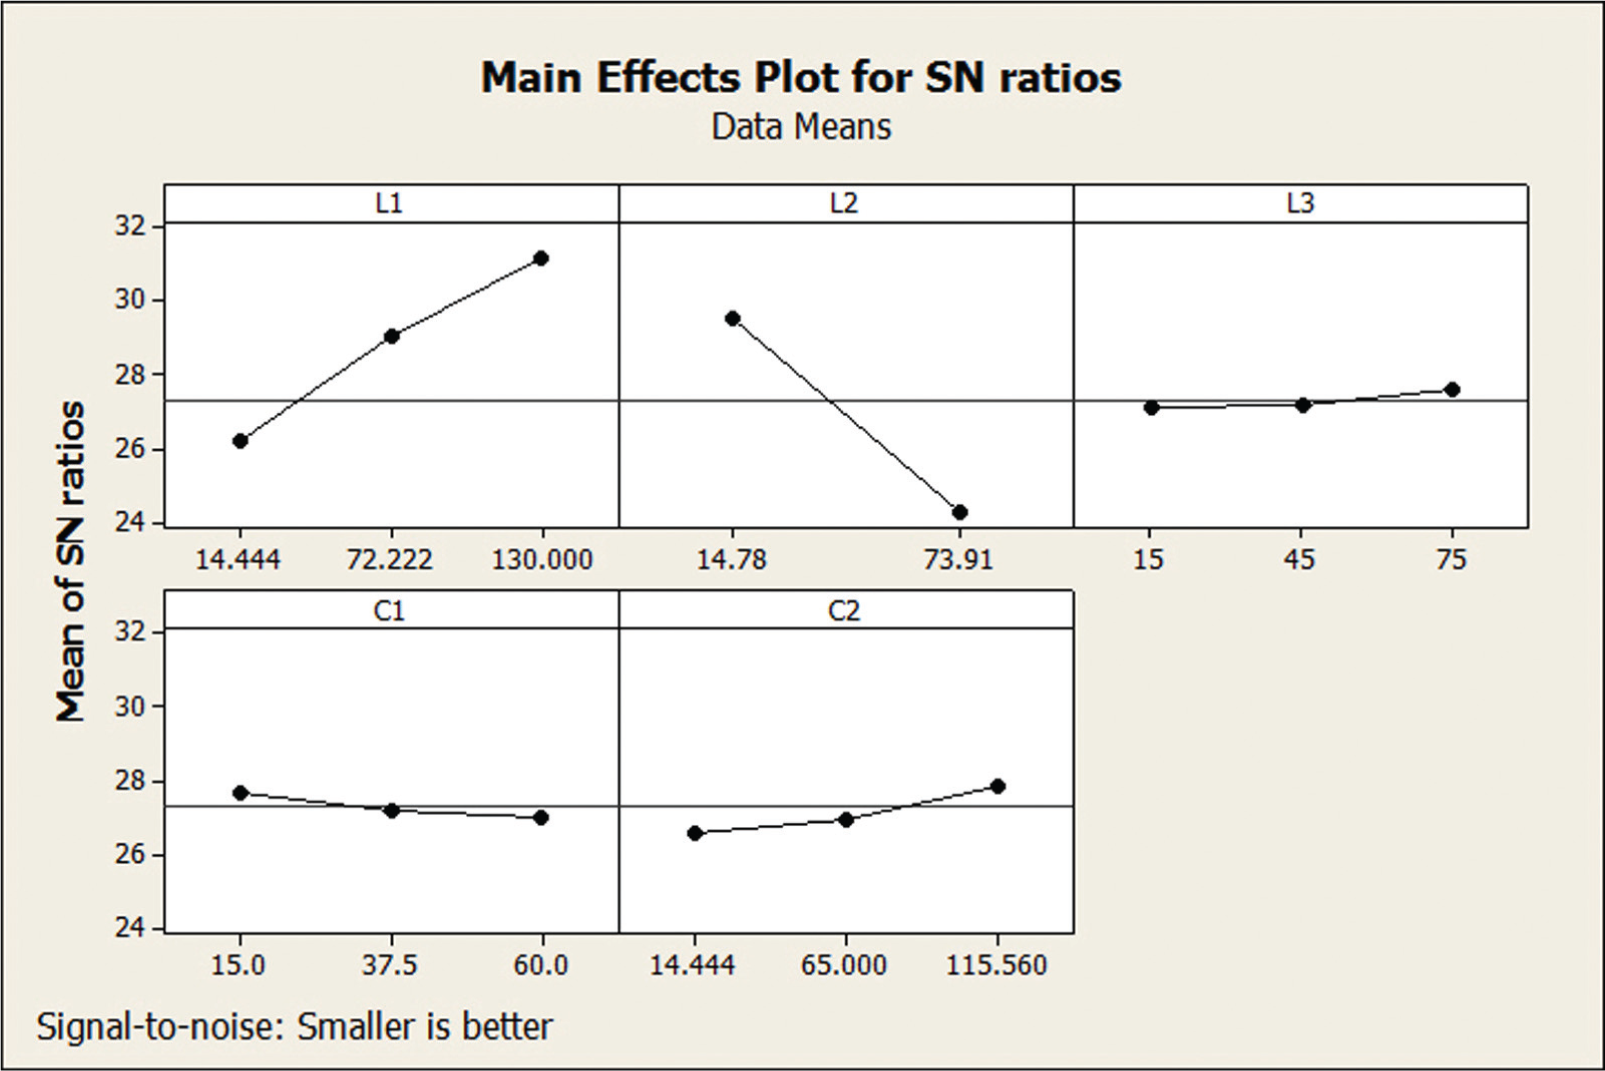
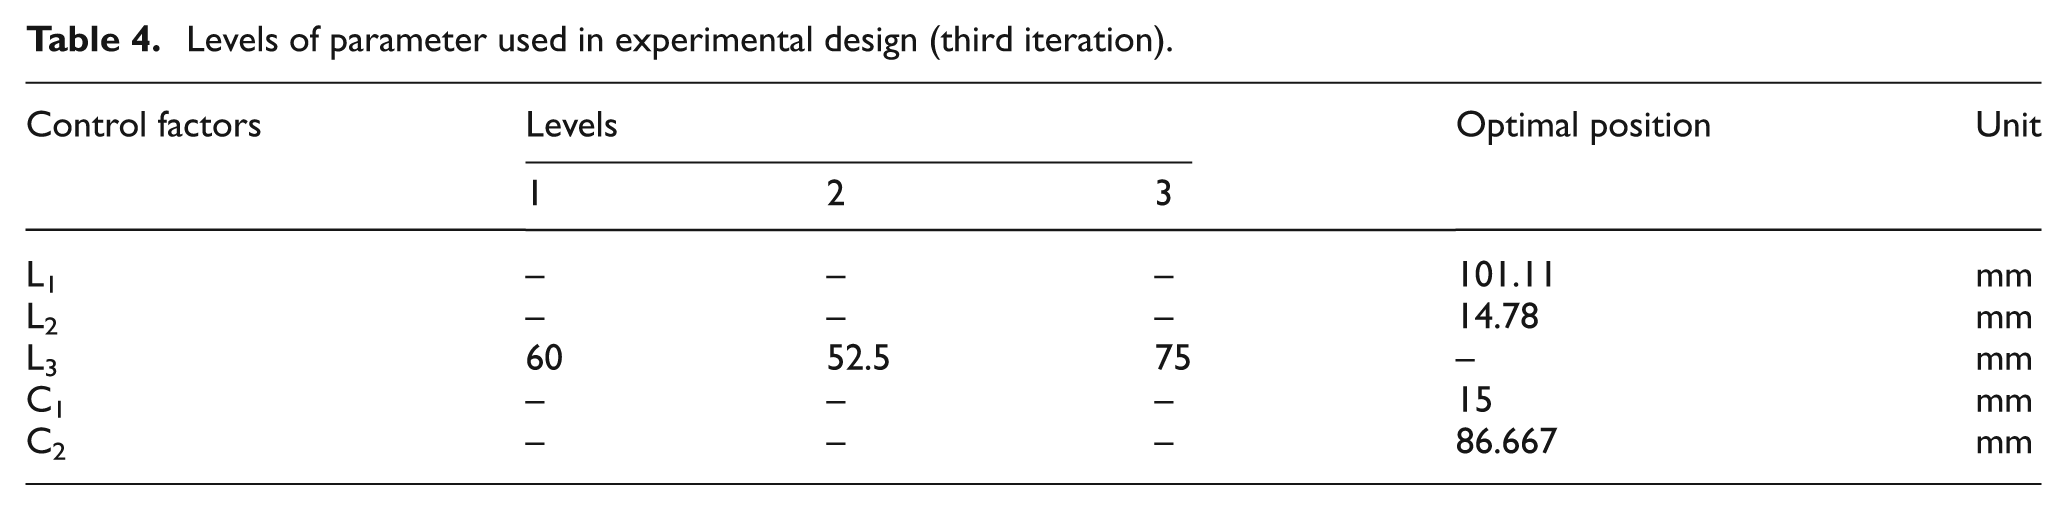
The main effect plot for data means and S/N (Figures 7 and 8) shows the influence of each parameter on the response for the second iteration of IDOE. It is observed from the graphs that L1 has significant impact on response. Also, it is predicted that less elastic deformation is obtained as C1 approaches the middle value. Hence, the optimum setting for L1 is selected as 101.11 mm. Similarly, the optimum setting for C2 is chosen as 86.66 mm. The factor C1 is not a significant factor since the prediction line is almost straight. Less deformation is predicted for the lower value of C2, and hence, the lower value of C2 is selected as the optimum value. There is a hope for improvement for the factor L3, and hence, only L3 is considered for the next iteration. The three levels of parameter which are varied in the third iteration are shown in Table 4.
Levels of parameter used in experimental design (third iteration).
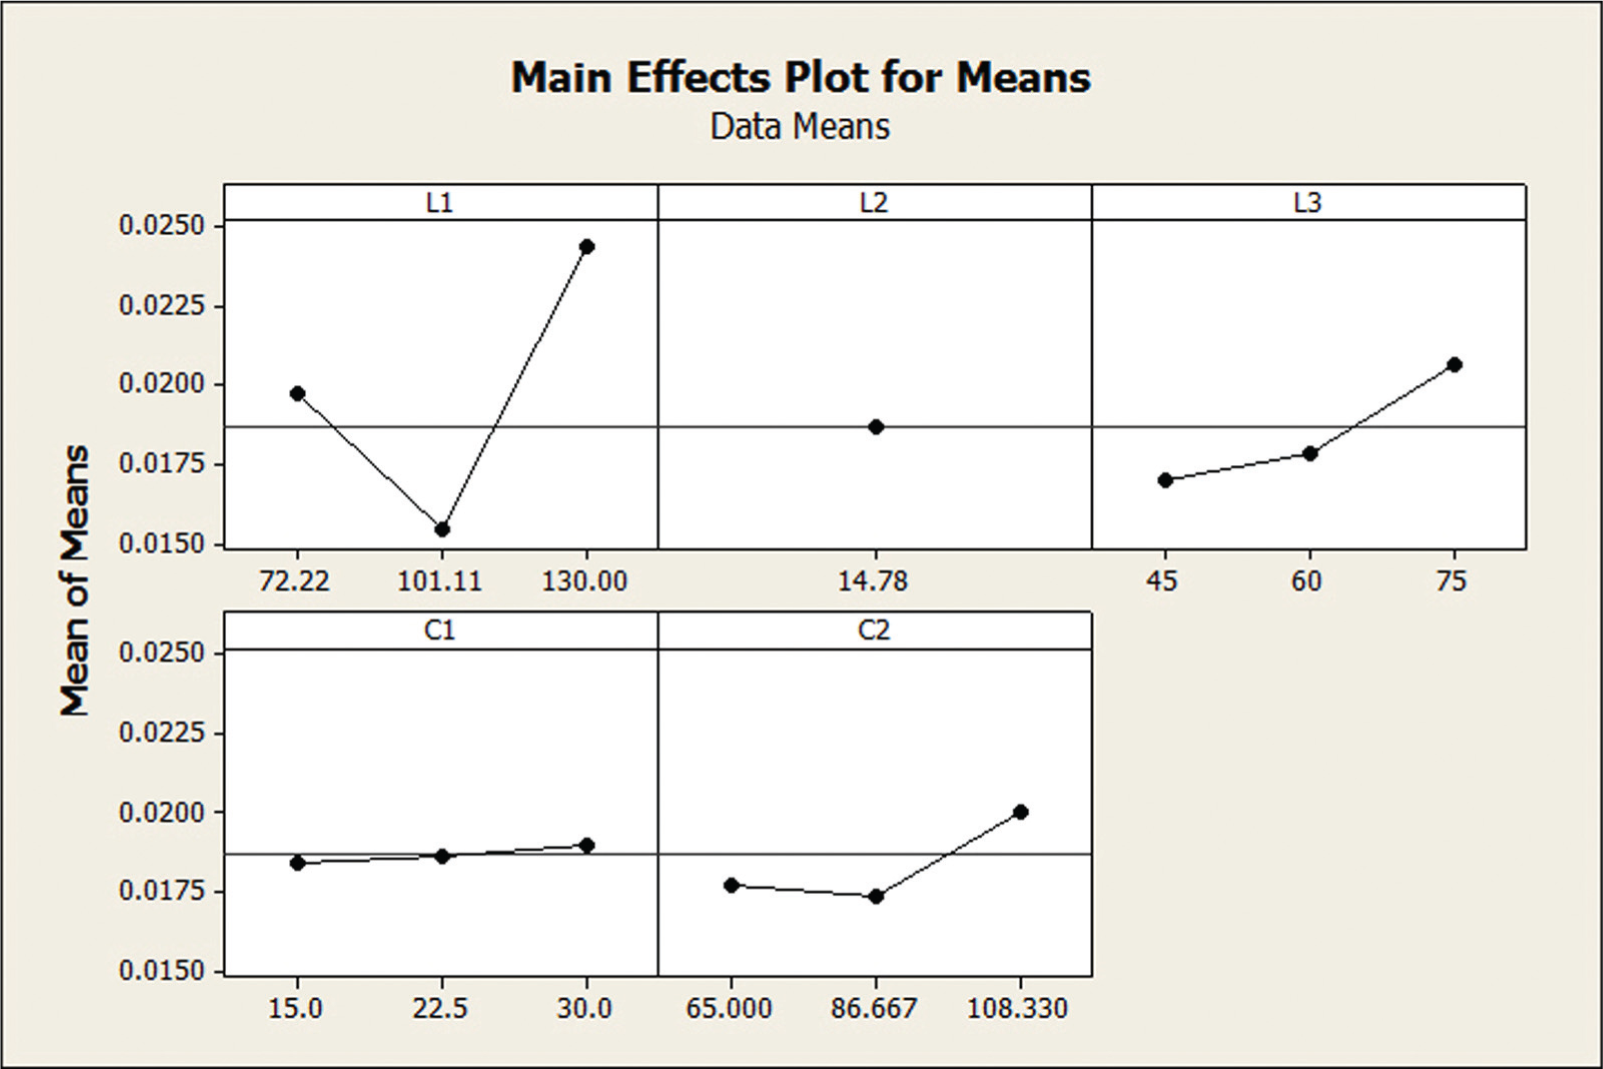
Main effect plot for means (second iteration).
Main effect plot for S/N ratios (second iteration).
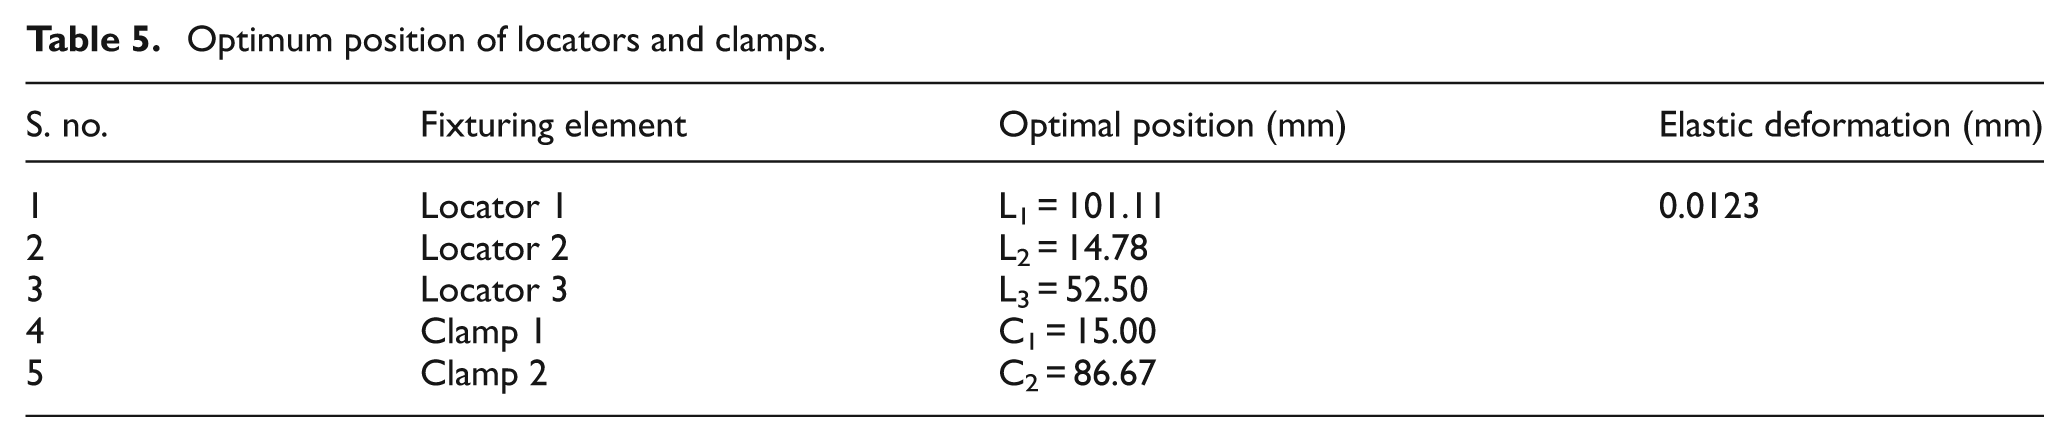
The main effect plot for the third iteration is shown in Figure 9. It is evident from the graph that the deformation is less when L3 approaches the middle value. Hence, the optimum value for L3 is obtained. The optimum settings obtained for each parameter are shown in Table 5.
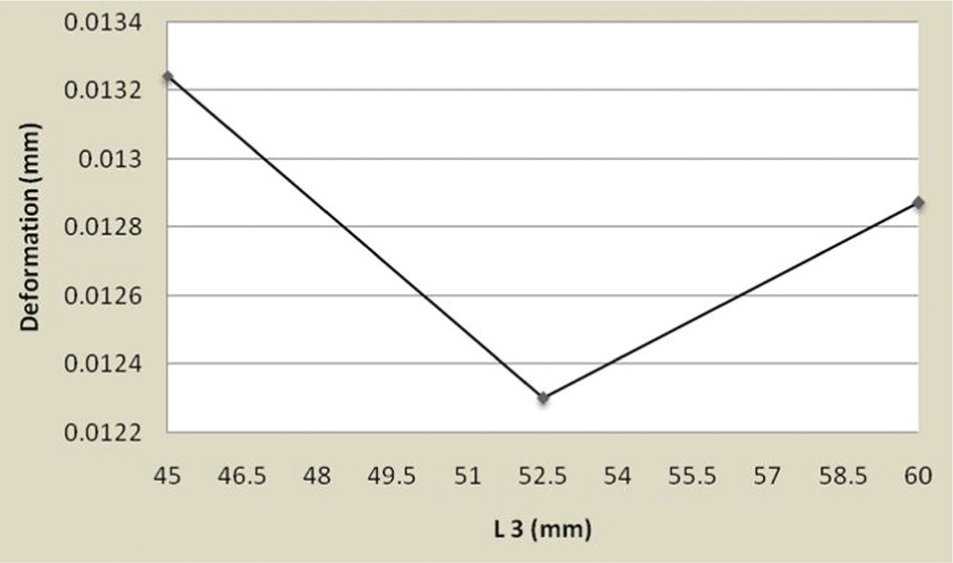
Main effect plot for L3 (third iteration).
Optimum position of locators and clamps.
The objective function value obtained in the consecutive iteration of IDOE is shown in Figure 10, and the optimum value is obtained in the third iteration of IDOE. Furthermore, the optimum objective function value obtained by the IDOE technique is compared with GA-FEM technique 4 and shown in Figure 11.
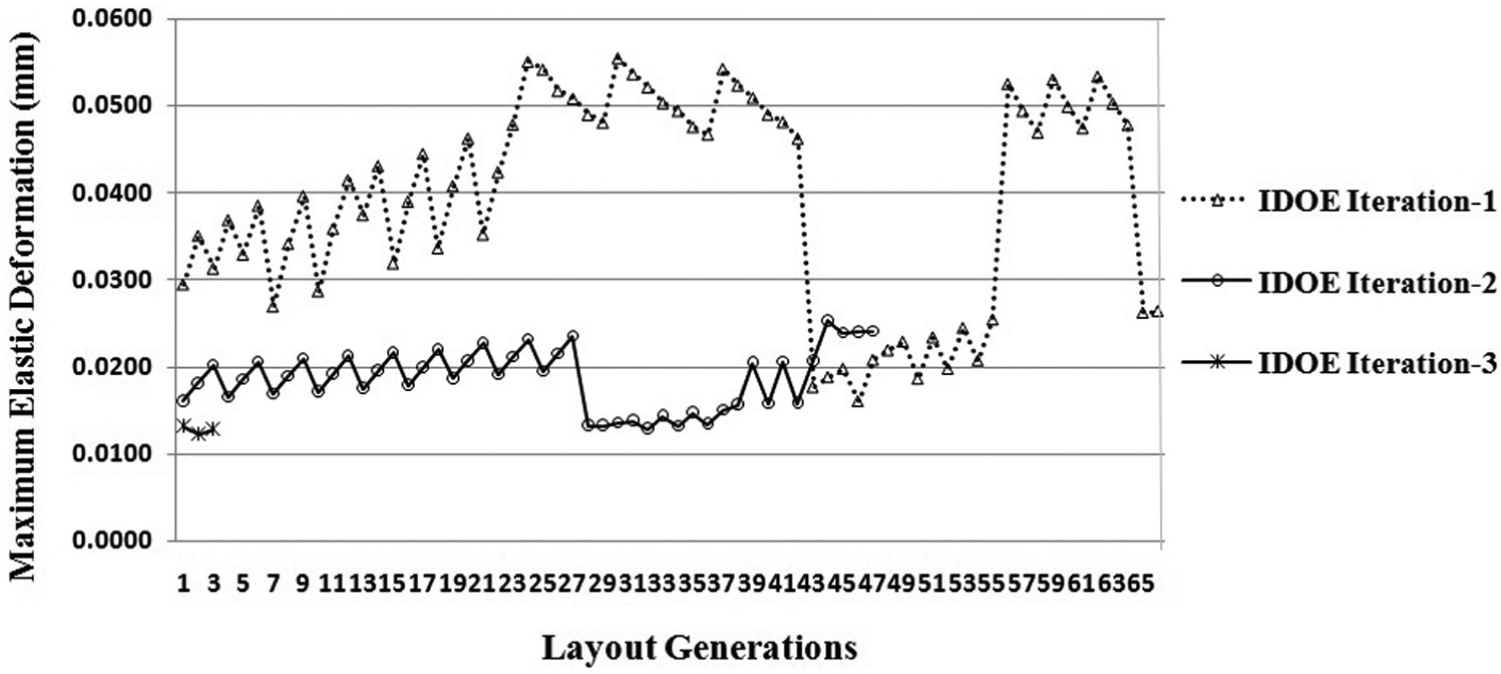
Performance of IDOE for subsequent iterations.
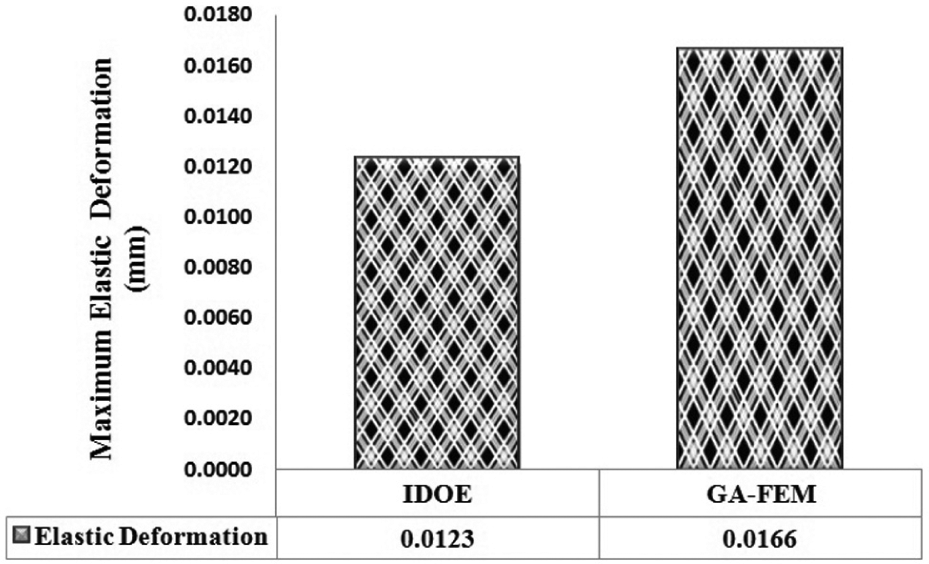
Comparison of results of optimization techniques.
ANN model
In the recent years, artificial intelligence technique finds application in all the fields of engineering. ANN is a proven technique and used to simulate complex engineering problems such as modeling, machining and control of manufacturing system to improve the quality of the product. In this work, ANN model is used to determine the dynamic behavior of the workpiece–fixture system within the range of the design parameters.
ANN in prediction of elastic deformation
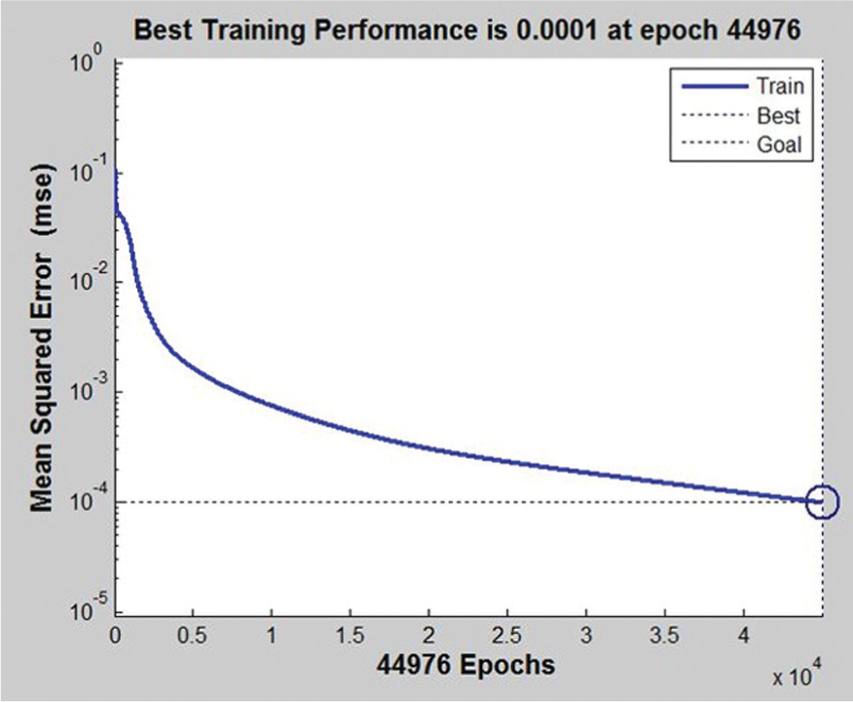
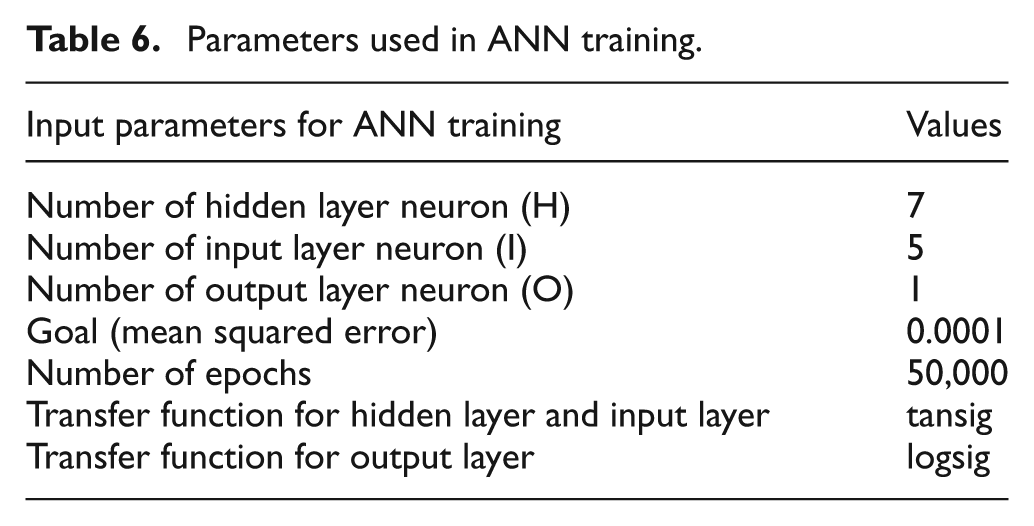
Feed-forward back-propagation neural network is used to train the network. The network consists of an input layer, an output layer and two hidden layers. Each layer consists of definite number of neurons. The number of neurons in the input layer is equal to the number of input variables. Similarly, the number of neurons in the output layer is equal to the number of response. There is no thumb rule for selecting the number of neurons for the hidden layer. In this work, the number of neurons in the hidden layer is arrived as 10, and it is obtained after performing number of trial training by varying number of neurons in the hidden layer to reduce the mean squared error value. The general architecture of the three-layer network model used is shown in Figure 12. The results obtained in the first iteration of IDOE are used for training. Figure 13 shows the training performance of the network. The training is terminated after reaching the mean squared error value of 0.0001. The parameters used in the neural network training are given in Table 6.
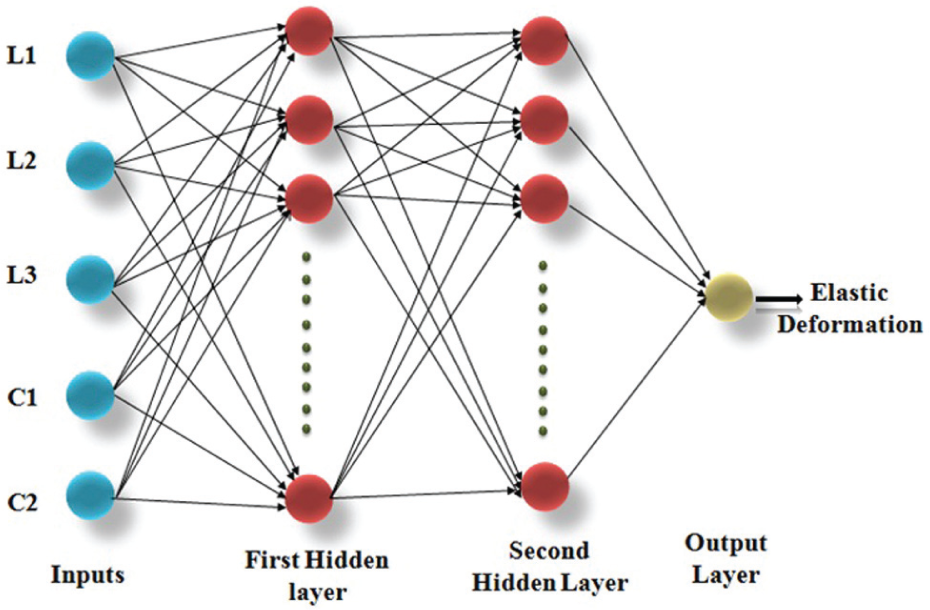
General architecture of the ANN model.
Number of iterations versus mean squared error (MSE).
Parameters used in ANN training.
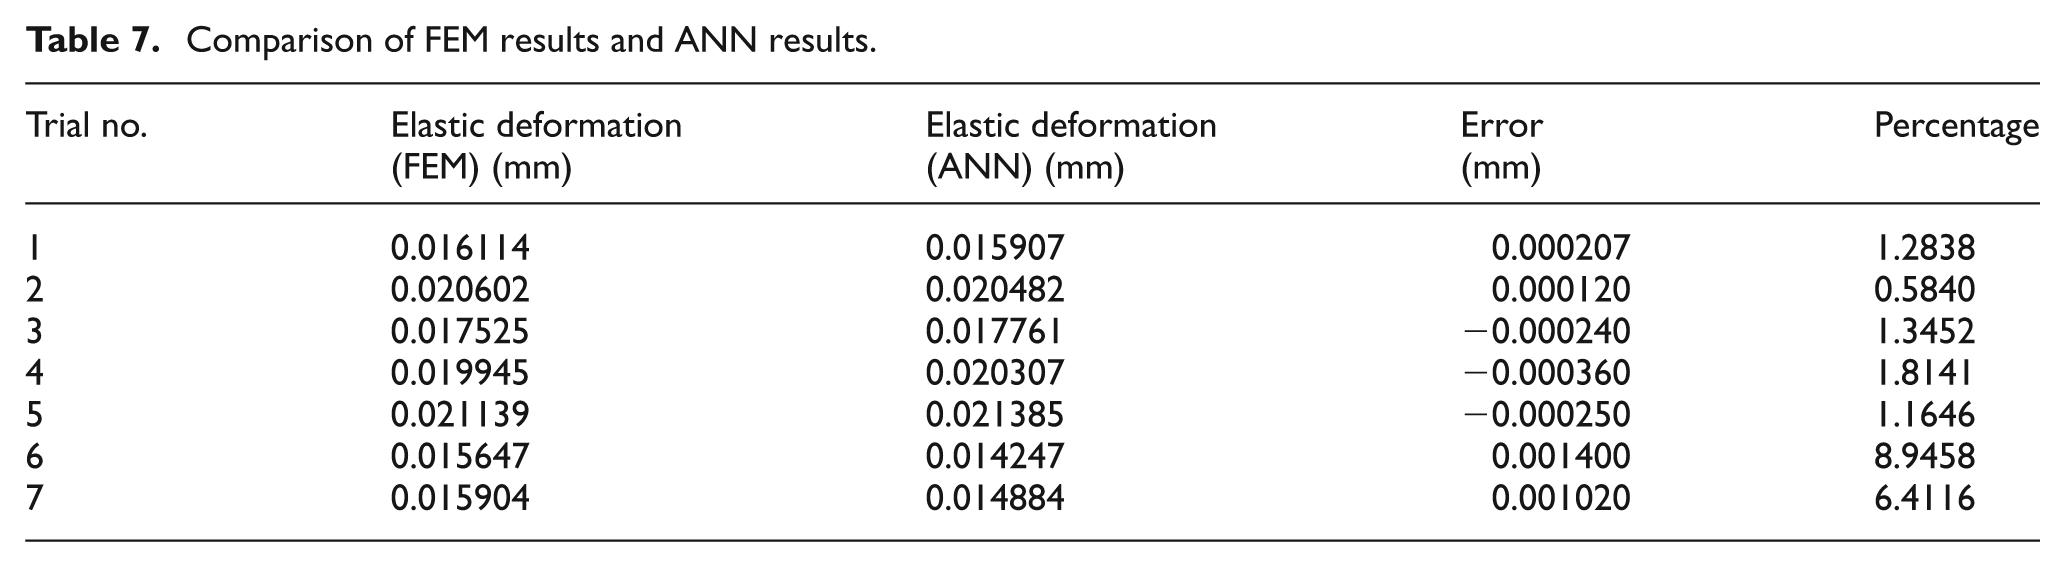
After successful training, a set of new data is used to validate the trained ANN model. The predicted values of elastic deformation using ANN are compared with FEM results and presented in Table 7. The error in prediction and its percentage with respect to FEM results are presented in the table. The error percentage lies between 1 and 9, which shows the ability of the network in computing elastic deformation of the workpiece. The performance of the ANN model over FEM in predicting elastic deformation is illustrated in Figure 14.
Comparison of FEM results and ANN results.
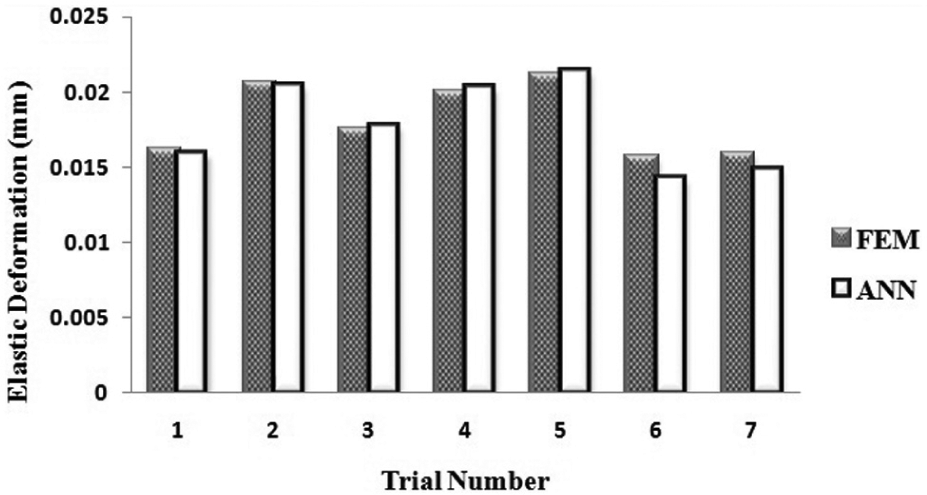
Validation of predicted model with FEM.
Implementation of ANN model with IDOE
The trained networks are successfully validated with the FEM results, and it is used with IDOE to replace FEM in predicting objective function value. FEM and ANN models show similar prediction curve for the third iteration of IDOE and are illustrated in Figure 15. Hence, it is concluded that ANN model can also be used with IDOE to replace FEM model after successful training.
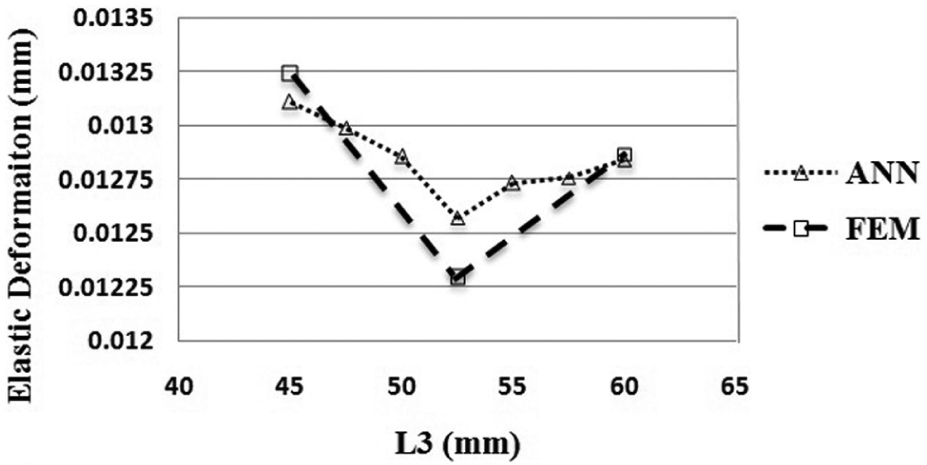
Comparison of ANN model over FEM model in predicting elastic deformation (third iteration of IDOE).
Conclusion
In this article, an integrated approach using IDOE and FEM is developed and successfully applied for fixture layout problem. The approach is a single-objective multi-constrained optimization technique. The objective is to reduce the maximum deformation of the workpiece during machining. The constraints are negative reaction force and resonance frequency. The combination of IDOE and FEM is proven to be an efficient technique and ensures efficient prediction of optimum location of locators and clamps that shows minimum deformation of the workpiece during machining. The number of experiments to be performed is extensively reduced, as the algorithm tests the experimental plan with design constraints prior in conduct of every experiment. The result shows the success of the IDOE-FEM over other techniques and it is also observed that the convergence of the proposed technique is faster. Furthermore, an ANN model is developed to predict the elastic deformation of the workpiece. The ANN model is trained using FEM results obtained in the first and second iterations of IDOE. The trained ANN model is applied in the third iteration of the IDOE and the results are compared with FEM results. The predicted results show good agreement with FEM results.
Footnotes
Declaration of conflicting interests
The author(s) declared no potential conflicts of interest with respect to the research, authorship, and/or publication of this article.
Funding
The author(s) received no financial support for the research, authorship, and/or publication of this article.