
Abstract
In the current global economy, organizations encounter problems related to resource constraints, and thus, systematic approaches for better resource utilization are a necessity. These systematic approaches investigate different resources in the organizations and attempt to specify which resources have higher importance for each business process and to what extent heterogeneous resources are utilized efficiently in the related business processes. This study presents an approach used to detect and analyze patterns of resource utilization. In this approach, the business processes and the related resources were initially identified and classified. Next, a questionnaire was designed to gather the required data for the importance and efficiency indicators. Afterward, classification methods were applied to determine which resource utilization opportunities (which specifications) correspond to different efficiency indicators and levels of importance. The results of the study reveal interesting patterns that can aid managers in obtaining deep insight into resource utilization in business processes. To demonstrate the applicability and usefulness of the proposed approach, the approach is applied to a case study of an automotive supplier.
Keywords
Introduction
Organizations carry out business processes to achieve their objectives. Successful completion of business processes requires that specified resources are effectively utilized in the processes and activities. Therefore, companies invest significant resources in acquiring and utilizing heterogeneous resources. The important concept of “resource utilization” is an area of inquiry that addresses the efficiency of resource use in business functions and processes. In the literature, different approaches have been proposed and applied to assess and improve resource utilization, and these efforts can be categorized into three groups. The first group in past research considered application of models aimed at resource utilization analysis. The second group discussed the approaches and frameworks intended to improve resource utilization. Finally, the third group focused on calculation of resource efficiency measures. These past research categories are explained in the following subsections.
Group 1: application of models for analysis of resource utilization
Certain studies have focused on developing and applying models for analytical purposes. For example, Majumdar 1 investigated differences between resource utilization patterns in telecommunications companies and paid attention to physical, infrastructure and human resources (i.e. number of switches, number of access lines and number of employees), as well as input factors and performance measures (i.e. number of local calls and number of toll calls as output factors). Next, Majumdar 1 applied three models of data envelopment analysis (DEA) to evaluate the efficiency of resource utilization in the considered companies. Gimenez-Garcia et al. 2 focused on resource utilization in multi-unit networked organizations, and in this effort, they applied a model to specify additional resources for inefficient units related to reallocation of these resources to more efficient units and suggested new improved goals for efficient units. Zahraie and Tavakolan 3 developed a stochastic multi-objective optimization model to support the balance among cost, time and resource utilization in project management and applied the non-dominated sorting genetic algorithm (NSGA-II) to solve the optimization model for two case studies. Leung and Chan 4 reported on the production planning function in a number of companies in North America and China; they suggested a model for maximization of physical resources utilization and tested the model with real data to ensure the effectiveness of the model. Mar-Molinero et al. 5 proposed a centralized resource allocation model to find an optimal solution to increase resource utilization and tested the model with real data from Spanish schools. Gong and Tang 6 presented an optimization model for renewable resource utilization in reverse supply chains that involves constraints on price and investment. Patrick and Puterman 7 developed a method to decrease waiting time and increase resource utilization. For this purpose, an optimization model was formulated and solved to minimize the unused capacity. Cheng et al. 8 examined four resource service scheduling approaches in a framework that considered energy carrier consumption, cost and risk in cloud manufacturing systems. Tao et al. 9 considered revenue, time and reliability as important aspects of service-oriented manufacturing systems and proposed a coordination method to increase resource utilization of the service transaction chains. In addition, Davidson and Williams 10 investigated resource usage optimization in two industry cases.
Group 2: development of frameworks for efficient resource utilization
Certain research has proposed approaches and frameworks for resources utilization. For example, Orabi et al. 11 proposed an integrated framework for resource utilization and optimization that aids managers in setting optimal resource allocation for projects. The framework was applied to a case to evaluate the performance of the proposed framework. Cheng and Yan 12 developed an approach for optimal resource utilization to increase such performance measures as production rate. To demonstrate the applicability of the proposed approach, it was applied to a case. Lam et al. 13 developed a knowledge-based performance measurement system (KPMS) to evaluate resource allocation and to improve physical resources utilization. Kandil and El-Rayes 14 proposed a framework for efficient resource utilization in large-scale construction projects. Kyobe 15 focused on information technology (IT) resource utilization in small-to-medium-sized (SMEs) companies. In this research, factor analysis was performed using data from 70 SMEs to specify the major challenges of efficient IT resource utilization. The results showed that “lack of knowledge and skill” is an important challenge in efficient IT resource utilization.
Group 3: calculation of resource utilization efficiency measures
A number of studies presented and calculated measures for resource utilization efficiency. For example, Miller and Ross 16 investigated differences in the efficiency of resource utilization inside a firm and calculated managerial, scale and programmatic efficiency measures to evaluate the performance of organizational units and to detect improvement opportunities. This approach provides a foundation on which to present the appropriate attitudes toward firm resources at the strategic level. Both the efficiency and managerial performance viewpoints on firm resources were discussed simultaneously at the strategic level. Yan and Du 17 analyzed human resources utilization in the process of enterprise information rollout and proposed a number of measures to utilize both external and internal human resources. Brandi et al. 18 developed a method to generate estimators for resource consumption that can be integrated with the current processes of IT service management. Vanhoucke and Debels 19 investigated the effects of variable activity durations under fixed work, the possibility of activity pre-emption and the use of fast tracking for lead time and resource utilization of a project and used a data set to evaluate the effects of the assumptions on project scheduling quality. To provide better insight, a summary of past research, main contributions and identified research gaps are illustrated in Table 1.
Main contributions of the past research.
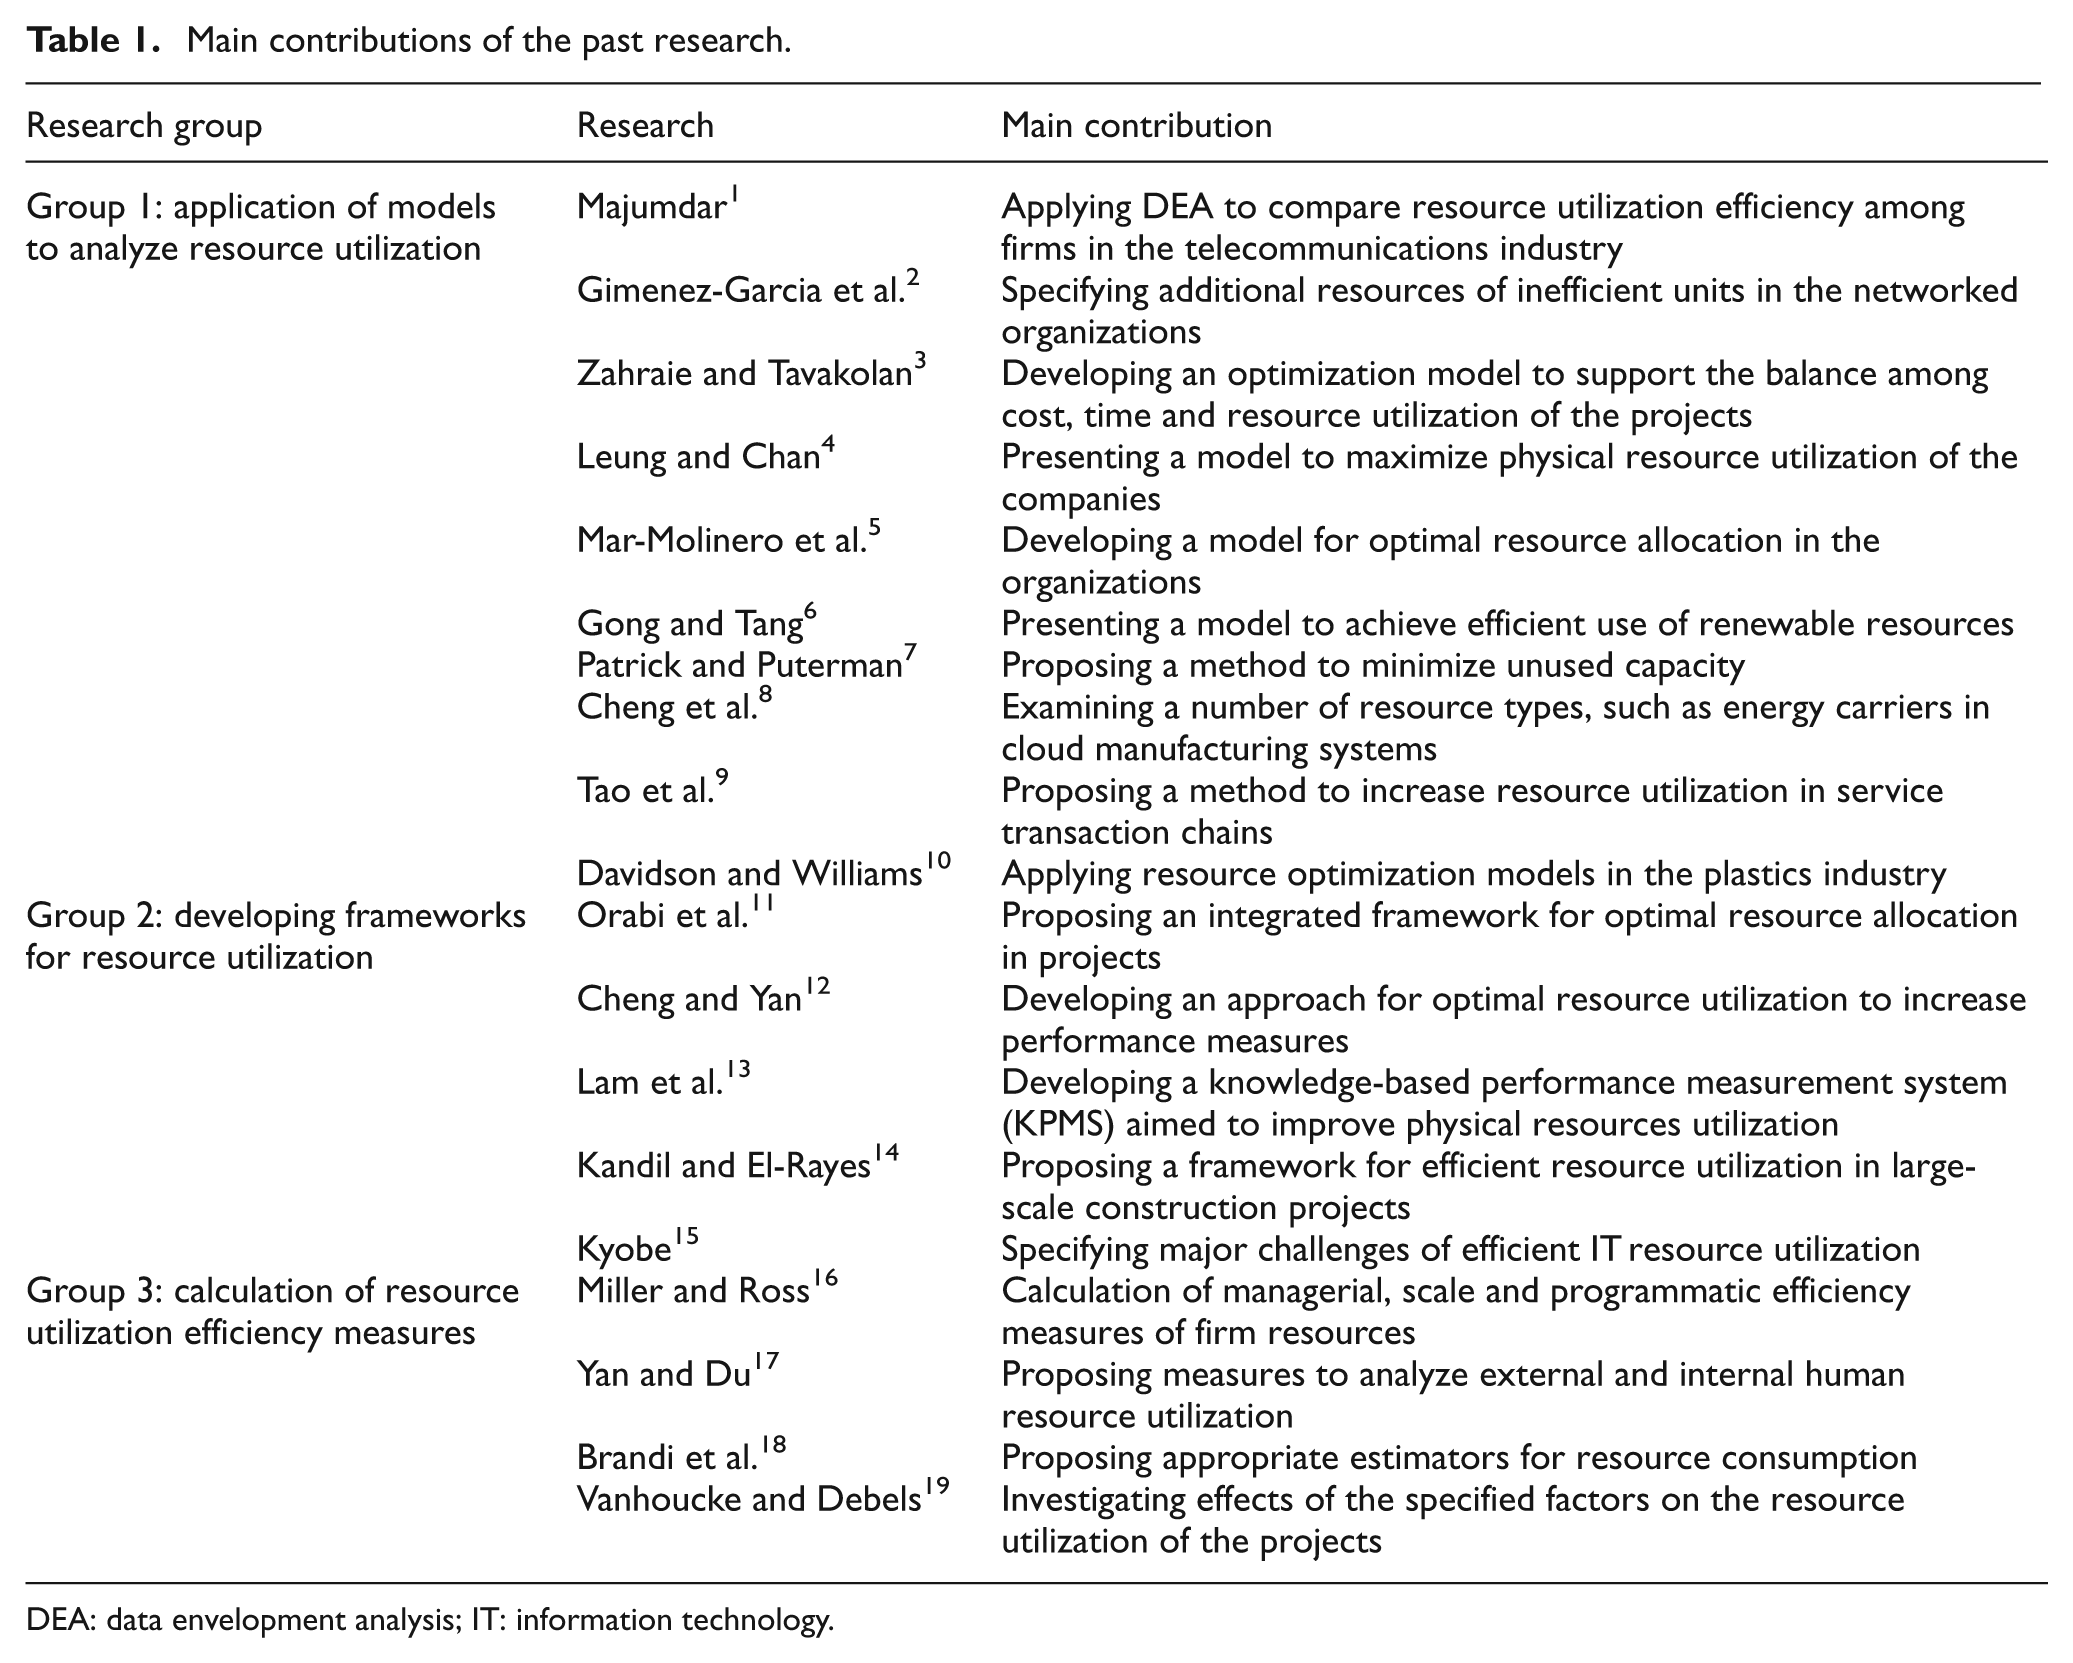
DEA: data envelopment analysis; IT: information technology.
Resource utilization is a multi-dimensional and complicated issue. In previous research, approaches and models were developed to assess the current state of resource utilization and to suggest improvement actions intended to increase resource utilization capability. After considering the main contributions of past research, the following research gaps were identified:
Past research in the first group did not develop models that can present profound insight on resource utilization as appropriate for their classification.
Research in the second group did not present an approach to investigate resource efficiency in the business processes of an organization.
Past research in the third group did not perform intelligent analysis on the resource efficiency measures.
These research gaps indicate that it is necessary to consider various analyzable aspects of resource utilization in business processes to enable managers to accurately evaluate resource-utilization-related data and information. For this purpose, it is useful to apply different data-analysis and data-mining techniques to recognize patterns in resource utilization prospects.
Despite the importance of pattern recognition and analysis in resource utilization, research on this subject has not yet presented an approach for pattern recognition on resource utilization issues. Therefore, the objectives and main contributions of this article are as follows:
To propose a process-based approach for pattern recognition in resource utilization issues;
To provide the ability to prioritize resource utilization opportunities (RUOs) for improvement plans;
To obtain association rules for RUOs aimed at analysis of importance and efficiency indicators (EIs);
To identify affinities and relationships between business processes and resources;
To aid managers in modifying the necessary business process and resource classifications.
The structure of this article is described as follows. Following the introduction, section “Proposed approach for pattern recognition” describes the proposed approach for pattern recognition. Section “Case study” provides a case study description, including business process and resource identification and classification, data gathering, modeling and analysis. The results and discussion for this study are presented in section “Results and discussion,” and finally, conclusions are stated in section “Conclusion.”
Proposed approach for pattern recognition
In this research, an approach was proposed for recognizing applicable and useful patterns of resource utilization. The proposed approach involves a wide range of activities from process and resource identification to data gathering, modeling and analysis. The general stages of the approach are explained in the following subsections.
Identification of processes and related resources
Initially, it is necessary to identify business processes and related resources. This information can be obtained from different sources depending on the maturity level of the organizations.
Suppose that an organization has implemented process-based systems, that is, the ISO 9001 quality management system, or has initiated business process re-engineering (BPR) projects. In this case, valuable and valid documents exist that specify the business processes of the organizations and the resources allocated to them. Therefore, “document review” is a suitable approach used to acquire comprehensive insight on business processes and related resources.
It is possible to use reference frameworks, that is, International Automotive Task Force (IATF), APQC’s process classification framework (PCF) and Enhanced Telecom Operations Map (eTOM), to obtain insight on business processes and related resources.
In addition, information on business processes and resources can be obtained by holding meetings with managers and process owners. It is preferable to use structured questions to acquire the necessary information. Examples of the typical questions are as follows: What are the main business functions of the organization? What are the main business processes for each business function? Which resources are used to perform each business process?
Each business process uses heterogeneous resources to perform activities and convert inputs to outputs. For example, the “production and assembly” process uses such resources as “equipment,” “energy carriers,” “production location,” “documents” and “skill.” Each pair consisting of a process and one of the related resources constitutes a RUO. In this example (production and assembly, equipment), (production and assembly, energy carriers), (production and assembly, production location), and so on indicate RUOs that represent the basic elements for analysis and pattern recognition.
Business process and resource classification
At this stage, the identified processes and resources are classified in a hierarchical manner, including “process group” and “resource group” at the top level and “process” and “resource” at the lower level. Classification of processes and resources can be performed using different approaches:
Similar companies. The main business processes and resources of the organizations in a business sector are somewhat similar. Therefore, information on similar organizations is a useful source for classifying business processes and related resources.
Standard frameworks. Each standard business process framework has its own classification that provides a basis for further classification.
Organizations-related classification. Usually, each organization has its own classification for business processes and resources that can be used for analytical purposes.
Suitable classification of processes and resources provide a basis for insightful analysis that can aid managers in identifying and prioritizing improvement plans.
Data gathering
At this step, the required data on resource utilization are gathered for analysis. For this purpose, it is necessary to consider that each resource has a specific importance in each process and can be efficiently or non-efficiently utilized by the related business process in the framework of an RUO. Therefore, for each RUO, two indicators were defined as follows:
Importance indicator (II). This indicator presents the importance of the resource for correct performance of the business process.
EI. This indicator measures the ability of a process to efficiently utilize a specific resource to realize the desired output.
To acquire the appropriate insight about II and EI of RUOs, a questionnaire was designed to assess the importance and efficiency of resource utilization. A section of the questionnaire was dedicated to each business process. For instance, consider BPi as a business process that utilizes a set of resources, that is, (R1, R2,..., Rj, …, Rn). Therefore, (BPi, R1, BPi, R2,..., BPi, Rj,..., BPi, Rn) constitutes RUOs related to the BPi. The related section of this process (BPi) includes two questions for each RUO as follows:
How much importance does “resource j (Rj)” have in performing the “business process i (BPi)”?
What is the efficiency of utilizing “resource j (Rj)” in the “business process i (BPi)”?
Answers to the above questions represent II and EI, respectively, and are rated on a 5-point scale: 5 (very high), 4 (high), 3 (average), 2 (low) and 1 (very low).
Modeling and analysis
This stage is dedicated to the modeling and analysis used to obtain multi-dimensional insight into resource utilization in the RUOs. Each RUO contains such features as “business process group,” “business process,” “resource group” and “resource.” Managers tend to have knowledge of the relationships between features of RUOs and different levels of importance and EIs. For example, managers and decision makers want to know which business process groups use resources more effectively and which resource groups have higher importance in performing business processes. For this purpose, such data-mining techniques as clustering, classification and association rule mining can be applied to yield useful analysis.
It is necessary to mention that the proposed approach was extracted from CRoss-Industry Standard Process for Data Mining (CRISP-DM), 20 which is a well-known data-mining algorithm, that includes six phases described as follows:
Phase 1: business understanding—understanding the requirements and objectives of the data-mining process;
Phase 2: data understanding—data gathering and obtaining basic insight on the data;
Phase 3: data preparation—preparing the datasets for analytical purposes;
Phase 4: modeling—applying the appropriate modeling techniques;
Phase 5: evaluation—assessing the results and comparing findings with the initial business objectives;
Phase 6: deployment—using the data-mining findings and results.
The first stage (Identification of processes and utilized resources) and the second stage (Business process and resource classification) of the proposed approach were adapted from the first phase of CRISP-DM (Business understanding). The third stage (Data gathering) was extracted from the second and third phases of CRISP-DM (Data understanding and data preparation). Finally, the fourth stage (Modeling and analysis) was adapted from the fourth, fifth and sixth phases of CRISP-DM (Modeling, evaluation and deployment). Therefore, the proposed approach was adapted from CRISP-DM in accordance with the nature and requirements of the resource utilization analysis.
Case study
In this section, the proposed approach was applied in an automotive supplier to recognize valuable patterns of resource utilization.
Identification of processes and utilized resources of the automotive supplier
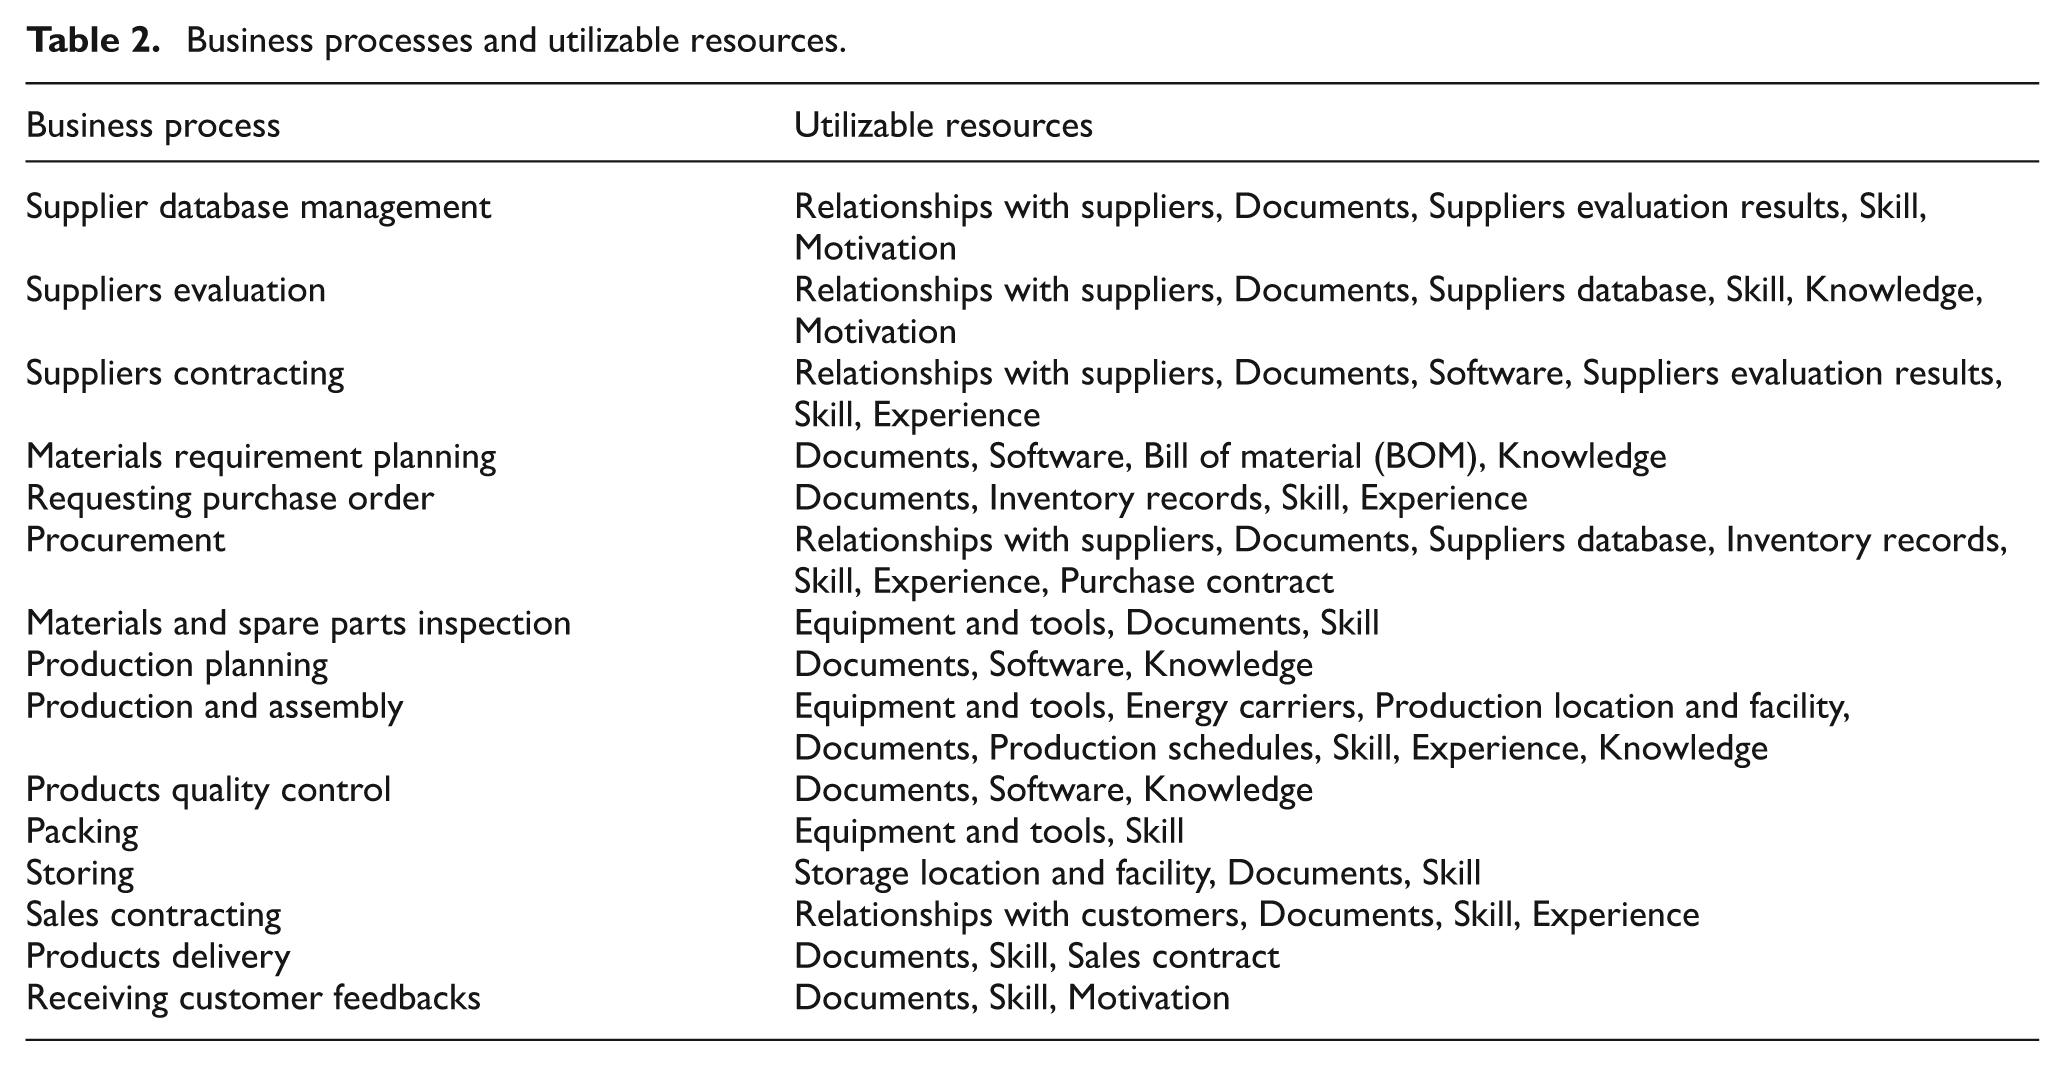
Initially, three meetings were held to acquire basic insight into the organization (the considered automotive supplier). The scope of the study was defined, and the 15 business processes were specified for resource utilization analysis during these meetings. Next, the main utilizable resources were identified for each process. The processes and their related resources are shown in Table 2.
Business processes and utilizable resources.
Business process and resource classification of the automotive supplier
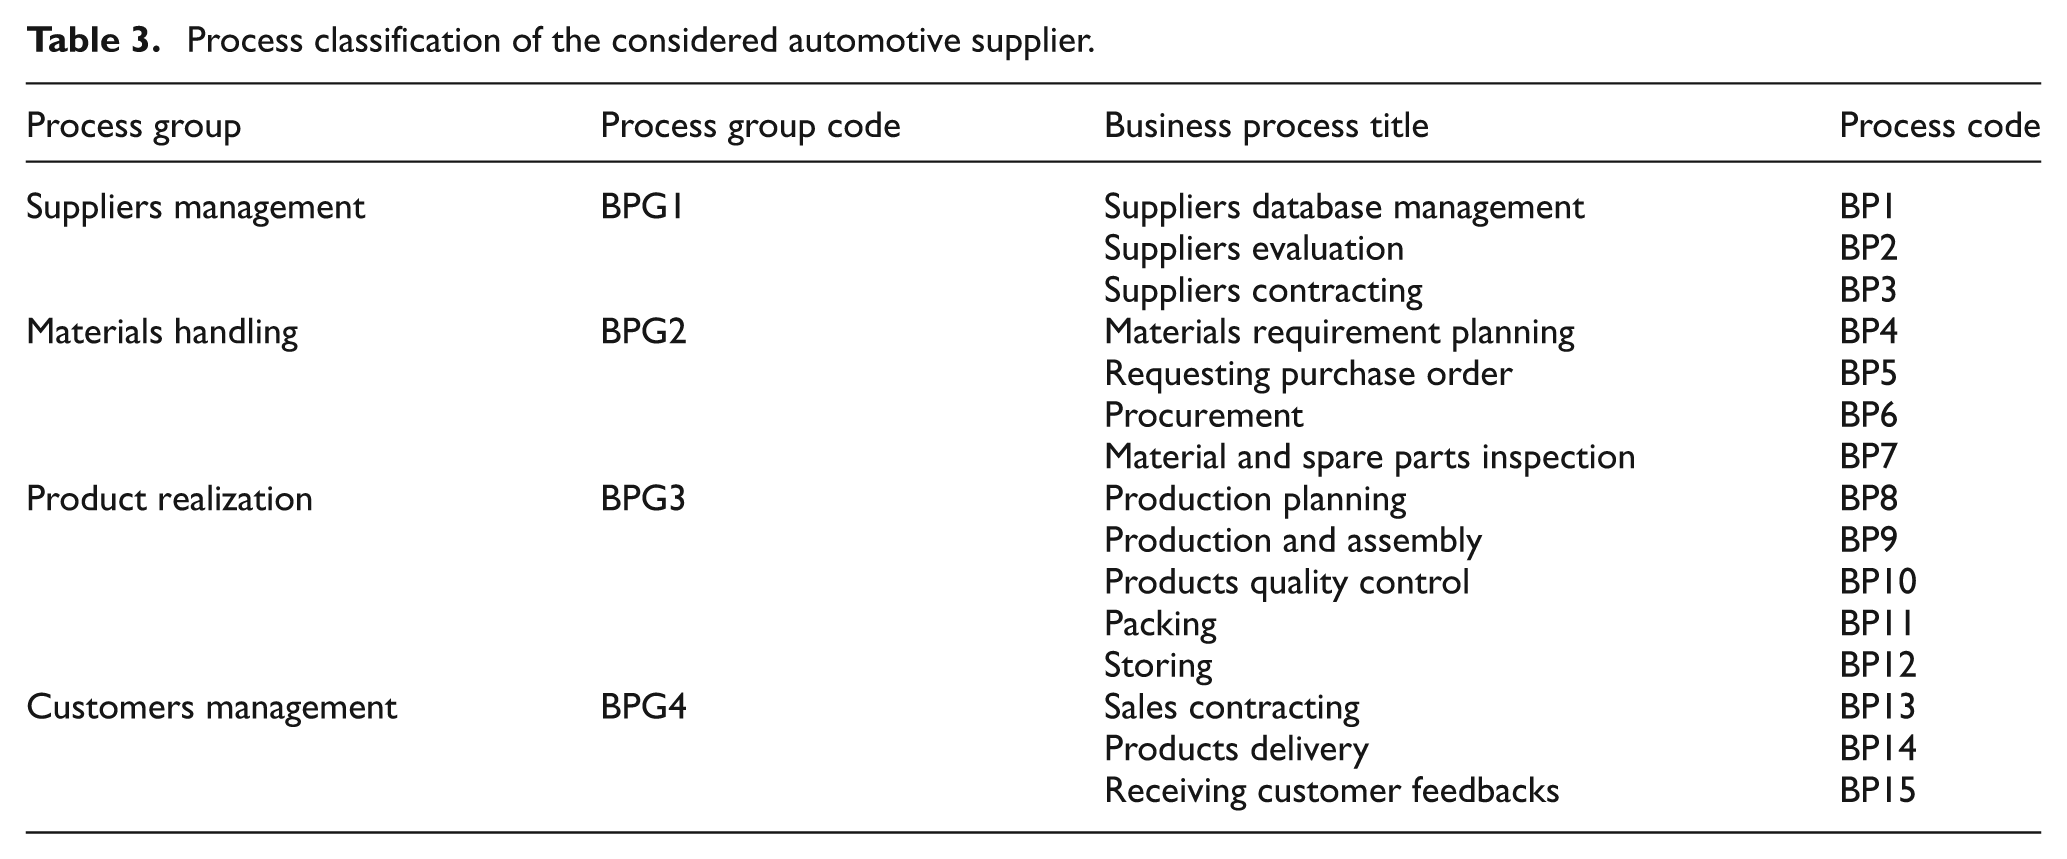
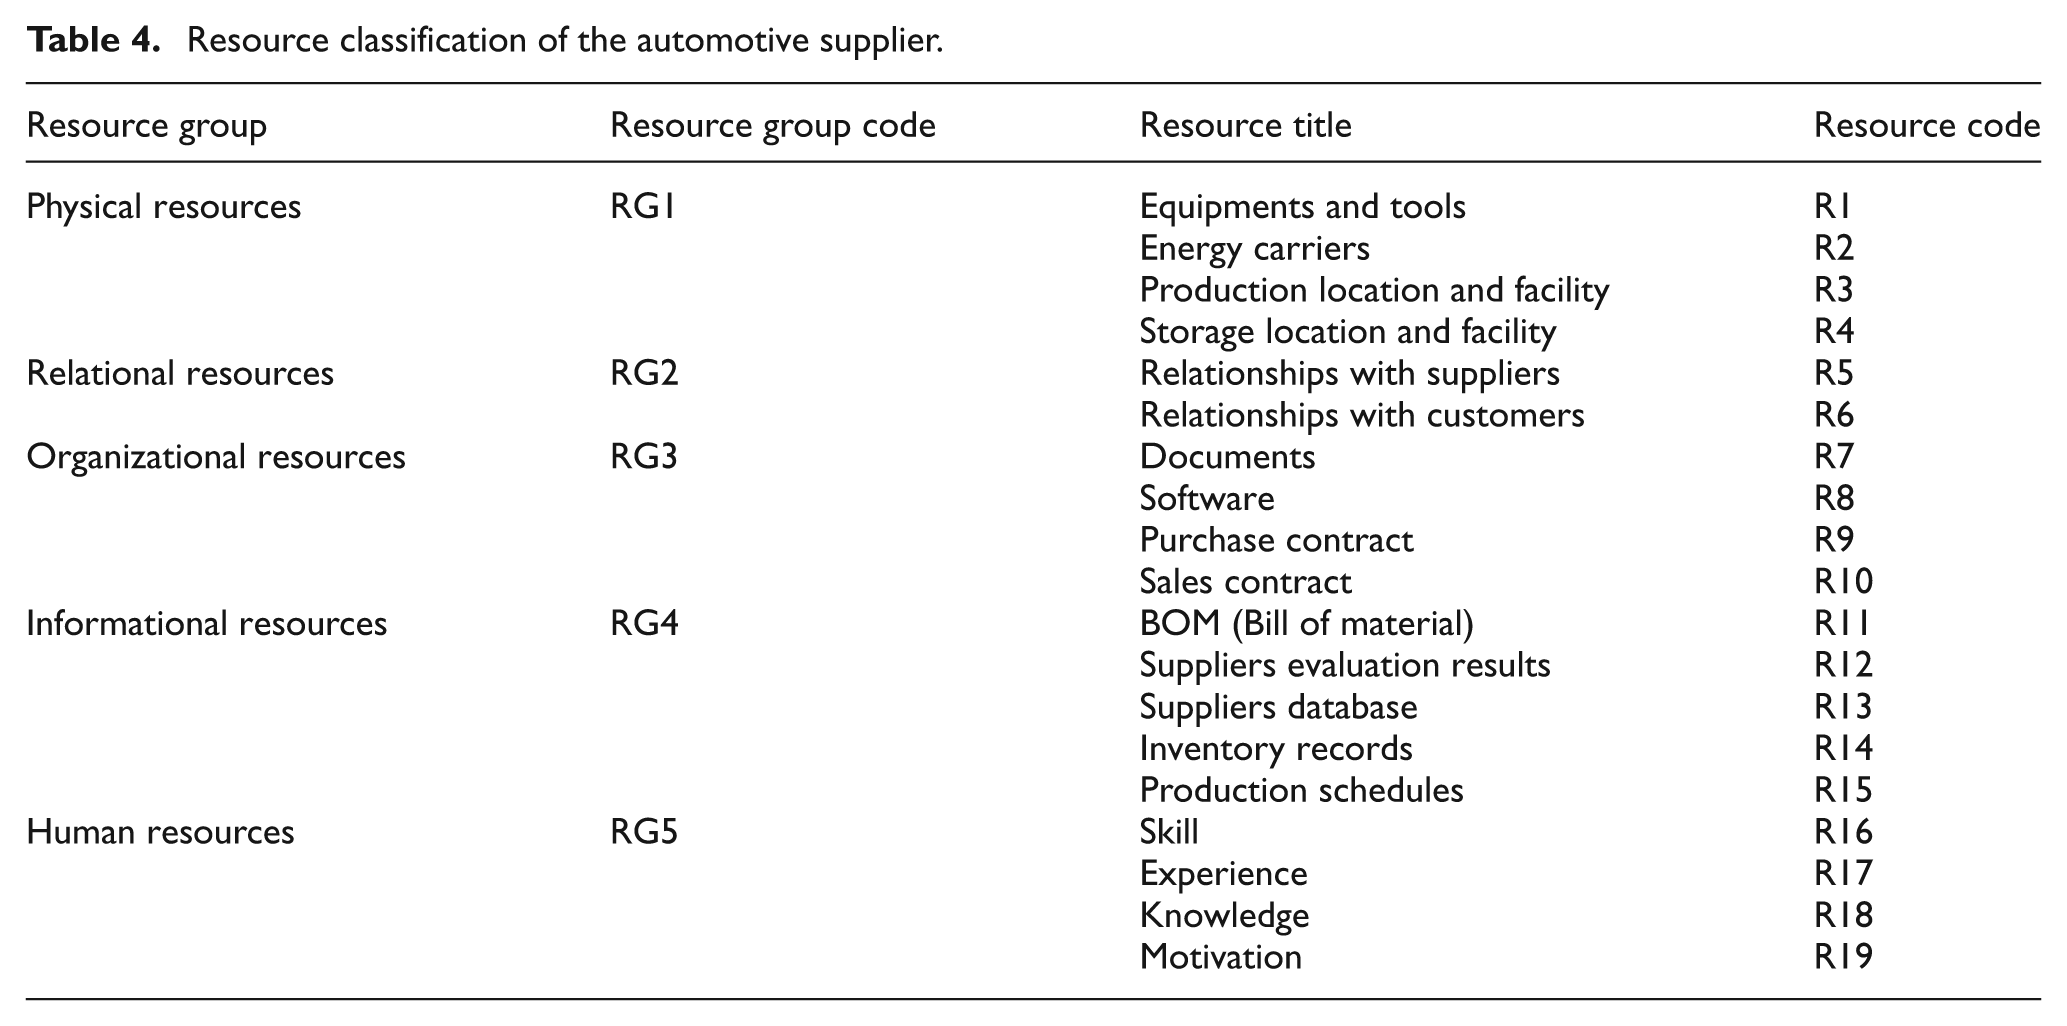
By considering functions of each process, the similarities among business processes and the process owner’s opinions, the business processes were classified as shown in Table 3. In this classification, processes were categorized into four main process groups. In addition, based on the resource type, the processes were categorized into resource groups as shown in Table 4.
Process classification of the considered automotive supplier.
Resource classification of the automotive supplier.
Data gathering on resource utilization in the business processes of the automotive supplier
In this step, the data fields in the problem are presented. “Business process,” “business process group,” “resource,” “resource group,” “importance indicator” and “efficiency indicator” are the main fields of the problem, and descriptions and abbreviations of the data fields are presented in Table 5.
Abbreviations and explanations of the data fields.
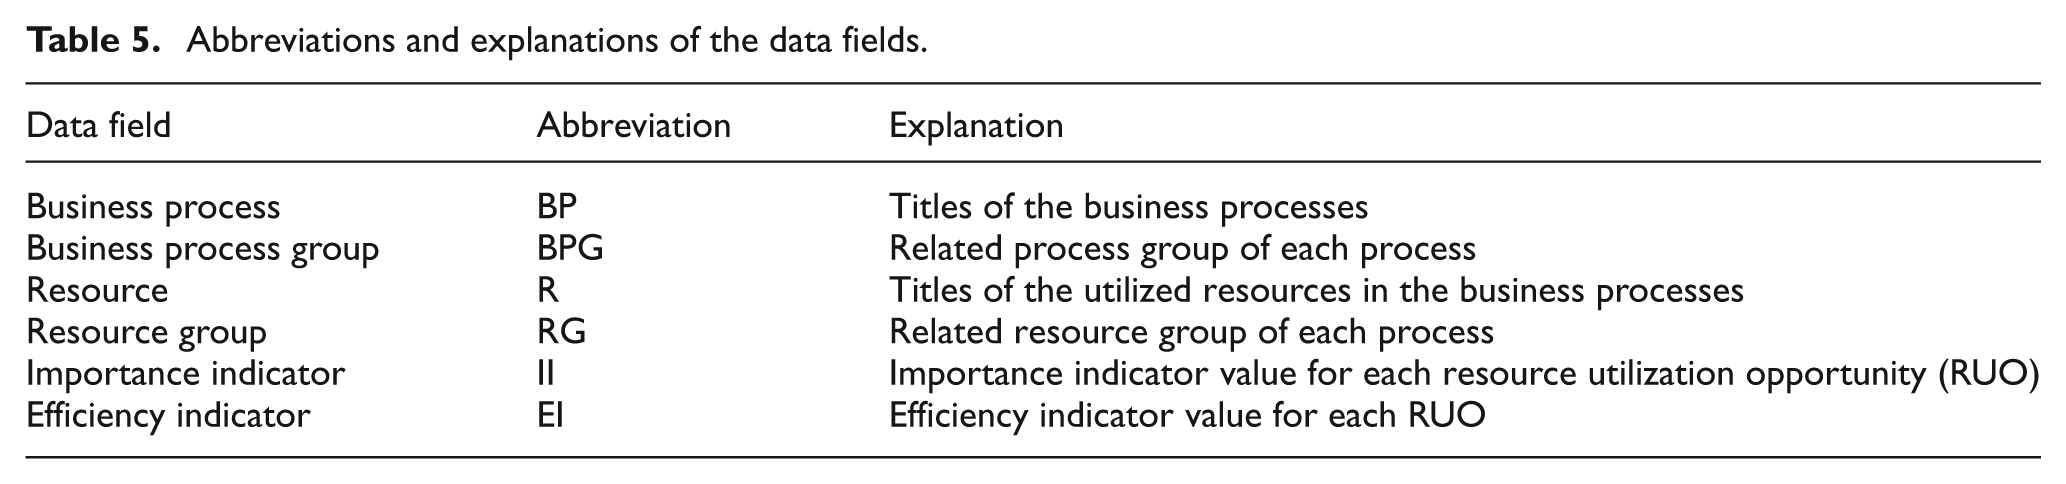
It is necessary to mention that the BP, BPG, R and RG fields were identified via document review, benchmarking and meetings, whereas the II and EI values were obtained from the questionnaire.
Modeling and analysis of the RUOs in the automotive supplier
In this section, modeling and analysis of the RUOs was performed to acquire valuable insight and to detect patterns of resource utilization. The main considered issue in section “Modeling and analysis” is revisited to find relationships between two sets of data fields such that one set is the RUO features (i.e. process group, process, resource group and resource) and the other set is the values of the importance and EIs. For this purpose, classification and regression tree (CART, a useful classification algorithm) was applied to obtain a deep overview of the importance and efficiency of resource utilization. This approach provides the possibility of recognizing related features of RUOs for each level of importance and efficiency. Each classification algorithm requires specification of input and target variables to identify the relationships between the input and target variables such that using values of the input variables, it is possible to approximate values of the target variable.
Classification algorithms create decision trees to present relationships between the input and target variables. Each decision tree presents association rules in “if-then” form, that is, “if A, then B,” including two elements. The first element (A) and second element (B) are referred to as the “antecedent” and “consequent” of the rule, respectively. The “antecedent” and “consequent” terms of the rules are related to the input and target variables, respectively. Usually, many rules are extracted from application of the CART classification algorithm. To obtain valuable and meaningful analysis, it is necessary to select the most appropriate and useful rules. “Support” and “confidence” are two important measures that can be used for rule selection. The “support” measure reveals the extent to which a condition was applied to the records (RUOs, in this study). For example, support (A) and support (B) are support measures for terms “A” and “B,” respectively. For rule “if A, then B,” the support measure is equal to the support (A), and the confidence measure is equal to the support (B)/support (A). Minimum thresholds must be supplied for support and confidence measures to select the appropriate rules from the obtained rules.
In this study, the thresholds for “support” and “confidence” measures were set as 5% and 60%, respectively. Therefore, the extracted rules were set such that their support and confidence measures were greater than the specified thresholds (5% for support and 60% for confidence) and were chosen as useful rules for additional analysis and investigation. A support of 5% means that the frequency of the considered rule is in an acceptable range. In addition, a confidence of 60% means that the mentioned conditions in the investigated rule have usually occurred.
Modeling and analysis were performed from two viewpoints; in the first viewpoint, only process and resource groups were considered. Therefore, this perspective was known as the “general” viewpoint. In addition, for the second viewpoint, processes and resources were investigated, and this perspective was known as the “detailed” viewpoint.
Modeling and analysis from a general viewpoint
In this section, a general analysis was considered with “business process group” (BPG) and “resource group” (RG) as input variables. The CART classification algorithm was separately run for two “importance indicator” (II) and “efficiency indicator” (EI) target variables. The rules with “support” and “confidence” measures greater than thresholds are stated in Table 6.
Extracted rules in general viewpoint with their support and confidence measures.
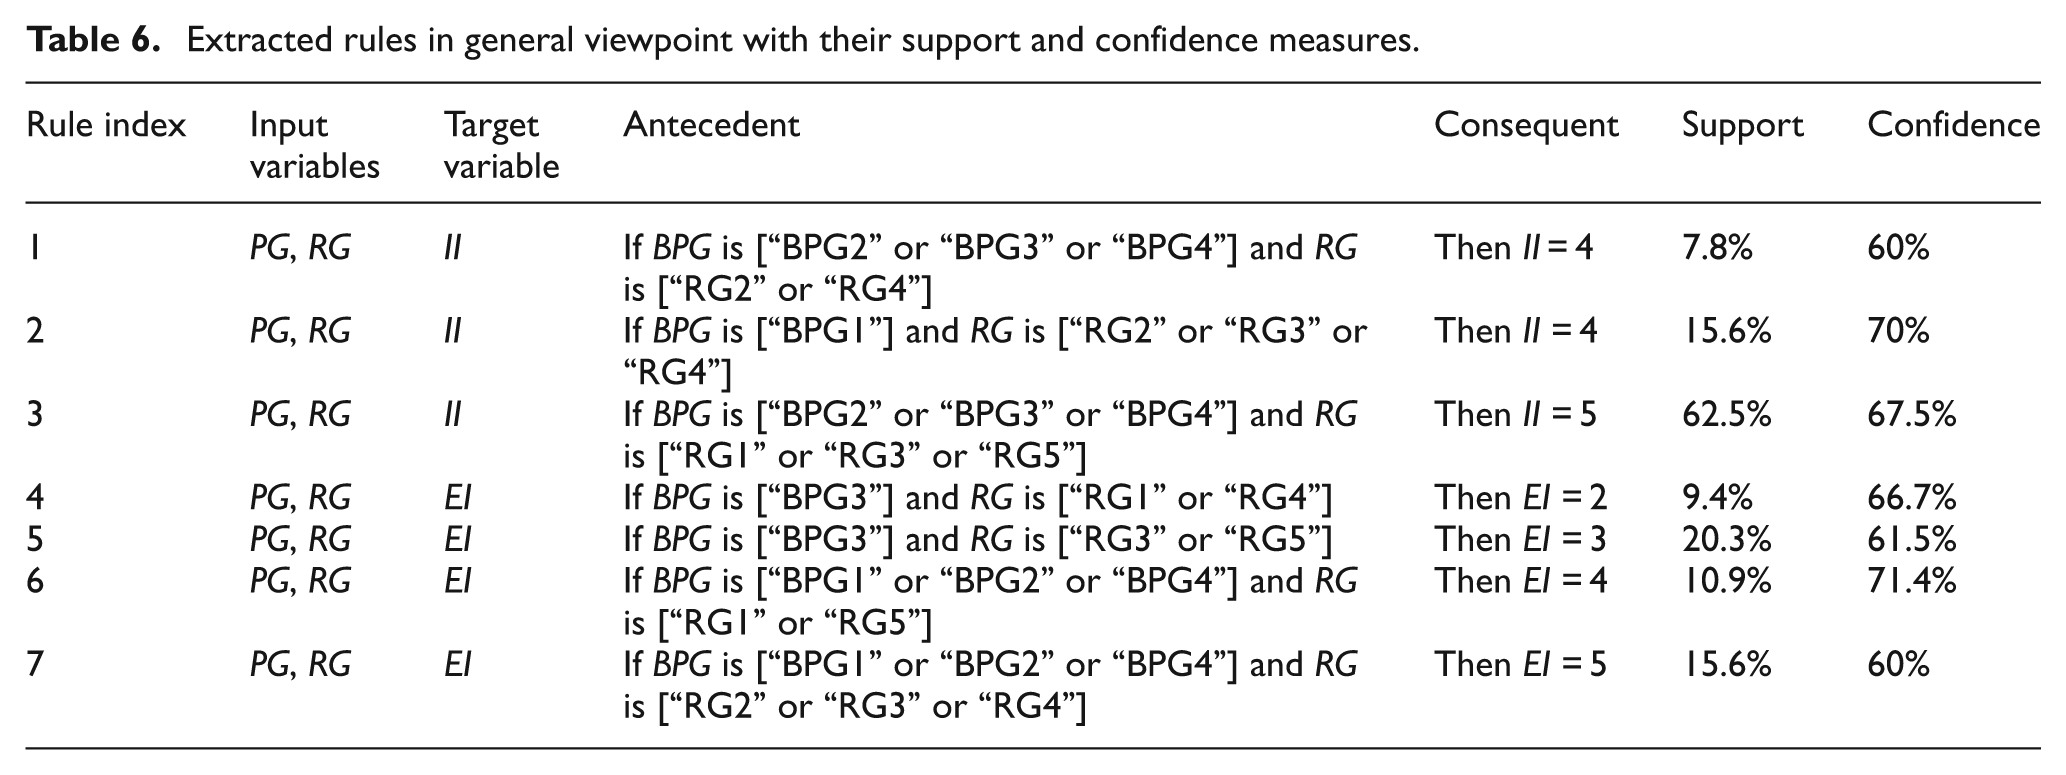
The rules of Table 6 present the main findings on the process and resource classification as follows:
1. Three process groups, that is, “materials handling (BPG2),” “product realization (BPG3)” and “customers management (BPG4),” exist simultaneously in rules 1 and 3. In addition, the remaining process group, “supplier management (BPG1),” exists in rule 2. Indeed, rules 1–3 classify process groups in two categories, including BPG2, BPG3 and BPG4 in one category and BPG1 in another category. Therefore, a number of questions were raised:
What is the difference between the two mentioned categories?
Is there any difference in the nature or type of these two categories?
Further investigation showed that it was obvious that BPG1 is related to the actions of suppliers, that is, supplier data gathering and analysis, supplier evaluation, supplier selection, supplier re-evaluation and handling of supplier contracts; therefore, this category was considered a “supportive” business process class. Other process groups (BPG2, BPG3 and BPG4) consider other main functions from material planning and procurement to production, delivery and receipt of customer feedback that are components of the “operational” process class. Therefore, the two main business process classes are “supportive” (including BPG1) and “operational” (including BPG2, BPG3 and BPG4).
2. In addition, Table 6 shows that three process groups (BPG1, BPG2 and BPG4) exist in rules 6 and 7, and the remaining process group (BPG3) was stated in rules 4 and 5. Therefore, the rules of Table 6 classify the process groups into two sections. The first section includes “supplier management” (BPG1), “materials handling” (BPG2) and “customer management” (BPG4), and the other section contains “product realization” (BPG3). Therefore, an important question was introduced as to the main differentiation between these two sections. Indeed, the second section that included “product realization” is the main process group that outputs the products of the company and includes processes performed inside the organization. Other process groups are related to external parties or such stakeholders as suppliers and customers. Therefore, it was possible to classify the process groups into two main process categories: (a) an “internal” process category, including the “product realization” process group and (b) an “external-related” process category, including the “supplier management,” “materials handling” and “customer management” process groups.
3. Three resource groups—“Relational” (RG2), “organizational” (RG3) and “informational” (RG4)—were stated in rules 2 and 7. Other resource groups of “physical” and “human” were mentioned in rules 3 and 6. The RG2, RG3 and RG4 were resources that have been developed and used in relationships with exterior parties. Instead, RG1 and RG5 are resources that are used inside the organization. Therefore, it was determined that resource groups can be classified into two main “endogenous” (including “physical” and “human” resources) and “exogenous” (including “relational,” “organizational” and “informational” resources) categories.
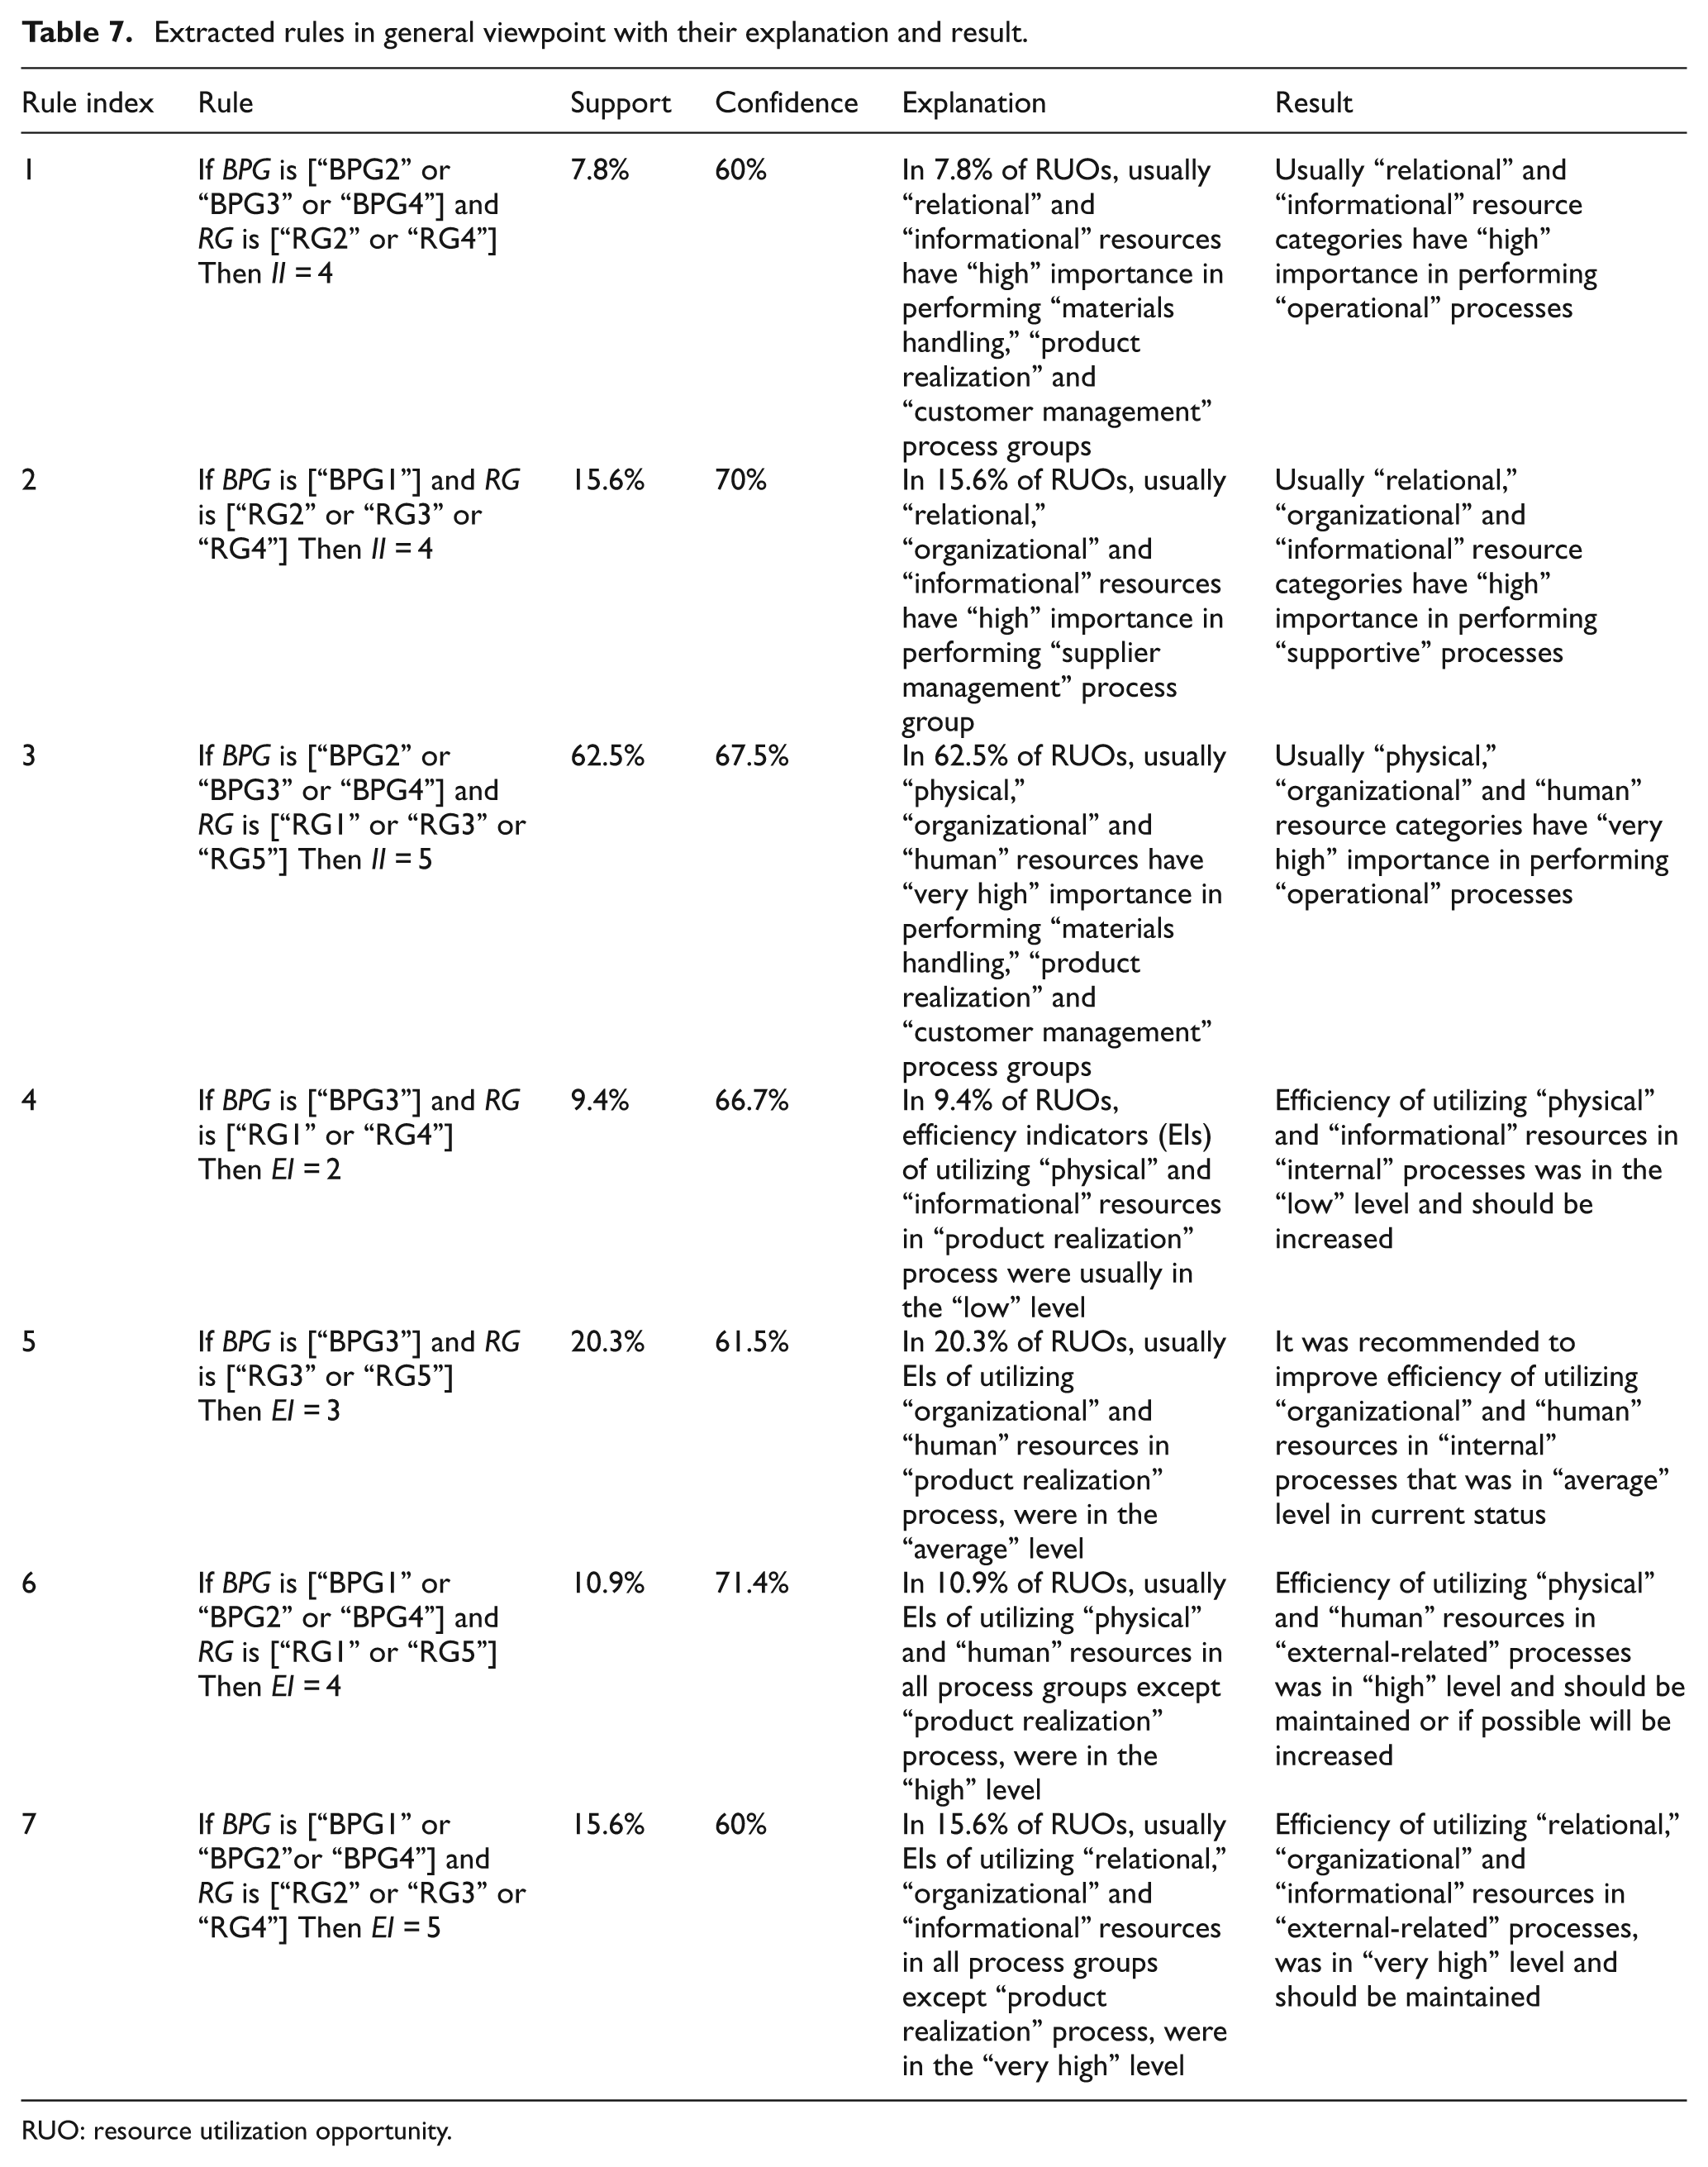
Considering the above findings on process and resource classification, the explanations and results of the rules (with index 1 to 7) are presented in Table 7.
Extracted rules in general viewpoint with their explanation and result.
RUO: resource utilization opportunity.
Table 7 indicates important managerial applications. Certain rules that include an importance indicator (II) as the target variable present description of resource utilization in the business processes. Other rules that have an efficiency indicator (EI) target variable represent result from resource utilization performance. Managerial applications (obtained from the general viewpoint) are stated as follows:
For planning and implementation of “operational” processes, the first priority is to consider “physical,” “organizational” and “human” resources (obtained from rule 3). The second priority focuses attention on “relational” and “informational” resources (obtained from rule 1).
In addition, in performing “supportive” processes, managers should especially consider “relational,” “organizational” and “informational” resources (obtained from rule 2).
For “internal” processes (that are completely performed inside the organization), the first priority is planning and implementing improvement plans to increase the efficiency of “physical” and “informational” resource utilization because their current EIs were at the “low” level (obtained from rule 4). The second priority is improving “organizational” and “human” resources utilization capabilities because their current EIs were at the “average” level (obtained from rule 5).
For “external-related” processes (that are performed by interaction with external parties), the first important issue indicated that the efficiency of “relational,” “organizational” and “informational” resources utilization was at the “very high” level (obtained from rule 7). The second issue indicated that the efficiency of “physical” and “human” resources utilization was at the “high” level (obtained from rule 6). Thus, managers should focus attention on these RUOs to maintain the desired current level. In addition, it is possible to consider these RUOs as best practices for benchmarking programs (for other processes or organizations).
Modeling and analysis from a detailed viewpoint
In this section, detailed modeling and analysis was performed via the CART classification algorithm. Two “business process” (BP) and “resource” (R) variables were used as the input variables. The CART classification algorithm was separately run for “importance indicator’ (II) and “efficiency indicator” (EI) as the output variables. The generated rules showed that their “support” and “confidence” measures were greater than the thresholds and are stated in Table 8.
Extracted rules in detailed viewpoint with support and confidence measures.
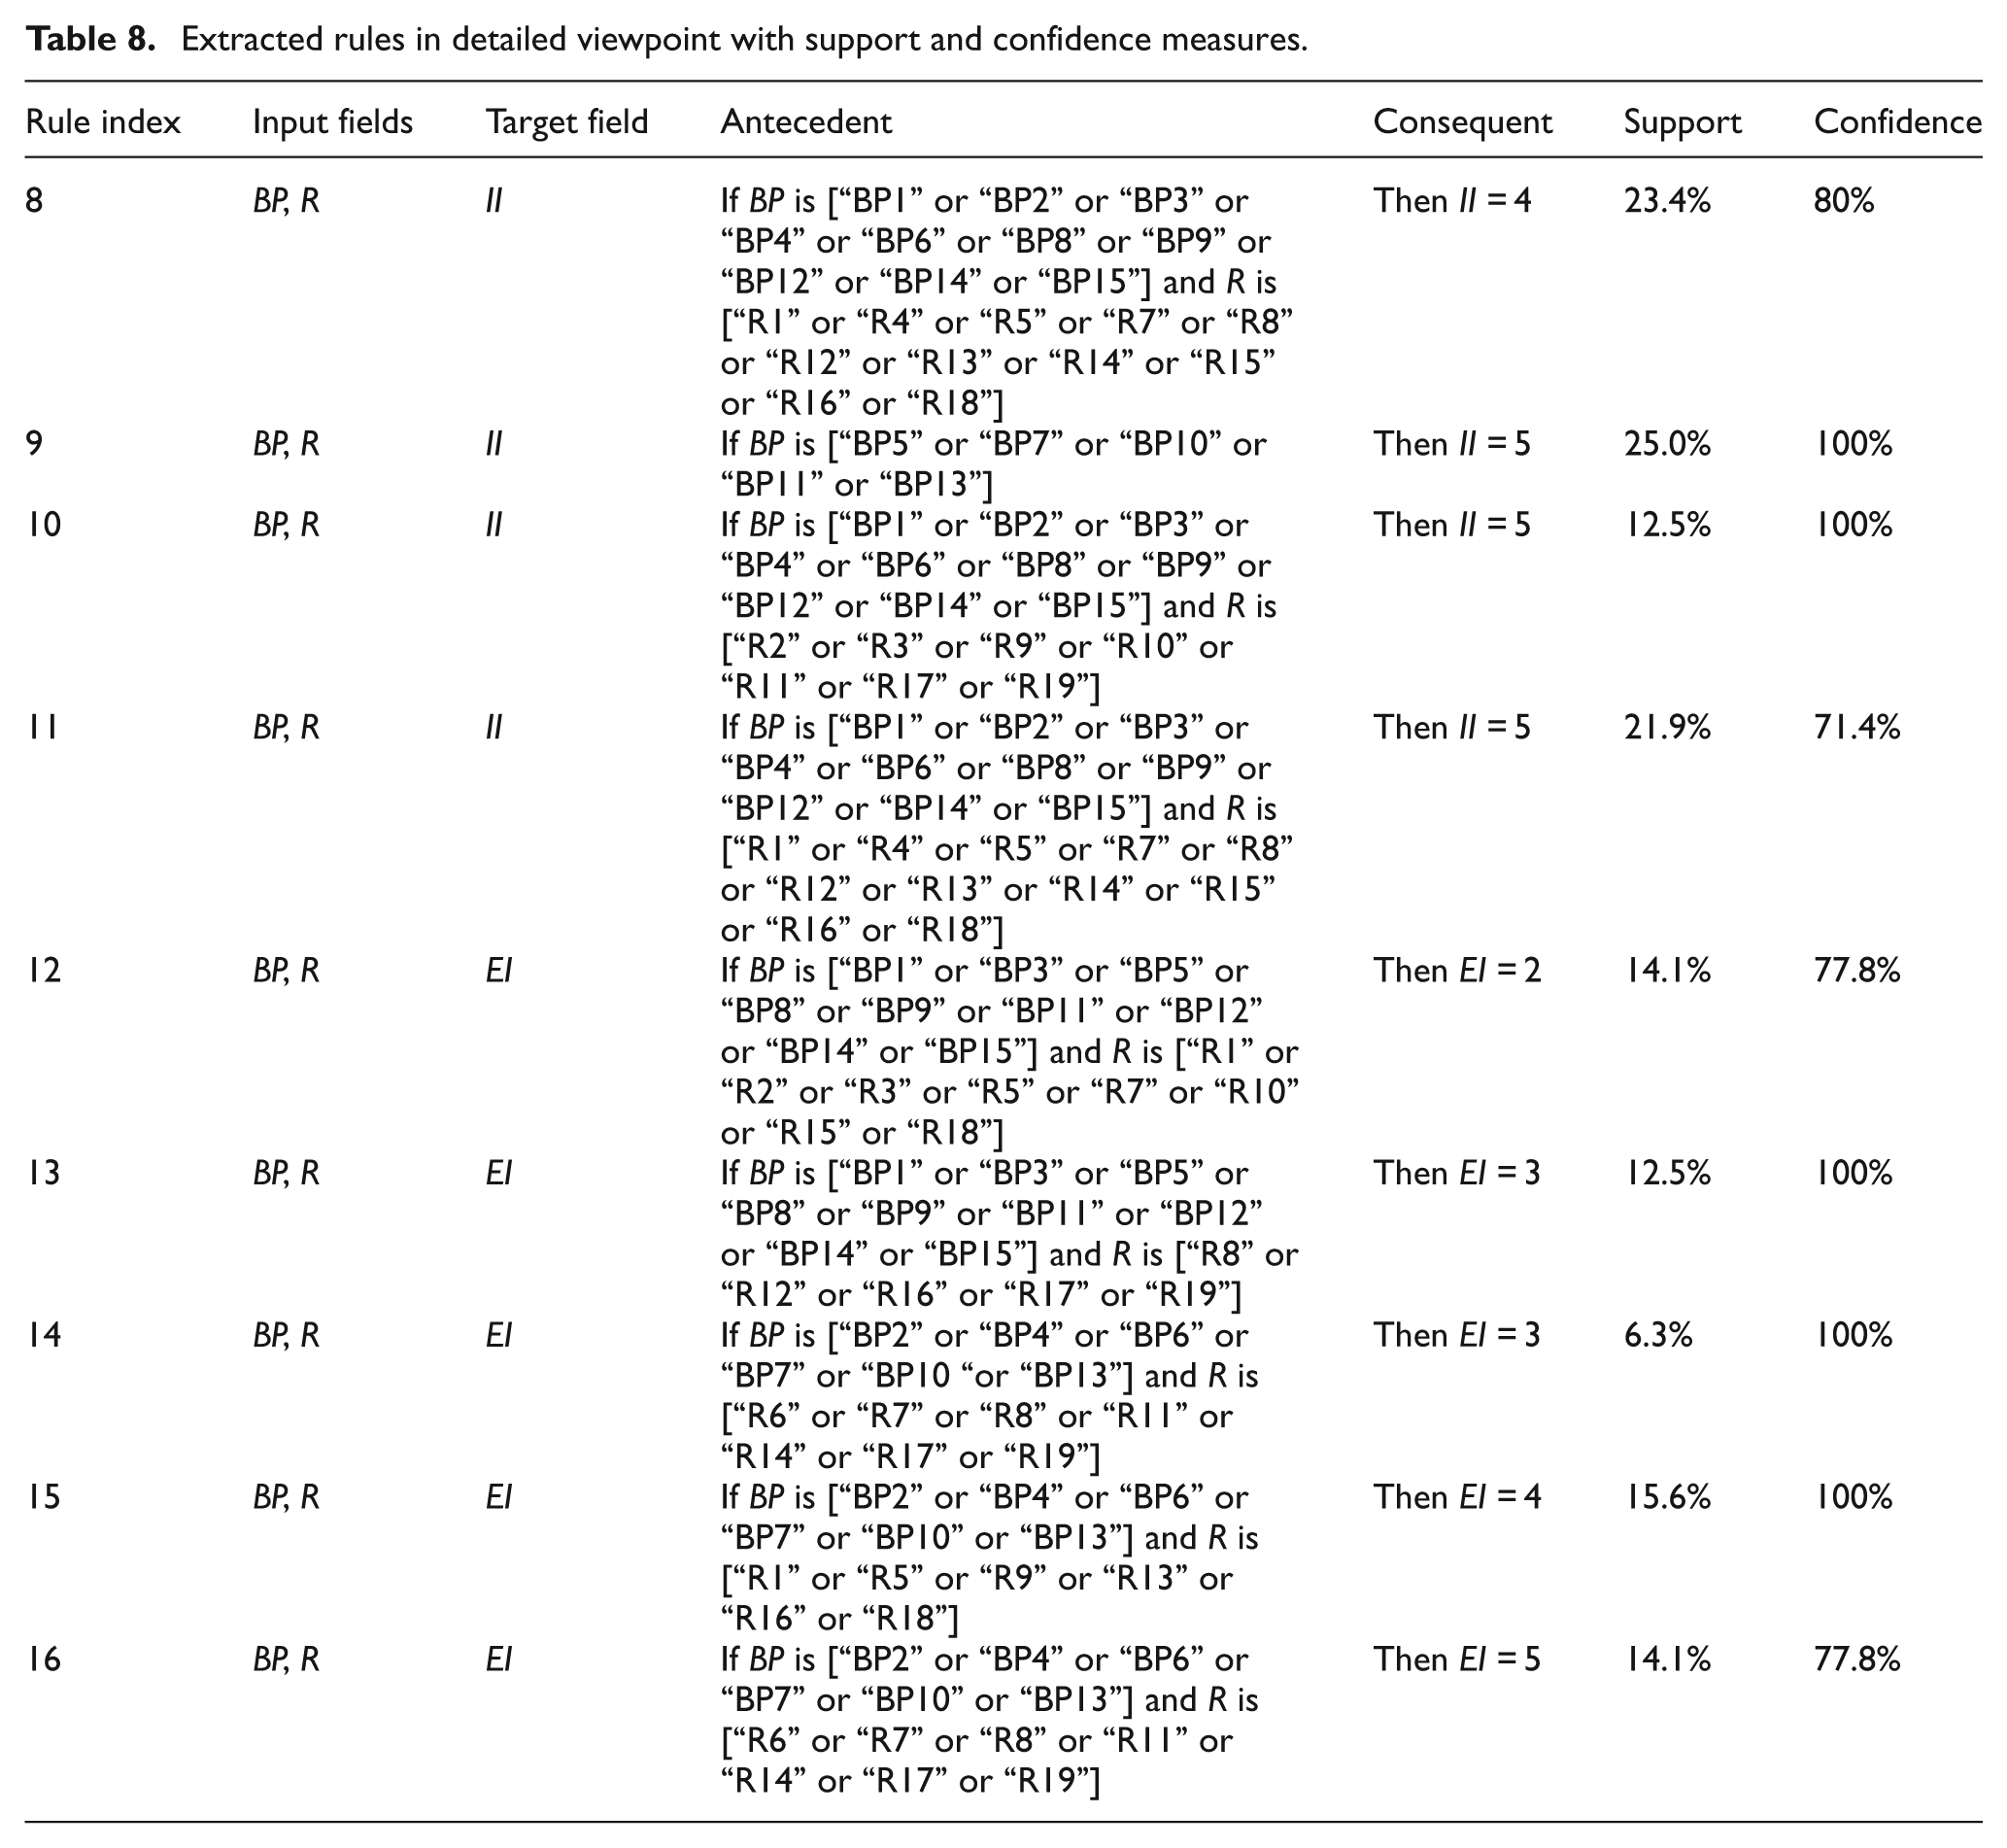
The rules of Table 8 present the main findings on processes and resources affinities as follows:
Four business processes (“BP1,” “BP2,” “BP3” and “BP4”) exist in three rules (8, 10 and 11). What are the similarities of these processes? “Supplier database management” (BP1), “supplier evaluation” (BP2) and “supplier contracting” (BP3) are processes of the “supplier management” process group. “Materials requirement planning” (BP4) was the other process that was observed with the three mentioned processes in rules 8, 10 and 11. Indeed, these four business processes concern different functions of “supply chain management,” from supplier data analysis, supplier evaluation and contracting at the strategic level to materials planning at the operational level. Therefore, a new process group was defined that included BP1, BP2, BP3 and BP4 and was referred to as the “supply chain management (SCM)” business process group.
Two business processes (“BP8” and “BP9”) were observed in three rules (8, 10 and 11). The processes were “production planning” (BP8) and “production and assembly” (BP9) and were related to production function such that BP8 addresses planning and scheduling of the production, and BP9 was related to performance of production activities. Therefore, a new process category known as “production” can be defined that includes BP8 and BP9. Other than the “production” business process category, there were three business processes, that is, “products quality control” (BP10), “packing” (BP11) and “storing” (BP12), related to functions of the “product realization” process group and were performed after production. Therefore, BP9, BP10 and BP11 were considered as an “after production” process category. Overall, the “product realization” process group was classified into “production” and “after production” business process categories.
Two “product delivery” (BP14) and “receipt of customer feedback” (BP15) business processes were mentioned in three rules (8, 10 and 11). The processes exist in the “customer management” process group. Another process in the “customer management” group was “sales contracting” (BP13). It is necessary to consider that BP13 was related to the “sales” function, and BP14 and BP15 address the “after sales” function. Therefore, it was suitable to categorize the “customer management” process group into two “sales” (including BP13) and “after sales” (including BP14 and BP15) business process categories.
Many subsets of resources were mentioned in a number of rules in Table 8; however, a few of them were meaningful and are explained as follows:
4. “Relationships with suppliers” (R5) and “supplier database” (R13) exist in three rules (8, 11 and 15). Both of these resources were related to suppliers. Therefore, a new resource category known as “supplier-related” was defined that included R5 and R13.
5. “Documents” (R7) and “software” (R8) were observed in four rules (8, 11, 14 and 16). A conceptual affinity exists between “documents” and “software” such that both of these were applied in the systems. Documents were used in the management systems, and software was used in the information systems. Therefore, a novel category was defined as “system-based” resources and included R7 and R8. Other than the “system-based” resource category, two “organizational” resources were also noted, that is, “purchase contract” and “sales contract.” Is there any similarity between these two resources? Both of the resources were contracts of a legal nature and therefore were referred to as the “legal” resource category. Therefore, “organizational” resources were classified into “system-based” and “legal” resource categories.
6. “Documents” (R7) and “inventory records” (R14) were stated in four rules (8, 11, 14 and 16), and R7 and R14 have similar natures such that they were used together in many cases. For example, in management systems standards such as ISO 9001:2008, “control of documents” was considered in association with “control of records.” Therefore, a new resource category was defined as “documents and records.”
7. “Skill” (R16) and “knowledge” (R18) were mentioned in three rules (8, 11 and 15). It is important to understand the similarity between R16 and R18 is. Indeed, “skill” and “knowledge” are two aspects of human resources competency. Therefore, these resources were classified in a category known as “competency-based” resources. Other than the “competency-based” resource category, two human resource types, that is, “experience” (R17) and “motivation” (R19), were noted in the “human” resources group. It was obvious that “experience” and “motivation,” unlike “skill” and “knowledge,” are related to hidden and intangible aspects of human resources and therefore can be considered in a resource category referred to as “intangible.” Overall, “human” resources included “competency-based” and “intangible” resource categories.
Considering these findings on process and resource classification, the explanations and results of the rules (with index 8 to 16) are presented in Table 9. Table 9 indicates important managerial applications from a detailed viewpoint. For example, in the “production” and “after sales” process categories, the first priority was implementation of improvement plans aimed to increase the EIs of using “equipment and tools,” “energy carriers,” “production location and facility,” “relationships with suppliers,” “documents,” “sales contract,” “production schedules” and “knowledge” because their current EIs were in the “low” level (obtained from rule 12). The second priority was increasing the utilization capability of such resources as “intangible” resource categories because their EIs were at the “average” level (obtained from rule 13).
Extracted rules in detailed viewpoint with their explanation and result.

RUO: resource utilization opportunity.
Results and discussion
The association rules in Tables 5 and 7 recommended a number of modifications to the processes and resource classifications. Table 6 included seven association rules from a general viewpoint, and the confidence measures of these rules were at least 60%. In addition, Table 8 presented nine association rules with confidence measures greater than 70%. Therefore, application of the CART classification algorithm was useful because it is able to discover a number of valuable rules that explain the relationships between “business process and resource types” from one standpoint and “importance and efficiency indicators” from another standpoint.
The extracted rules can have different effects on resource utilization analysis. The first group of findings can be applied only to obtain valuable insight into processes and resources. For example, “relationships with suppliers” (R5) and “suppliers database” (R13) were used in a resource category known as “supplier-related” that can be used for analytical purposes. In addition, a second group of business processes and resources can be used to modify process and resource classification. For example, the “production planning” (BP8) and “production and assembly” (BP9) processes were investigated in a new process category known as “production.” The appropriate modifications in the process classification are stated as follows:
A new level was added to the business process classification that arranges process groups in terms of “operational” (including “materials handling,” “product realization” and “customer management” process groups) and “supportive” (including the “supplier management” process group) classes.
Another new level was added that classifies a number of processes into a process category. In the “product realization” process group, “production planning” and “production and assembly” constitute the “production” process category. Other processes of this group (“products quality control,” “packing” and “storing”) were assigned to the “after production” process category. In addition, “customer management” process group was classified into “sales” (including “sales contracting”) and “after sales” (including “products delivery” and “receiving customer feedbacks”) process categories.
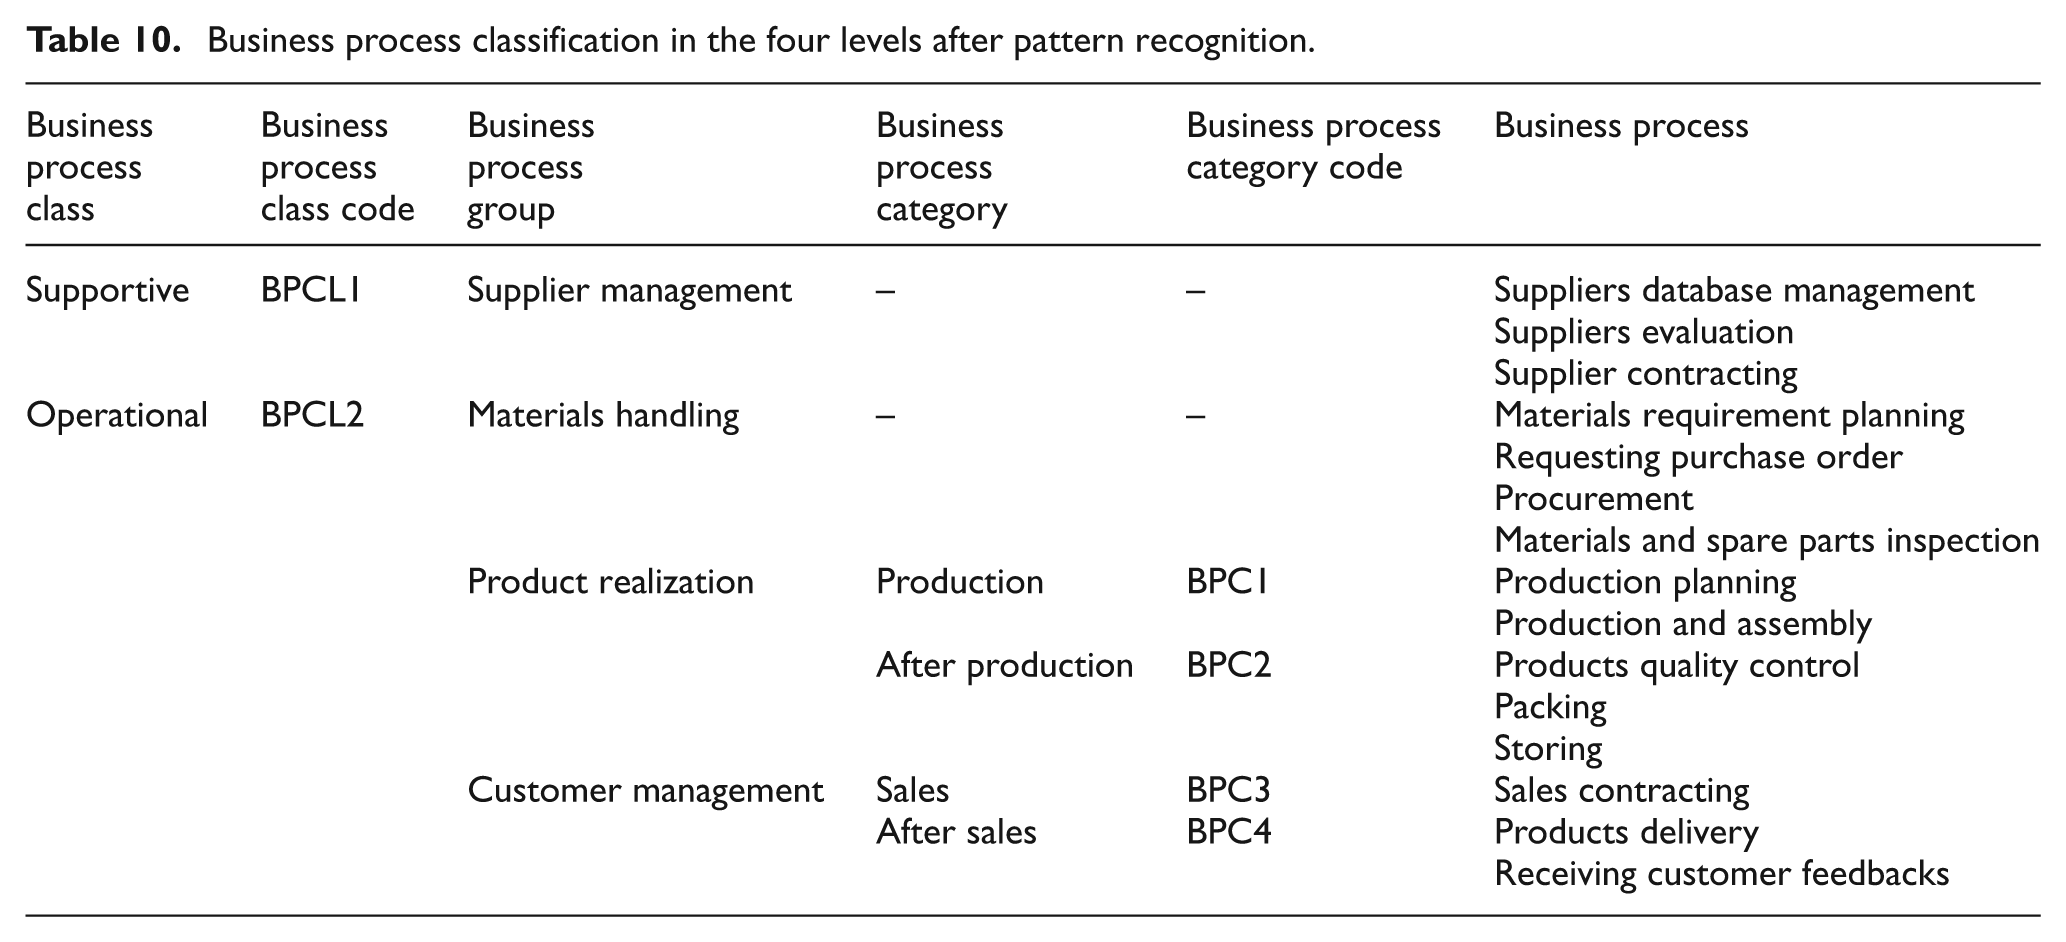
Therefore, the primary two-level business process classification was expanded to a four-level classification based on the findings of the CART algorithm. The modified process classification is shown in Table 10, and the new modifications are highlighted in gray color.
Business process classification in the four levels after pattern recognition.
Comparisons between the primary business process classification (before pattern recognition) and the modified process classification (after pattern recognition) are shown in Figures 1 and 2, and the modifications are highlighted in gray-colored boxes in Figure 2.
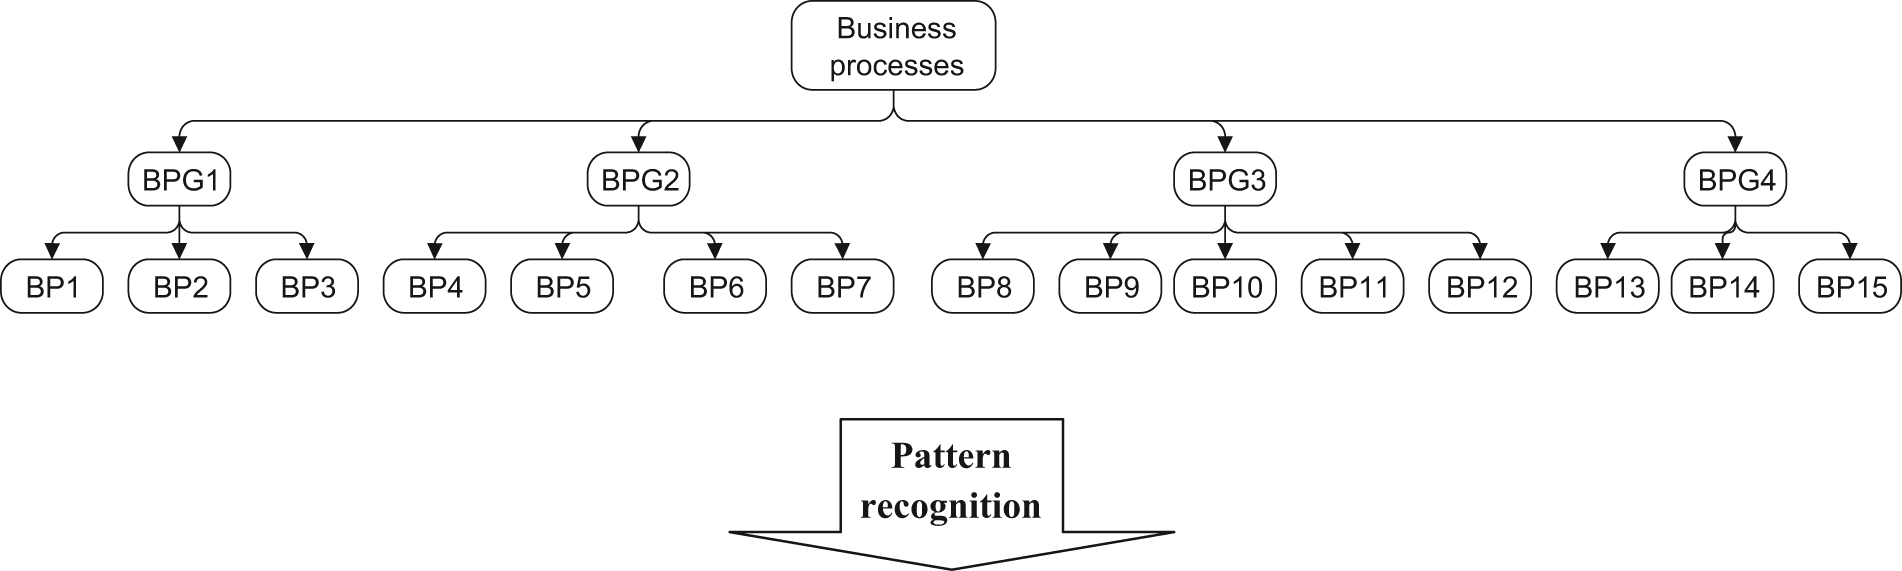
Business process classification (before pattern recognition).
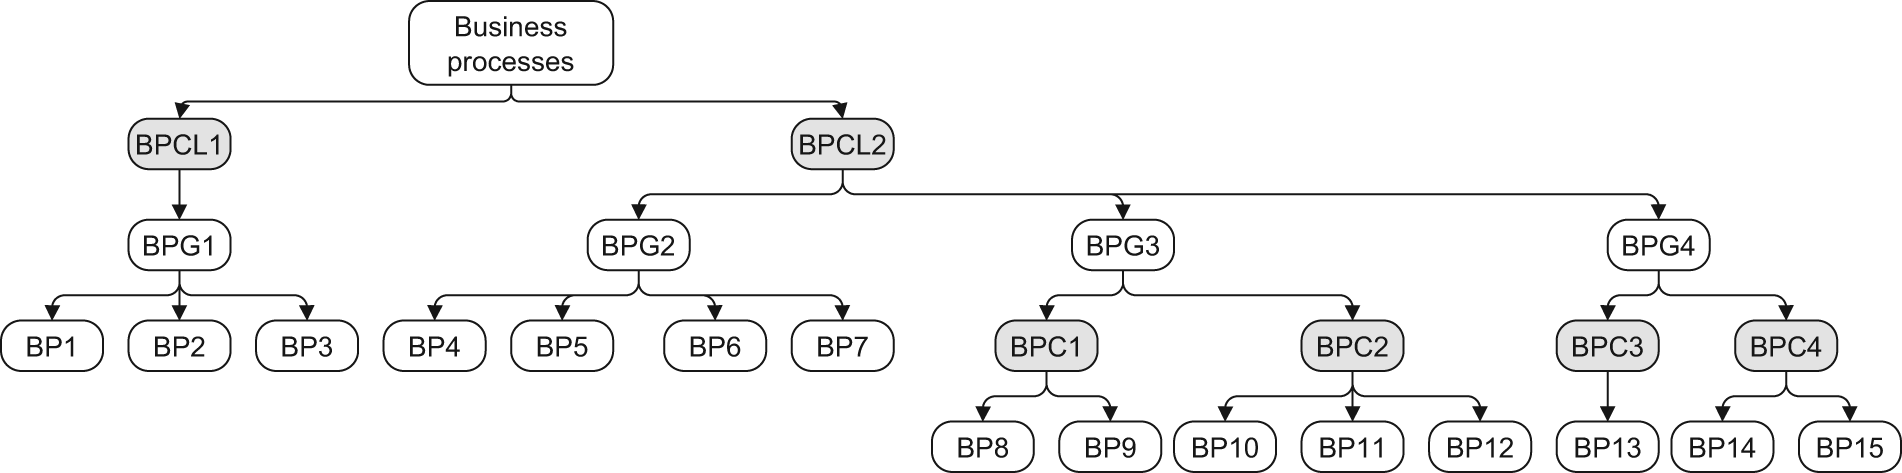
Business process classification (after pattern recognition).
In addition, the recommended modifications to the resource classifications are stated as follows:
A new level was added to the resource classification process that arranges resources into “endogenous” (including “physical” and “human” groups) and “exogenous” (including “relational,” “organizational” and “informational” groups) classes.
Another new level was added that classifies the components of a resource group. In the “human” resources group, “skill” and “knowledge” constitute the “competency-based” resource category. Other resources of this group, that is, “experience” and “motivation,” were placed in an “intangible” resource category. In addition, the “organizational” resources group was categorized into “system-based” (including “documents” and “software”) and “legal” (including “purchase contract” and “sales contract”) resource categories.
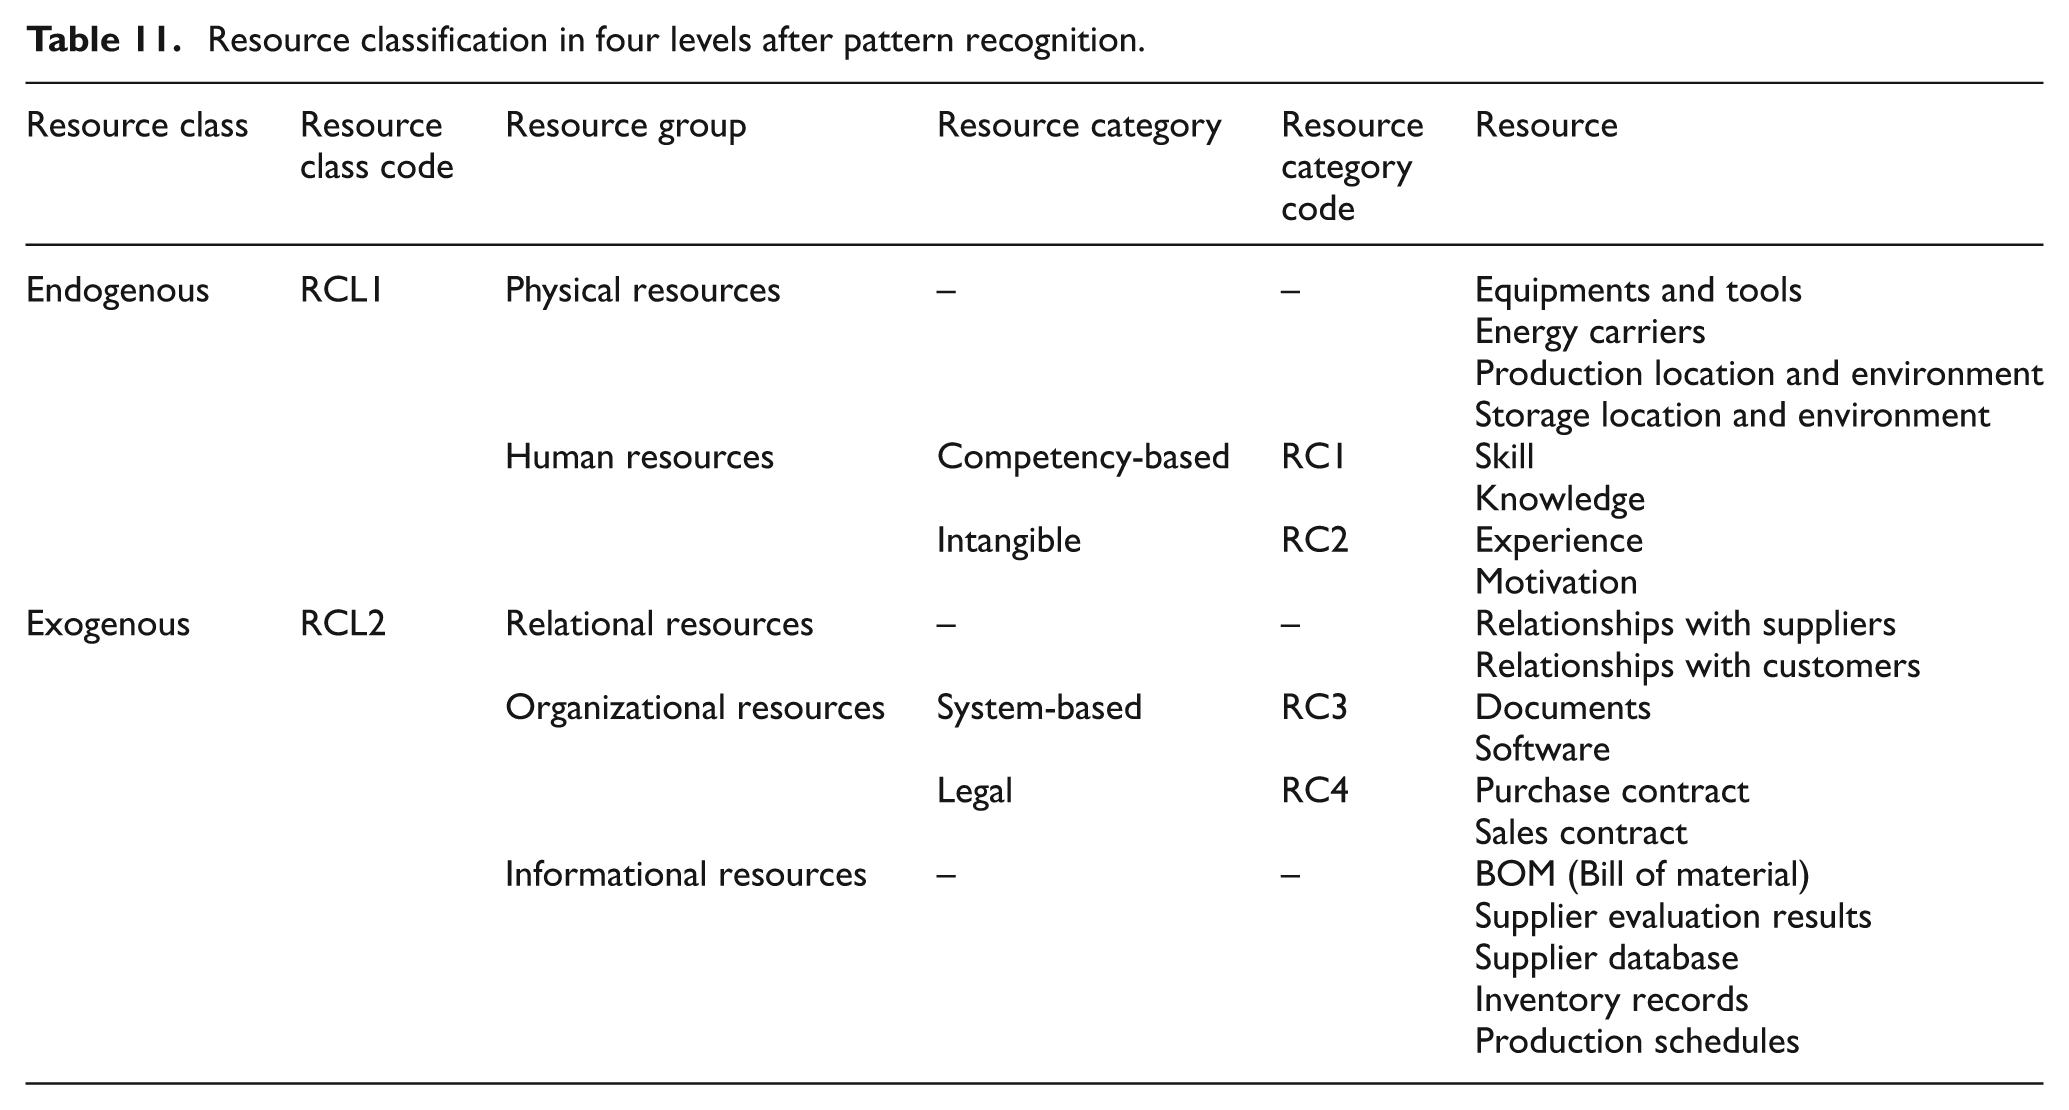
Therefore, the primary two-level resource classification was expanded to a four-level classification after application of CART algorithm and extraction of the association rules. The modified resource classification is shown in Table 11, and new modifications are highlighted in gray color.
Resource classification in four levels after pattern recognition.
Comparisons of the primary resource classification (before pattern recognition) and the modified resource classification (after pattern recognition) are shown in Figures 3 and 4, and the modifications are highlighted in gray-colored boxes in Figure 4.
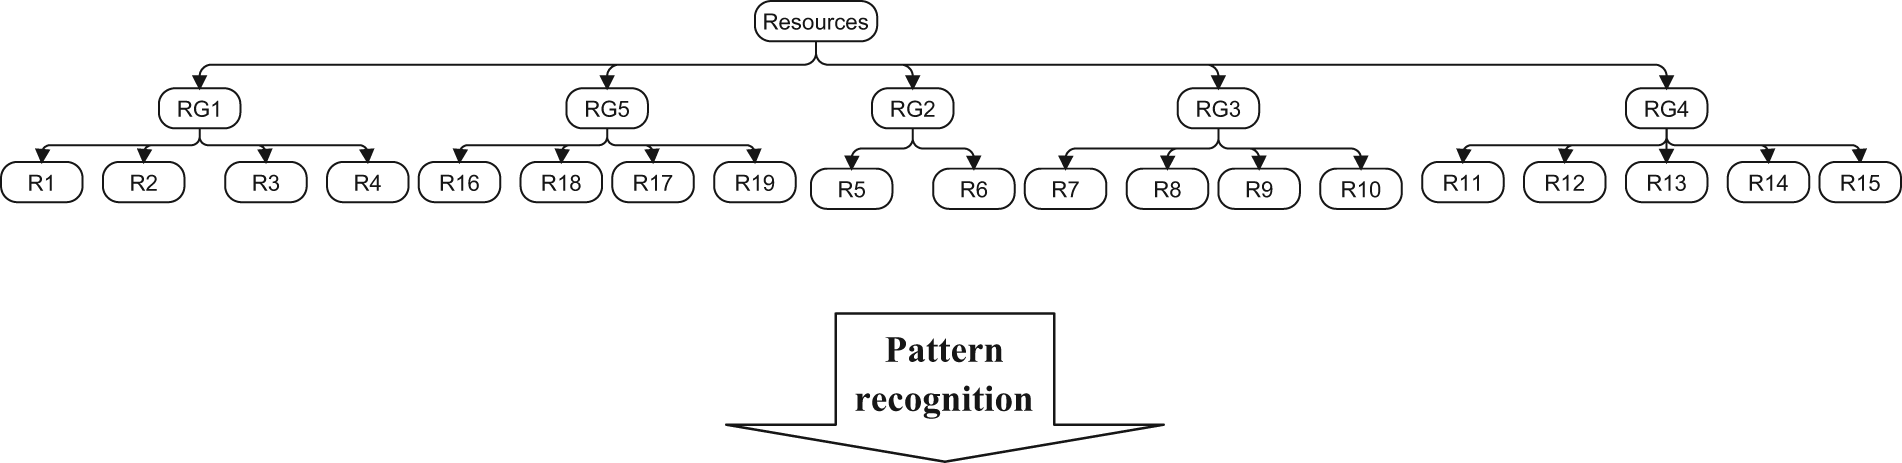
Resource classification (before pattern recognition).
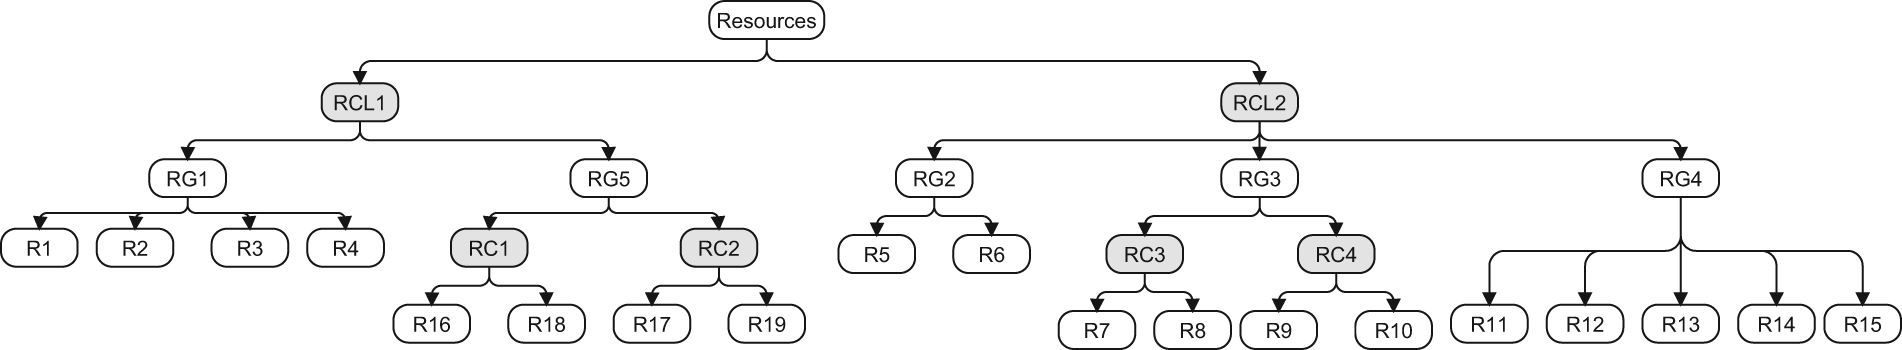
Resource classification (after pattern recognition).
Overall, Figures 1 and 2 indicate how the extracted rules change the business process classification approach. In a similar manner, Figures 3 and 4 show the effects of the rules on the resource classification.
Conclusion
In this study, a four-step approach was presented to recognize patterns of resource utilization. In the first stage, business processes and related resources were identified. Next, in the second stage, processes and utilizable resources were classified. Afterward, in the third stage, a questionnaire was designed to gather the required data, including importance and EIs of RUOs. In the fourth stage, a classification algorithm known as CART was applied to perform modeling and analysis from two perspectives, general and detailed. In the general viewpoint, the “business process group” (BPG) and “resource group” (RG) were considered as input variables, and “importance indicator” (II) and “efficiency indicator” (EI) were assumed as output variables. In addition, in the detailed viewpoint, two “business process” (BP) and “resource” (R) variables were considered as input variables. Next, “importance indicator” (II) and “efficiency indicator” (EI) were assumed as output variables. The generated association rules were used for analysis to present explanations for the importance of the applied resources in business processes as well as their efficiency. Moreover, the managerial applications of the importance and efficiency of resource utilization were presented to aid managers in identifying priorities in planning and implementation of improvement plans to improve the resource utilization capability of the considered business processes. Finally, we presented how the primary two-level process and resource classifications were converted into the modified four-level business process and resource taxonomy.
Footnotes
Declaration of conflicting interests
The authors declare that there is no conflict of interest.
Funding
This research received no specific grant from any funding agency in the public, commercial, or not-for-profit sectors.