
Abstract
This article evaluates the finishing performance of ultrasonic-assisted double-disk magnetic abrasive finishing process on two paramagnetic materials (copper alloy and stainless steel) with different mechanical properties such as flow stress, hardness, shear modulus, and so on. The finishing experiments were performed based on response surface methodology. The results obtained after finishing have been analyzed to determine the effect of different process parameters such as working gap, rotational speed, and pulse-on time of ultrasonic vibration for both work materials and to study various interaction effects that may significantly affect the finishing performance by the process. The outcome of analysis for the two different work materials has been critically compared to understand the effect of the considered process parameters on the finishing performance of the process based on mechanical properties of the workpiece such as hardness. Furthermore, the scanning electron microscopy and atomic force microscopy were carried on the workpiece surface to understand the possible mechanism of material removal and the surface morphology produced after the finishing process.
Introduction
Among various advanced machining processes, magnetic abrasive finishing (MAF) is gaining importance because of its resilient multi-point cutting tool that is capable of producing a damage-free super finish surface. 1 MAF has been used to finish internal and external cylindrical, 2 planar, 3 and various freeform surfaces.4,5 In addition, the MAF process presents a special feature which eliminates the problem of dressing the tool frequently.6,7 Furthermore, in order to increase the industrial application of MAF, Ahn and Lee 8 developed MAF scheme adaptable to ultra-precision polishing applications, which were subjected to disturbances for a relatively longer period of time. In a similar direction, Oh and Lee 9 proposed a sensor fusion scheme which could be utilized for monitoring and prediction of nanoscale precision finishing processes. To improve the conventional MAF process and enhance the application area of MAF, various modifications have been attempted and are discussed as under.
Yan et al. 10 combined electrochemical machining and MAF. They reported that increase in rotational speed of workpiece or electrolyte current resulted in increase in material removal rate and surface finish. However, at higher electrolyte current, the existing magnetic field caused dissolution of steel grit in the working gap.
El-Taweel 11 combined MAF and electrochemical turning. They reported that addition of MAF increased the machining effectiveness and reduced surface roughness, while finishing a composite material.
Yin and Shinmura 12 subjected a SUS 304 sample to three modes of vibrations while performing MAF. They reported that providing vibration along the direction of feed and its perpendicular direction together resulted in a better surface finish in shorter time.
Mulik and Pandey 13 subjected a hard workpiece (AISI 52100) to ultrasonic vibrations while performing MAF. They reported a significant improvement in polishing effectiveness because of the addition of ultrasonic vibrations. They 14 also measured the machining forces in the case of MAF and ultrasonic-assisted magnetic abrasive finishing (UAMAF) and pointed out that the addition of ultrasonic vibrations resulted in an increase in tangential cutting force, which helped in producing better surface finish.
Kwak 15 used a single-pole electromagnet and installed a permanent magnet under a magnesium alloy workpiece (AZ31). By doing so, they observed an improvement in the magnetic flux density available in the working gap (maximum magnetic flux density of 0.2 mT). They observed that the addition of permanent magnet yielded a better surface finish when compared with performing finishing without permanent magnet. They were able to reduce the surface roughness of the workpiece from 0.358 to 0.190 μm in 15 min. Using a similar approach 15 of incorporating a permanent magnet beneath the workpiece, Kim et al. 16 finished aluminum-SiC-based composite. By producing a maximum magnetic flux density of 0.2 mT, they reduced the surface roughness of the composite material workpiece from 1.2 to 0.4 μm in 50 min.
In research attempts by Yin and Shinmura 12 and Mulik and Pandey, 13 ferromagnetic workpieces were finished which produced a high magnetic flux density in the working gap and resulted in effective finishing. These approaches12,13 may not be very effective in finishing para/diamagnetic materials because of low magnetic flux density in the working gap. Moreover, adding additional magnet at the bottom of the workpiece surface alone may require high finishing time. 16 Kala et al. 17 developed an ultrasonic-assisted double-disk magnetic abrasive finishing (DDMAF) setup and achieved 56-nm surface finish on a copper alloy workpiece. However, the magnetic flux density produced in this setup could effectively finish a soft material such as copper alloy only. Therefore, this work aims at developing a setup which could be used for finishing para/diamagnetic flat workpieces of different hardness values. For evaluating the finishing performance of developed setup on paramagnetic materials of different hardnesses, copper alloy (90 Hv) and stainless steel (250 Hv) were selected as the work materials. A compact setup was fabricated, which produced range of magnetic flux density suitable for finishing materials with different hardness values.
This work aimed at establishing the performance of important process factors such as working gap, rotational speed, and pulse-on time on percentage change in surface roughness (%ΔRa). The response surface methodology, design of experiment (DOE) technique, has been selected to plan experiments for evaluating the performance of the process for the considered work materials. The responses so obtained were analyzed using analysis of variance (ANOVA) in order to study the effect of the individual process factors. The analysis has also been used to present a critical comparative study based on finishing characteristics of the process with respect to materials of different mechanical properties. For a better understanding of mechanism of material removal and the surface profiles generated after finishing, for both types of work materials, scanning electron microscope (SEM) and atomic force microscope (AFM) micro-graphs have been obtained for unfinished and finished work samples.
Experimental setup and experimentation
This section deals with the details of finishing tool; workpiece fixture; and range of process parameters, their selection, and experimental procedure.
Finishing tool design
In this study, the permanent magnets have been used for fabricating a magnetic tool. NdBFe magnetic disks (Φ 25 mm and 3 mm thick) were assembled to form a bigger magnetic tool as shown in Figure 1(a). A higher magnetic flux density could be produced either using the complete assembly of magnet on one side of the workpiece or by dividing the same number of magnetic disks into two parts such that workpiece lies between two disks. To select a better alternative, magnetic flux density was measured for both the systems (total number of magnets being fixed). The values of maximum magnetic flux density shown in Figure 1(b) were taken at a distance of 3 mm from the surface of the magnetic disks.
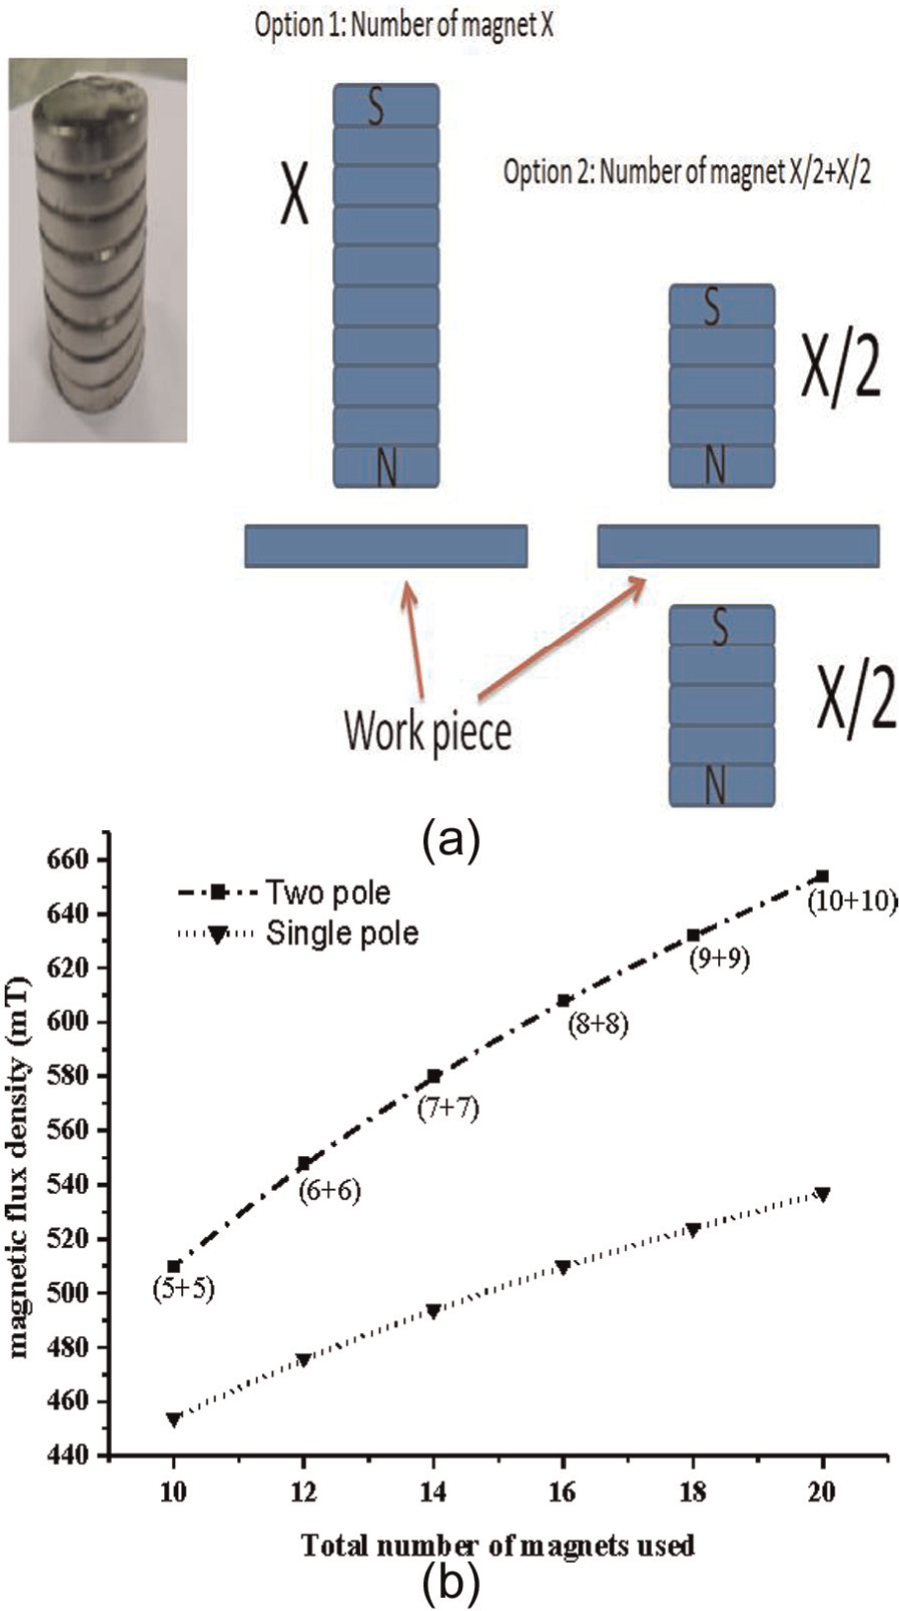
(a) Magnetic disks assembled to form a magnetic tool of higher magnetic intensity and (b) magnetic flux density for single-sided and double-sided magnetic arrangement.
From Figure 1(b), it can be seen that keeping magnetic disks on either side of the workpiece was more suitable than using the same number of magnetic disks on one side. Therefore, the present arrangement of keeping magnetic disks on either side of the workpiece was selected for fabricating a magnetic tool. A four-pole magnetic tool was selected to ensure a synchronous motion of the upper and lower set of magnetic tool. The NdBFe magnets have been installed inside aluminum disk with four blind holes to avoid scattering of the magnetic disk during their rotation. Figure 2 shows the fabricated magnetic tool with alternate pole arrangement.
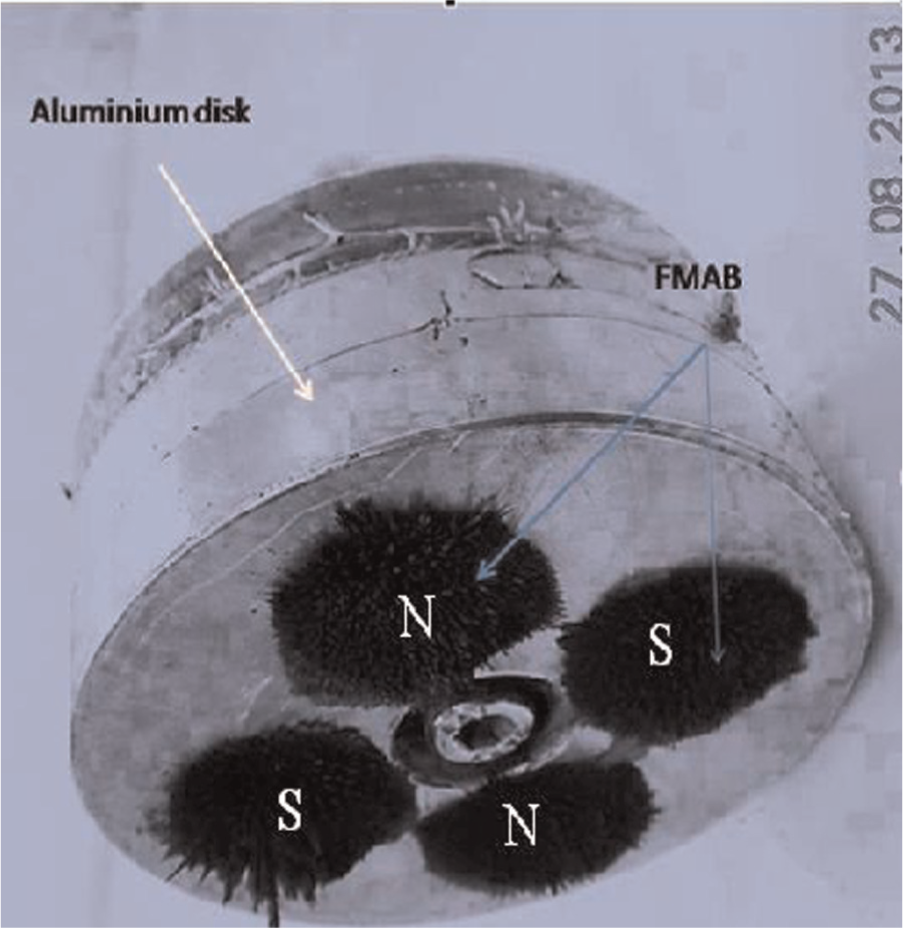
Magnetic tool with alternate pole arrangement.
Workpiece holding fixture
It was planned to subject the workpiece to horizontal ultrasonic vibrations in order to provide relative motion to workpiece with respect to flexible magnetic abrasive brush (FMAB) in addition to the rotational motion. This high-frequency relative motion was likely to increase the rate and magnitude of the impacts caused by the abrasives and to the workpiece surface which might effectively shear the peaks present on the workpiece surface. For the same, workpiece holding fixture was designed and fabricated. The schematic arrangement of the fixture is shown in Figure 3(b).
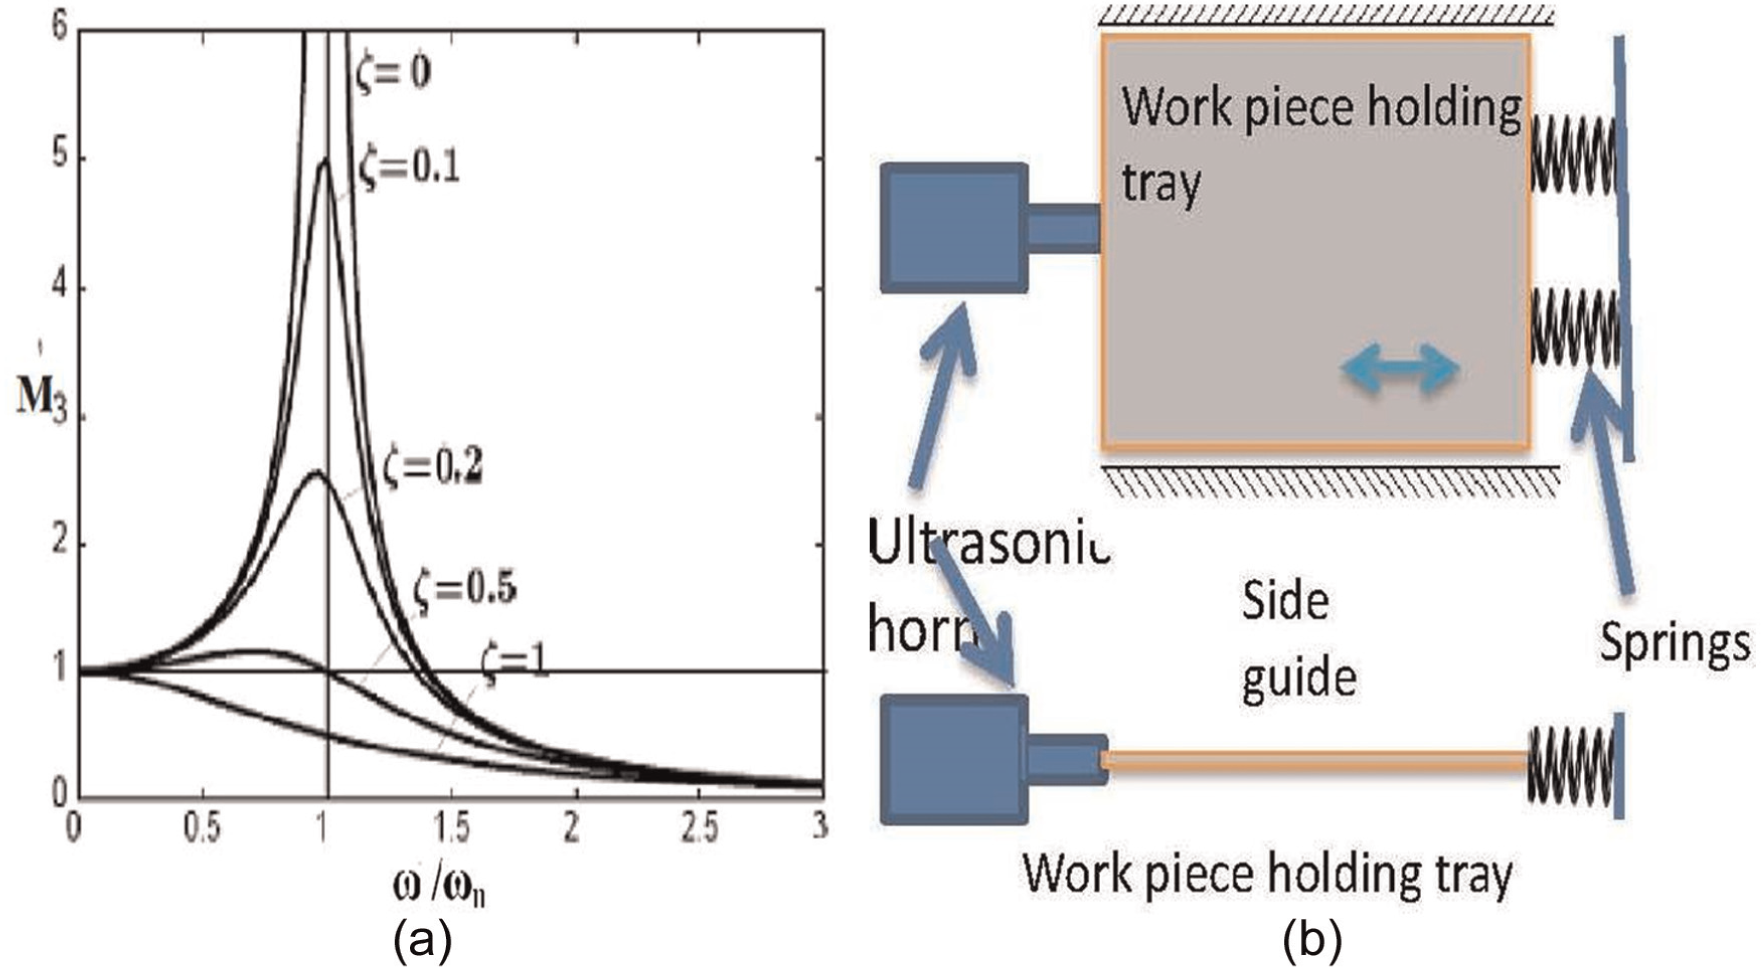
(a) Magnification ratio versus frequency ratio while exciting a spring–mass system 16 and (b) schematic arrangement of workpiece holding fixture.
The present case of fixture design was identical to a forced vibration of a damped spring–mass system 18 and the solution of which is of the form
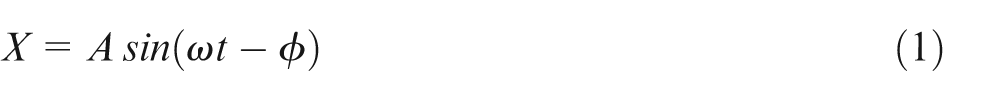
where
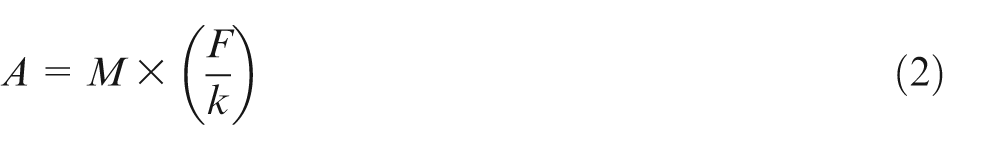
where
Experimental setup
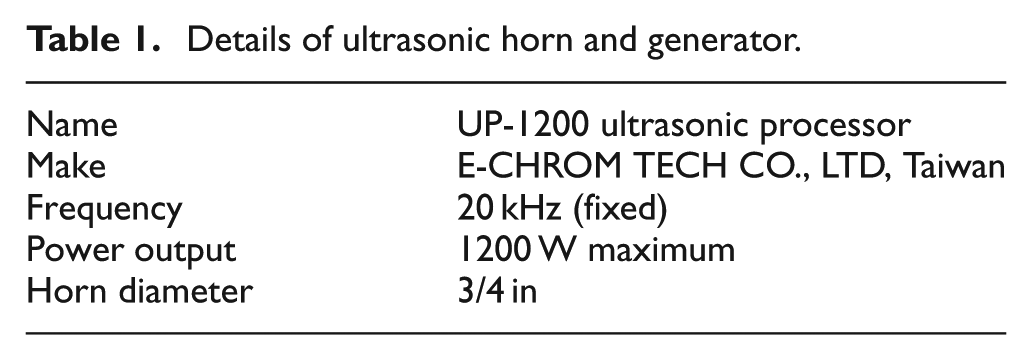
The experimental setup used for finishing in this study comprised of three main units. The first unit consisted of two sets of four-pole magnetic disks (Figure 2), upper and lower disks, which were placed opposite to each other so as to place the workpiece between them, as shown in Figure 4(a). Figure 4(b) shows the schematic view of the setup. Figure 4(c) shows the magnetic flux distribution under the magnetic disk at different working gaps. The second unit was an ultrasonic vibrations producing source, details of which are provided in Table 1. It consisted of a power supply for energizing the piezoelectric transducer and an exponential horn that amplifies the amplitude of vibration at horn end and transfers the vibrations to workpiece. The third unit consisted of specially designed fixture for holding the workpiece, while the workpiece was subjected to ultrasonic vibrations (see Figure 4(a) and (b)). The fixture consisted of a workpiece holding tray which slides in the side guides. The front end of the tray rested against a pair of springs (Figure 3(b)). The free end of the plate was subjected to the ultrasonic vibrations by means of the ultrasonic horn. The workpiece was mounted on the workpiece holding tray by means of small screws and threaded holes provided at the four corners of the tray.
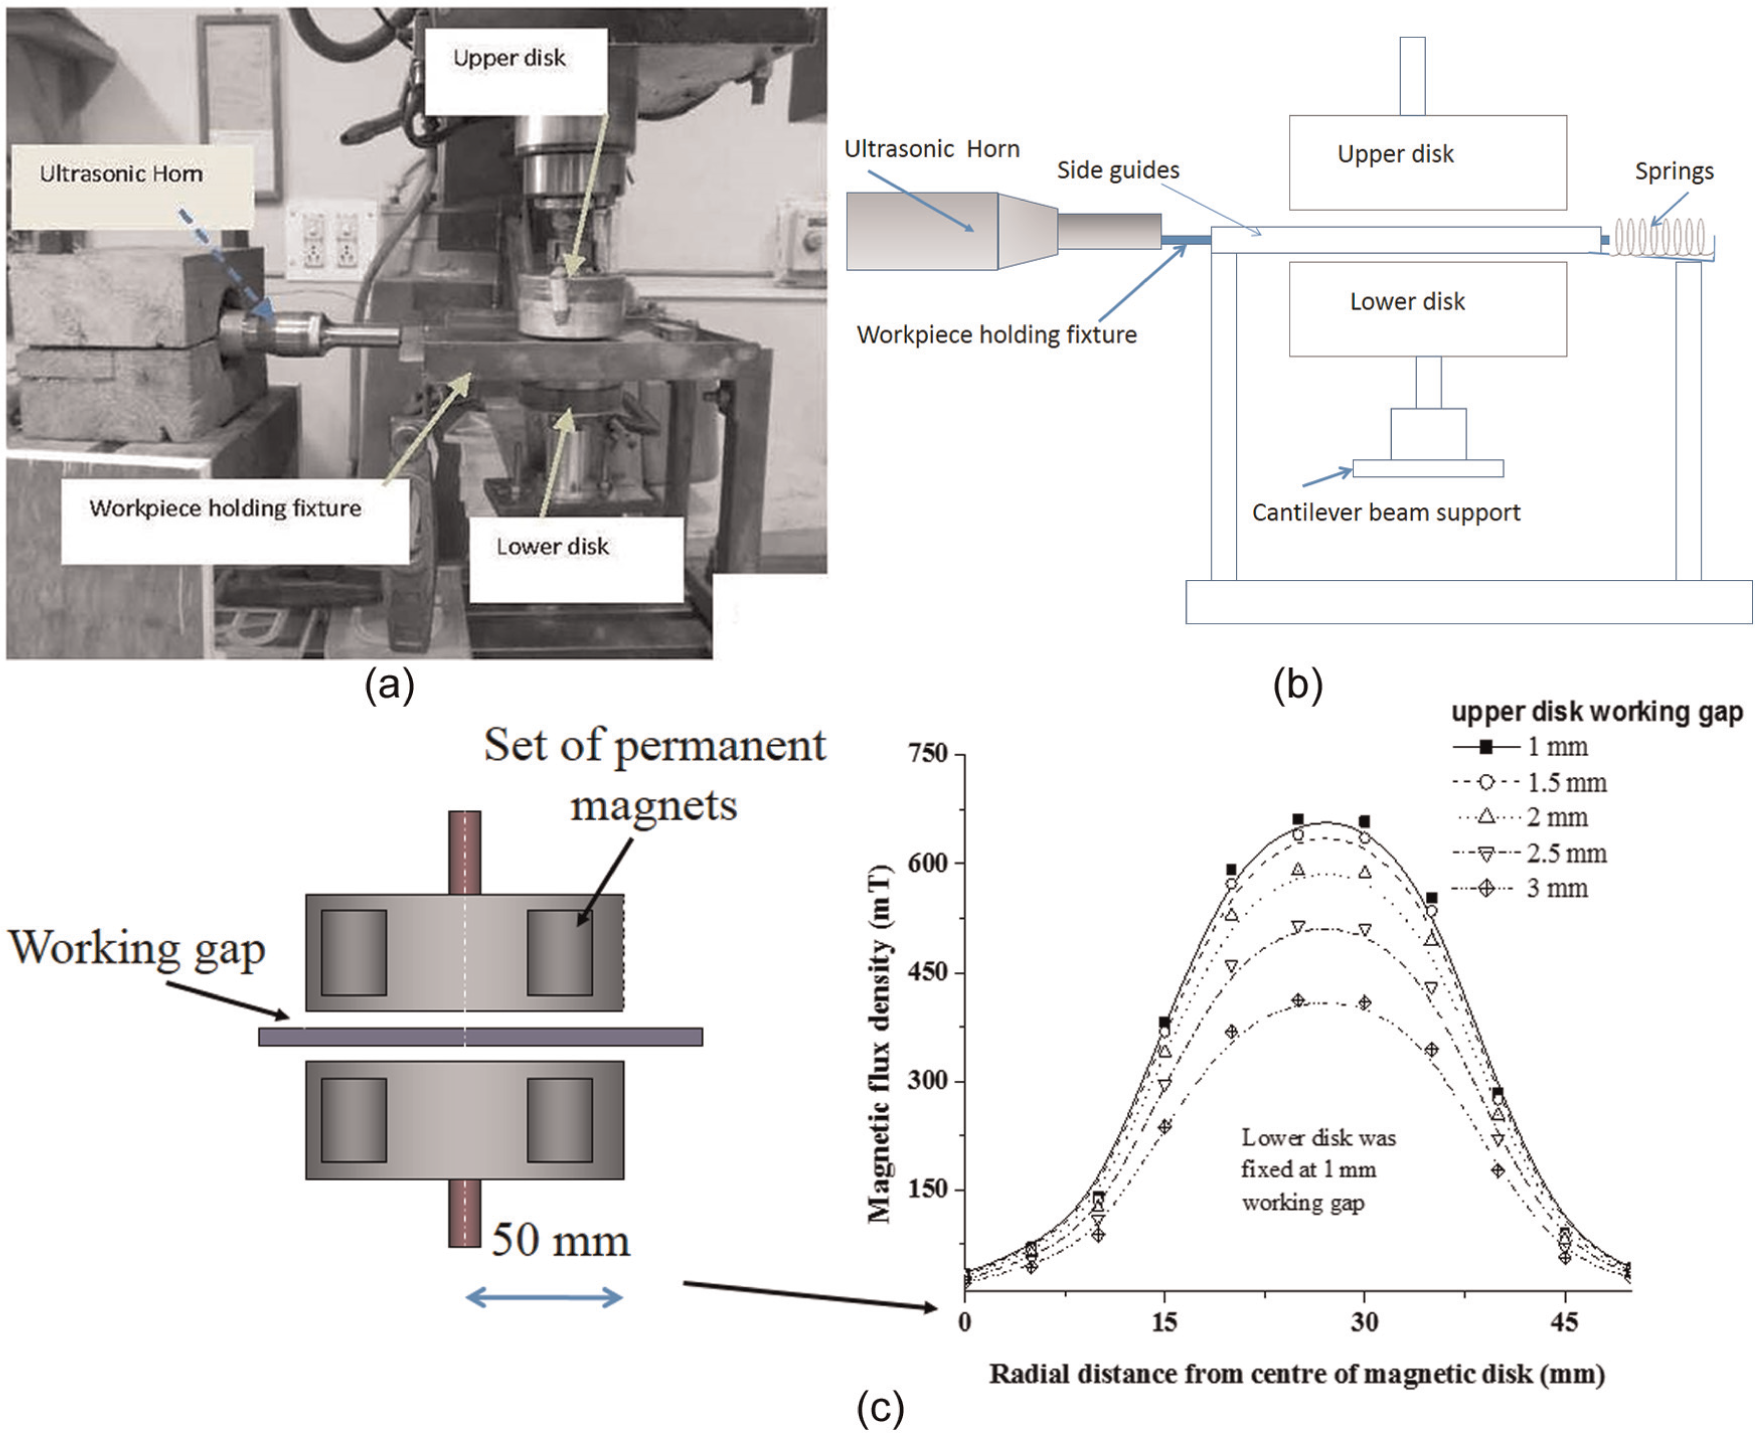
(a) Ultrasonic-assisted DDMAF setup, (b) schematic diagram of the experimental setup, and (c) magnetic flux density distribution along the radius of the aluminum disk.
Details of ultrasonic horn and generator.
Preliminary experiments
To understand the difference between finishing performance of DDMAF and ultrasonic-assisted DDMAF, process finishing experiments were conducted on copper alloy samples, and the results are shown in Figure 5. The grounded copper workpiece samples on which the experiments were performed had an initial average surface roughness of 0.3427 μm. It can be observed from Figure 5 that for a given processing condition, subjecting the workpiece to ultrasonic vibrations resulted in a better surface finish at higher feed rate. To understand the effect of various process parameters on ultrasonic-assisted DDMAF process for different types of work materials, experiments based on DOEs were conducted, and the details are presented in the following section.
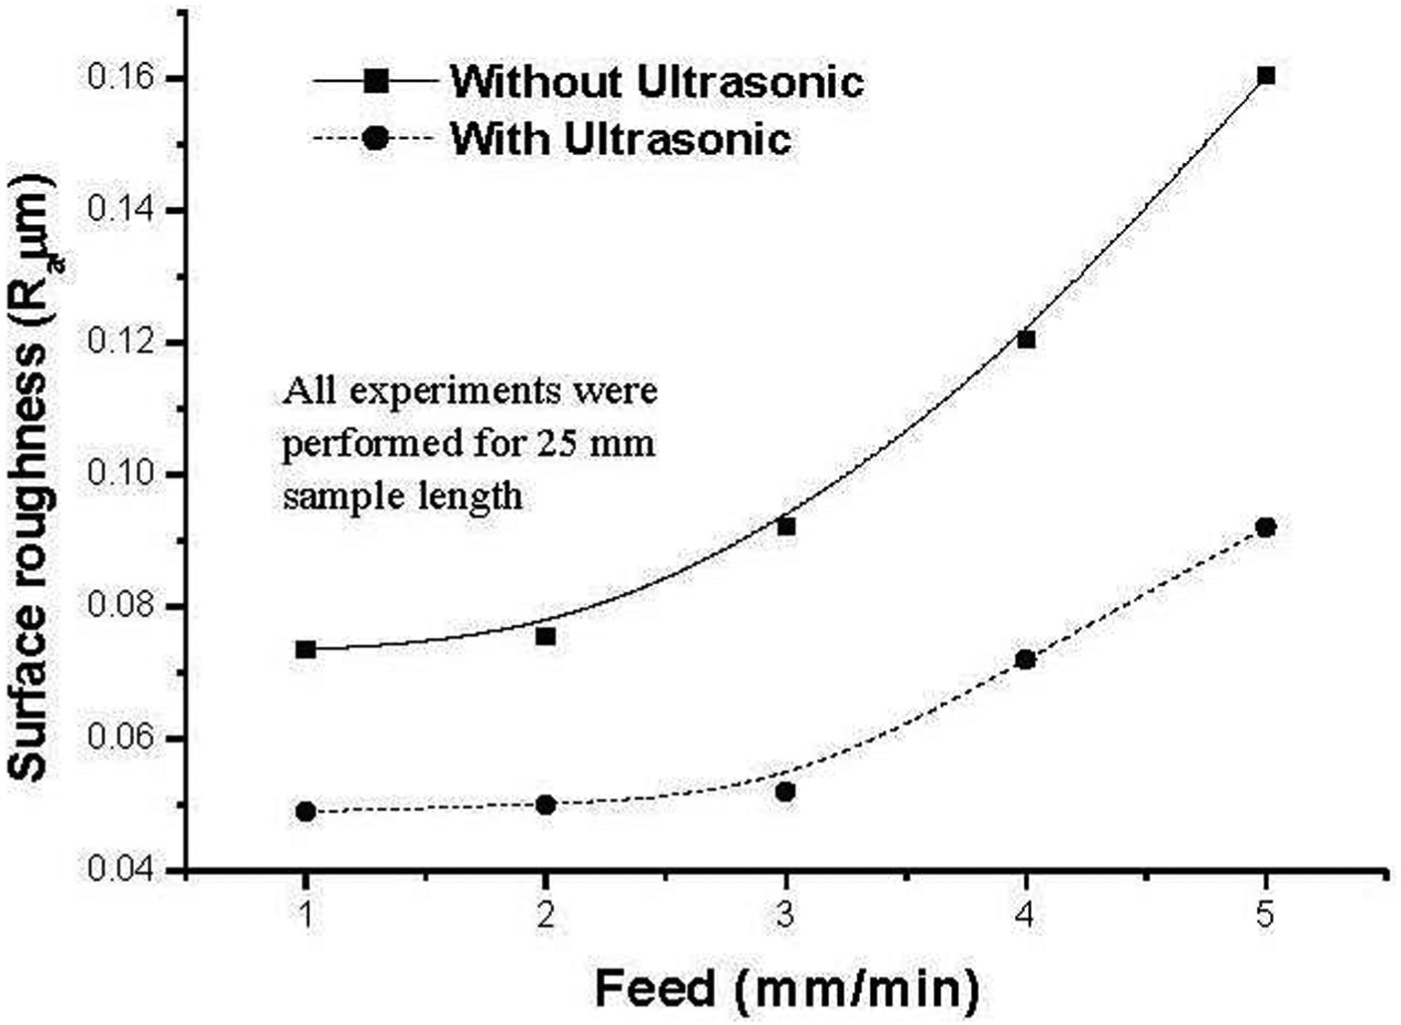
Effect of introducing ultrasonic vibration with DDMAF while finishing copper alloy workpiece (working gap = 2.5 mm, rotational speed = 300 r/min, abrasive weight percentage = 20%, and alumina abrasive size = #1200).
Detailed experimental procedure
The work materials for the experimentation were copper alloy and stainless steel. Chemical composition and other important mechanical properties of workpieces are provided in Table 2. The above two work materials were selected because they cover a wide range of hardness and are commercially used. Unbonded type of abrasive has been selected because it does not require complex procedure of fabrication such as bonded abrasive, and unbonded type of abrasive mixture has yielded good surface finish as reported in various research attempts.13,16,18 According to the previous work done by Kala et al., 17 1200 mesh size of abrasives yielded a good surface finish, and hence, same size of abrasives has been considered for all the detailed experiments. Abrasive percentage of 20% by weight has been selected since a lower concentration may decrease the total number of abrasive while a higher value of percentage weight of abrasive may result in a soft FMAB which may not be able to effectively finish hard work materials. Working gap and rotational speed were considered to be the most important process parameters in the case of MAF; 19 thus, these two parameters and the pulse-on time of ultrasonic vibration 20 were selected as the process factors in this study.
Properties of two workpiece materials used in experiments.
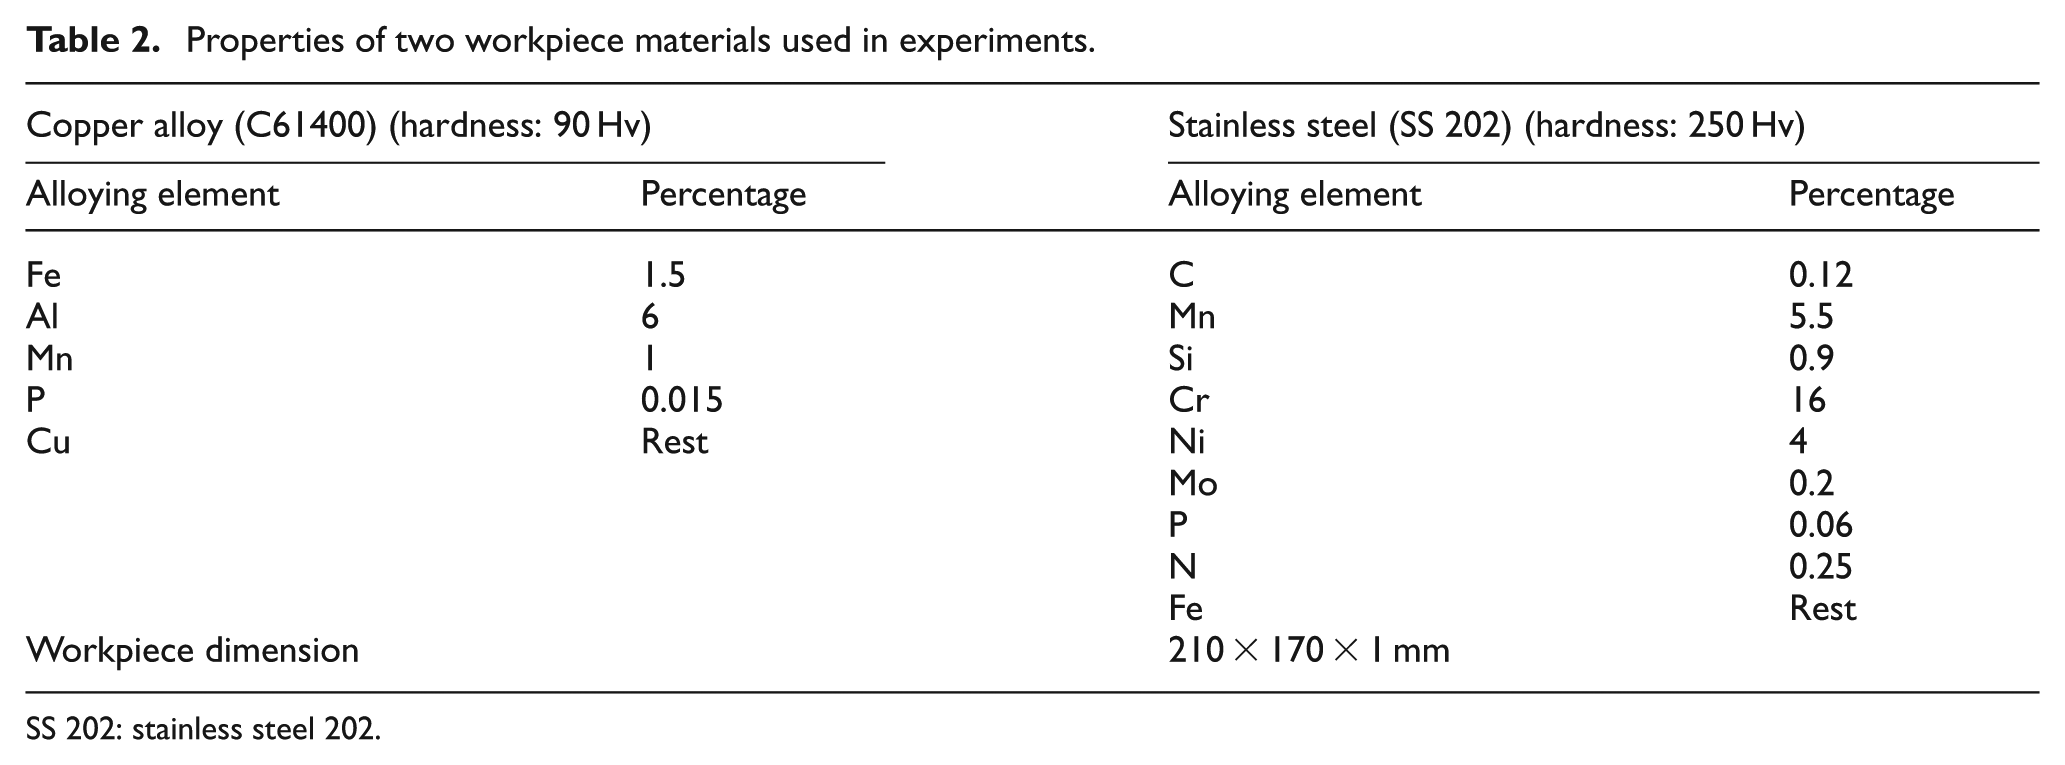
SS 202: stainless steel 202.
The range of the working gap was selected based on the magnetic flux density available which would be suitable to perform finishing on the two different work materials. It was observed through trial experimentation that for finishing stainless steel workpiece with working gap greater than 3 mm resulted in very small change in surface roughness, while for copper alloy work samples, good results were observed between 2 and 3 mm. A sudden drop in surface finish was observed for working gap less than 1 mm. This could be because of a very high magnetic field density. Therefore, the working gap range was selected as 1–3 mm. Unbonded abrasive posses a limitation on working at high rotational speed. At high peripheral speeds, loose abrasives tend to leave the FMAB chain, while at very low rotational speeds, the finishing performance tends to decrease. Thus, the range of rotational speed was selected based on trial experiments. The pulse-on time was varied between 2 and 7 s. The present range was selected because subjecting the workpiece to ultrasonic vibrations for pulse-on time of more than 7 s did not yield any further improvement in surface finish of copper alloy. The lower range of pulse-on time was selected as 2 s so that sufficient time is provided for the system to vibrate and settle. Figure 5 shows that decreasing the feed rate below 2.5 mm/min did not result in any appreciable change in surface finish; thus, for all experiments, a feed rate of 2.5 mm/min was selected. In this study, working gap, rotational speed, and pulse-on time were selected as the process factors. The levels of the process factors selected in this study are given in Table 3. Experiments were designed and performed to evaluate the performance of the ultrasonic-assisted DDMAF process on the two materials.
Selected process parameters with respective ranges.
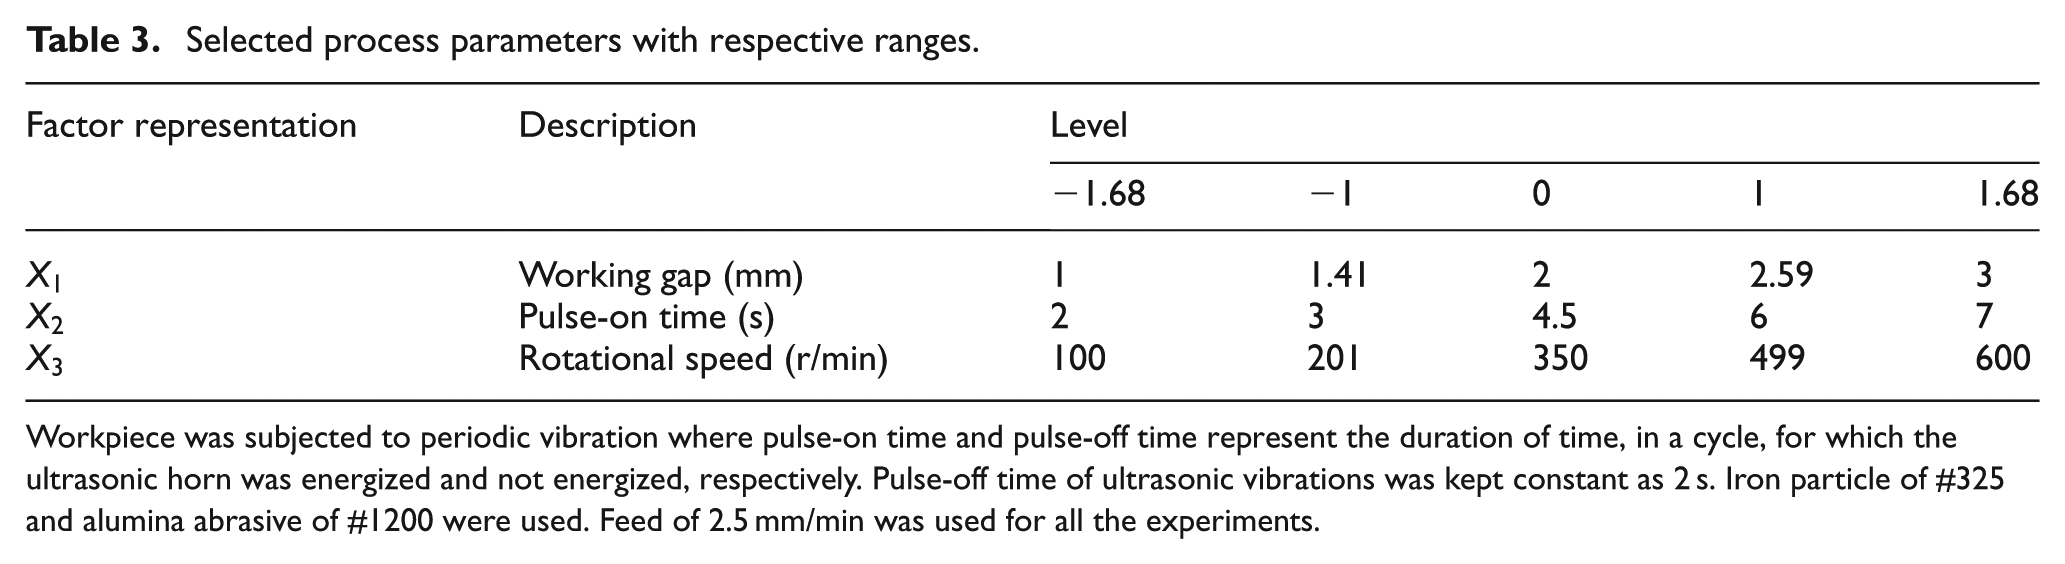
Workpiece was subjected to periodic vibration where pulse-on time and pulse-off time represent the duration of time, in a cycle, for which the ultrasonic horn was energized and not energized, respectively. Pulse-off time of ultrasonic vibrations was kept constant as 2 s. Iron particle of #325 and alumina abrasive of #1200 were used. Feed of 2.5 mm/min was used for all the experiments.
Designing the experiments is a very crucial step in most of the practical studies. The aim of performing experiments is to establish a relation between the process parameters and the response or output. Orthogonal arrays and central composite design methodology are commonly used techniques which involves smaller number of experimentation and still yields results with good accuracy in the range within which experiments are performed. Orthogonal arrays are used to predict a first-order behavior of the response for a narrower range of process factors, whereas central composite design is used to predict a second-order behavior of the response for a wider range of process factors. Therefore, central composite design technique has been selected for this study to obtain a second-order model.
The central composite design technique is also called as response surface methodology and yields the response equation of the following form
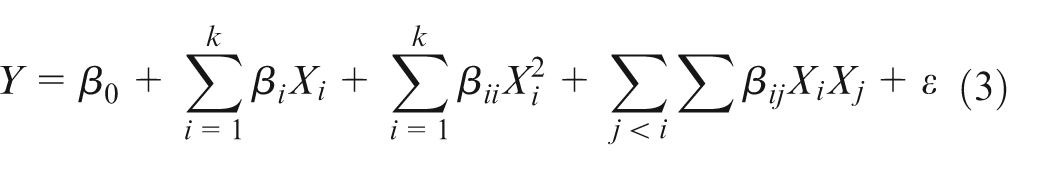
where
Since the present operation is finishing operation, the response variable should be selected which would represent the change in surface roughness. The initial surface roughness of the grounded workpieces was not the same for all the workpieces. Therefore, in order to compensate for the variation of surface roughness, the ratio of the change in surface roughness to the initial surface roughness was selected as the response which was calculated as
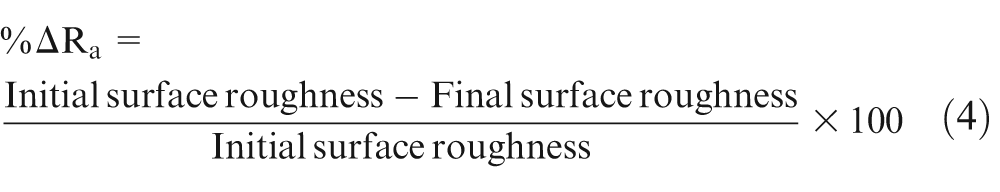
The initial surface of the ground workpieces was calculated by taking average at three random positions. For the finished workpieces, the surface roughness values at same three positions were obtained with the help of a template and then averaged out to yield a single value that represented the surface finish of that particular sample. The surface roughness values were measured using a surface profilometer Talysurf 6.0 (Z-resolution 16 nm; Taylor Hobson, UK) for a sample length of 2 mm.
Based on the above inputs, the experiments were performed in the manner described in Table 4. The corresponding surface roughness values and the percentage changes in surface roughness were evaluated using equation (4) for two workpiece samples and are presented in Table 4.
Details of experiments performed with corresponding response variable for each type of workpiece (the average surface roughness of grounded workpieces varied between 0.3127 and 0.3923 μm for both types of workpieces).
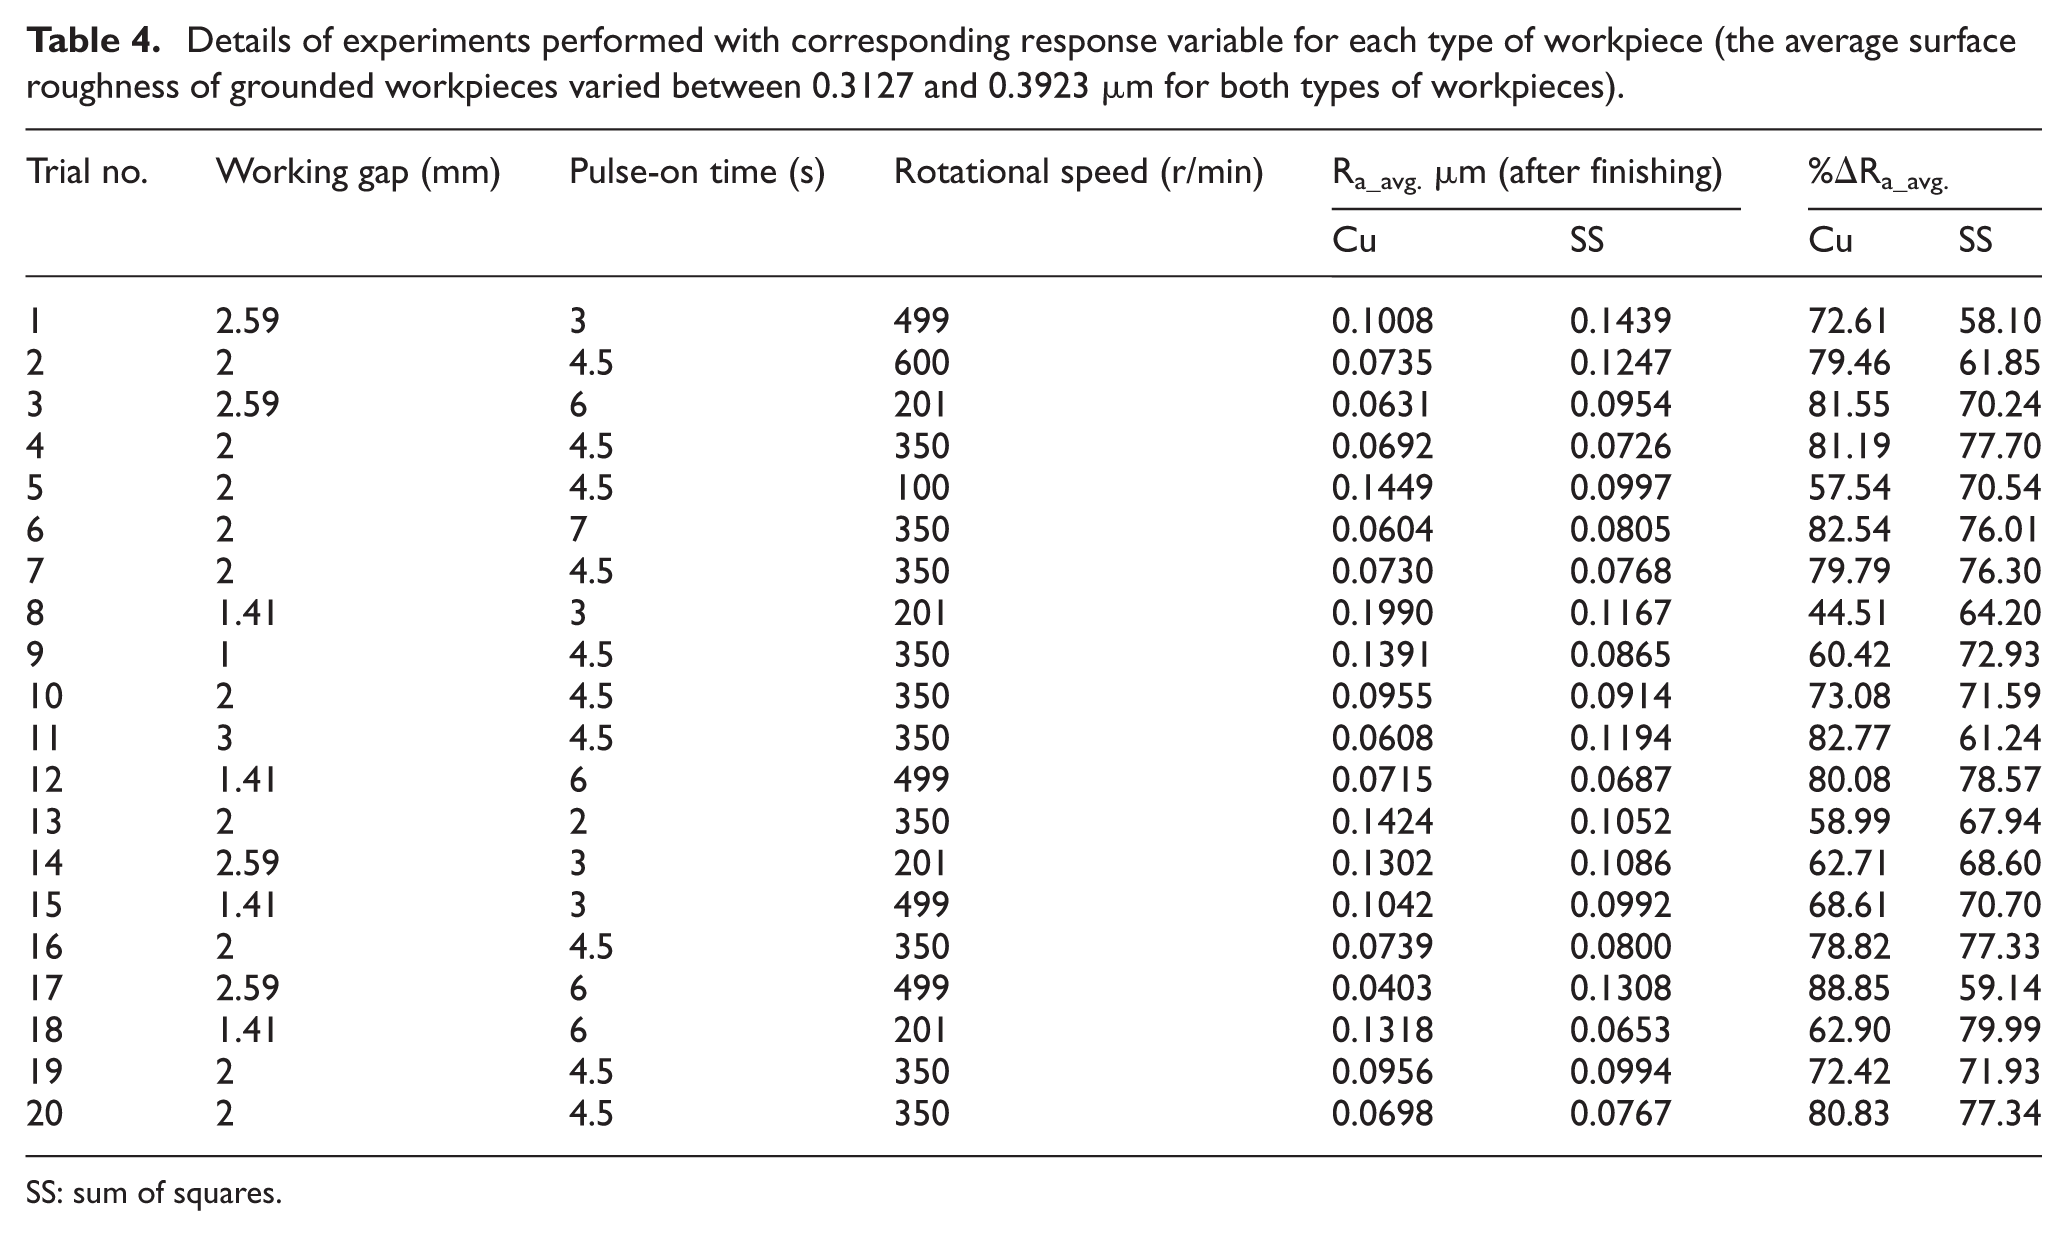
SS: sum of squares.
Modeling of process response
Generally, second-order models for predicting %ΔRa as functions on the process factors were obtained for copper alloy and stainless steel workpieces. These models were obtained by performing regression analysis on the experimental data shown in Table 4.
Copper alloy workpiece
The %ΔRa obtained for copper alloy samples, shown in Table 4, was analyzed using ANOVA. The ANOVA performed initially included some insignificant terms which were removed, and the ANOVA was carried out again with significant terms. The obtained ANOVA table is shown in Table 5. The regression analysis was performed, and a model was obtained, which is given by equation (5)
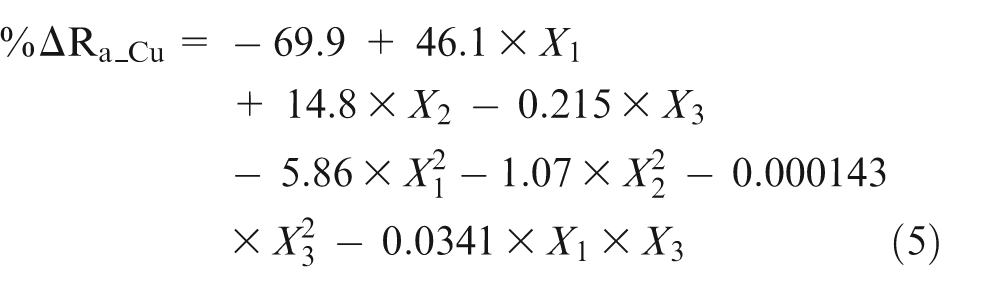
where
Analysis of variance (ANOVA) after deletion of insignificant terms for copper alloy samples.
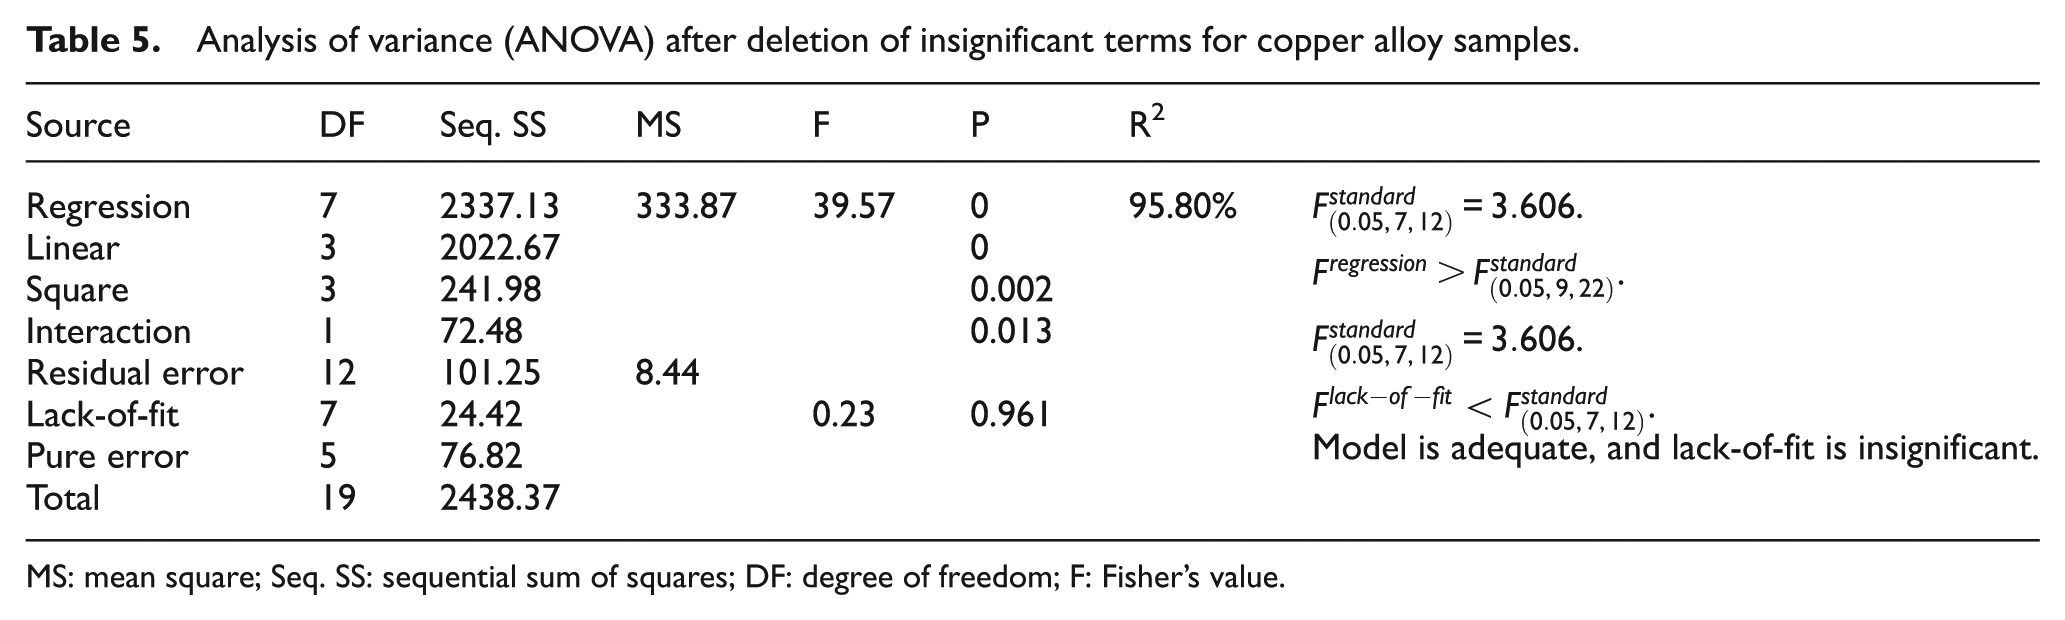
MS: mean square; Seq. SS: sequential sum of squares; DF: degree of freedom; F: Fisher’s value.
Stainless steel workpiece
The %ΔRa obtained for stainless steel samples, shown in Table 4, was analyzed using ANOVA. The ANOVA performed initially included some insignificant terms which were removed, and the ANOVA was carried out again with significant terms. The obtained ANOVA table is shown in Table 6. Based on the significant terms identified through ANOVA, a regression model was developed, which is represented by equation (6)
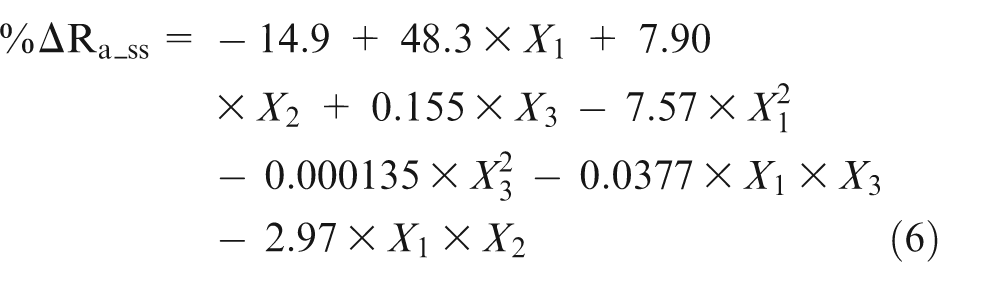
where
Analysis of variance (ANOVA) after deletion of insignificant terms for stainless steel sample.
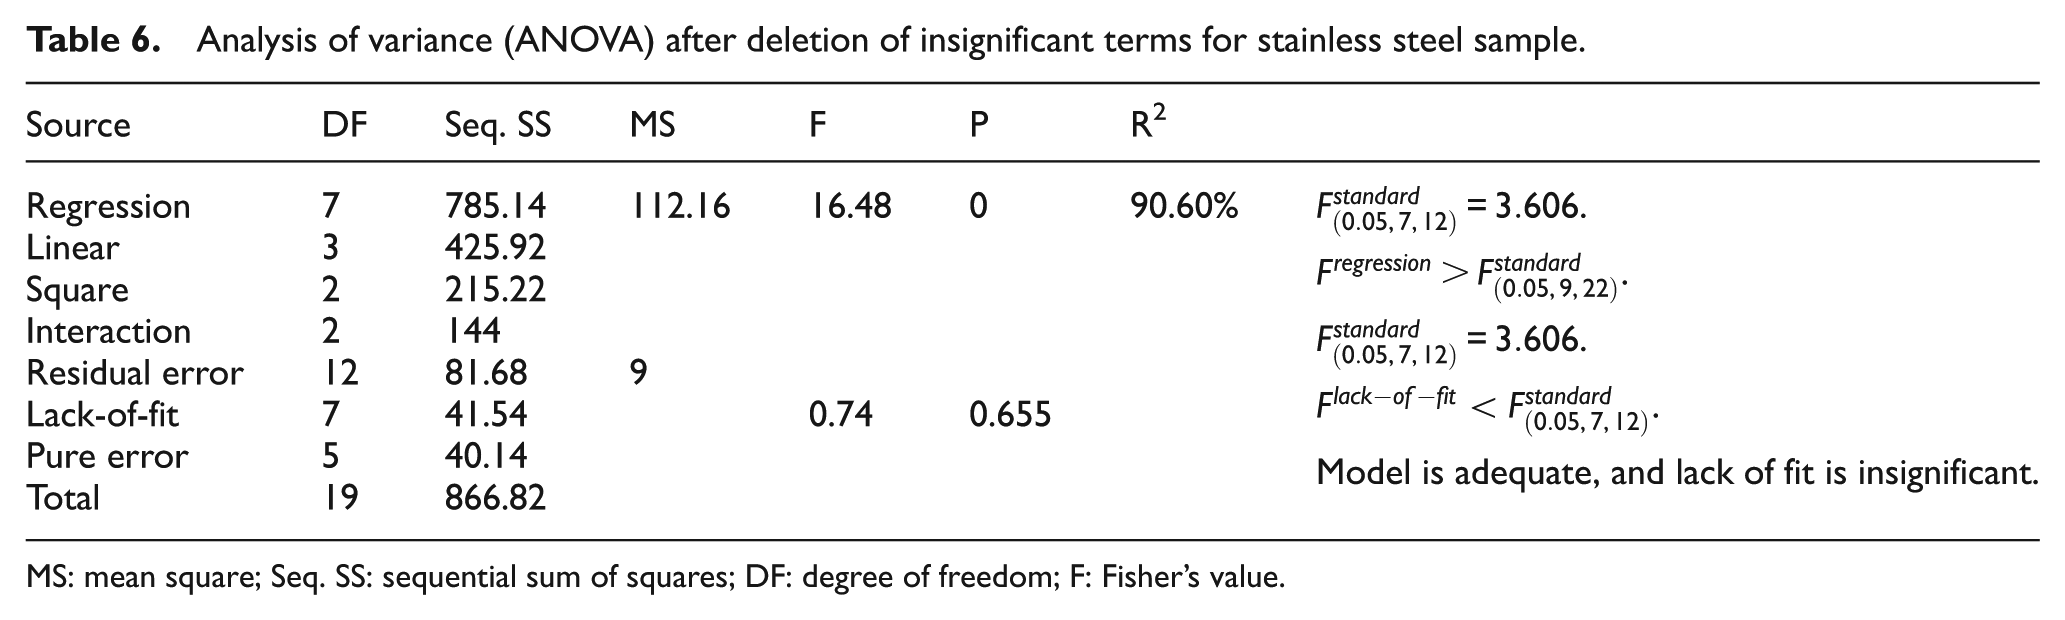
MS: mean square; Seq. SS: sequential sum of squares; DF: degree of freedom; F: Fisher’s value.
The percentage change in surface roughness predicted by these models may vary within certain range due to noise present in the experiments and is given by the following equation
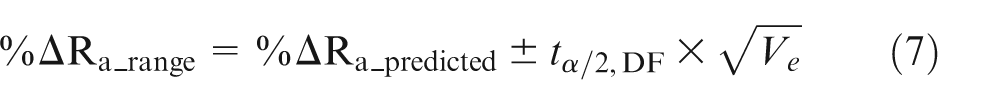
where
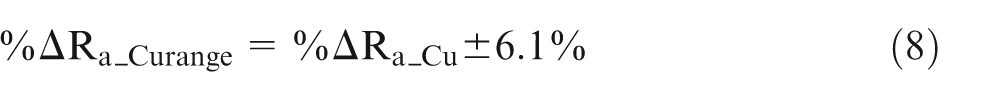
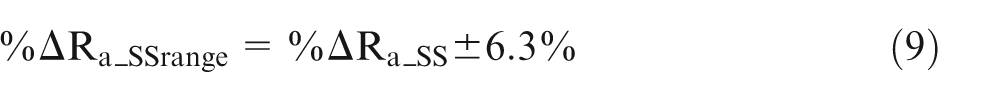
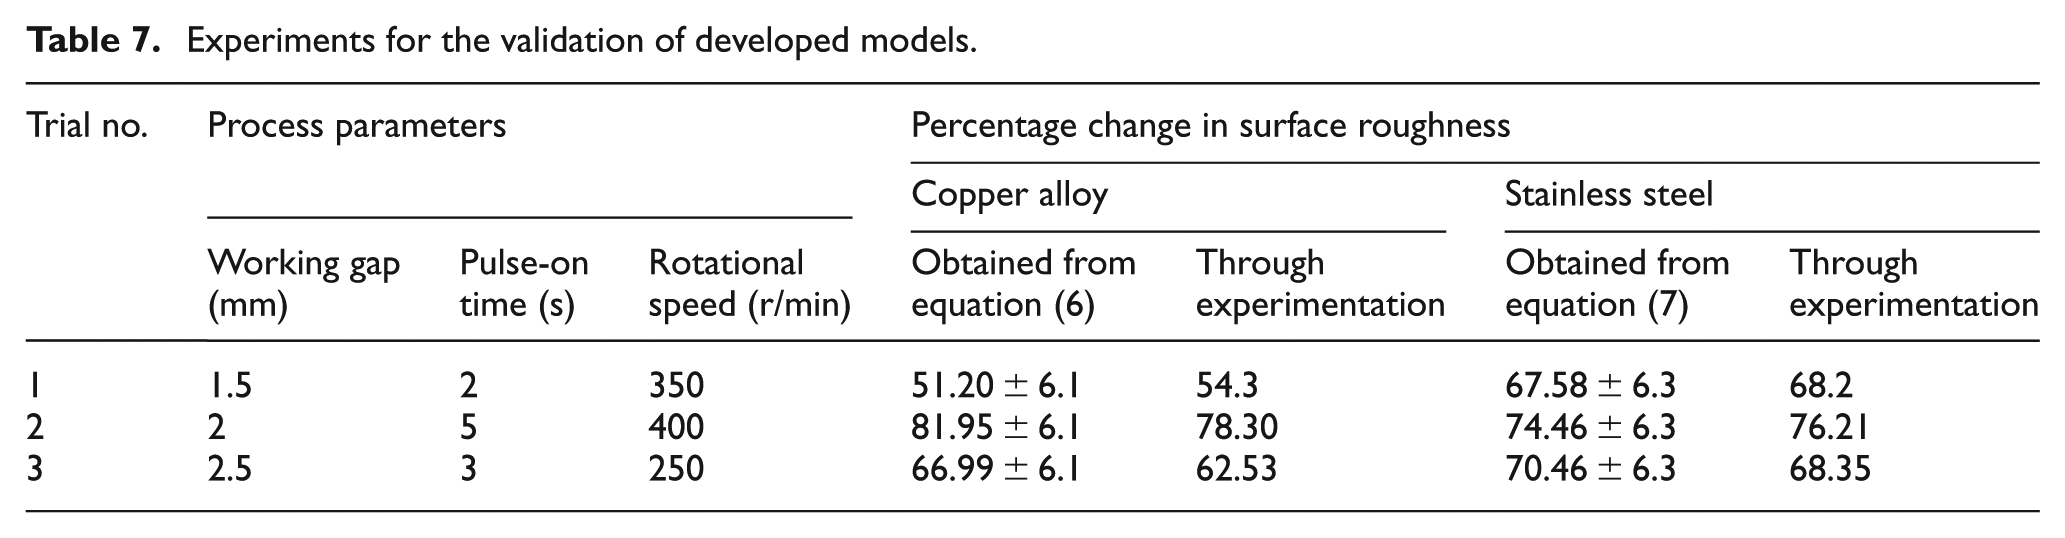
In order to validate the developed models, few experiments (other than those performed earlier (given in Table 4)) were conducted, and the details are provided in Table 7. From Table 7, it can be seen that the experimental values of percentage change in surface roughness are within the range predicted by the two response function.
Experiments for the validation of developed models.
Results and discussion
This section discusses the effect of process parameters and interaction effects based on the finishing experiments conducted for the two workpiece materials.
Main effect of process factors
The main effect plot and the percentage contribution of significant factors are shown in Figure 6 for copper alloy and in Figure 7 for stainless steel workpiece. From these figures, it can be seen that each process parameter behaves differently for the two work materials. The reasons for the different behavior of the process factors have been discussed in detail in the following section. The graphs in the following section have been plotted using equations (5) and (6), which adequately represents the process behavior within the considered range of process factors.
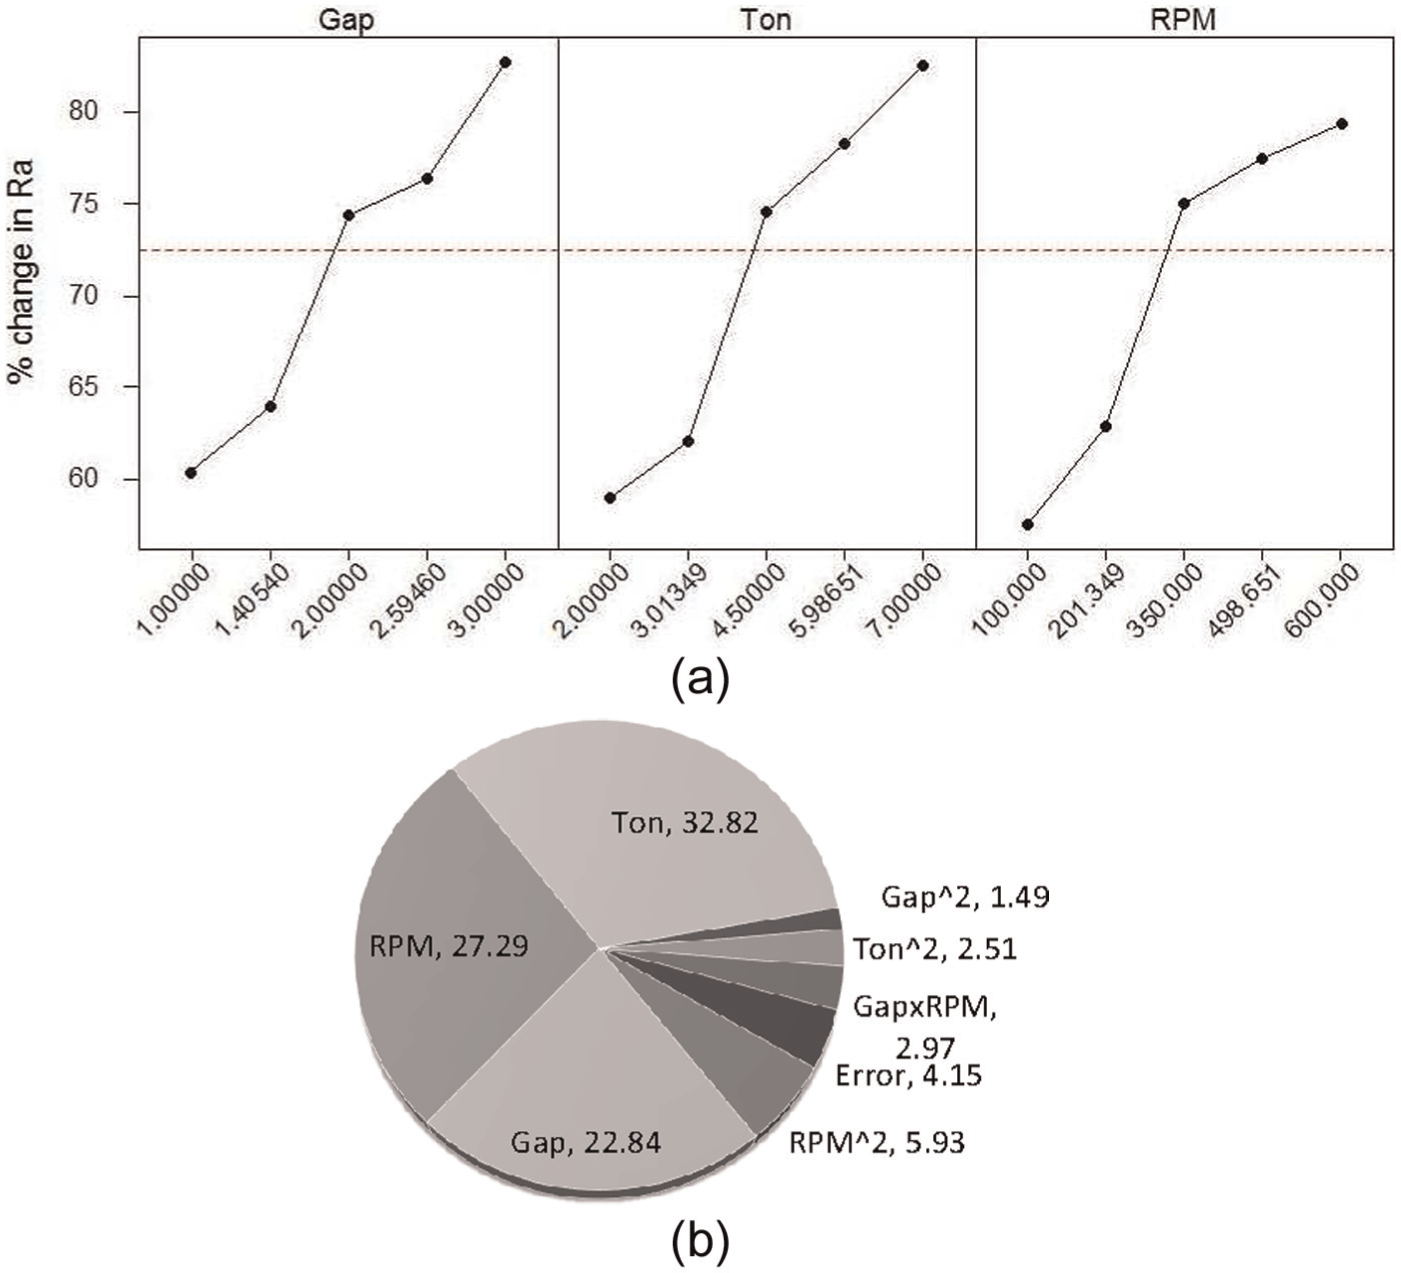
(a) Main effect plot and (b) percentage contribution plot of significant terms for finishing of copper alloy samples.
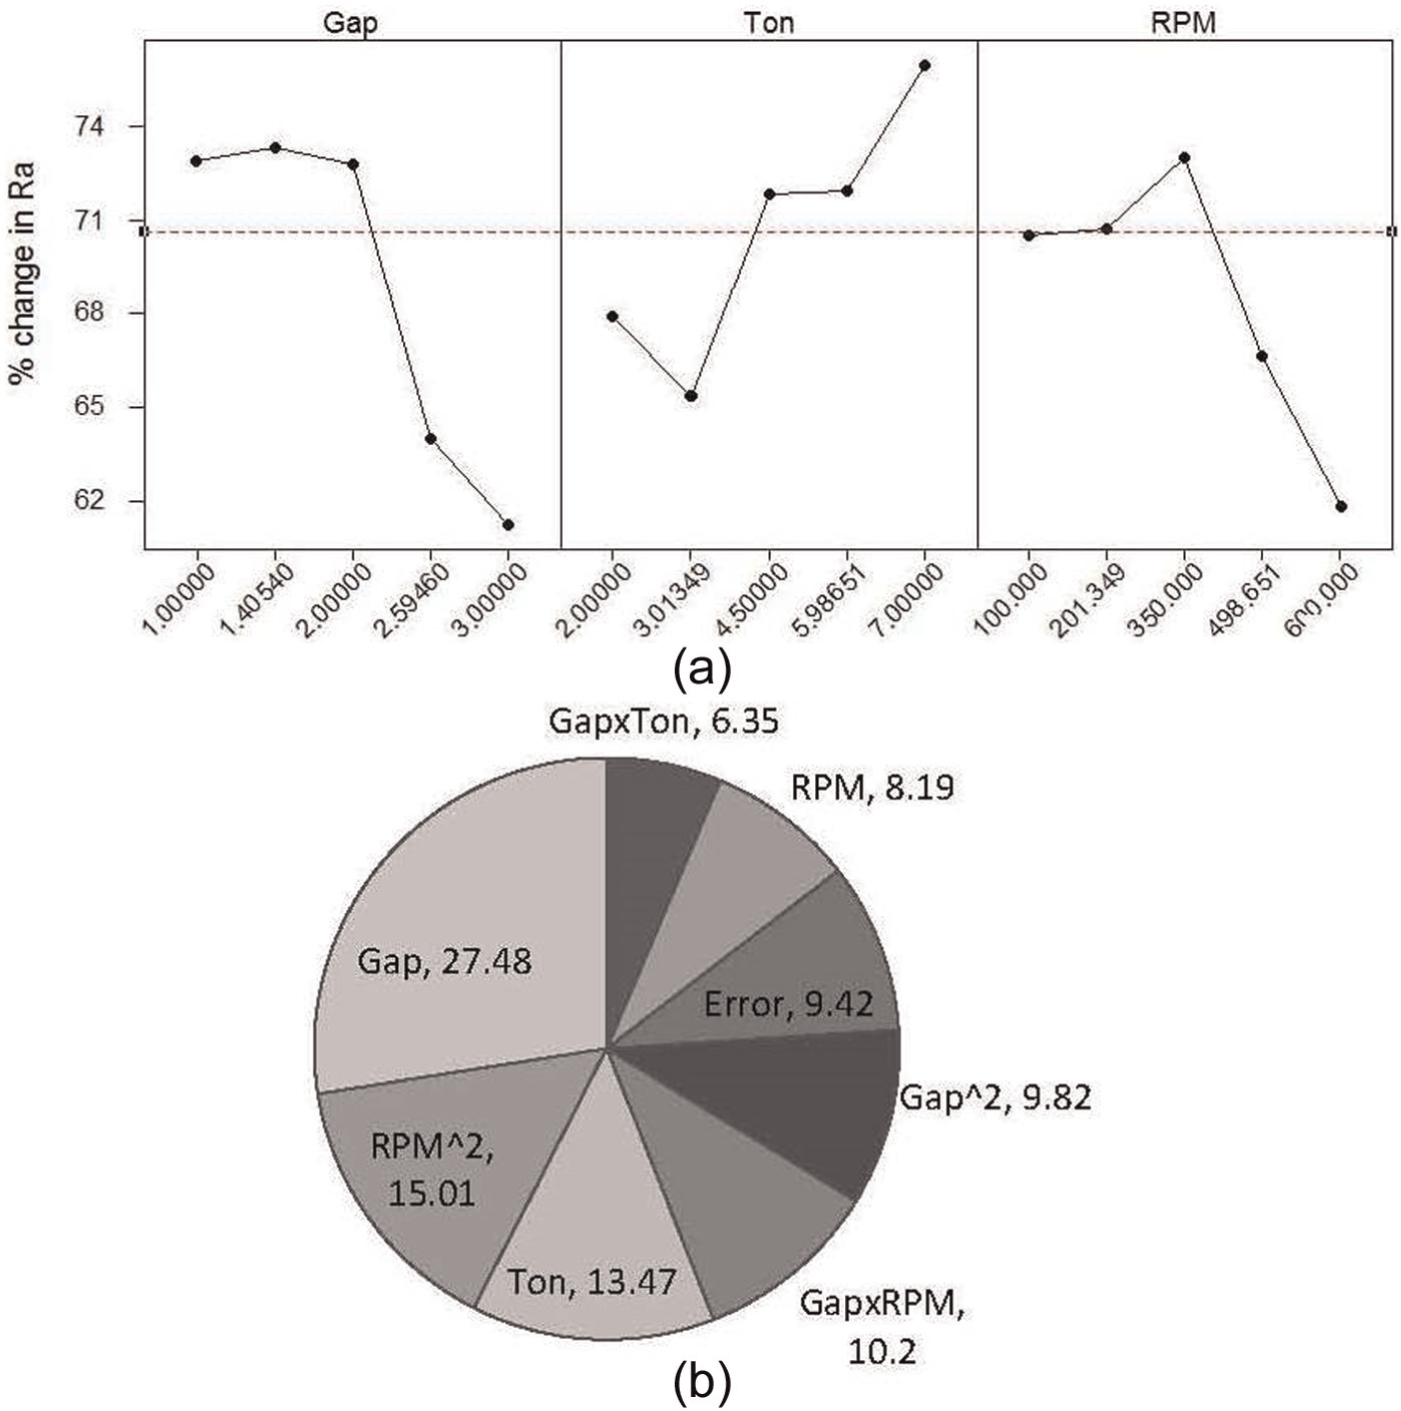
(a) Main effect plot and (b) percentage contribution plot of significant terms for finishing of stainless steel samples.
Effect of working gap
The effect of working gap on %ΔRa in the case of copper alloy and stainless steel is shown in Figure 8. This figure shows that while finishing the copper alloy workpiece, a better %ΔRa is observed at a higher working gap, while in the case of stainless steel workpiece, a better %ΔRa is observed at lower working gap. This may be because stainless steel being relatively a hard material and may require higher indentation force to cause an optimum indentation depth for effective finishing which can be obtained with high magnetic flux density at lower working gap. 19 However, the same magnitude of indentation force may cause an excessive indentation on a soft workpiece, thus deteriorating the surface finish. From Figure 8, it can be observed that for stainless steel, the %ΔRa drops as the working gap is increased. This may be because as the working gap is increased, the total available magnetic force which causes indentation decreases, thus causing a drop in the %ΔRa. 19 Whereas for copper alloy workpiece, the %ΔRa initially increases as the working gap is increased, but after a certain value of working gap, further increase results in drop in %ΔRa. This may be because at the lower working gap, the available magnetic indentation force may be causing an excessive indentation resulting in a rough surface. However, as the working gap is increased, the available magnetic indentation force decreases causing relatively less indentation on the workpiece which appears as a improvement in %ΔRa. The %ΔRa shows a drop after a certain value of working gap in the case of copper alloy and may be because at higher working gap, the available magnetic indentation force may be small enough to cause a proper indentation. The percentage contribution of the process parameters shown in Figure 7(b) indicates that the working gap has maximum contribution for producing a greater %ΔRa for stainless steel when compared with copper alloy.
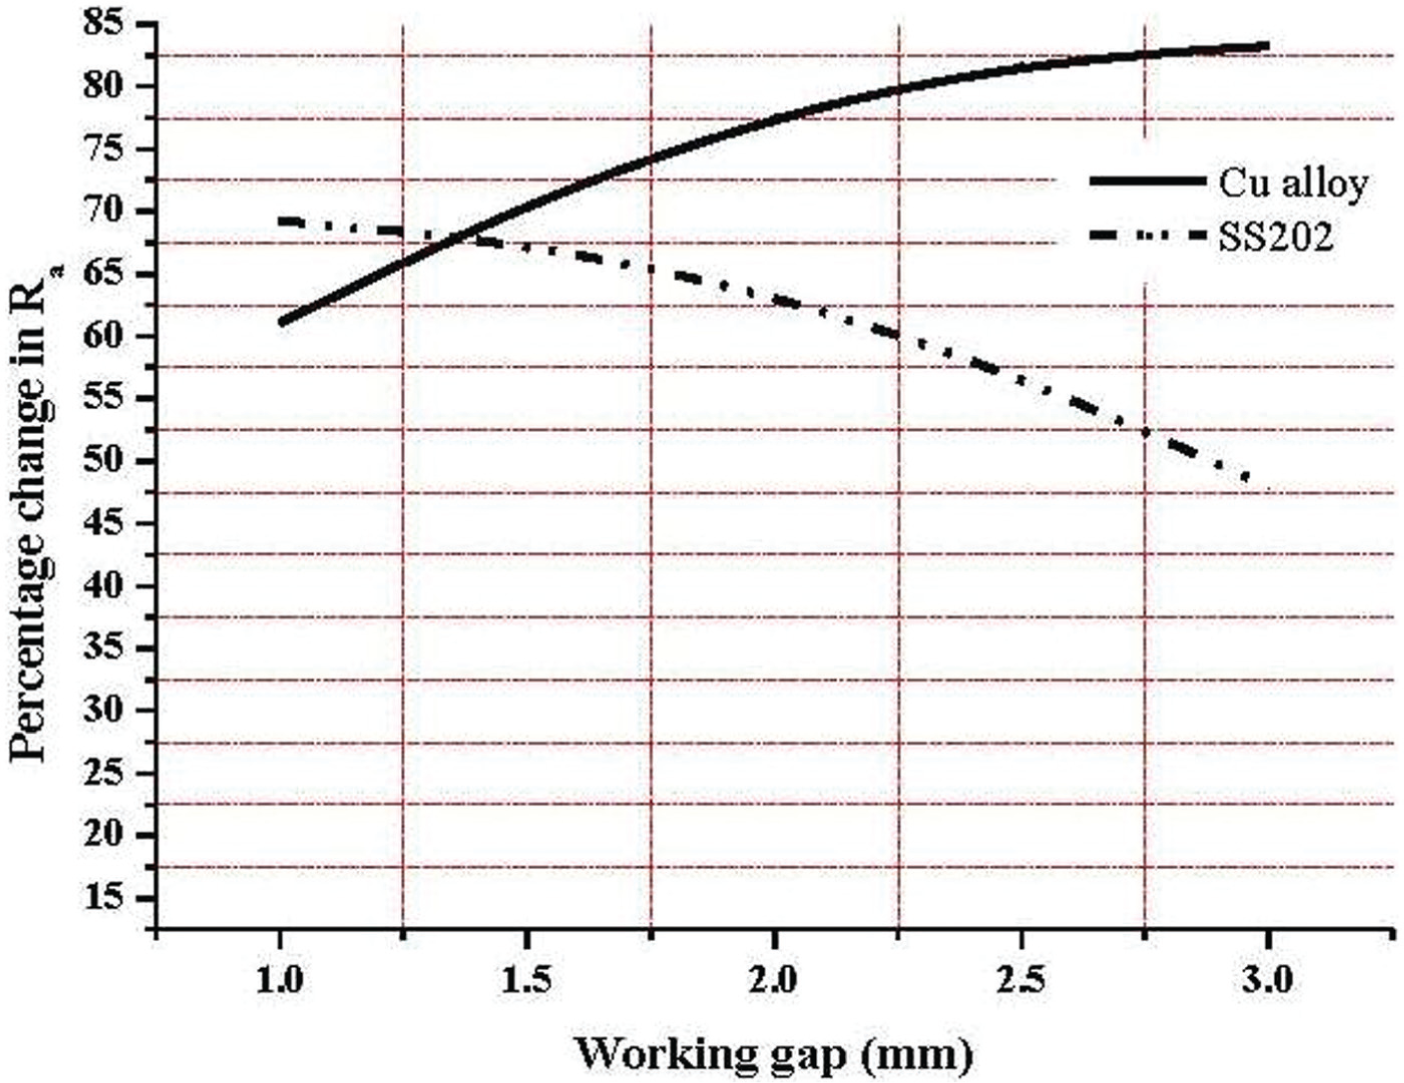
Effect of working gap on percentage change in surface roughness for copper and stainless steel (rotational speed = 350 r/min and pulse-on time = 5 s were kept constant).
Effect of rotational speed
The effect of varying rotational speed on %ΔRa for copper alloy and stainless steel is shown in Figure 9. For both the materials, hard and soft, the %ΔRa first increases with increase in rotational speed and then decreases after a certain rotational speed. The increase in %ΔRa can be associated with the fact that as the rotational speed increases, the collision between FMAB and the workpiece surface per unit time increases. 19 However, after a certain value of rotational speed, the %ΔRa starts decreasing because at higher rotational speed, the FMAB chains start breaking due to insufficient centripetal force and cause the normal force acting on the surface to decrease. 20
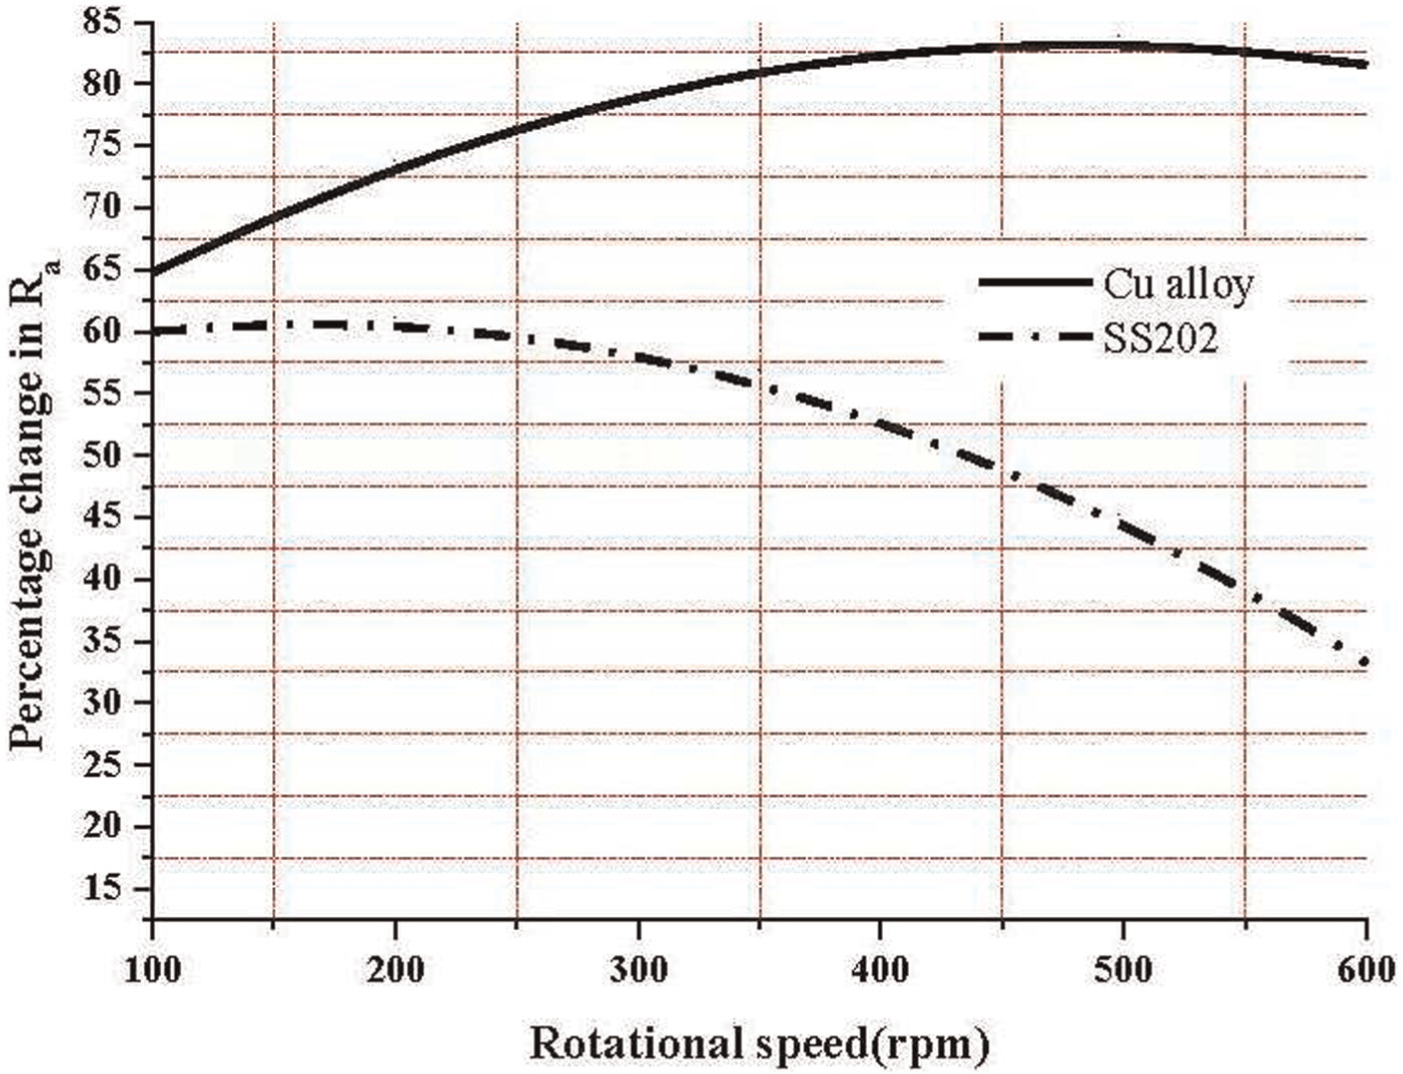
Effect of varying the rotational speed on percentage change in surface roughness for copper and stainless steel (working gap = 2 mm and pulse-on time = 5 s were kept constant).
It can also be observed from Figure 9 that for a hard material such as stainless steel, the drop in %ΔRa occurs earlier, as compared to a soft material such as copper alloy. This could be because for a hard material, minimum amount of normal force must be necessary for providing proper indentation, while for a soft material, the normal force required to produce similar indentation would be less. Thus, for a soft material such as copper alloy, the drop in %ΔRa is seen at even higher rotational speed as compared to that of a hard material. The percentage contribution of rotational speed in achieving better %ΔRa (Figure 7(b)) reveals that for a soft material, rotational speed plays a dominant role as compared to a hard material.
Effect of pulse-on time
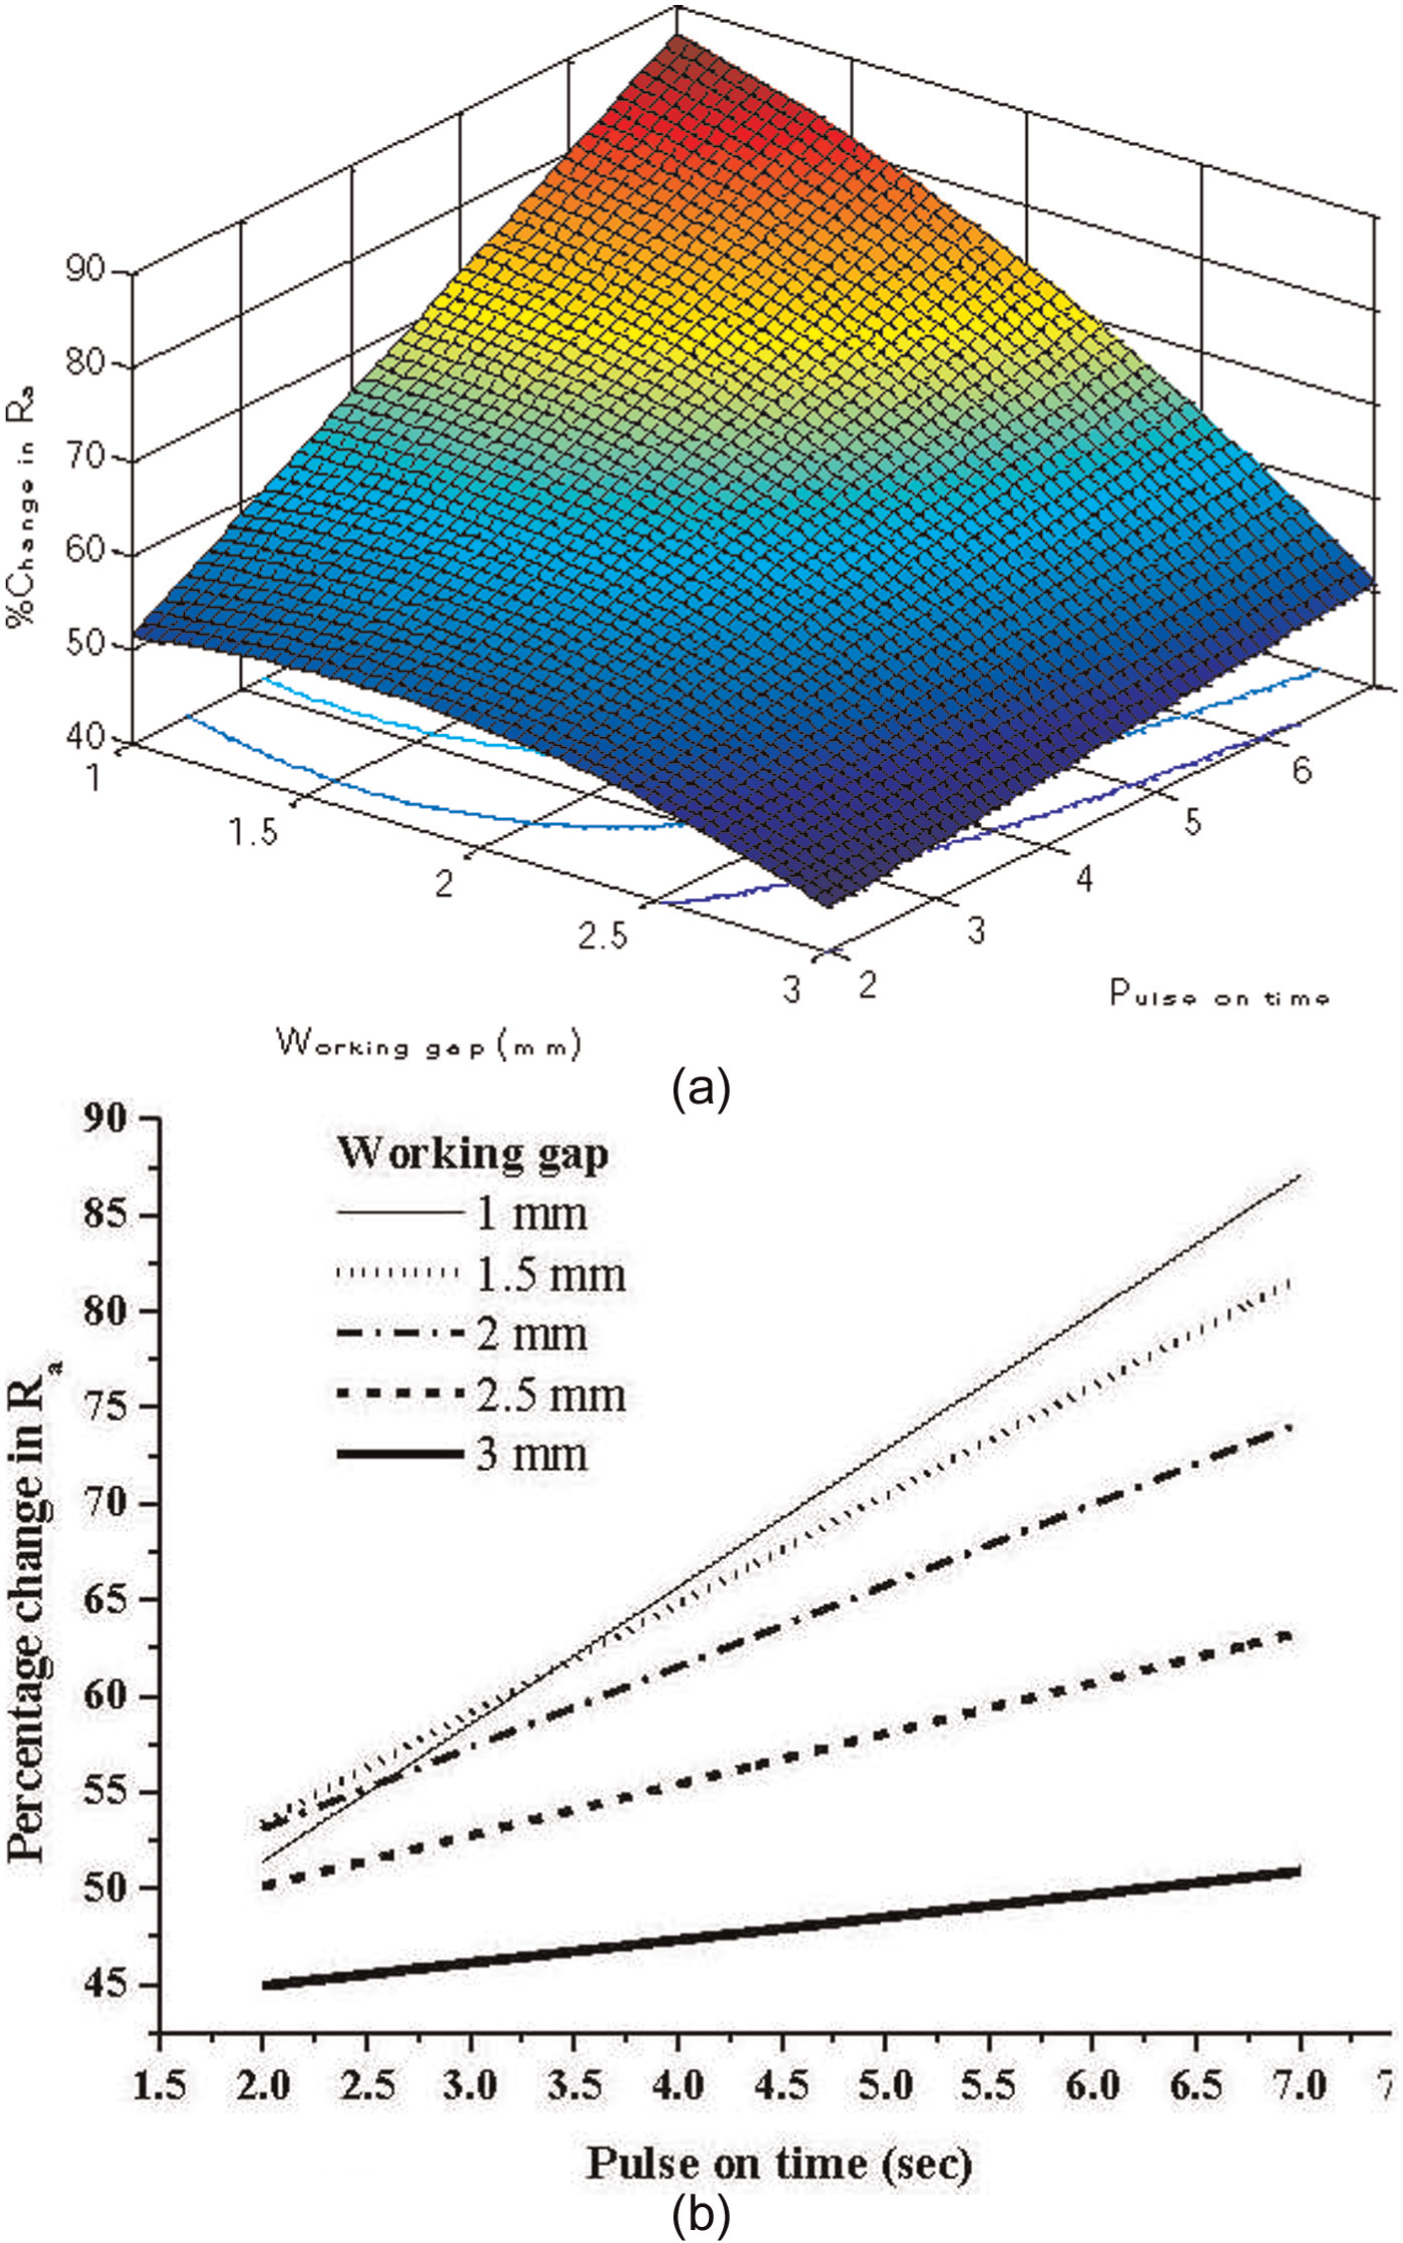
Effect of varying the ultrasonic vibrations pulse-on time on %ΔRa for both the materials can be seen in Figure 10. From this figure, it can be observed that for a hard material such as stainless steel, the trend followed by the pulse-on time is linear, 20 and for a soft material such as copper alloy, the trend followed by the pulse-on time is quadratic in nature. This could be because the peaks present at the surface of soft workpiece would be sheared off easily and at higher rate. 21 The effectiveness of ultrasonic vibrations gradually reduces. Therefore, for a soft material such as copper alloy, the %ΔRa rises initially, and later on, it starts saturating, while in the case of a hard material such as stainless steel, because of high strength of work material, peaks present at the workpiece surface are difficult to shear. Thus, the pulse-on time shows a constant increase for the considered range of pulse-on time. In addition to these individual effects of the process factors on %ΔRa, some significant and different interaction effects were observed, which were due to difference in mechanical properties 21 and are discussed below.
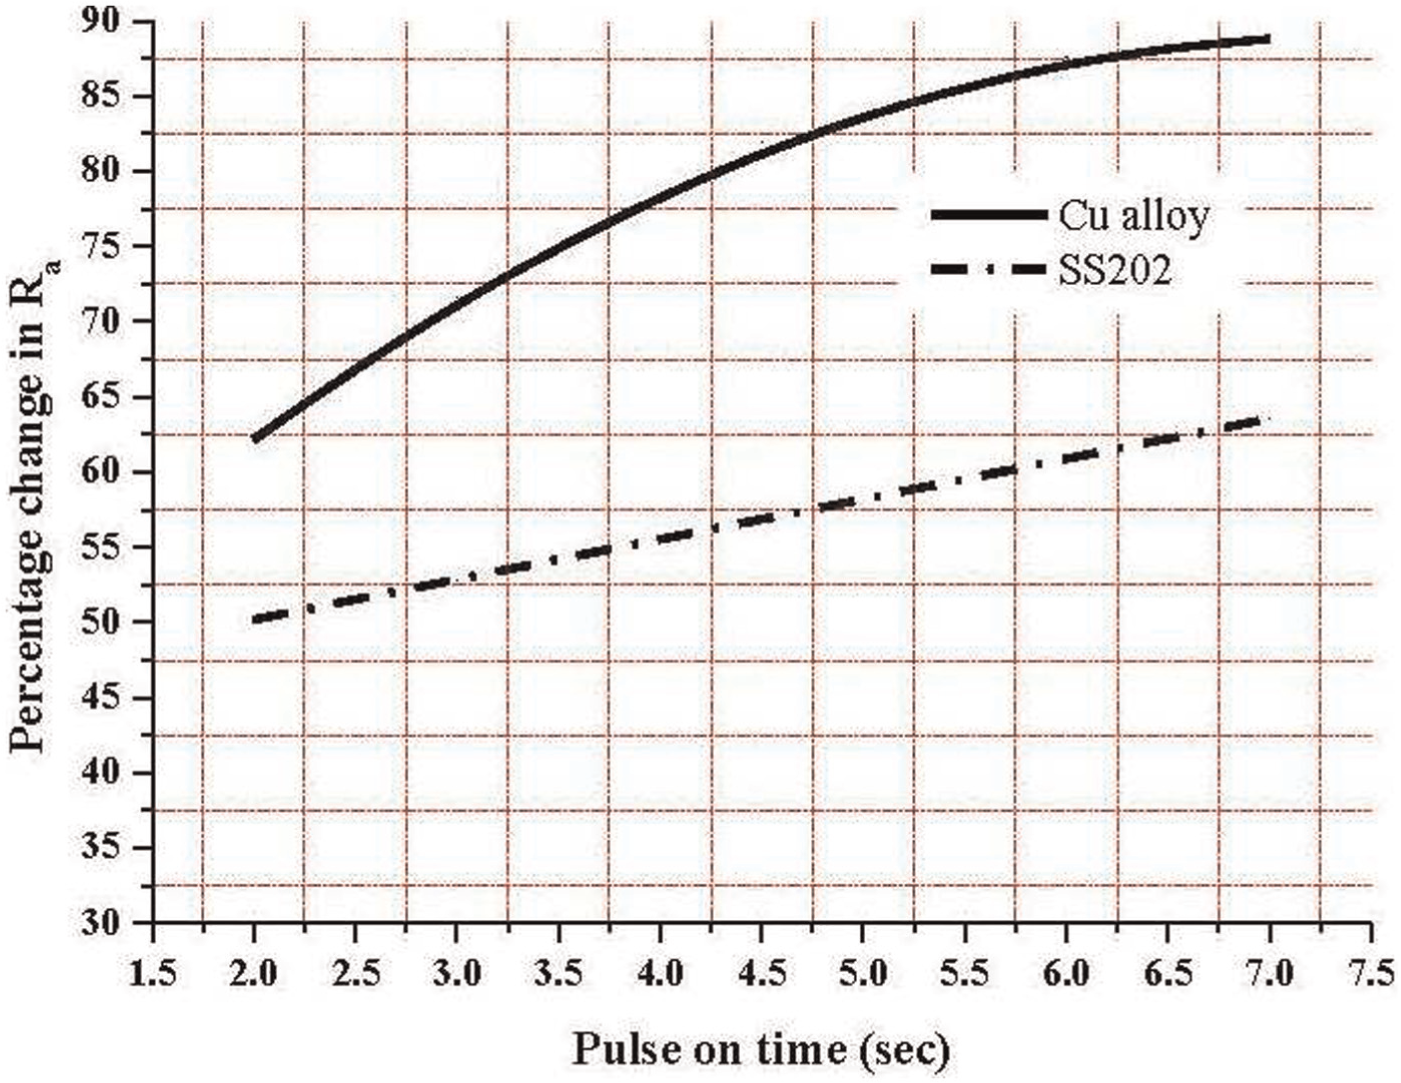
Effect of pulse-on time on percentage change in surface roughness for copper and stainless steel (working gap = 2 mm and rotational speed = 350 r/min were kept constant).
Interaction effects in finishing of copper alloy workpiece
The interaction effect between working gap and rotational speed for a soft material such as copper alloy can be seen in Figure 11. It can be observed that at lower working gap, an increase in rotational speed causes improvement in %ΔRa, while at higher working gap, an increase in rotational speed beyond a certain value results in drop in %ΔRa. This could be because at smaller working gap, the normal indentation force, which may be causing excessive indentation on workpiece surface, dominates the centripetal force on the blend of ferromagnetic and abrasive particles (MAPs). At this point, an increase in rotational speed may cause the normal indentation force to decrease, which results in an improvement in %ΔRa. However, at higher working gap, the indentation force causes an optimum indentation. An increase in rotational speed in this situation may cause centripetal force on the MAPs to dominate the normal indentation force. Due to which at higher rotational speeds, the MAPs may topple, resulting in an improper indentation which may result in decrease in %ΔRa.
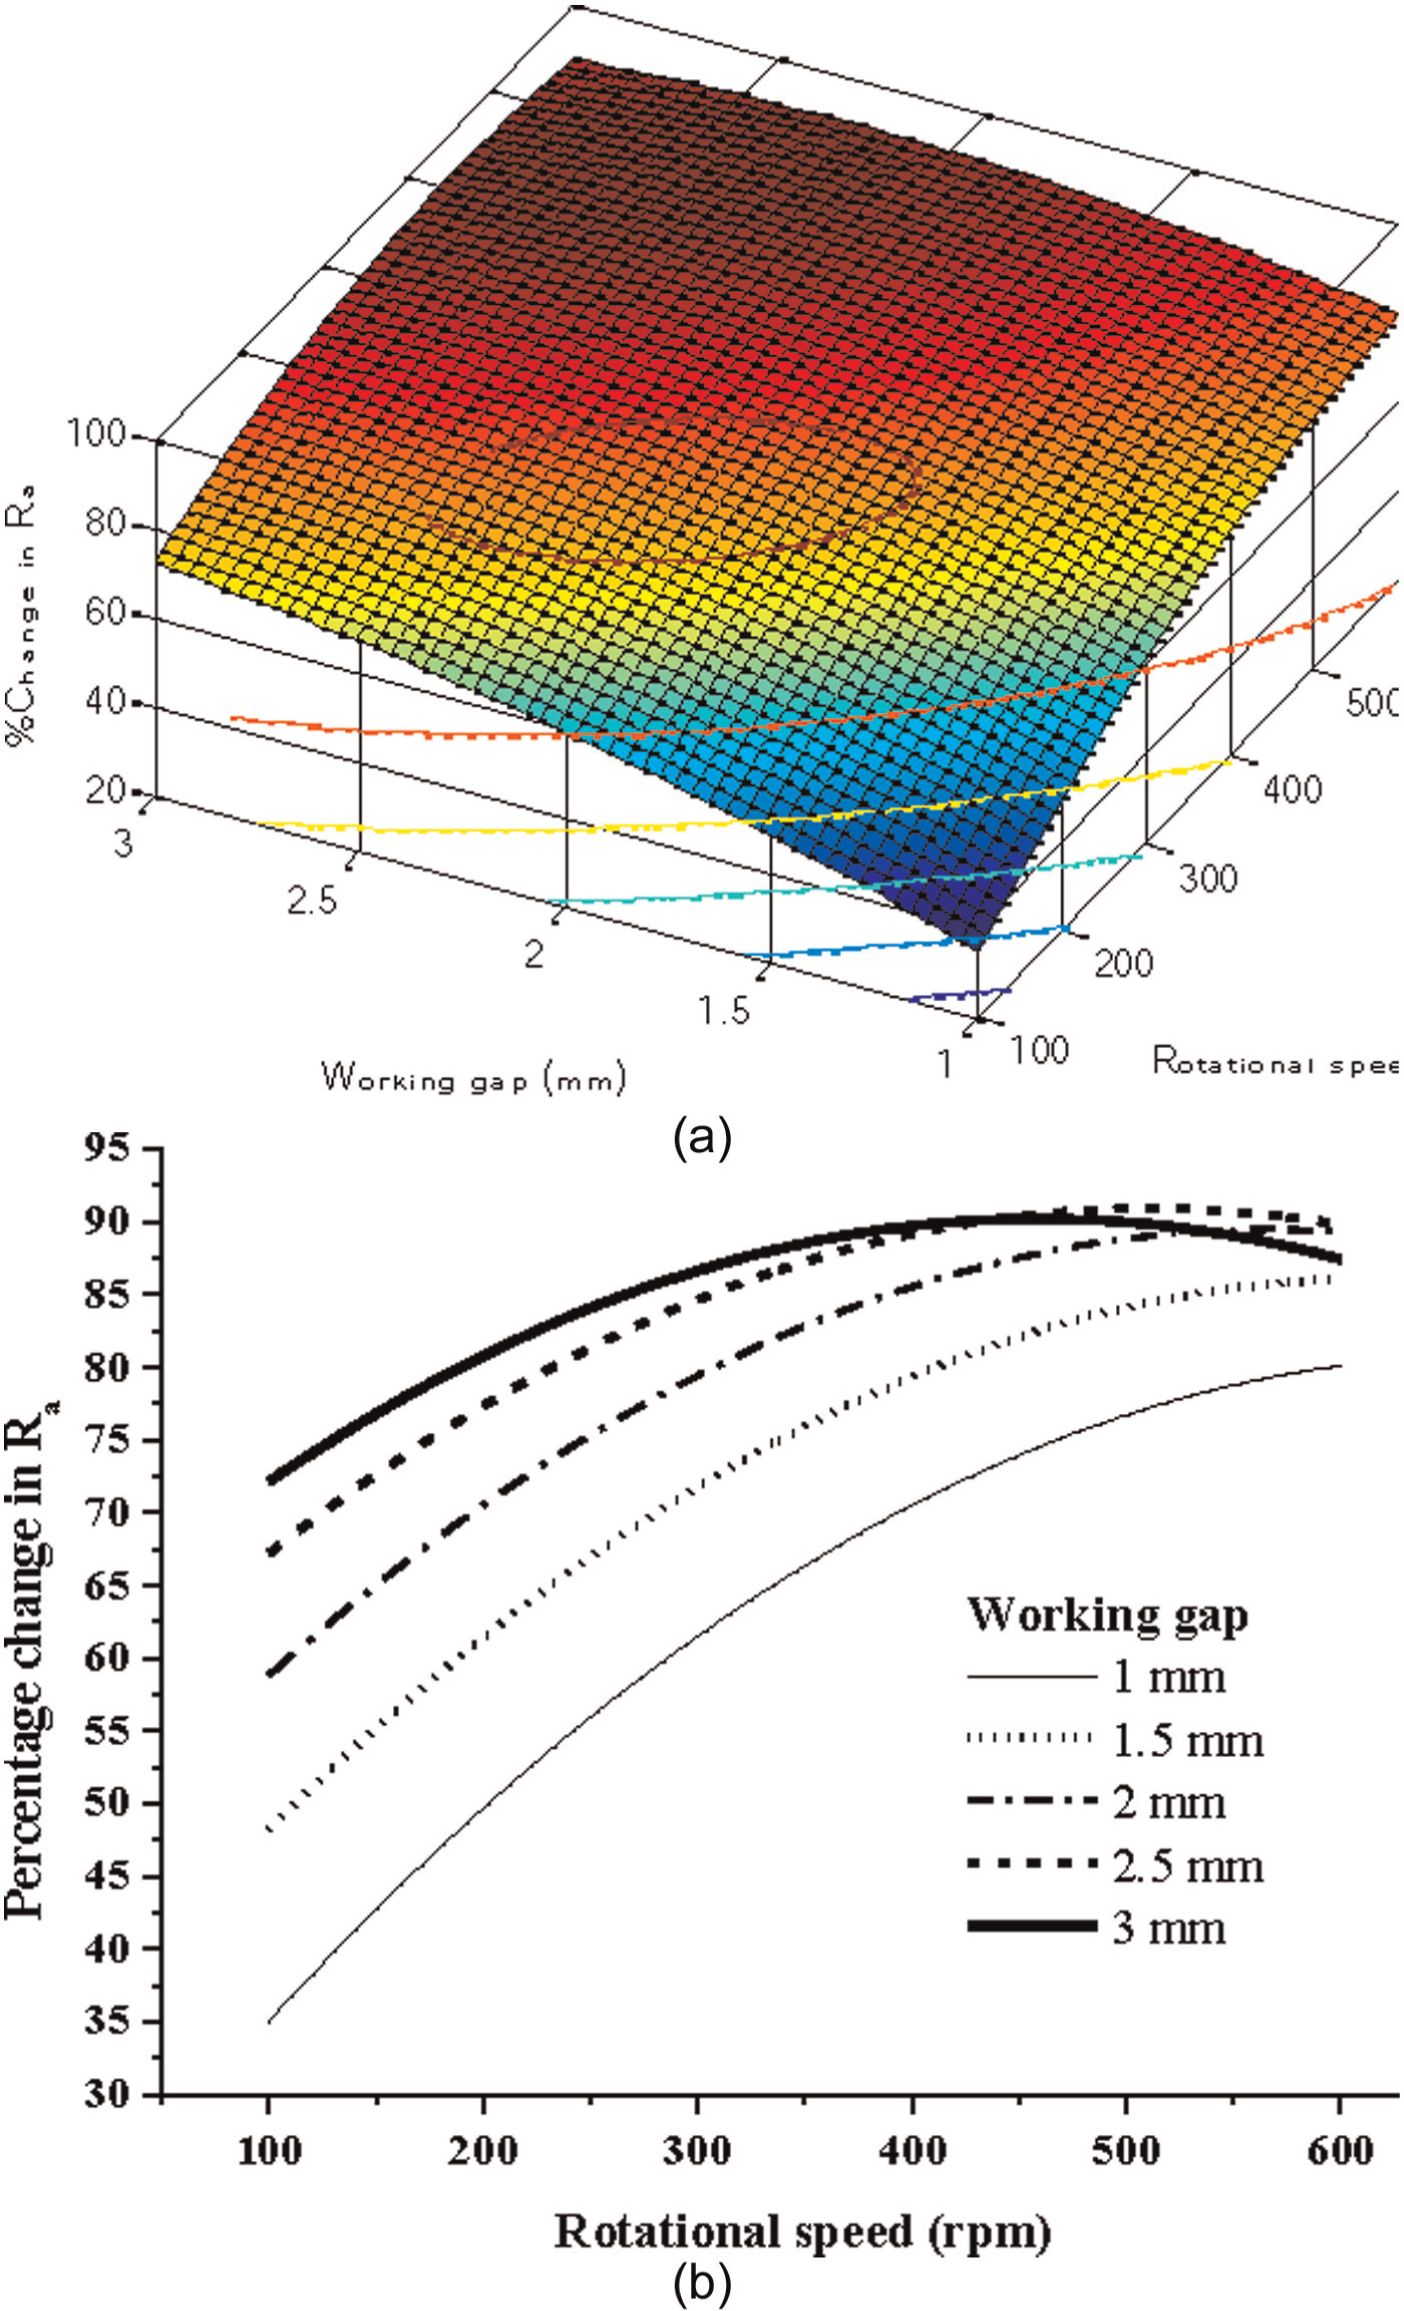
Interaction effect between working gap and rotational speed for copper alloy: (a) response surface for %ΔRa and (b) variation of %ΔRa with working gap and rotational speed (Ton fixed at 5 s).
Interaction effects in finishing of stainless steel workpiece
The interaction effect between working gap and rotational speed for a hard material such as stainless steel is shown in Figure 12. From this figure, it can be seen that in the case of hard material such as stainless steel, better %ΔRa is achieved at lower working gaps. This is because for a hard work material, high normal force is required to produce similar indentation as in soft materials. From Figure 12, it can be seen that at smaller working gap, the %ΔRa first increases and then decreases with the increase in rotational speed, while at higher working gap, the %ΔRa shows a continuous decrease with the increase in rotational speed. This may be because at lower working gap, the magnetic flux density is high which leads to a dominating indentation force. 22 However, with the increase in rotational speed, the centripetal force acting on the MAPs starts dominating. Thus, after a certain value of rotational speed, the centripetal force dominates the normal force causing MAPs to topple and thus cause ineffective indentation, 20 which results in decrease in %ΔRa. However, at higher working gap, the available normal force is already less. Thus, an increase in rotational speed in this situation causes the above phenomena of ineffective indentation to appear at much lower rotational speed.
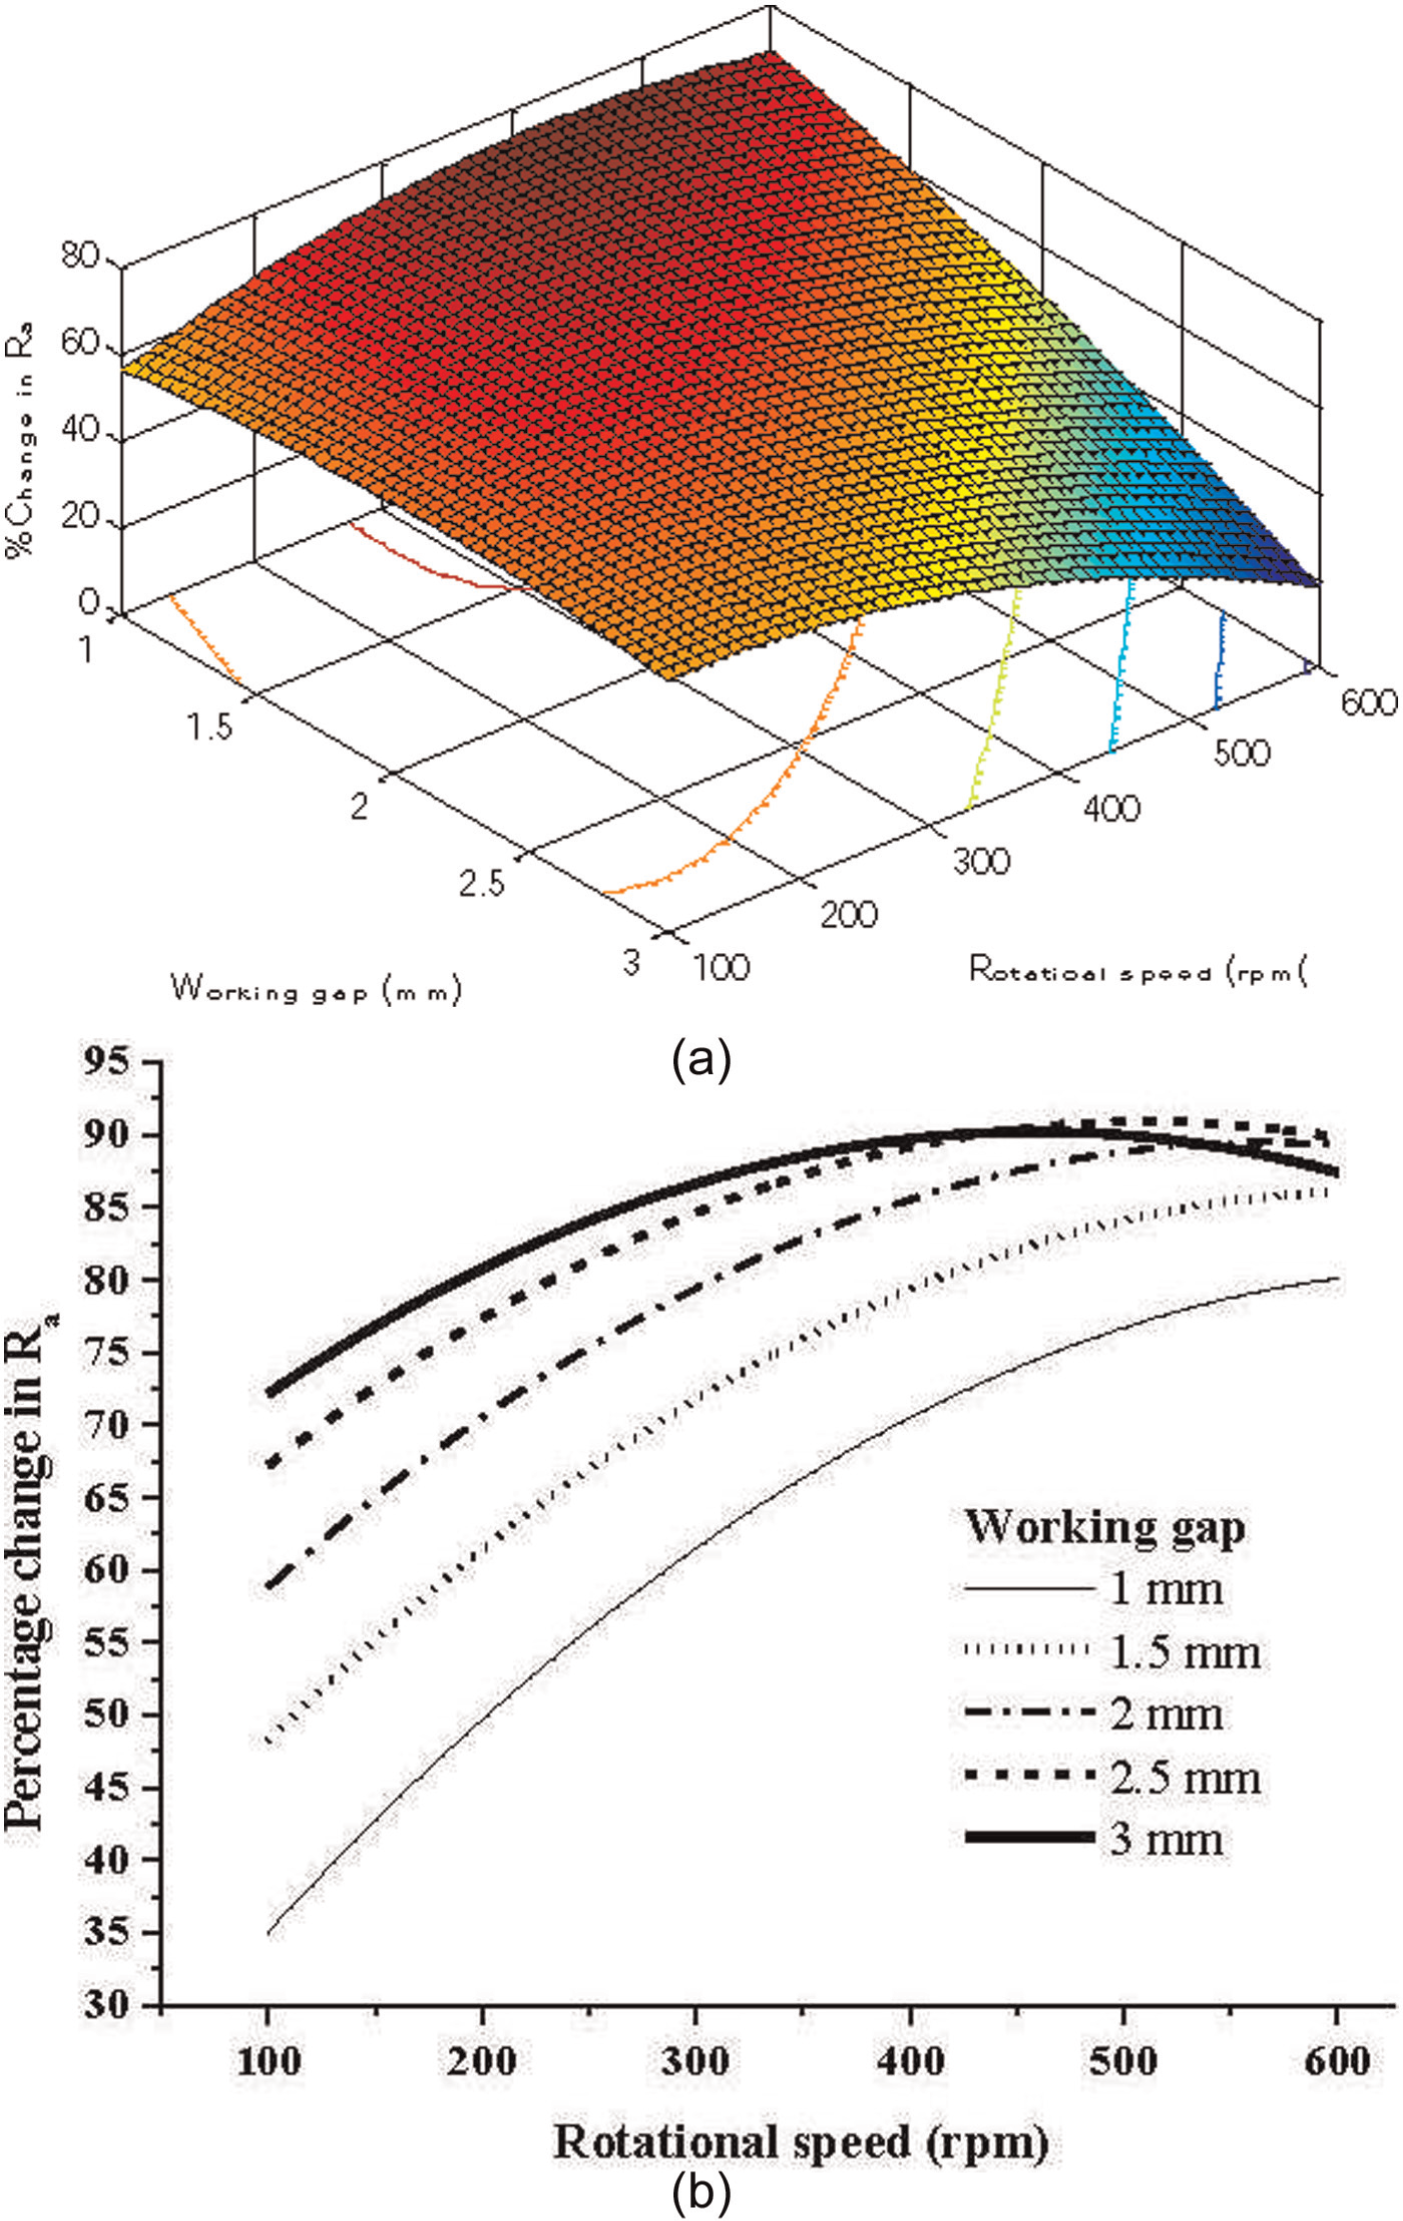
Interaction effect between working gap and rotational speed for stainless steel: (a) response surface for %ΔRa and (b) variation of %ΔRa with working gap and rotational speed (Ton fixed at 5 s).
The interaction effect between the working gap and pulse-on time in the case of a hard material such as stainless steel is shown in Figure 13. Figure 13 shows that at higher working gaps, the increase in pulse-on time results in less increase in %ΔRa, while at lower working gaps, the same amount of increase in pulse-on time causes a much higher increase in %ΔRa. The reason for the shift in the trend can be associated with the fact that at higher working gaps, the magnetic flux density in the gap is low, which results in the formation of FMAB chains that are less stiff, while in the case of the lower working gap, the magnetic flux density in the gap is more, and the FMAB chains so formed are stiffer. Now when the workpiece is subjected to ultrasonic vibrations, the impact of collision between the peaks present on the workpiece surface and the FMAB chains would be more if the chains formed are stiffer. Thus, at higher working gaps, the increase in pulse-on time causes relatively small increase in %ΔRa, while at lower working gap, as the pulse-on time is increased, a greater increase in %ΔRa is observed. The interaction effect between the working gap and pulse-on time for a soft material such as copper alloy was found to be insignificant. This could be because of the extra indentation caused by the abrasive particles at lower working gap which may be suppressing the effect created by the interaction effect between working gap and pulse-on time.
Interaction effect between working gap and pulse-on time for stainless steel: (a) response surface for %ΔRa and (b) variation of %ΔRa with working gap and pulse-on time (rotational speed fixed at 350 r/min).
Optimization of the process response
The obtained response function (statistical models) represented by equations (8) and (9) was optimized to maximize the response variable using genetic algorithm technique. The values of process parameters for which the given response function was optimized, within the considered range of process parameters, are presented in Table 8. The predicted values of %ΔRa by the developed models were validated by performing the experiments at the obtained values of process parameters on which the model was maximized.
Optimization of the process.
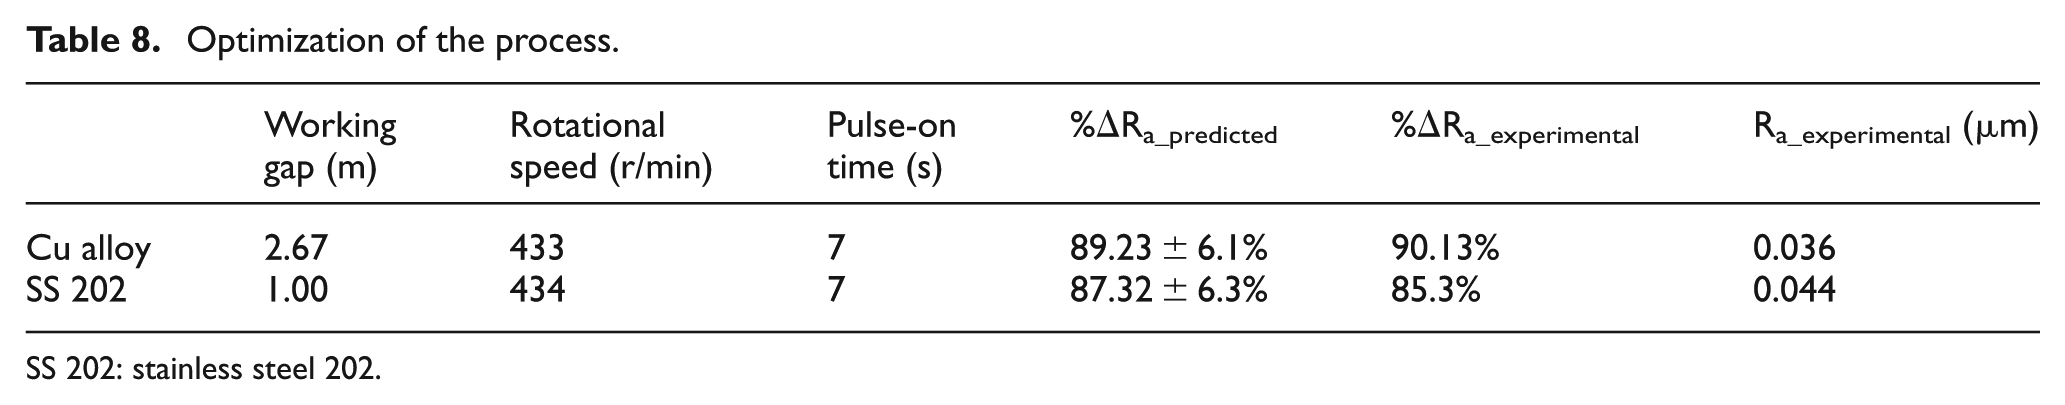
SS 202: stainless steel 202.
Three experiments were performed for each of the workpiece material, and the obtained surface roughness values were averaged for the two sets of experiments. The average initial surface roughness was 0.3772 and 0.3915 μm for copper alloy and stainless steel samples, respectively. The average surface roughness obtained for each set of experiments is shown in the last column of Table 8. The values so obtained were within the permissible limits as predicted by response function. Figure 14(a) and (c) shows the surface roughness micro-graphs of ground copper alloy and stainless steel workpieces, respectively, while Figure 14(b) and (d) shows the surface roughness micro-graphs of copper alloy and stainless steel workpieces, respectively, which were finished using ultrasonic-assisted DDMAF process.
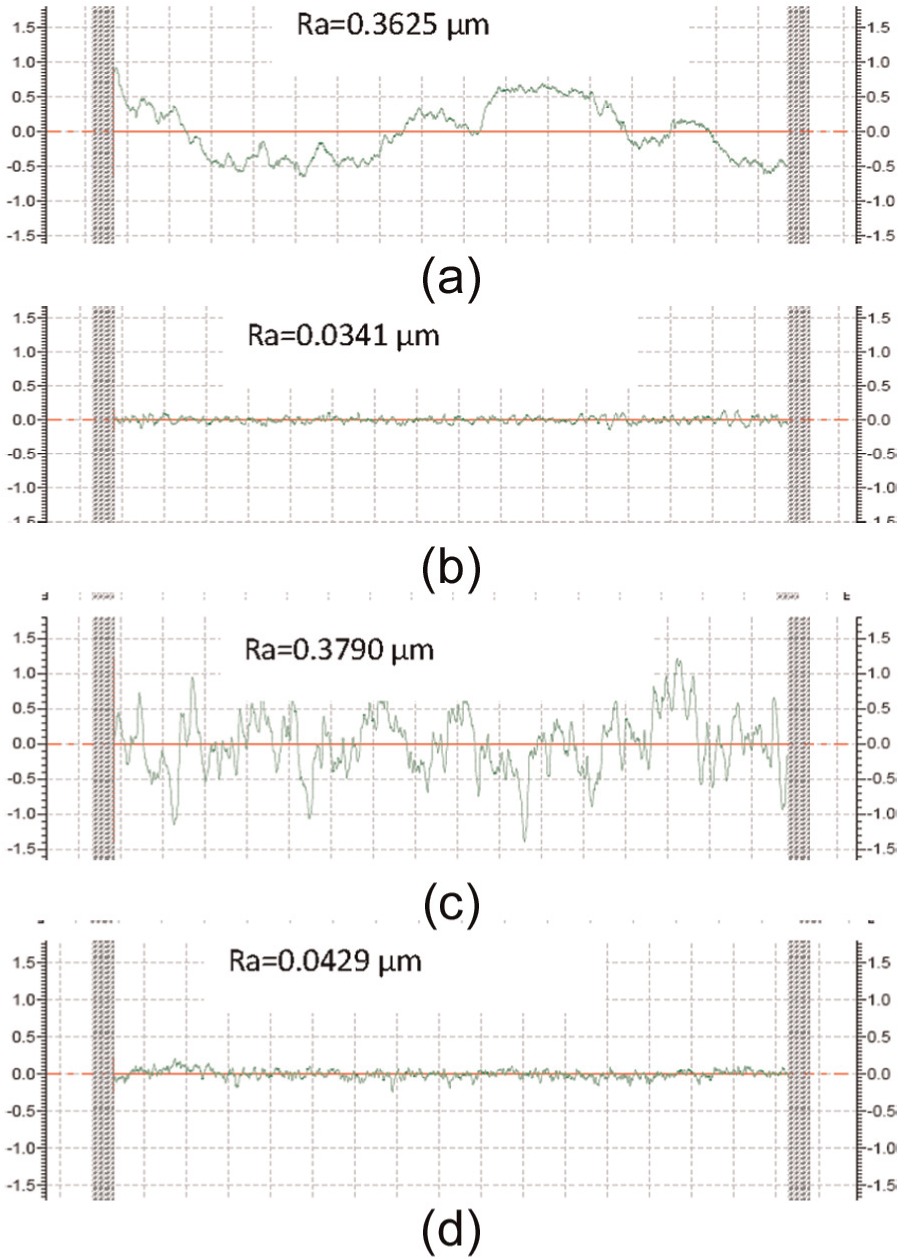
Surface roughness profile of (a) ground copper alloy sample, (b) copper alloy finished sample (working gap = 2.67 mm, rotational speed = 433 r/min, Ton = 7 s), (c) ground stainless steel sample, and (d) stainless steel finished sample (working gap = 1 mm, rotational speed = 434 r/min, Ton = 7 s).
Surface morphology
Surface roughness micro-graphs alone are not sufficient to understand the exact mechanism of material removal and the type of surface generated after machining. To overcome this limitation, SEM and AFM images were obtained. Figure 15(a) and (b) shows the SEM images of ground copper alloy and stainless steel samples, respectively. It can be seen that the grinding process has left deep grinding marks and pits on the workpiece surface, while SEM images in Figure 15(c) and (d) show the layers created by the ultrasonic-assisted DDMAF process. It can be observed that the present process has remarkably removed the various defects created by the grinding process and has developed a new smooth surface. The very fine machining marks left after the ultrasonic-assisted DDMAF process can be seen in Figure 15(c) and (d), which indicates that micro/nano scratches are formed due to shearing of peaks and could be the main mode of material removal in the present case. The AFM images presented in Figure 16(a) and (b) show a three-dimensional profile created by the grinding process in the case of copper alloy and stainless steel samples. The three-dimensional profile created by the ultrasonic-assisted DDMAF process can be seen in Figure 16(c) and (d), for copper alloy and stainless steel samples, respectively. From this figure, it can be observed that the present finishing process has very effectively reduced the peaks and valleys created by the grinding process and has generated a very smooth surface with very fine scratch marks. The AFM images also reveal that the material removal takes place at micro and nano levels.
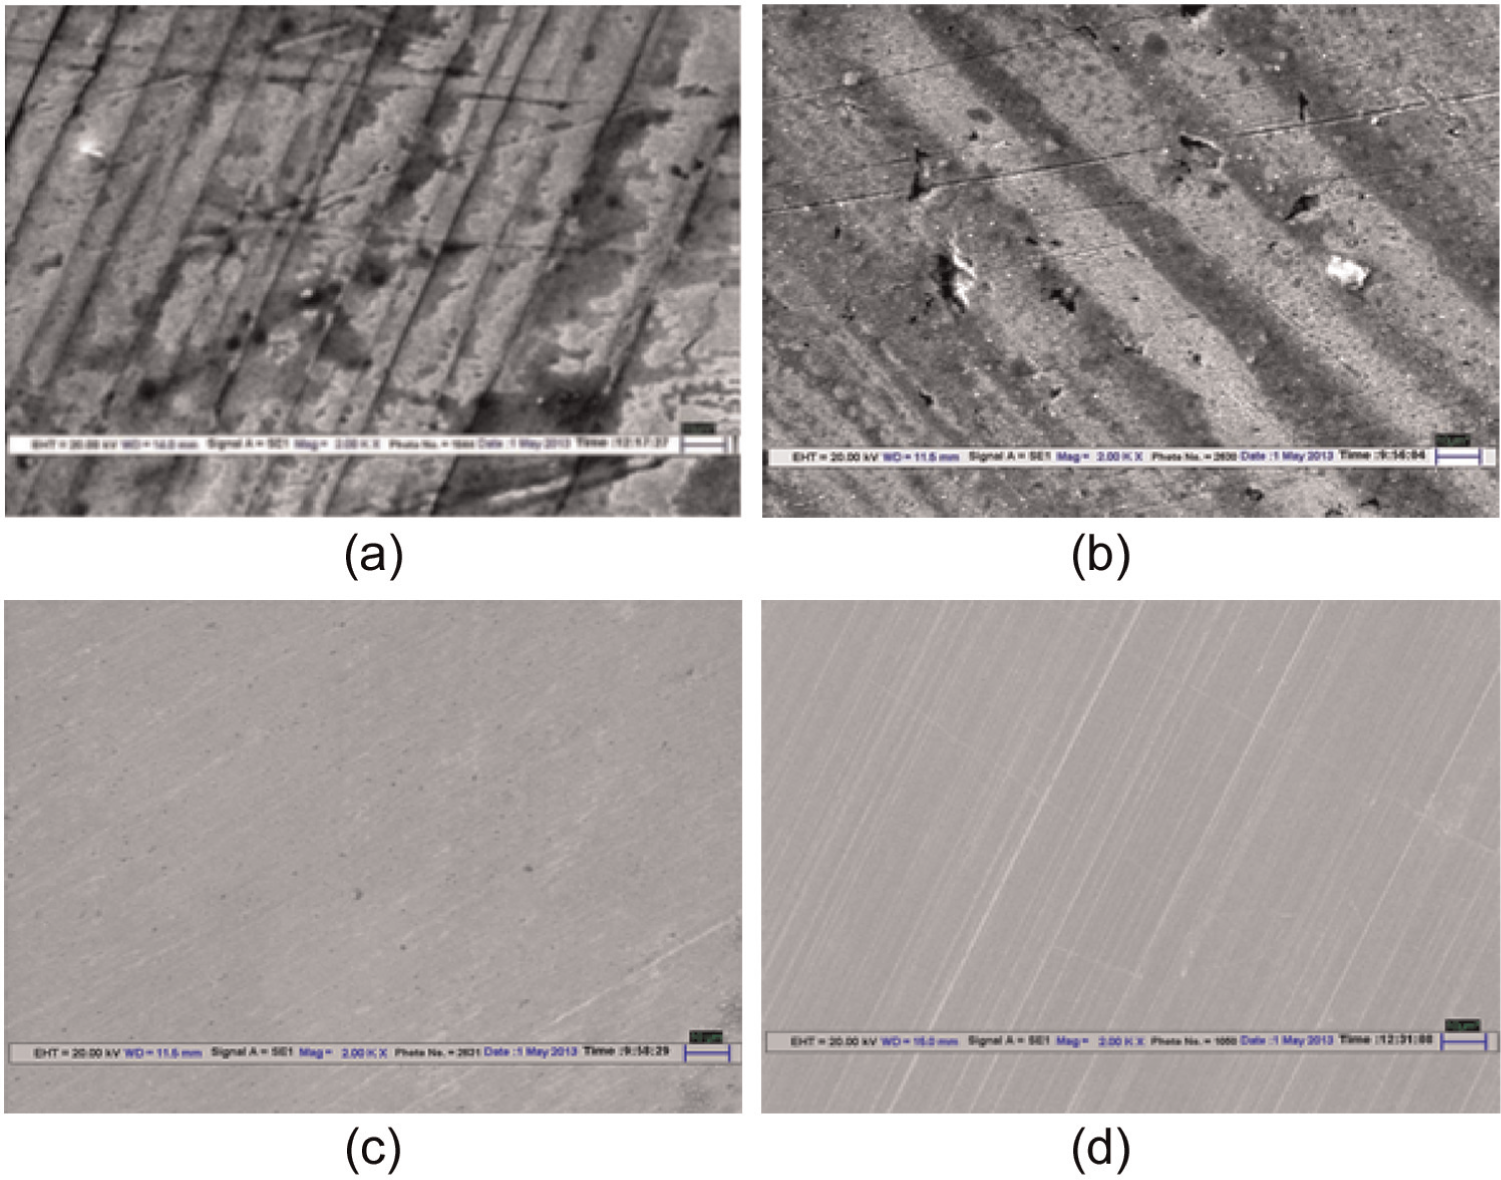
SEM images of (a) ground copper alloy, (b) ground stainless steel ground sample, (c) copper alloy finished sample (working gap = 2.67 mm, rotational speed = 433 r/min, Ton = 7 s), and (d) stainless steel finished sample (working gap = 1 mm, rotational speed = 434 r/min, Ton = 7 s).
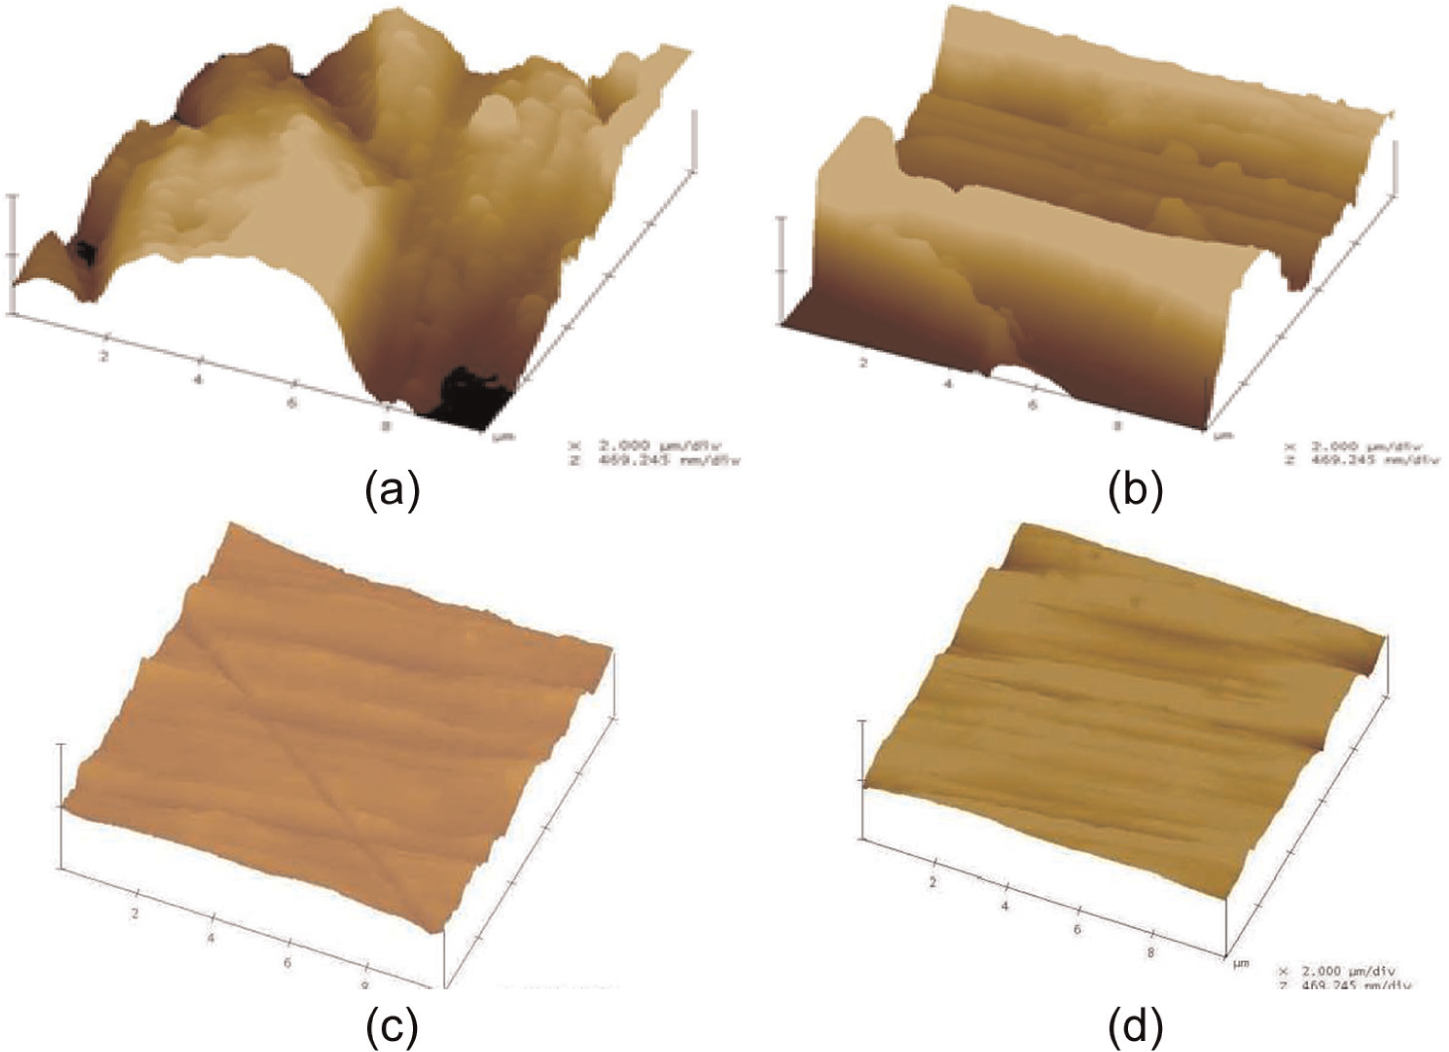
AFM images of (a) ground copper alloy, (b) ground stainless steel, (c) copper alloy finished sample (working gap = 2.67 mm, rotational speed = 433 r/min, Ton = 7 s), and (d) stainless steel finished sample (working gap = 1 mm, rotational speed = 434 r/min, Ton = 7 s). Z scale = 469 nm for all images.
Conclusion
From the above work, it can be concluded that in the case of paramagnetic workpiece materials, the following conclusions can be drawn from this research work:
To finish paramagnetic workpiece materials, use of magnetic poles on either side of the workpiece results in higher magnetic flux density in the working gap;
The preliminary study showed that providing ultrasonic vibrations to a workpiece resulted in a better surface finish in a shorter duration;
The pulse-on time followed by rotational speed played a dominant role in producing a higher change in surface roughness in the case of copper alloy workpiece. However, working gap played a dominant role in obtaining a good surface finish in a hard material such as stainless steel;
The developed experimental setup produced very good surface finish on work materials irrespective of hardness, although the values of process parameters that yielded good surface finish depend on mechanical properties of the work materials. For example, stainless steel being a hard material showed good results at smaller working gap where the magnetic flux density was high, while copper alloy (a soft material) yielded better results at higher working gap. For both the workpieces, better surface finish was obtained at a pulse-on time of 7 s. However, for copper alloy, the effect of pulse-on time started saturating around a fixed value of %ΔRa;
By performing experiments at the optimized process parameters, surface roughness values of 36 nm in copper alloy samples and 44 nm in stainless steel samples were obtained;
The interaction effects observed for the two types of work materials were different and were due to difference in mechanical properties;
The SEM and AFM micro-graphs revealed that the developed setup was capable of shearing peaks produced during grinding operation and produced a smoother surface. The AFM image also showed that the material removal took place in the present process is in micro and nano sizes.
Footnotes
Appendix 1
Acknowledgements
The authors gratefully acknowledge the financial assistance provided by the Council of Scientific and Industrial Research (CSIR), New Delhi, India.
Declaration of conflicting interests
The author(s) declared no potential conflicts of interest with respect to the research, authorship, and/or publication of this article.
Funding
The author(s) disclosed receipt of the following financial support for the research, authorship, and/or publication of this article: This work was financially supported by Department of Science and Technology, New Delhi.