
Abstract
γ′-strengthened nickel-based superalloys are developed for high-performance systems such as jet engines, internal combustion engines, and gas turbines. Their excellent properties are given by specifically designed microstructure. Unfortunately, the structure is deformed during machining. Too much deformation generated results in components with low mechanical integrity and reduced in-service life. Experimental investigations indicated that the machining affected zone or subsurface damage formation for nickel-based superalloys is an atypical phenomenon; its dependence on the process parameters is fundamentally different from the conventional materials. This research investigates subsurface damage formation in orthogonal cutting tests performed on nickel-based superalloys, followed by empirical and numerical modeling. The simulations are used to estimate the depth of the subsurface damage and are compared with the experimental results. The knowledge can then be applied to select optimum cutting parameters for an acceptable depth of subsurface damage.
Introduction
One key element to the success of power generation and aerospace is the turbine, both gas and jet engines. To achieve target power density, efficiency, and increased performance, these systems operate at extremely high temperatures. System elements that are in the hot gas path must possess high mechanical strength and creep, corrosion, and oxidation resistance at these extreme operating temperatures. Superalloys, particularly nickel based, are the current material of choice for such components, and they are typically manufactured to final geometric specifications using multi-axis milling. Compared to conventional materials, they are a relatively new class of materials with high mechanical strength, ductility, creep resistance at high operating temperatures, high fatigue strength, and superior resistance to corrosion and oxidation at high temperatures.1–3 Their functional properties are consistent for a wide range of operational temperatures (−217 °C to 1300 °C), making them ideal for applications in aircraft, cryogenic tanks, submarines, nuclear reactors, and petrochemical equipment.
Superalloys exhibit low machinability due to high temperature generated during shear deformation process at the primary shear zone and friction at the tool–chip interface, poor thermal conductivity, high strength at elevated temperatures, rapid work hardening, presence of the hard abrasive carbides in its microstructure, and ability to react with tool materials under atmospheric conditions.4–7 These characteristics are related to the specific crystal structure of the γ′-strengthened nickel-based superalloy, which is a two-phase equilibrium microstructure consisting of γ matrix phase surrounding the γ′ precipitate phase, first having a face-centered cubic lattice (cubic-F), while the second has primitive cubic lattice (cubic-P). A larger fraction of γ′ phase ensures a larger strength of the nickel-based superalloys, which is maintained relatively unchanged at higher temperatures. The superalloy used for manufacturing the turbine blades has typically aγ′-phase fraction of more than 0.6. 8
Continuously improved efficiency and performance is driving toward operating at higher temperatures, and thus, more advanced superalloys are developed with solid solution–strengthened structures and orientations that are even more difficult to machine. The quality required when manufacturing gas turbine and aircraft parts refers not only to the characteristics of the surface (i.e. surface roughness and cracks) but also to the characteristics beneath the surface. During the processing of these materials, the γ- and γ′-phase structures can become deformed. Machining affected zone or subsurface damage caused to the microstructure may only extend a few micrometers (Figure 1), but if too much deformation is generated during manufacture, the resulting components (i.e. gas turbine components) lose much of their mechanical integrity and their in-service life suffers, as well as extremely costly catastrophic failures occur. Thus, identifying and minimizing this layer and its depth are of extreme importance.9,10
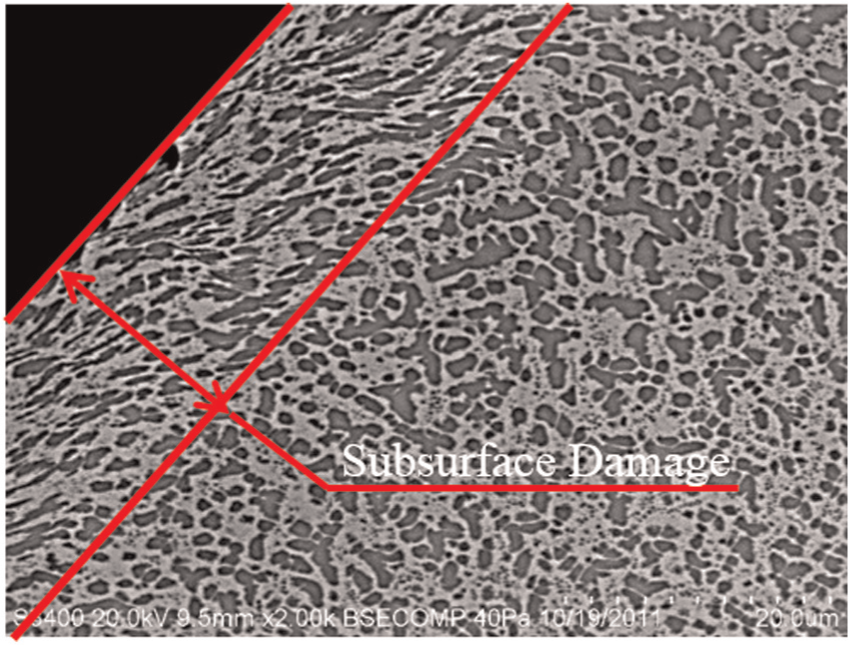
Typical subsurface damage.
The presence of the damaged layer was mainly investigated in the hard turning of steel and the grinding of silicon carbide. For steel, the changes to the microstructure in the machined surface layer manifest themselves as white and dark layers, typically yielding to residual stresses.8–10 There are few investigations in subsurface damage for nickel-based superalloys. Axinte et al. 11 performed turning experiments under dry conditions, observing deformed layers ∼2–3 times harder than the bulk material, which is significantly higher than when using steel. Ranganath et al. 10 found larger strains with large edge radii (worn tools) and lower speeds, which is consistent with the white layer (WL) observations for other materials, such as steel. 11 Besides the deformed microstructure and presence of cracks, the subsurface damaged layer presents variation in hardness. Pawade et al. 12 conducted experiments on Inconel 718 and measured the microhardness for various cutting conditions and recorded the difference from the bulk material.
A comparison of the cutting force recorded while milling of different materials in the same cutting conditions is presented in Figure 2. During machining, a relatively steady-state average force was achieved for steels, while the superalloy sample exhibited a significant increase in the magnitude of cutting forces during a single machining pass, and severe tool wear was observed.
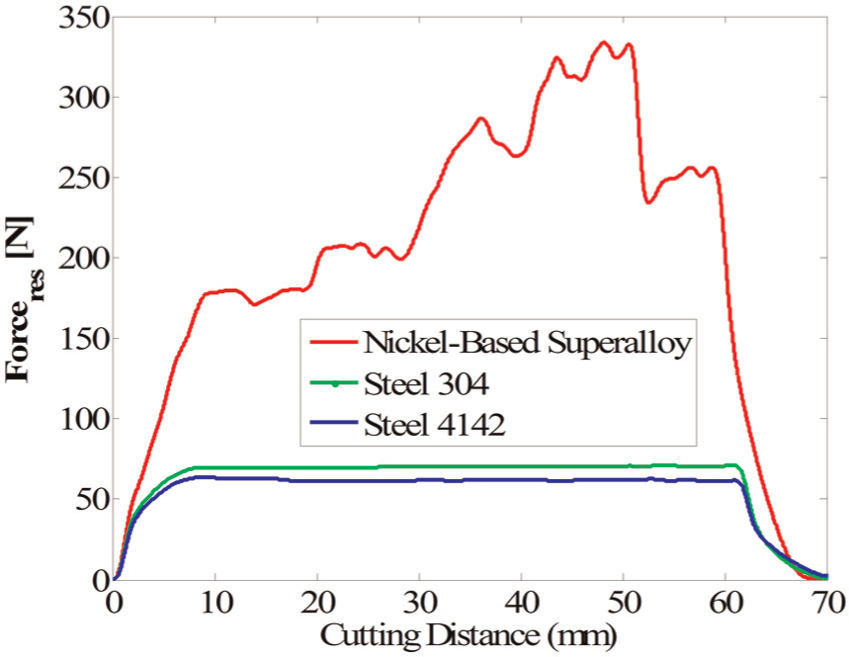
Cutting force recorded during end milling tests—speed: 50 m/min, feed: 0.05 mm/tooth, depth of cut: 0.5 mm, radial depth of cut: 9.5 mm, and a coolant was used.
After considering all these characteristics of cutting superalloys, it was concluded that the strain hardening phenomenon is dominant during machining process. In the same time, high temperatures are generated in the deformation zone and at the tool–workpiece interface due to friction. Although the nickel-based superalloys are designed to be stable when subjected to high temperatures, by controlling the fraction of the γ′ phase, the heat generated may result in thermal softening.
Due to the complexity of the process, few researchers have attempted to model the WL formation and then observed only the chip morphology and microstructure. Fewer investigations focus on nickel-based superalloys.13–15 Ranganath et al. 10 proposed a finite element model for IN100 to predict the plastic strain of the workpiece surface under various cutting conditions. In the course of developing the numerical model, a key factor is to accurately model the material behavior. For a large range of materials, the constitutive law is based on the Johnson–Cook (J-C) model. The J-C model incorporates material strain hardening, strain rate hardening, and thermal softening during the cutting process as follows
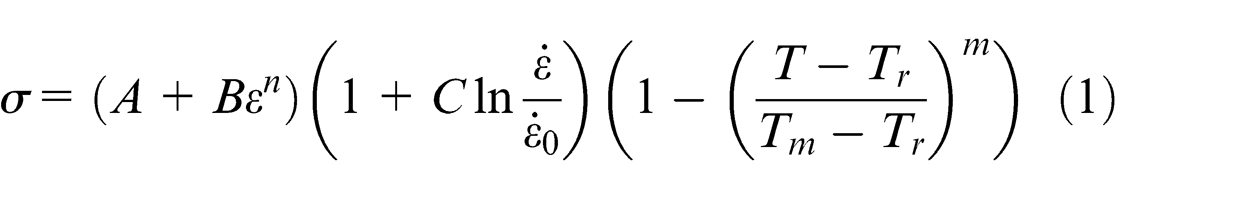
where σ is the equivalent flow stress, ε is the equivalent plastic strain,
In this article, the results of orthogonal cutting experiments performed on a γ′-strengthened nickel-based superalloy under various conditions are presented, and finite element analyses (FEAs) are used to investigate the subsurface damage generated. Samples are prepared, and the subsurface damage generated is estimated and then the measurements are compared with the results from the simulations.
Thermal recrystallization process is employed in this research to obtain objective measurements on orthogonal cutting samples. With the annealing process, new free grains grow until original deformed strain is totally consumed; thus, the stored energy in original strain is entirely released from recrystallization process. The main factors in recrystallization process include temperature, annealing time, and order of severity from plastic deformation. In 1972, Field et al. 18 discussed that this technique is widely utilized in measuring surface integrity with exception of machined surface. In 1996, Iino et al. 19 applied the recrystallization technique to estimate the plastic strain in a machined surface on SS41. In their research, tensile tests were conducted to obtain the relationship between equivalent plastic strain and size of recrystallized grain. With various machining inputs, the machining affected zone is investigated using the recrystallization technique. Relationship between hardness, equivalent plastic strain, and depth of machined affected zone has also been developed. Iino et al. 19 observed that a minimum amount of plastic deformation is the requirement to produce a nucleation of new grains followed by the grain growth. Earlier, in 1976, Shoji 20 revealed that the various metal deformations, such as compression, tension, torsion, and combination of torsion and compression, do not influence the relationship between equivalent plastic strain and recrystallization grain size. In conclusion, the recrystallization technique gives an objective measurement of the depth of the subsurface damage generated during the machining and thus can be used to compare experimental results with finite element simulations.
Experimental setup
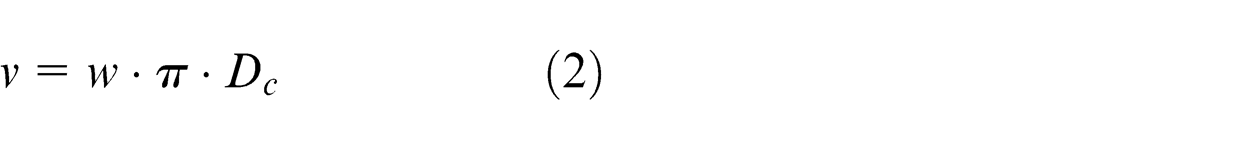
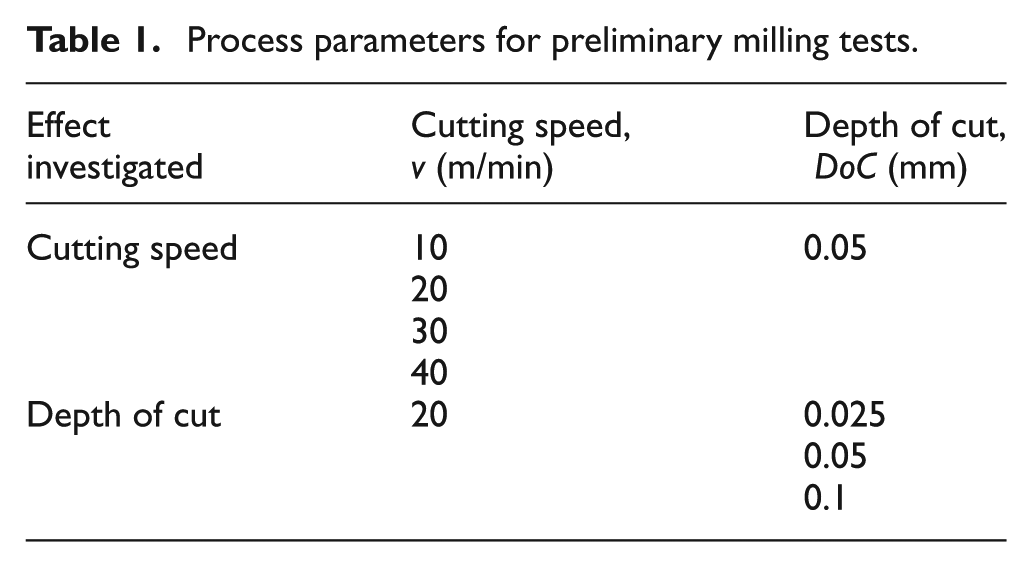
Orthogonal tests were performed on a cylindrical workpiece. Groves were made to create the testing zones with a width of 2.5 mm, which is 25 times larger than the deepest depth of cut in the tests performed. Therefore, it can be assumed that the conditions for the orthogonal cutting process to be a plane strain situation were respected. The workpiece material was γ′-strengthened nickel-based superalloy currently used for fabricating gas turbine internal components; the carbide tool was TCMT 11 03 04-MM 1105 with physical vapor deposited (PVD)-coated insert (TiAlN) and a rake angle of 12°. The test matrix is given in Table 1. The experimental setup is shown in Figure 3. The workpiece was mounted in the spindle of an Okuma three-axis milling center, while the orthogonal cutting tool was mounted on the Kiesler piezoelectric dynamometer. Kiesler piezoelectric dynamometer is used to record the cutting forces during orthogonal cutting process at 6000-Hz sample rate. The movement of the tool (feed) gives the desired depth of cut. The surface speed is calculated by
Process parameters for preliminary milling tests.
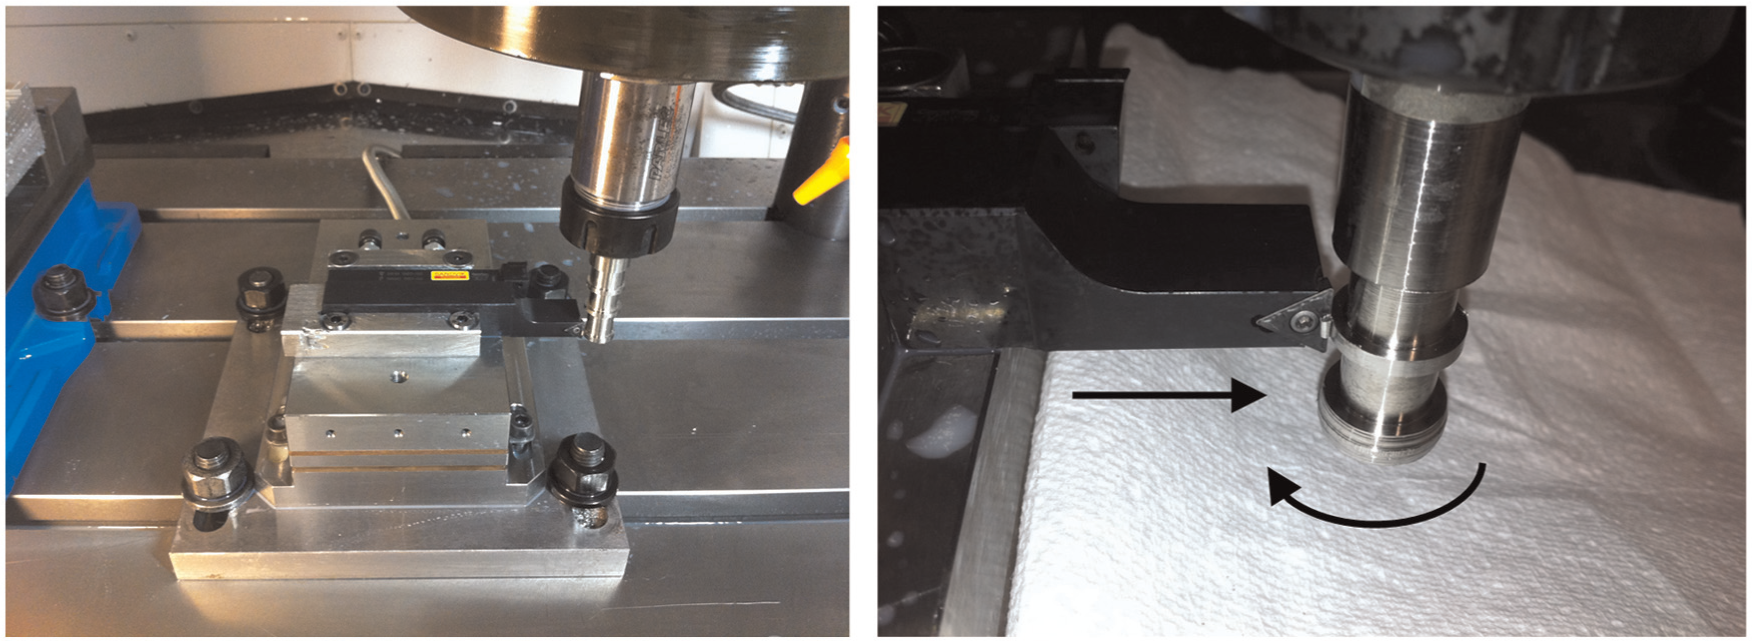
Experimental setup and design of the tests.
where
Each test was quick-stopped after five revolutions of the workpiece. During the first revolution, the tool engaged gradually and the depth of cut increased to the desired value, being then kept constant for the rest of the test. No coolant was used, and a new cutting edge was used for each test. Each test was repeated 3–4 times.
Experimental results and discussion
Observations on the cutting forces
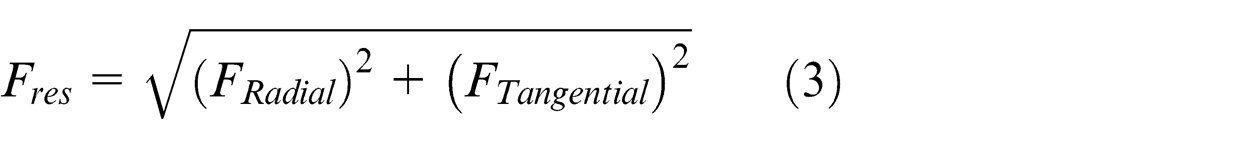
The tangential force and radial force are depicted in Figure 4. Tangential force, F Tangential , is consistent with friction force and horizontal component force from rake face. The radial force, FRadial , is consistent with normal pressure from flank face and vertical component force from rake face. Resultant force, Fres , is calculated as
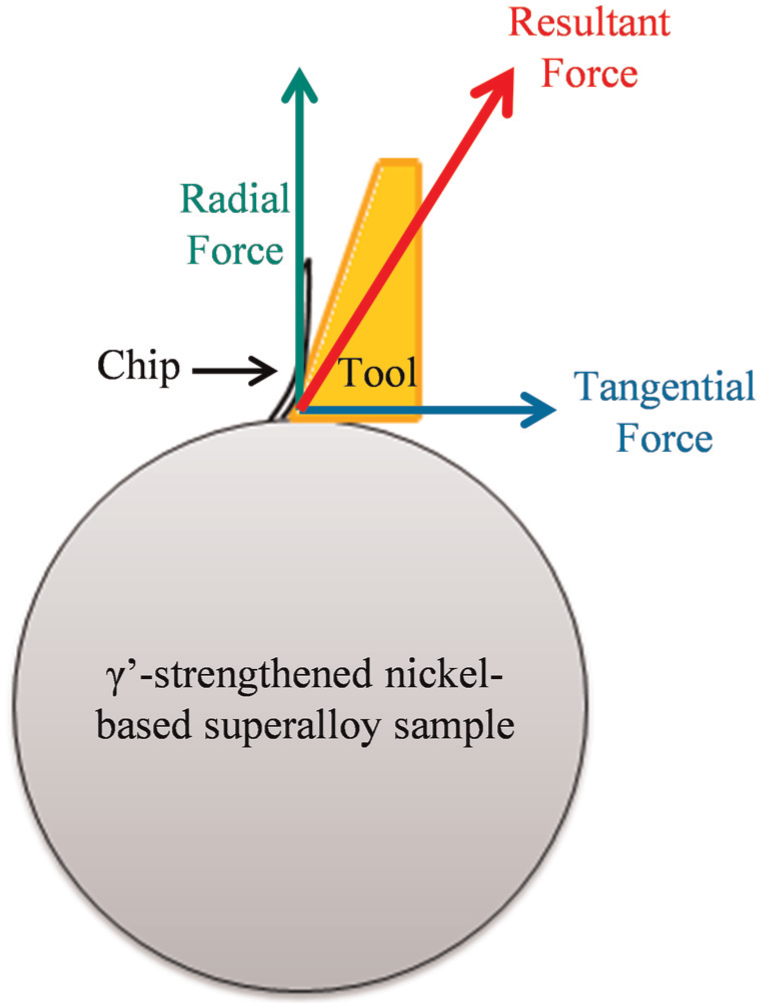
Schematic diagram of force components.
Figure 5 plots the two components of the resultant force: radial force and tangential force. This graph shows an initial rapid increase in forces during the first revolution, due to the increase in depth of cut, followed by a steady increase for the next four revolutions despite the constant depth of cut. The same continuous increase in both radial and tangential forces is observed, and it can be attributed to the severe tool wear. The radial force reaches a relative stable stage earlier than the tangential force. After 140 mm cutting distance, due to the increased friction force, the tangential force exceeds the radial force. This means that the tool wear induces a significant friction force at this point. Therefore, the tool wear must be later considered in the FEA simulations for γ′-strengthened nickel-based superalloy.
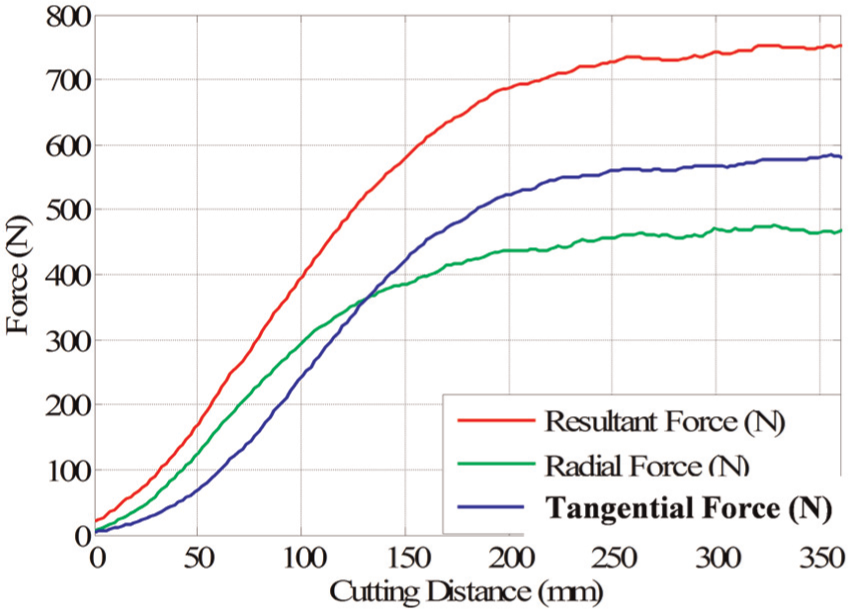
Cutting force and its components for v = 10 m/min and DoC = 0.05 mm.
In order to compare force results between different tests, the processed (filtered) force is studied. Figure 6 shows the average force versus cutting distance for test 1 (v = 10 m/min, DoC = 0.050 mm). The blue line is the raw data, which are directly exported from orthogonal tests with sample frequency of 6000 Hz by DynoWare software. The red line represents the data processed with low-pass Butterworth filter and a moving average window. After the first pass, the depth of cutting remains at a constant level, as shown by green curve in Figure 6. Thus, the force increase after 70 mm of cutting distance is due to the rapid tool wear. After 200 mm, the tool wear maintains at a relatively constant rate.
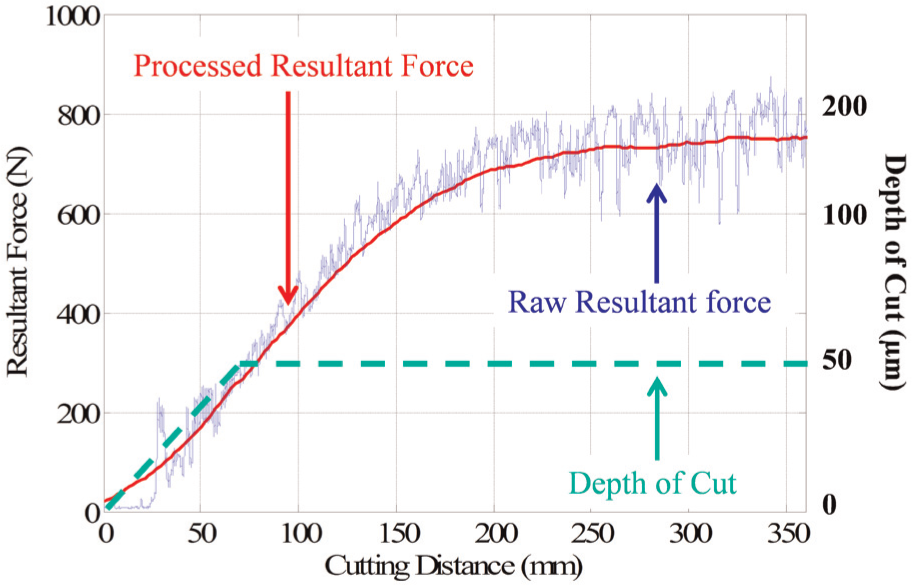
Cutting forces for v = 10 m/min and DoC = 0.05 mm.
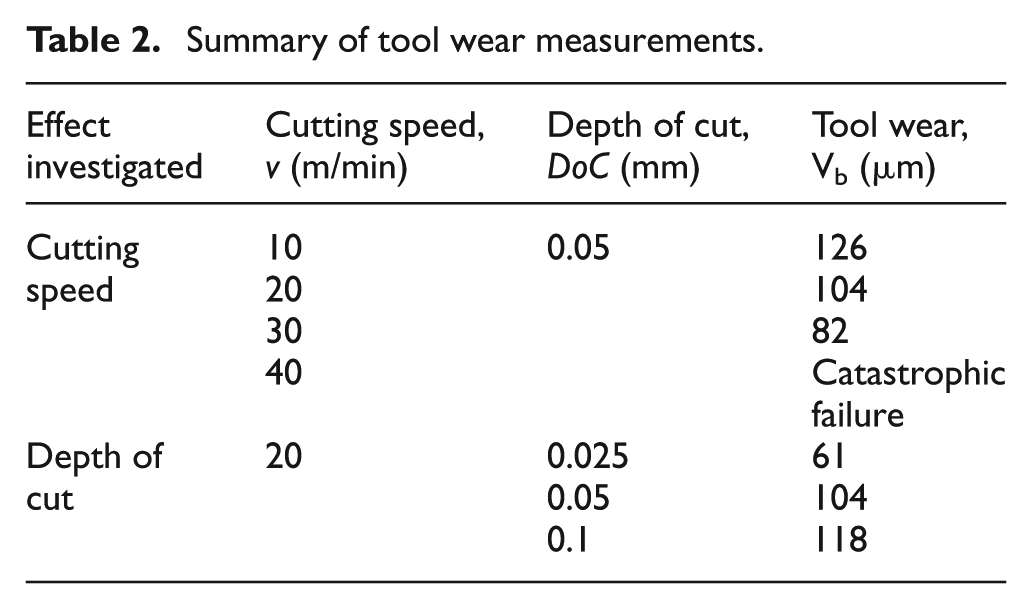
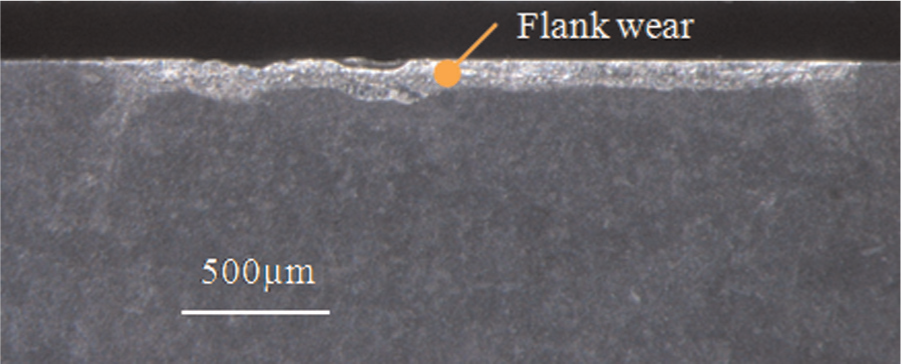
The fact that severe tool wear is observed at the end of each experiment indicates that the FEA simulations cannot neglect this aspect. Thus, the simulations should be performed with the new tool, as well as with the worn tool geometry, with the measurements taken from the experiments. Typical flank wear is shown in Figure 7. The measurements of Vb are summarized in Table 2. The tool wear increased with increase in depth of cut, as expected, while the variation with cutting speed showed a decrease with increased speed, up to an optimum speed. Further increase in speed after this point resulted in catastrophic failure of the tool.
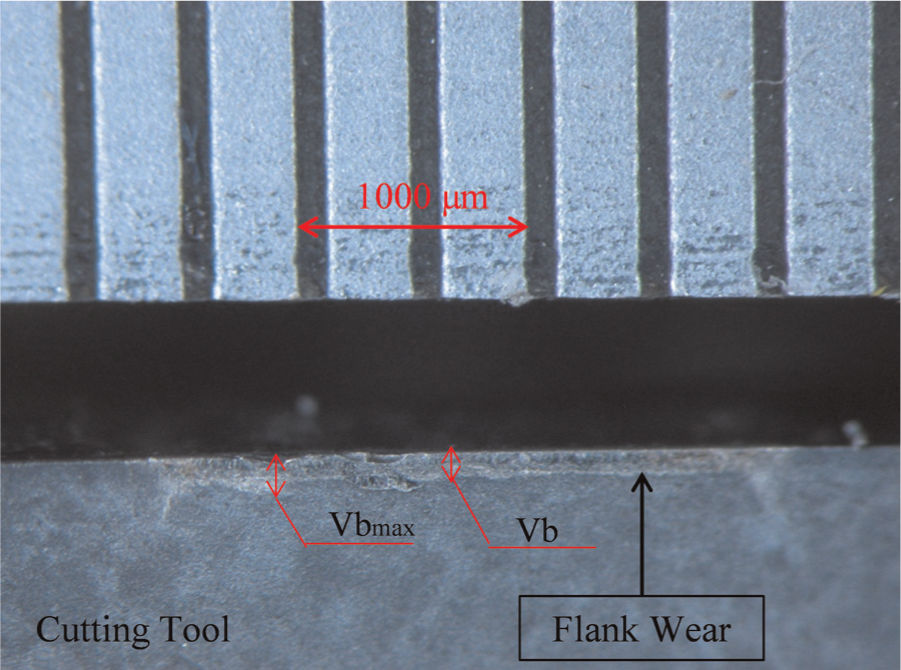
Tool wear for v = 10 m/min and DoC = 0.05 mm.
Summary of tool wear measurements.
Observations on the subsurface damage after machining
This section focuses on the types of subsurface damage observed and the depth of the machining affected zone. Initially, specimens are cut using an electric discharge wire cutting machine (Wire EDM), in order to avoid plastic deformation near the surface (Figure 8(a) and (b)), and then they are embedded in resin, ground in steps to the smallest grit size, and polished with 1-μm polycrystalline diamond suspension and 0.05-μm alumina slurry (Figure 8(c)). The polished specimens are etched using Marble’s reagent. The subsurface layers are analyzed using the scanning electron microscope (SEM; Hitachi 3400) under variable pressure (Figure 8(d)).
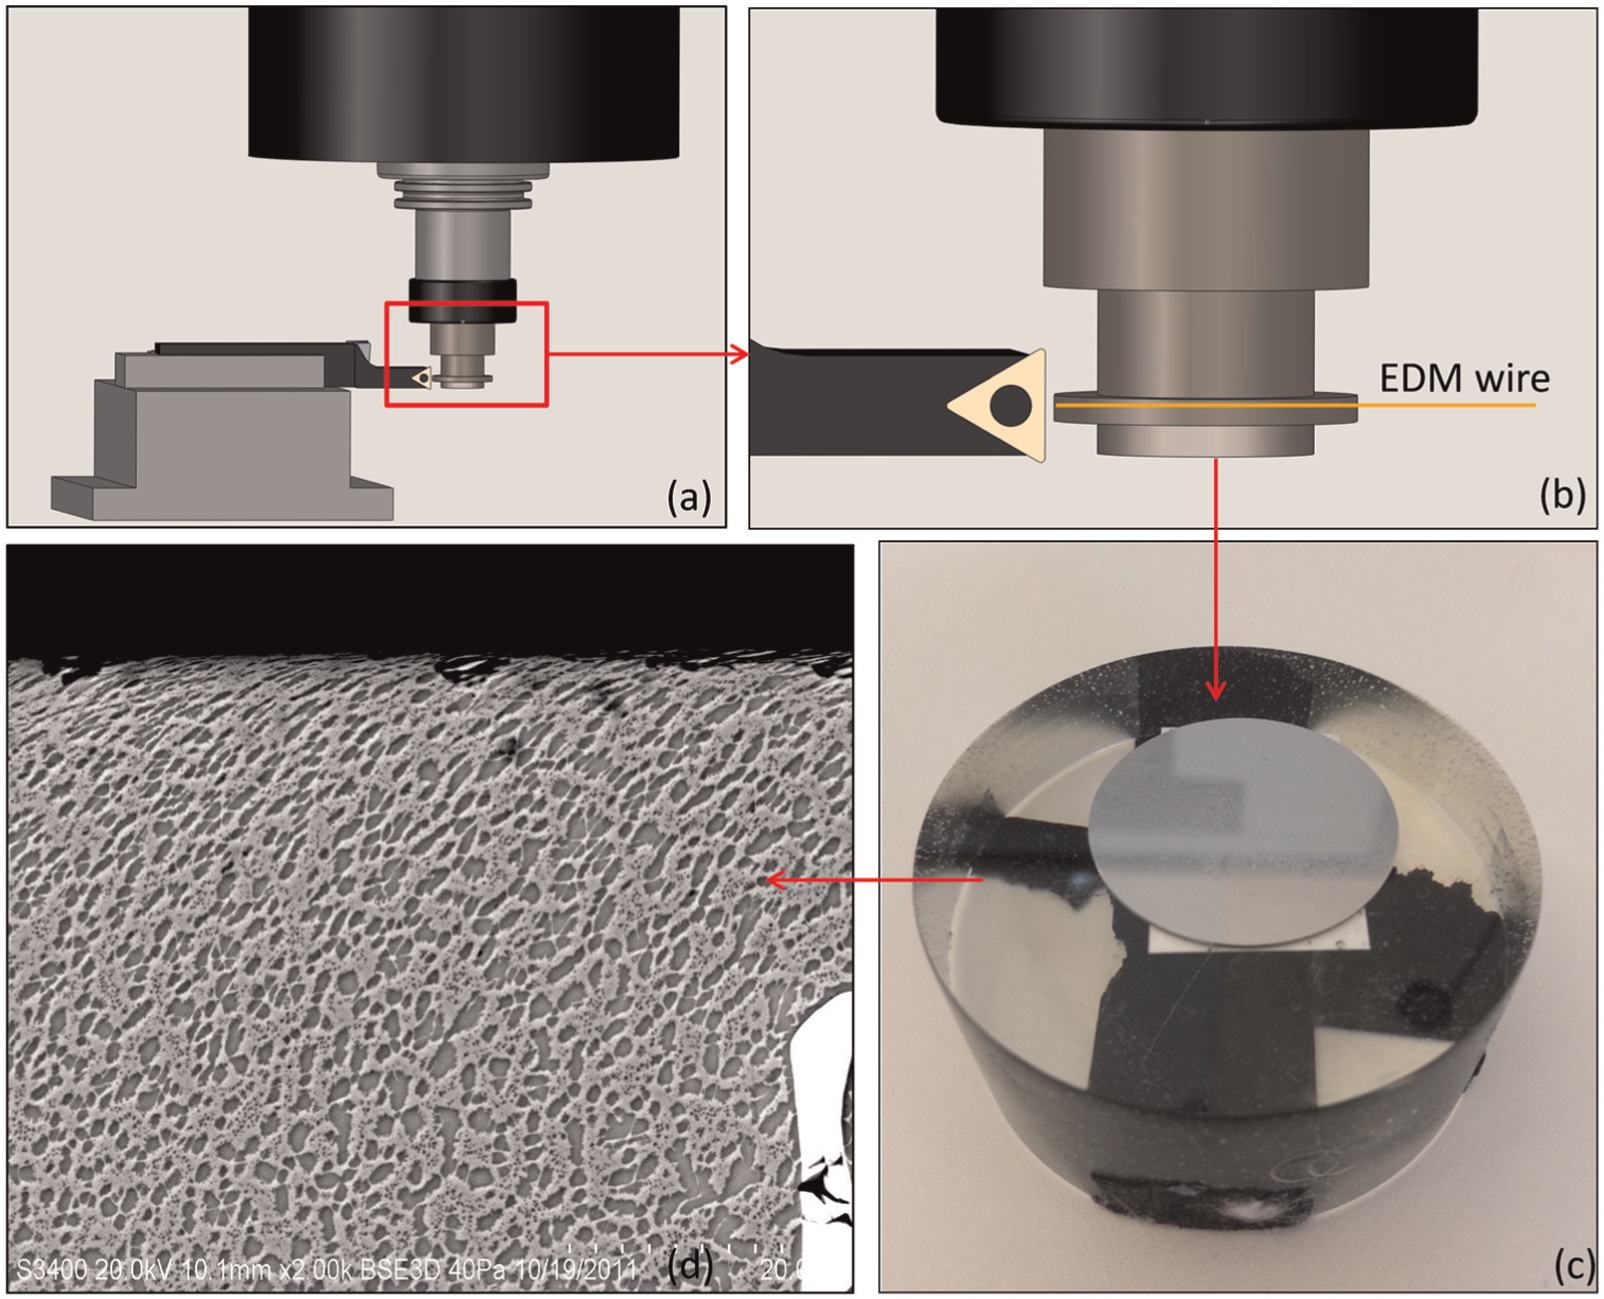
Schematic illustration of the orthogonal cutting process and recrystallized sample for optical analysis. The purpose of this figure is to show the process of preparing orthogonal cutting sample as well as how to prepare the test sample for SEM.
The types of damage obtained in the machined layer are as follows:
Micro-cracks, possibly related to the presence of carbides (Figure 9);
Deformed structure with elongated precipitates seen just beneath the machined surface.
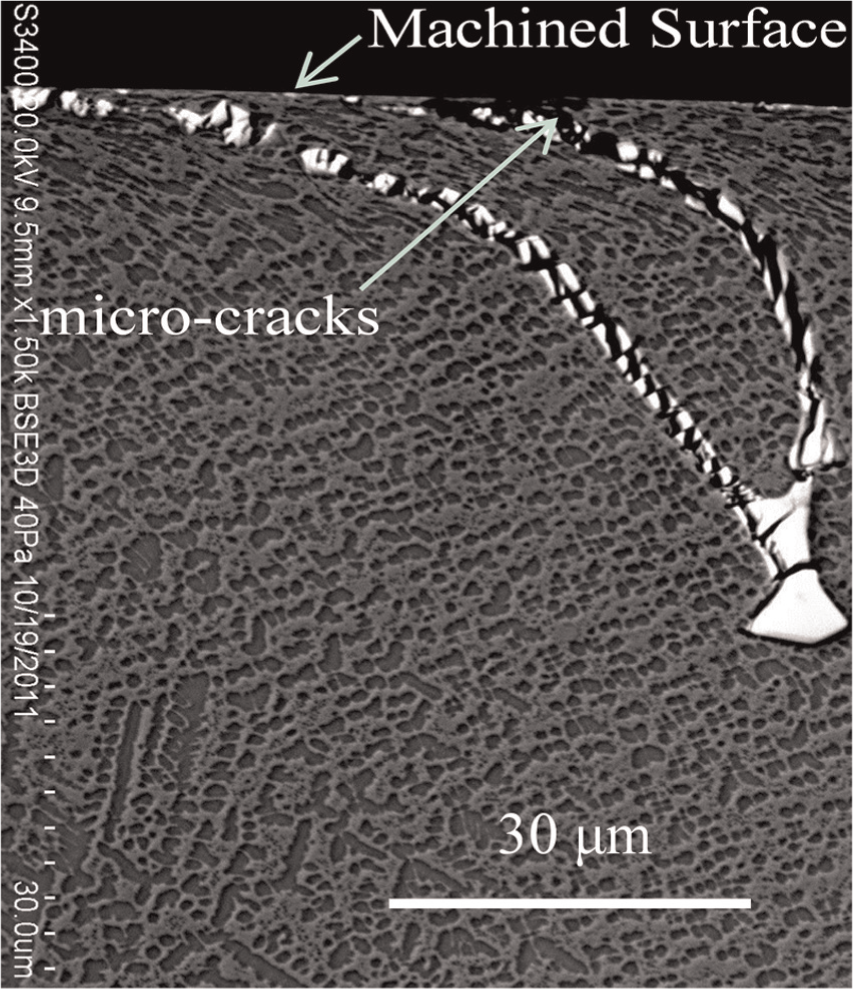
Micro-cracks in the machining affected layer (DoC = 0.050 mm, v = 40 m/min).
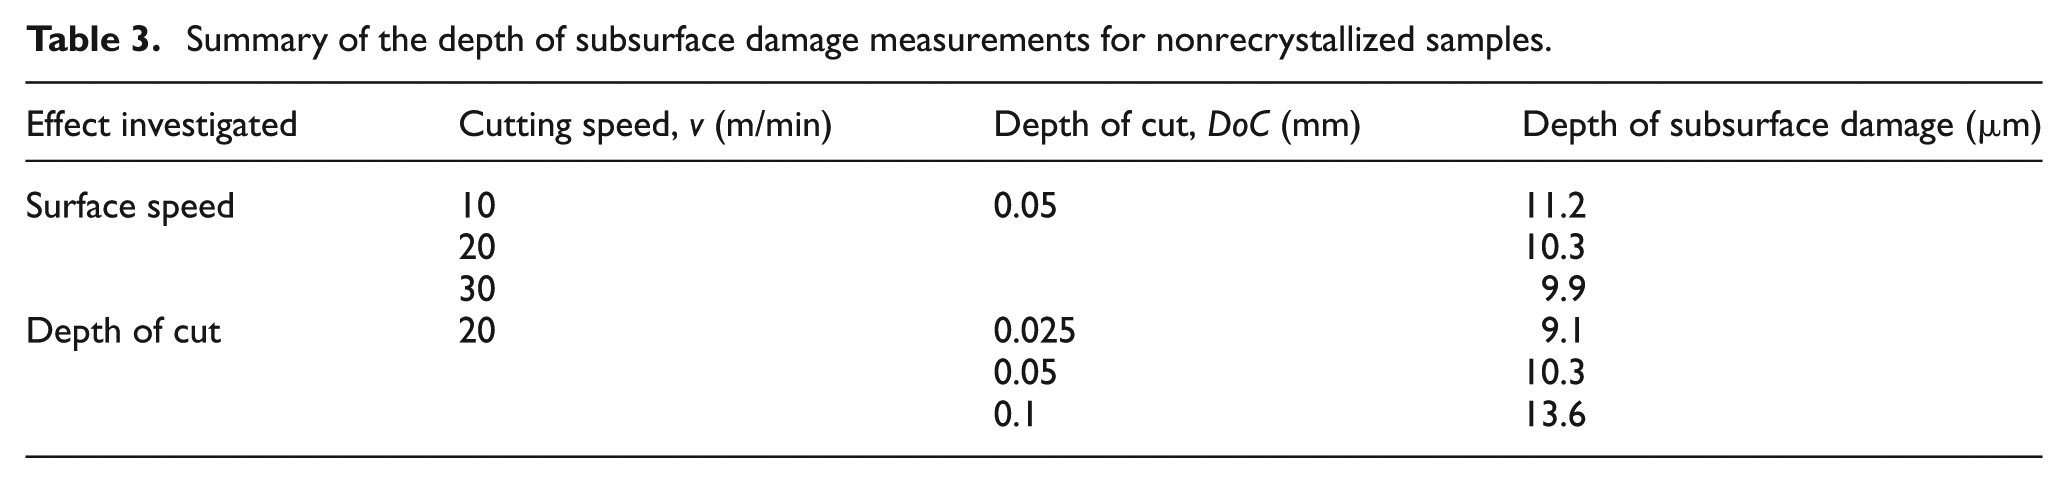
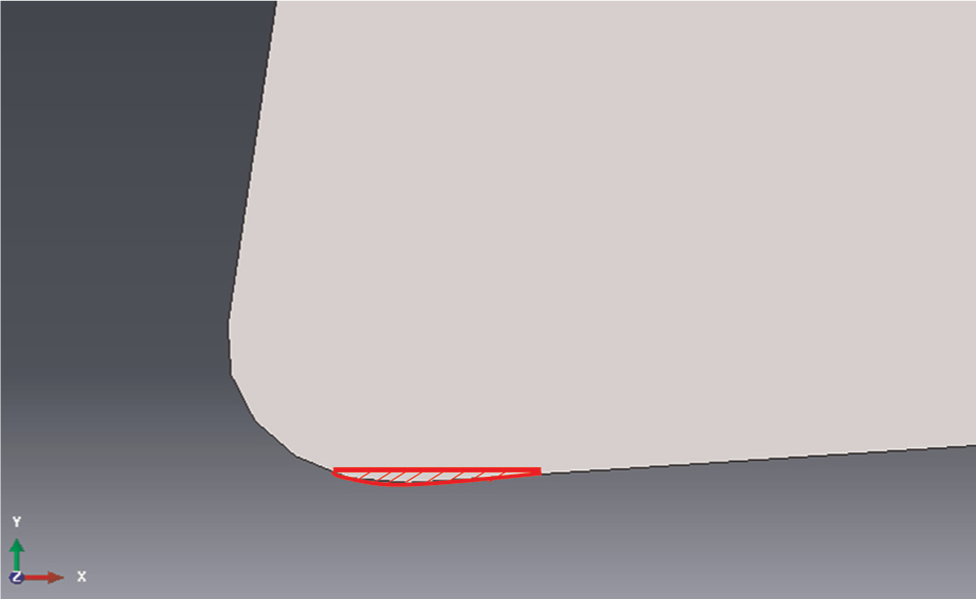
The depth of the machining affected layer varies based on the cutting conditions used. Figure 10 shows a typical subsurface damage measurement from orthogonal cutting. The depth of subsurface damage is measured for all the tests around the circumference of the cylindrical specimens, and an average subsurface damage is determined. The depth of subsurface damage results of the nonrecrystallized samples are summarized in Table 3.
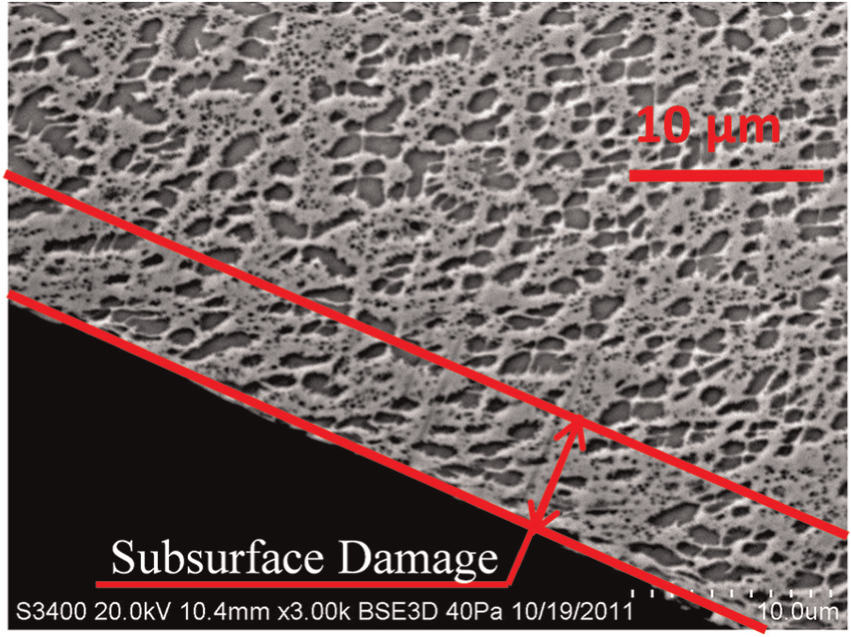
Subsurface damage for DoC = 0.050 mm and the cutting speed v = 30 m/min.
Summary of the depth of subsurface damage measurements for nonrecrystallized samples.
Although these micrographs offer an insight into what happens underneath the machined surface, a major drawback of using them for evaluation of the subsurface damage is that it is highly subjective. Not only that the operator can interpret, but even the statistical method applied to the image gives errors, since it cannot see the whole distorted structure. 13 In reality, even if small plastic strains occur in the microstructure, they are still considered damage since they can result in residual stress, but it may be not observable in the micrograph not only due to the limited dimensions of the image but also due to the limitations of the human eye. Therefore, evaluating depth of subsurface damage cannot be performed by simply measuring the depth of precipitates’ deformation. A subsequent recrystallization technique is more appropriate for evaluation of the subsurface damage. With thermal recrystallization technique, the grown grain boundary can provide a more objective method to evaluate subsurface damage.
Observations on the subsurface damage with recrystallized samples
Thermal recrystallization is a grain growth and recovery process, with releasing storage energy generated from plastic deformation. The driving force for thermal recrystallization is determined from the difference in storage energy between recrystallized and deformed state. In 2005, Rios et al. 21 concluded that driving force can be written as
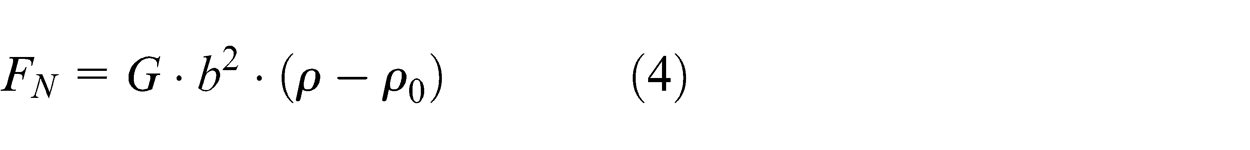
where
The annealing temperature controls the nucleation and the grain growth rate. Larger plastic deformation induces higher driving force and requires a lower recrystallization temperature. The resulting recrystallized grain size is highly sensitive to the applied strain before thermal recrystallization. The machined surface has severe plastic deformation on the top portion of subsurface damage layer that decreases to zero plastic deformation at the bottom portion of subsurface layer. Since the recrystallization process is a recovering process, crystal structures are reorganized, and the defects are eliminated. According to equation (4), the density of dislocation in the recrystallized state is reduced, generating a driving force.
With the standard annealing process for nickel-based superalloy (standard temperature, heating, and cooling time), the top deformed grains with relatively higher driving energies start to nucleate and grow. However, with decreasing Δρ, the driving force decreases to the same level as retarding force, and grain boundary growth is stopped. Thus, in this research, the depth of subsurface damage is defined as the depth of ultimate recrystallized grain boundary.
Orthogonal cutting samples were prepared by thermal recrystallization technique. As described previously, the sample is cut via Wire EDM and then prepared for optical measurements. Thermal recrystallization process is conducted in order to obtain more objective measurements of the subsurface damage. The thermal recrystallization process was completed by GE Power and Water through a standard annealing process. This annealing process makes the original grain boundaries disappear during a certain temperature range within certain time. Meanwhile, the residual stress is relieved during the heat treatment process and then associated with the decreasing temperature, nucleation starts and the grain rapidly grows through grain boundary migration, which leads to a visible boundary between the undeformed structure and the newly recrystallized grains. After the recrystallized samples are mounted in resin and polished, Kalling #2 (ethyl alcohol, hydrochloric acid, and cupric chloride) is applied on the surface, such that the boundaries between grains are etched and visible.
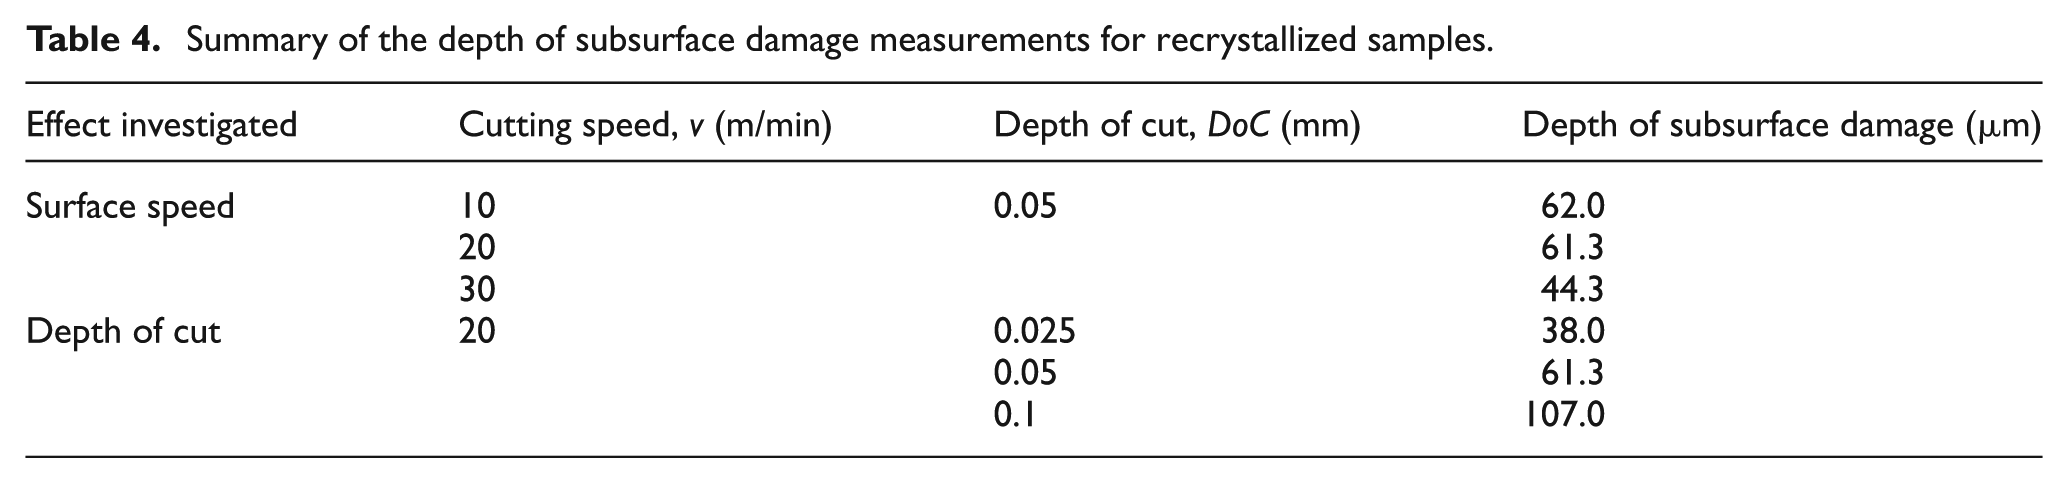
The subsurface damage beneath the machined surface is investigated from the edge of the disk. Figure 11 shows the optical image of a recrystallized sample where the new grain boundary is easily observed. The depth of subsurface damage is defined as the maximum distance from the machined surface to the grain boundary. Compared to Figure 10, recrystallization technique provides a more objective and accurate method to measure the subsurface damage with optical microscope. Meanwhile, instead of using SEM, optical microscope is eligible to observe the boundary of subsurface damage. The depth of subsurface damage results of nonrecrystallized samples are summarized in Table 4. Note that the values have a similar trend as before, but they are significantly larger.
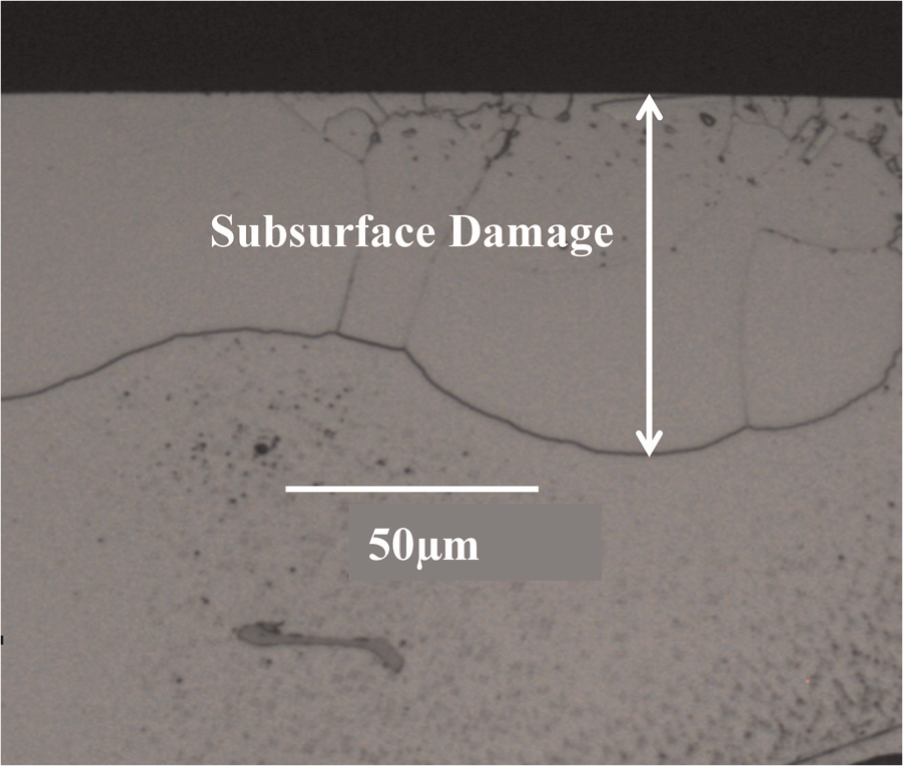
Optical image of the recrystallized microstructure (DoC = 0.050 mm, v = 20 m/min).
Summary of the depth of subsurface damage measurements for recrystallized samples.
Finite element simulations
Simulation model setup
Finite element simulations were developed to study the mechanics of machining and to estimate the amount of plastic deformation and temperature rise induced in the part. Abaqus/Explicit software was used to simulate the same process conditions as in the experiments. The finite element modeling was executed as follows:
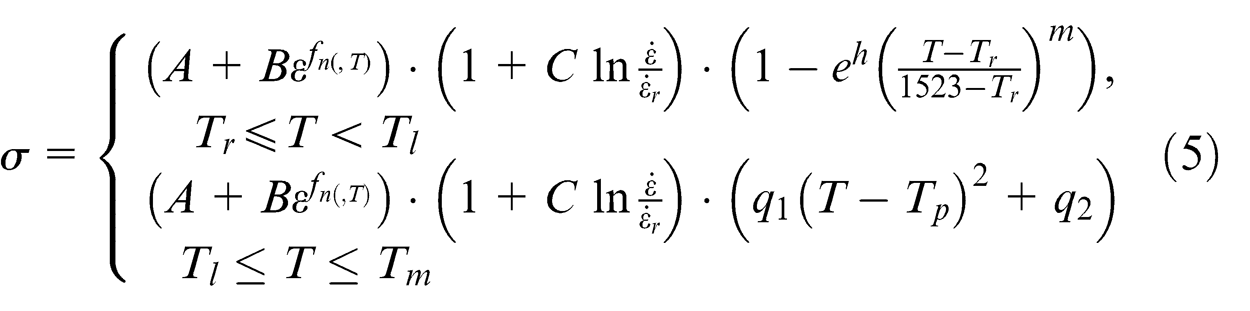
The material is assumed isotropic. A novel constitutive model for nickel-based superalloys was previously derived by the authors, and this model is integrated in the simulations by developing user-defined material subroutine, and the novel constitutive model derived is used. 22 The material model is shown in equation (5), and its coefficients are given in Table 5
Summarized coefficients of the proposed model.
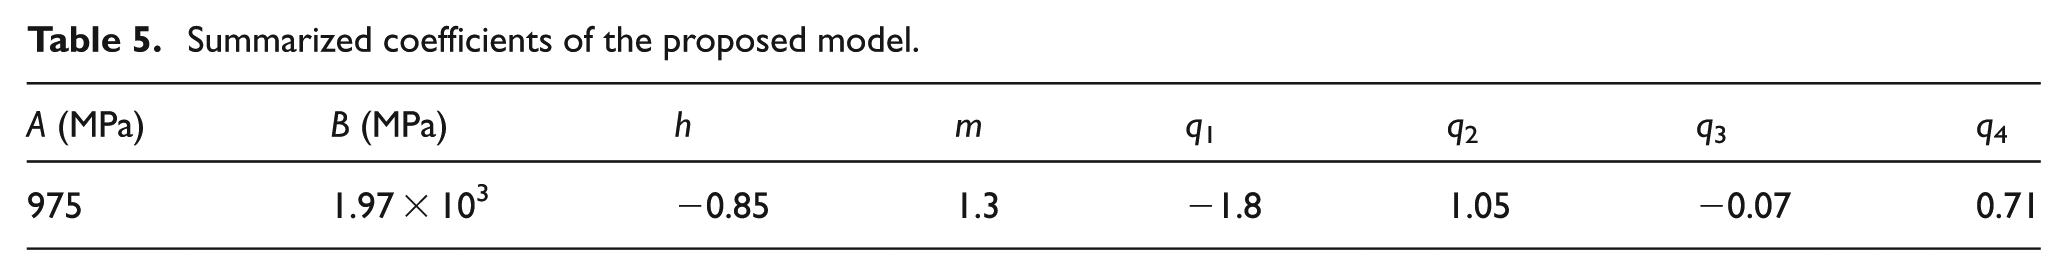
Besides the parameters included in the J-C model, presented earlier, the material model given by equation (5) includes the following terms:
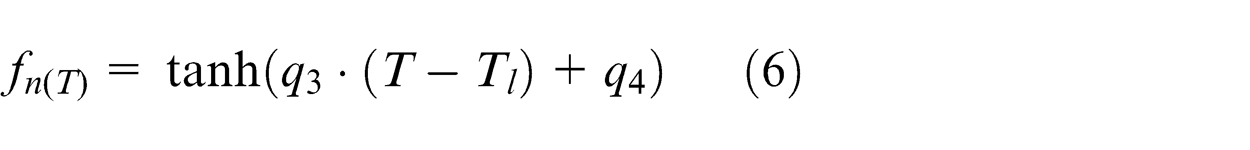
Strain hardening function (first item in the equation), which will determine the beginning of increasing portion of strain–stress curve. In strain hardening function, strain hardening exponent function is defined as
Strain rate sensitivity, which is the second item in equation (5);
Thermal softening or hardening with piece-wise method on two different temperature ranges.
In equations (5) and (7), Tr = 294 K, Tl = 922 K, Tp = 1033 K, and Tm = 1523 K. Through regression method, the coefficients h, m, q 1, q 2, q 3, and q 4 were determined as given in Table 5.
Workpiece size is 1 mm in height and 5 mm in length;
The elements of workpiece and the tool model are four-node bilinear displacement and temperature quadrilateral elements (CPE4RT), and a plane strain assumption for the deformations in orthogonal cutting. The workpiece had 35,751 elements. Bias mesh is applied to finer the mesh size around the radius of tool. The minimum size is 0.001 mm;
The cutting tool is assumed as analytical rigid body;
The thermal expansion and conduction are taken into consideration;
Since cutting process includes large deformation, arbitrary Lagrangian–Eulerian (ALE) meshing is applied in the simulations. Also, relax stiffness method is applied to control the hourglassing and avoid extreme distortion of the elements;
The cutting tools are defined as the rigid body with considering thermal conductivity;
The flank wear values are taken from orthogonal cutting experiments (Figure 12), summarized earlier, and are used to construct the tool geometries to include wear in the simulations according to the experimental test. In the simulations, the flank wear is defined by modifying the tool radius and release face of the insert, as shown in Figure 13. This modification induces lower depth of cut and larger contact area;
The contact between tool and workpiece is defined as penalty contact. The friction coefficient is set as 0.3 between all the interfaces. The code is shown as:
*Surface Interaction, name = IntProp-1
*Friction
0.3,
**Interaction: Int-1
*Contact Pair, interaction = IntProp-1, mechanical constraint = PENALTY, cpset = Int-1 (all faces from workpiece, outside face of tool);
The cutting simulation is an extremely large plastic deformation process, during which the face of the tool makes contact with all the four faces of the elements in workpiece, as shown in Figure 14. Face 1 (F1)–face 4 (F4) in each element are defined with the contact property mentioned above, and thus, the penetrating phenomenon does not appear during orthogonal cutting;
No vibrations occur between workpiece and cutting tool;
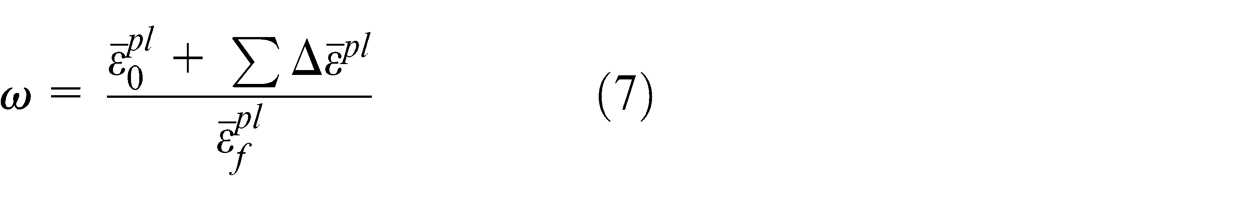
To fulfill the chip separation from the workpiece, failure criteria and element deletion are applied in orthogonal cutting simulation. Failure criterion is defined by comparing the equivalent plastic strain to a failure value. Element deletion is defined when the damage parameter, ω, exceeds 1. The damage parameter is defined by the equation
Flank wear from orthogonal cutting tests.
Tool wear definition in FEA.
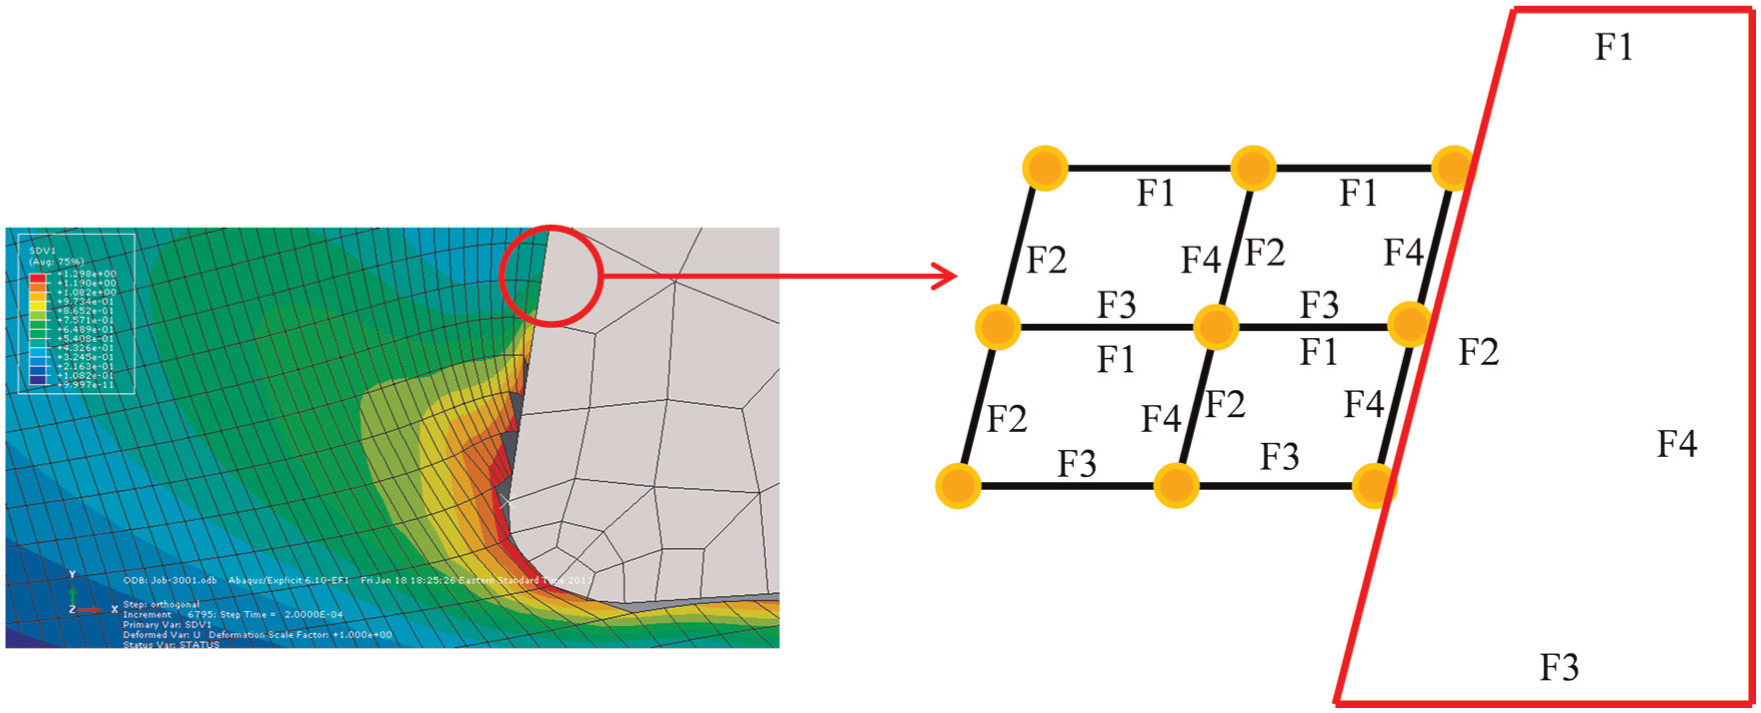
Faces of elements contact between tool and workpiece.
where
Simulation results
Cutting force verification
In orthogonal cutting simulation, the reaction cutting force is given by the reaction force from the elastic and plastic deformation as well as friction force. In the simulations, oscillating forces are observed in the resultant force due to the deletion of elements, and thus, a direct comparison of the force profile is not possible. Another aspect is that the experiments show an increasing trend attributed to the tool wear, which cannot be reproduced yet in the simulations. In order to compare the cutting force between FEA simulation and experiments, the average maximum cutting force from a relatively constant stage is selected from the experimental results. As previously mentioned, during the fifth revolution of the orthogonal cutting test, the tool wear and the force are at relatively stable levels. Thus, these are the values to be compared to the FEA simulation performed for a similar tool wear. The results are plotted in Figure 15 for both sets of tests (speed or depth of cut is varied), and a very good agreement is observed.
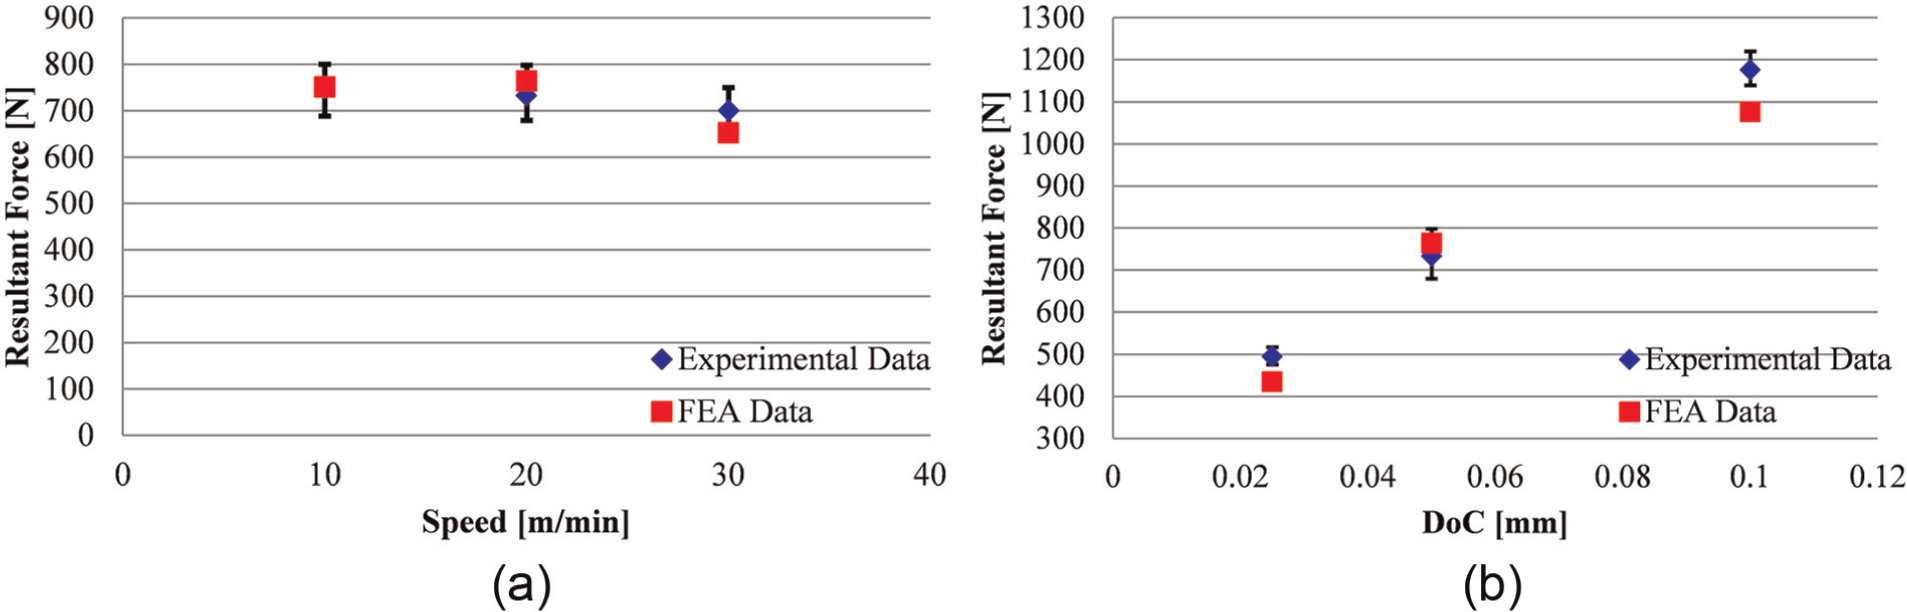
Experiments versus FEA—resultant force comparison: (a) resultant cutting force versus surface speed (DoC = 0.05 mm) and (b) resultant cutting force versus depth of cut (v = 20 m/min).
Subsurface damage verification
A threshold von Mises stress is needed for the FEA simulation to determine the boundary of subsurface damage. To determine the threshold stress, the residual stresses were output along the depth of machining affected zone from the FEA simulations, as shown in Figure 16. The depth of subsurface damage measurements for the set of tests for varying the speed, summarized earlier in Table 4, was utilized as target. The intersection line between these two surfaces was selected as the threshold value to determine the depth of subsurface damage. Then, according to the determined threshold stress value, the position of the node is obtained. The depth of subsurface damage is calculated by measuring the position of the node.
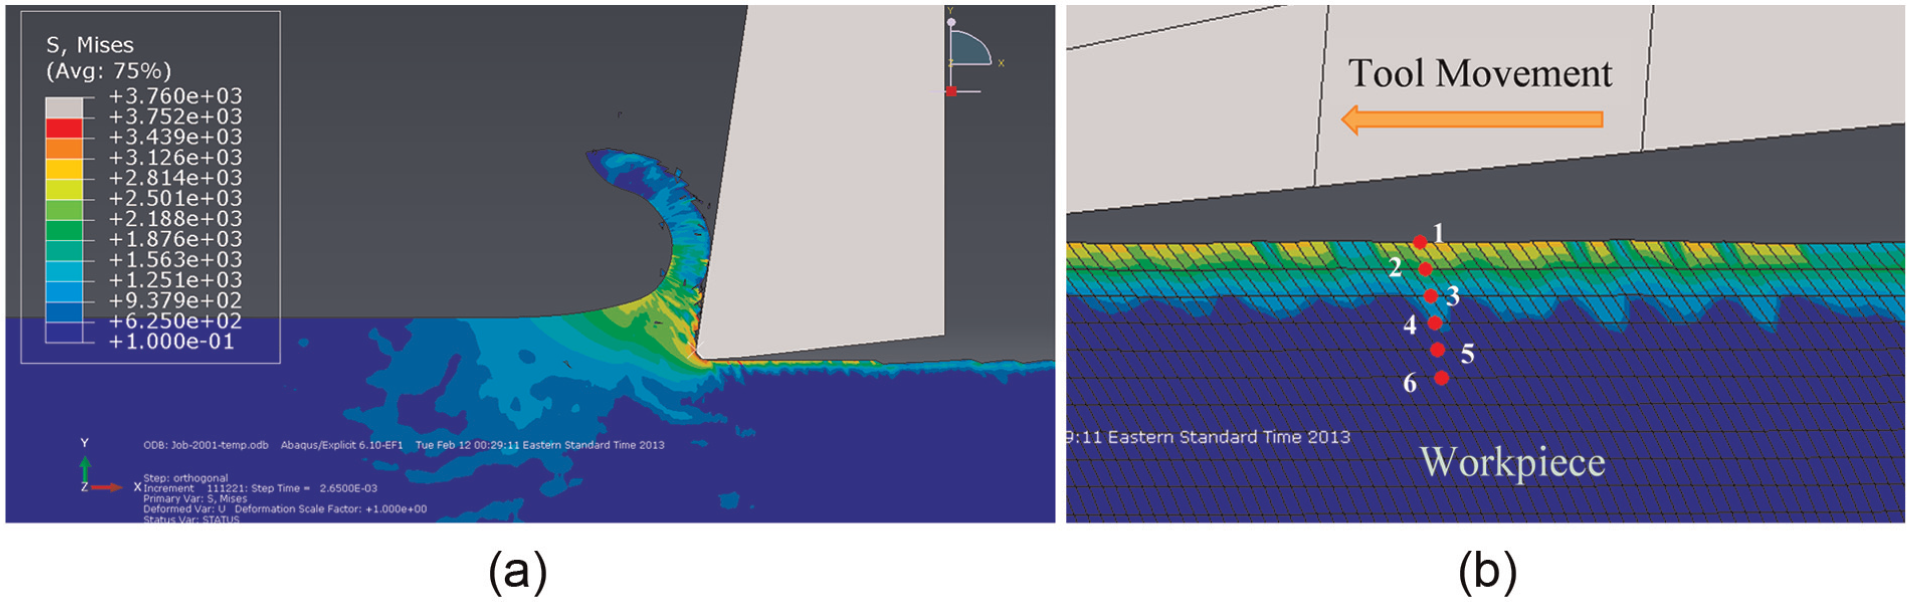
(a) von Misses stress distribution for v = 20 m/min and DoC = 0.1 mm and (b) subsurface measurement from node to node.
Figure 16 is an example showing the von Mises stress in the subsurface damage layer. The von Mises stresses of the first six nodes from Figure 16, which are beneath the machined surface, are outputted and summarized in Figure 17. After the relax process, the von Mises stress stays at a constant level.
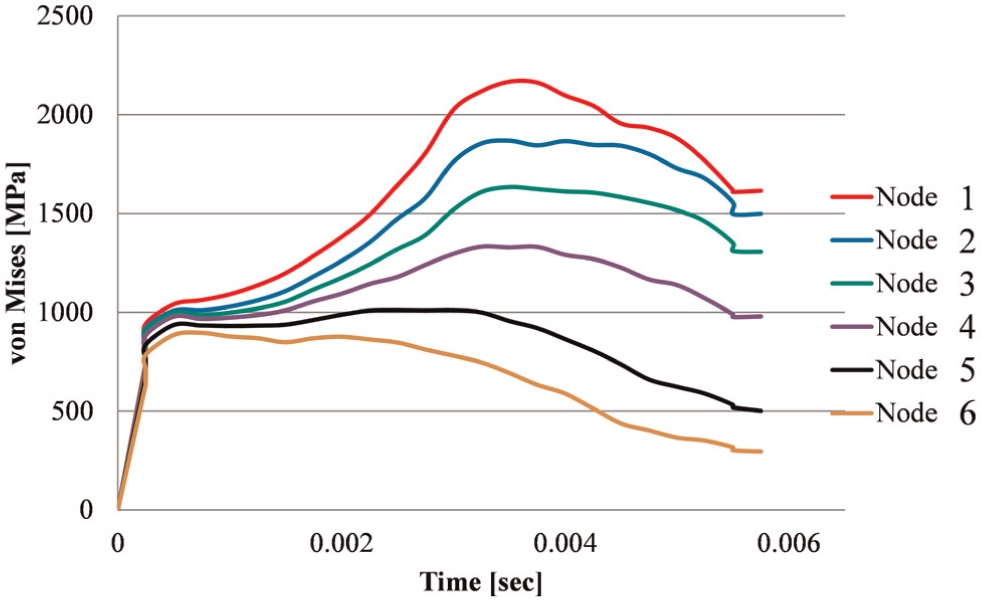
Residual stress on each node along the machined subsurface for v = 20 m/min and DoC = 0.1 mm.
In order to determine the threshold stress value, a sweep stress comparison has been performed from 550 to 1555 MPa, as shown in Table 6. The position for each stress was calculated using linear interpolation between two adjacent nodes with known positions. Then, the experimental results are applied as a target to compare with the FEA results.
Stress sweep measurements of threshold value to determine the boundary of the subsurface damage layer.
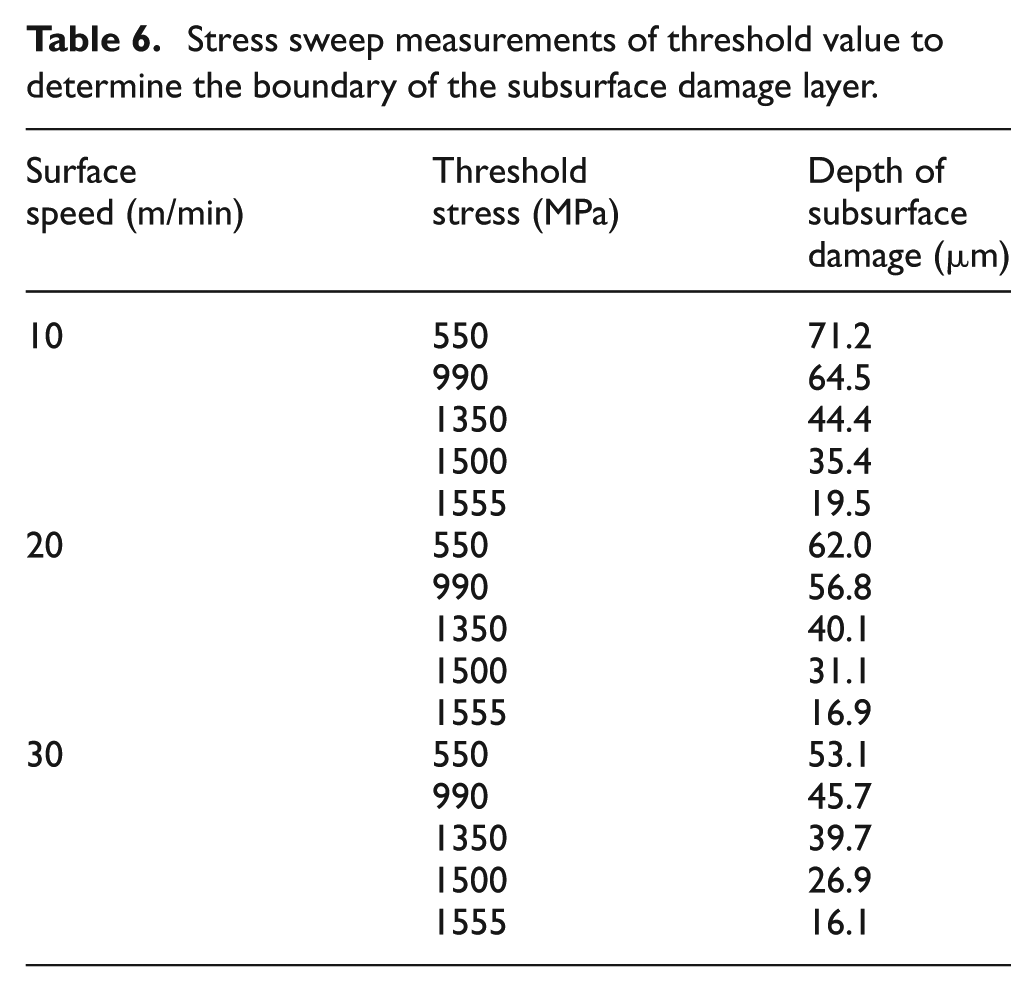
Figure 18 shows an objective method to determine the threshold stress value for the depth of subsurface damage for FEA simulation by comparing to the experimental results. Using the second-order function
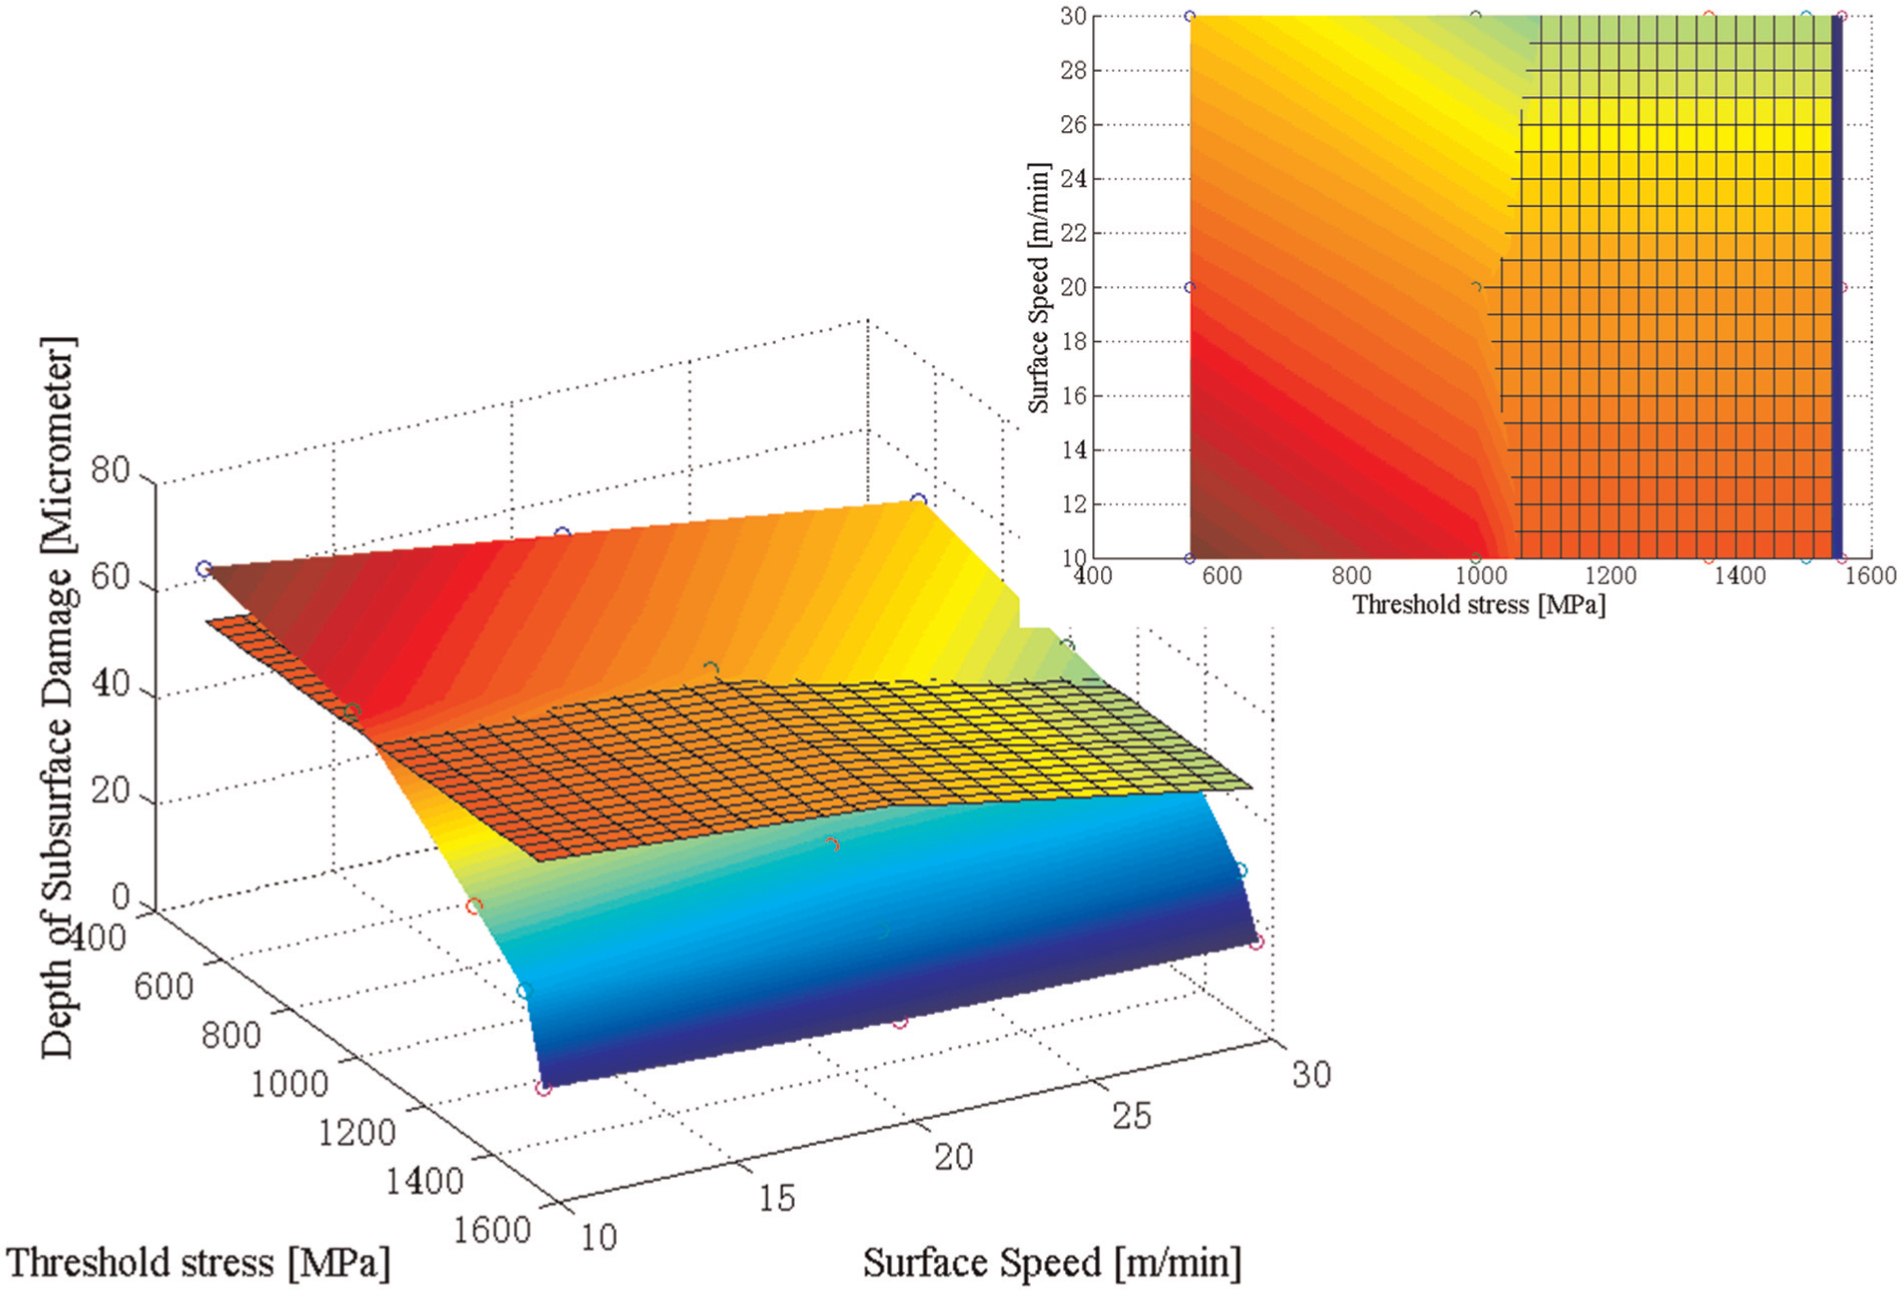
Comparison between experimental and FEA results used to determine the threshold stress.
Further observations can be drawn from Figure 18. At the 16-μm depth beneath the machined surface, the residual stresses for three surface speeds are all 1555 MPa. Although the subsurface damage decreases with increase in speed, the surface speed is not a significant factor to the depth of subsurface damage at this depth of cut.
The results for the recrystallized samples were measured and compared to the FEA results in Figures 19 and 20. As presented earlier, the threshold stress was determined using the data from experiments, as plotted in Figure 19. Then, the threshold was applied for the second set of tests (at varying depth of cut), and the results from FEA were compared with the experiments in Figure 20, which shows a very good agreement.
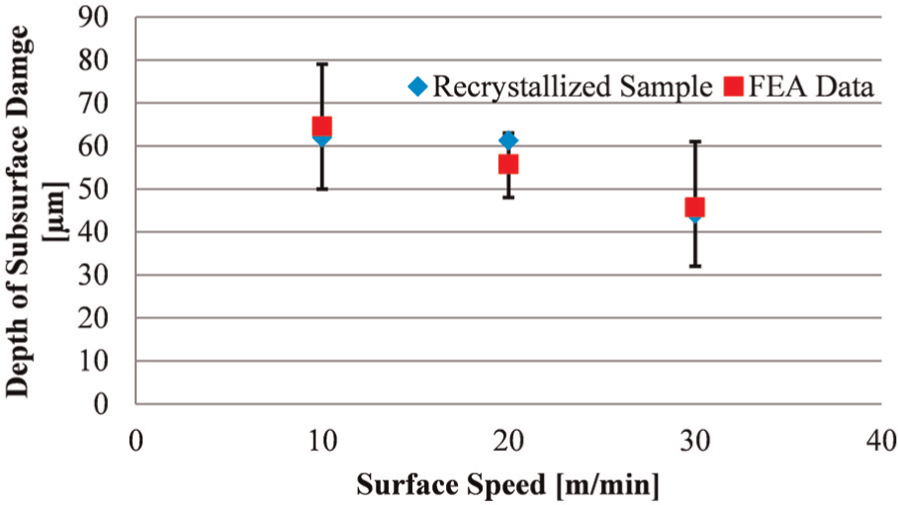
Depth of subsurface damage for varying speed (DoC = 0.05 mm).
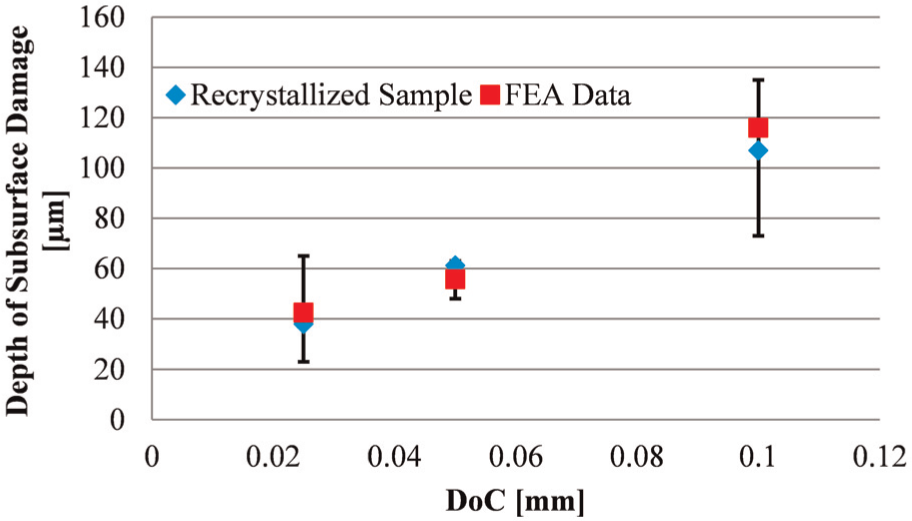
Depth of subsurface damage for varying depth of cut (v = 20 m/min).
From these figures, it is concluded that with the experimental determined threshold stress, depth of subsurface damage from FEA simulation matches the recrystallized experimental sample. The agreement is higher than 90%. It is also concluded that with the same depth of cut values, increasing surface speed may induce lower depth of subsurface damage. Meanwhile, for the same surface speed, larger depth of cut results in deeper subsurface damage with an apparent linear relationship.
Conclusion and future work
The authors presented research work in orthogonal cutting of γ′-strengthened nickel-based superalloys. Experimental investigations and finite element simulations were performed for the evaluation of cutting forces and estimation of the subsurface damage. The following conclusions can be drawn from this study:
The results show that the presence of the subsurface damage when machining nickel-based superalloys depends on both the cutting speed and the depth of cut. For the range studied, an increase in speed from 10 to 30 m/min resulted in slightly lower damage in the workpiece. The effect of the speed is less than 18%. The depth of cut had a significant influence on the subsurface damage;
Finite element simulations were used for estimating the damage, and thus, the trial-and-error tests, as well as the destructive methods for evaluation, can be reduced or avoided. Improved constitutive model for γ′-strengthened nickel-based superalloy was successfully employed in the FEA simulation. User-defined material stress updated subroutine was developed to depict the plastic performance of the material. The comparison of forces showed a good agreement between the simulations’ predictions and the experiments;
Thermal recrystallization technique was used to obtain a more objective method of subsurface damage estimation;
The results from the FEA simulation, nonrecrystallized samples, and recrystallized samples were compared. With a threshold value for the von Mises stress of 1050 MPa, the FEA method has more than 90% agreement with the recrystallized sample data. The nonrecrystallized sample did not offer an accurate method of estimation but gave an insight into how the machining affects the subsurface layer.
Future works include further refining of the material constitutive model with a validation via temperature measurement. The material constitutive model will be used for milling simulations since milling is the main cutting operations used for the superalloys, and maps will be obtained to correlate the subsurface damage generated under various cutting parameters. These maps will be a good tool for optimizing the production without compromising the surface integrity.
Footnotes
Acknowledgements
The authors would like to express their gratitude to GE Power and Water to support this project.
Declaration of conflicting interests
The authors declare that there is no conflict of interest.
Funding
This research received funding from GE Water and Power.