
Abstract
This article presents an analytical continuous-time Markov chain approach to model a repair system with rotable components for resource allocation. As an important type of repair service system, this repair system with rotable components demonstrated that rotable components can be repaired to an as-new condition and then assembled circularly with rotable-component inventories after a piece of equipment is disassembled. However, with improved efficiency, major difficulties arise in formulating a model and analysing its performance due to the complex fork–join structure and particularly the existence of rotable-component inventories. In our study, a continuous-time Markov chain stochastic model is developed for the repair system with a single rotable component, in which the characteristic constraints to generate a state space are classified as the service capacity, quantitative conservation, and independent loading. The stationary distributions are then attained with programming, and the performance analysis is performed through numerical experiments. In particular, the relationship between the key resources and selected performance indicators is studied to provide a strategy for resource allocation. Furthermore, a multi-component system is also presented based on the proposed method.
Keywords
Introduction
Repair services with rotable components are becoming more important in maintenance industries for many large-scale manufacturing or logistics systems, such as in aerospace, aviation, military, railway, the energy industry, urban railways, and ship building. The parallel mode of component level and equipment level maintenance with standardised rotable components greatly reduces the delay of assembly problems in the original combination. Furthermore, an advantage of recycling rotable components is US$53 billion that is saved in maintenance services in the United States. 1 However, it is challenging to implement a repair system with rotable components because there are various conflicts due to unbalanced resource allocation, for example, the shortage or waste of key resources during the process. To wisely take the best advantage of extremely limited funds and resources available, decision makers in charge of maintaining and improving the quality of facilities and equipment should possess the most accurate and optimum maintenance strategies to base their decisions upon. Regarding large-scale maintenance facilities and high expenditures on rotable components, resource allocation remains a top priority in repair systems with rotable components.
Providing the optimum system model and allocation strategies has been a task that has attracted the attention of many researchers in recent years, and several stochastic methods have been proposed for repair systems, such as the transfer line, flow line, and tandem queue. These methods vary in their goals, constraints, and solution methodologies; however, one objective remains the same: to provide the least expensive and most efficient maintenance plans during the lifetime of deteriorating systems. However, there is a lack of detailed literature in the field of repair systems with rotable components due to the acknowledged academic difficulty of modelling a parallel structure between component repair and fork–join operations. 2
Since the past decade, interest by researchers on repair systems with rotable components and the maintenance services of large-scale facilities have only focused on discrete deterministic models and approximate presentations. From 1996 to 2000, Guide and colleagues3–7 presented a series of articles on production planning and control by discrete simulation to consider the repair system with rotable components systematically. Following the method of discrete treatments and operations research, many researchers extended the study scope. Ni et al. 1 used a linear stochastic model with a dynamic programming algorithm in the inventory control policy for maintenance networks. Tu et al. 2 developed a model reduction for a fork–join overhaul and repair system with rotable inventory on a turnaround time; however, the authors only proposed an approximate second-order presentation due to the complex logical construction. Despite the variety of available methods presented in literature, the fork–join queue network with blocking (FJQN/B) can approximate the repair system structure with rotable components. FJQN/B is composed of a server set and buffer set, and only a single buffer exists between neighbour servers with an infinite buffer size. Solution methods on distinct model assumptions, such as ignoring the fork–join operating time, deterministic time of the fork–join operation, or blocking relaxation, have been developed.8,9
To accommodate a variety of production systems, the methodology of a Petri net has been deeply involved. Although Petri nets have been used to model the fork–join system required for kanban-controlled systems 10 and other manufacturing systems for specific performance analysis and optimisation,11–13 Petri nets have never been applied in the field of overhaul and repair systems to model rotable inventory. Li et al. 14 applied a Petri net model in the analysis and optimisation of a rotable-component system, in which the simulation validated the exponential distribution for time-related parameters and also the correctness of the model mechanism. In view of the inherent consistency of our continuous-time Markov chain (CTMC) model and the aforementioned Petri net model, in our study, the operating time follows the exponential distribution, and the CTMC model is validated.
Because so few works have studied the performance of a repair system with rotable components, it is difficult to evaluate and optimise the system performance in the early stage. The performance analysis presented in this article is our first attempt in this direction. The CTMC, with the exact solutions of system states, is applied as a stochastic process approach to base the performance numerical cases upon. In particular, the Markov method and continuous-time treatment are seldom mentioned in the latest research reports on systematic levels with rotable components. This research is developed step-by-step to evaluate the performance of a repair system with rotable components. The CTMC algorithm is used to build the mathematical models. First, based on the mathematical model for a repair system with a single rotable component, the criterion for the state space and state transition is designed and established. Also, the complexity of a single-component system is presented. Then, the performance of a repair system with a single rotable component is studied through numerical experiments, which focus on the relationships of four types of resource allocation problems, which include allocation of stations, scale of rotable inventories, station scale, and operating rate. Three performance indicators, that is, the throughput (TP), work in process (WIP), and utilisation, are analysed to investigate the aforementioned system performance problems. Conclusions are drawn to obtain the important effects between the crucial resources and selected indicators of the repair system with rotable components. Finally, the study is extended to a multi-component system.
CTMC model
Problem description
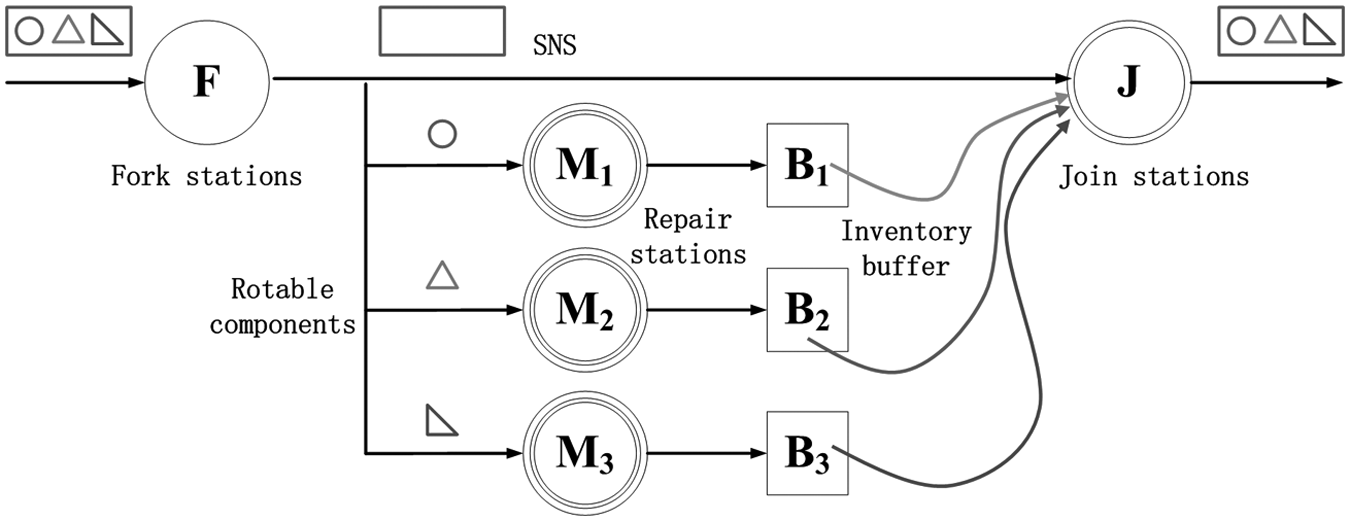
The repair system with single rotable component shown in Figure 1 is an abstract model of a theoretical repair system with a rotable component, which supposes that the serial-number-specific (SNS) parts are of perfect quality, whereas the rotable components are all damaged when they enter the system.
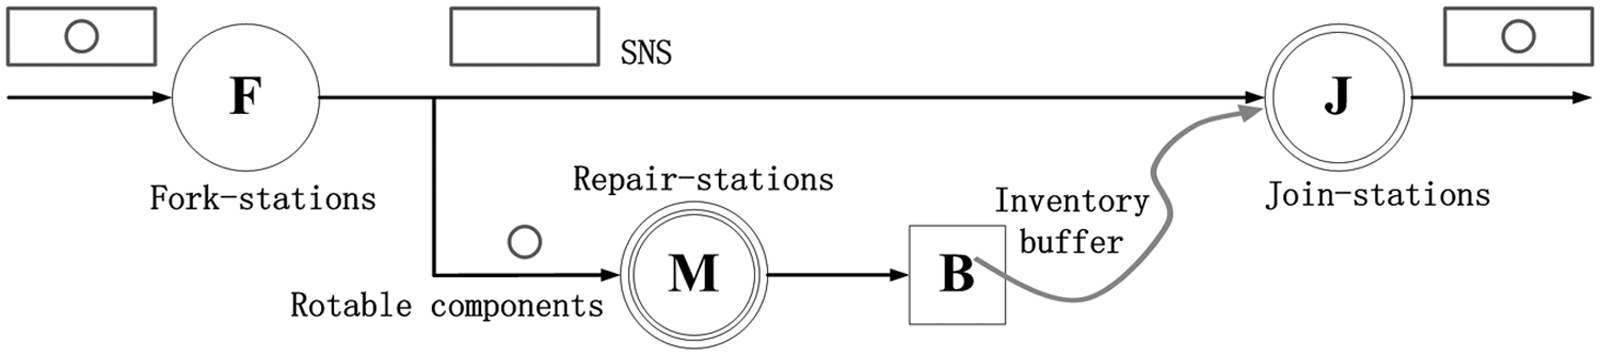
Repair system with a single rotable component.
The physical mechanism is described in the following. The equipment is divided into a perfect SNS component and a damaged rotable component. In the problem condition, there exists an available join station and available rotable component at the inventory buffer, the separate SNS component, and any rotable component from the inventory buffer that could be joined to create a new piece of equipment. In case that no rotable component is available in the inventory buffer, the SNS part has access to the join station that awaits the rotable component. If all join stations are occupied, the SNS part remains at the fork station. Simultaneously, the individual damaged rotable component will enter the inventory buffer after being repaired and waits to be joined with the SNS component by the first-come, first-served (FCFS) policy.
A repair system with rotable components is characterised by two aspects compared with normal repair systems:
Resources of the system. The repair system with rotable components encompasses two major resources: the inventory and fixed stations. To operate a repair system smoothly and efficiently, several rotable components for storage are purchased in advance to avoid a delay in the operating schedule under production fluctuations. Note that due to the high expenditure of rotable components, the size of the inventory is generally only several units. As a result of the wide application of large-scale logistic equipment, a fixed station mode is adopted in the facilities installation.
Structure of the system. First, precedence relations exist in the fork–join process, such that operations are required to follow the job settings. Second, as a typical case of a Markov chain, the fork station is to proceed only in a blocking status, not in a starving status, which is contrary to both the join station and repair station. Third, the system capacity has an upper limit in the size of stations and inventories.
CTMC model
f number of fork stations at the F-zone;
j number of join stations at the J-zone;
m number of repair stations at the M-zone;
i number of rotable components in the inventory buffer;
F(t) operating fork station number;
J 0(t) SNS number at the J-zone, including the joining SNS components and awaiting components;
J 1(t) component number at the J-zone, including the joining components and awaiting components;
M(t) component number at the M-zone, including the components being repaired and awaiting components;
B(t) component number at the inventory buffer.
In the following section on the performance analysis, i1, m1, and M1 are for a single-component system.
Note that the Markov state of the repair system with a single rotable component could be defined as
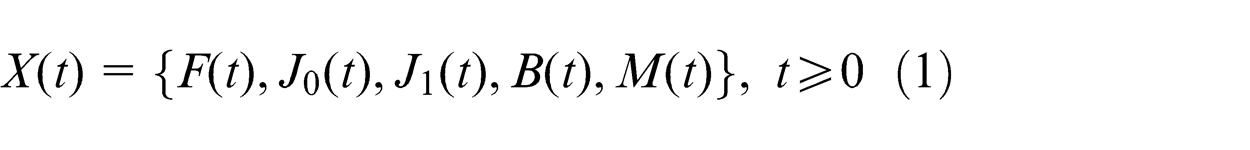
and the state space as
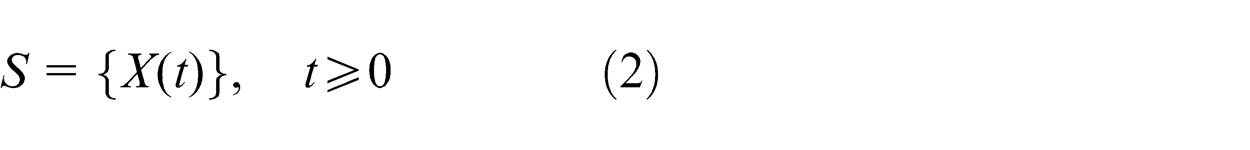
The system state contains five dimensions, where min{J0(t), J1(t)} represents the number of joining SNS and joining components and min{M(t), m} represents the number of components being repaired. The stochastic variables F, J0, J1, M, and B are denoted in brief.
The assumptions include the following:
Infinite input;
Operating time (forking time, joining time, and repair time) follows the independent and identically distributed (i.i.d.) exponential distribution with parameters μF, μJ, and μM;
Simultaneous unloading policy is performed in the F-zone;
Independent loading policy is performed in the J-zone;
Buffer with blocking-after-service is performed in the M-zone;
Inventory buffer contains a certain number of rotable components in advance;
No limit in capacity for both the M-zone and inventory buffer.
Considering the complexity of the generative regulations to the state space in this CTMC model, the following constraints are required
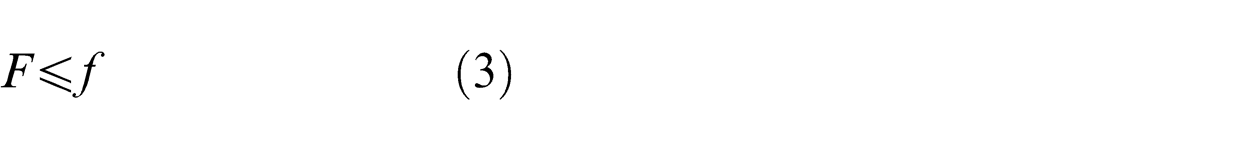
As shown above, constraints (1)–(3) are A-constraints, (4) is a B-constraint, and (5) and (6) are C-constraints.
Table 1 presents the criterion of the state transition in the CTMC model with a repair system with a single rotable component.
Criterion of state transition.
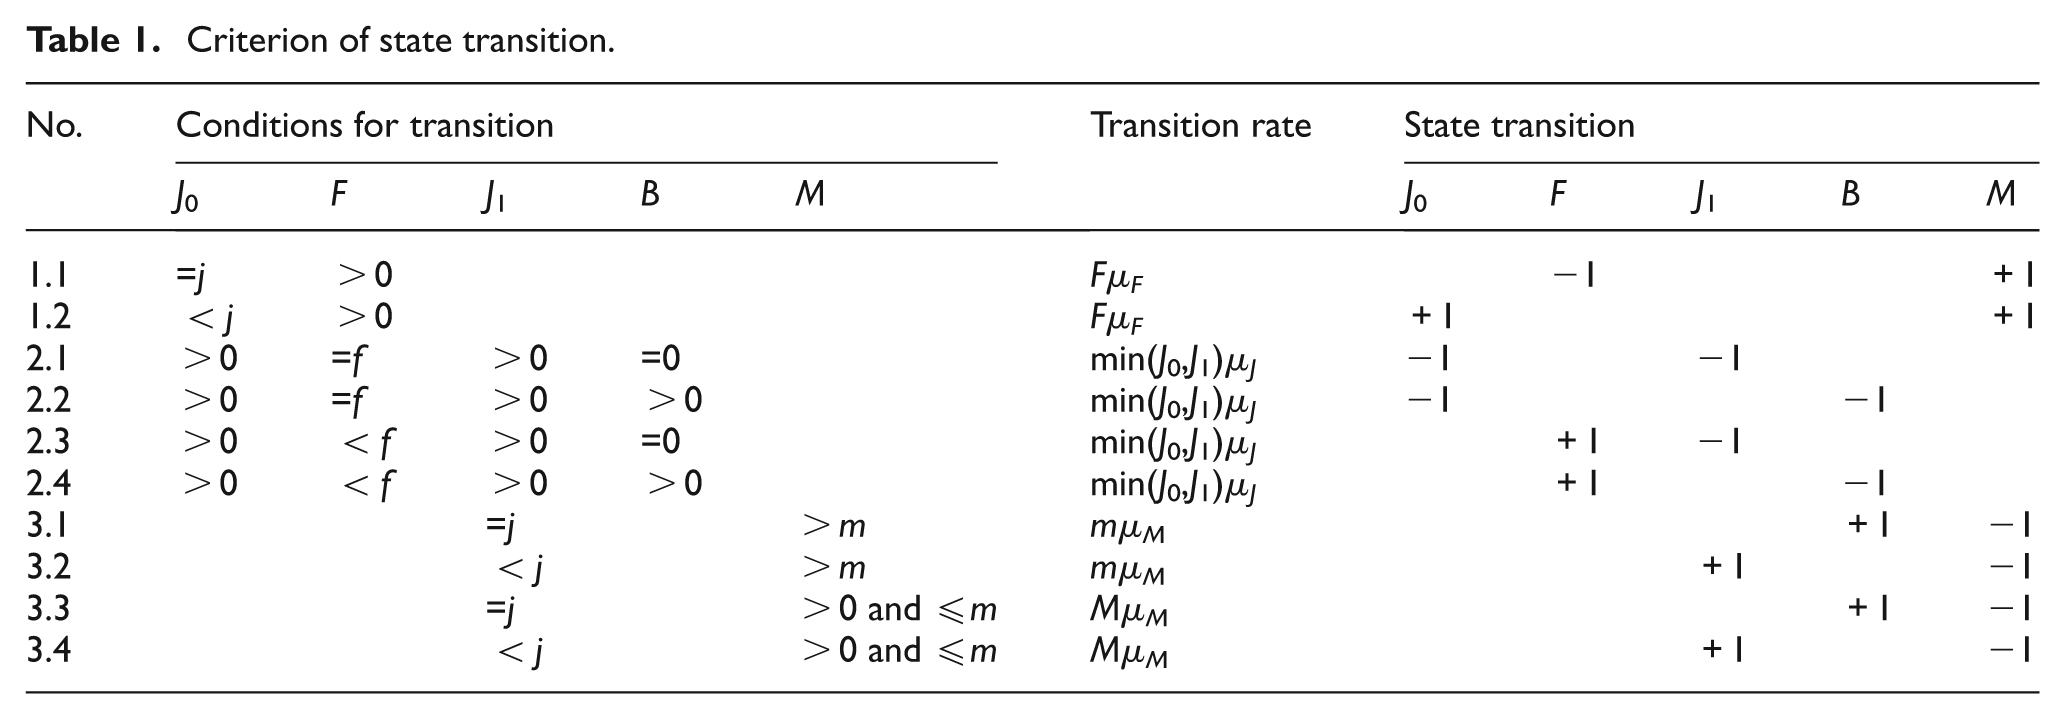
As shown in Table 1, Rule Nos 1.1 and 1.2 are related to a fork operation, Nos 2.1–2.4 are related to a join operation, and Nos 3.1–3.4 are related to a repair operation.
The stationary distribution
Regarding the algorithmic complexity, the number of CTMC states in the single-component system is
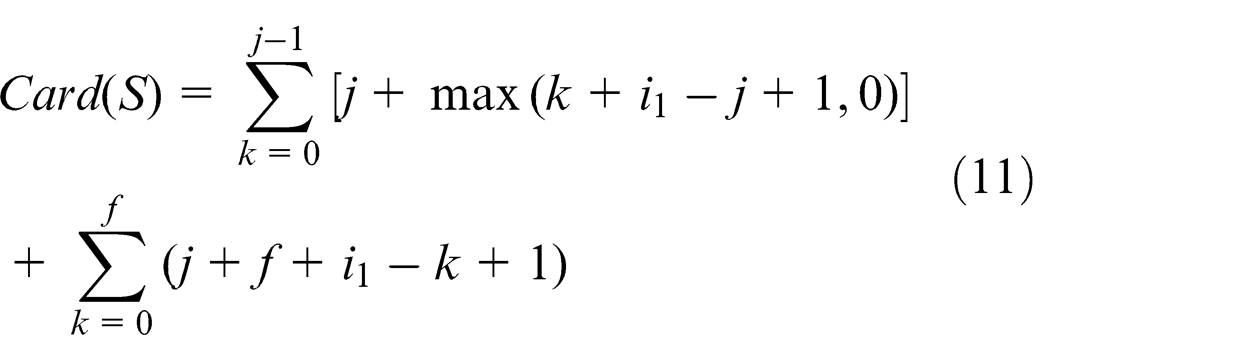
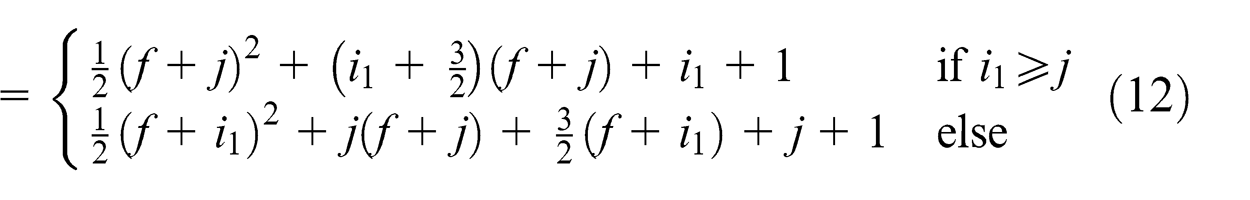
The number of states Card(S) is unrelated to parameter m, whereas the quadratic function with f and j and the linear function with i1 are related to parameter m. Considering the limited value of parameters in a real repair system with rotable components, the proposed model could be solved in an acceptable scale.
Performance analysis of a single-component system
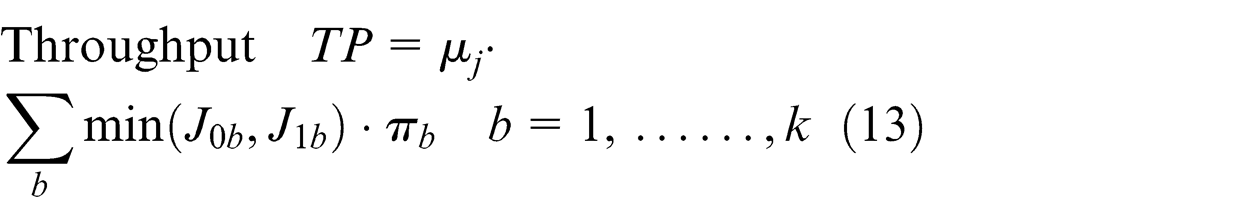
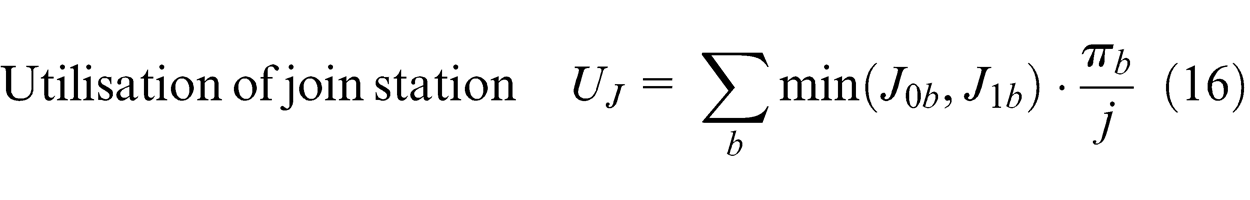
In this study, the focus of interest is the system performance evaluated by the common measures widely adopted in production systems, that is, the TP, WIP, and the utilisation of the implements.
In this section, the performance analysis of a single-component system will be presented through numerical cases with their calculated indicators. During the stage of solving the CTMC model, the algorithm that generates the state space and state transition is coded, and the stationary distribution is achieved by running the code. Second, during the stage of calculating the indicators, the formulations of TP, WIP, and utilisation are proposed, which exactly follows the solution of a stationary distribution. Third, at the core part of the system performance analysis, numerical cases are designed to study the relationship between the indicators and resource allocation problems with station allocation, inventory scale, station scale, and operating time. Also, at the end of this section, the complexity of this model is analysed.
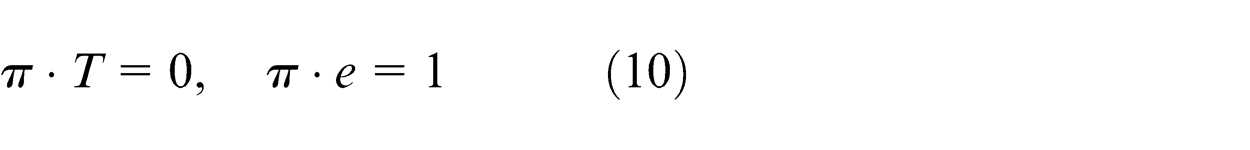
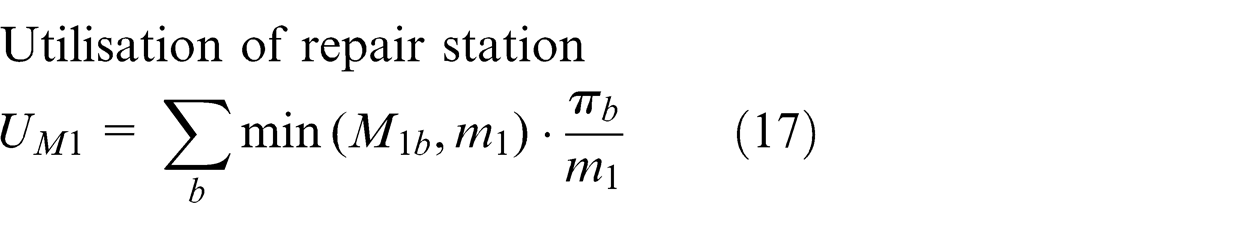
Based on the stationary distribution π derived from the Markov model, the three performance indicators of the repair system with a single rotable component are formulated as


Station allocation
In a deterministic model of production systems, the scale of the operating station is inversely proportional to the operating time to balance product flow. In this section, the numerical experiments were performed to discover the influence of the TP on the allocation of the three types of stations f, j, and m1 at a fixed station scale and inventory level; the goal is to attain the optimal allocation with the maximum TP (Table 2). The values of the model parameters originate from an actual production system.
Numerical experiments on station allocation.
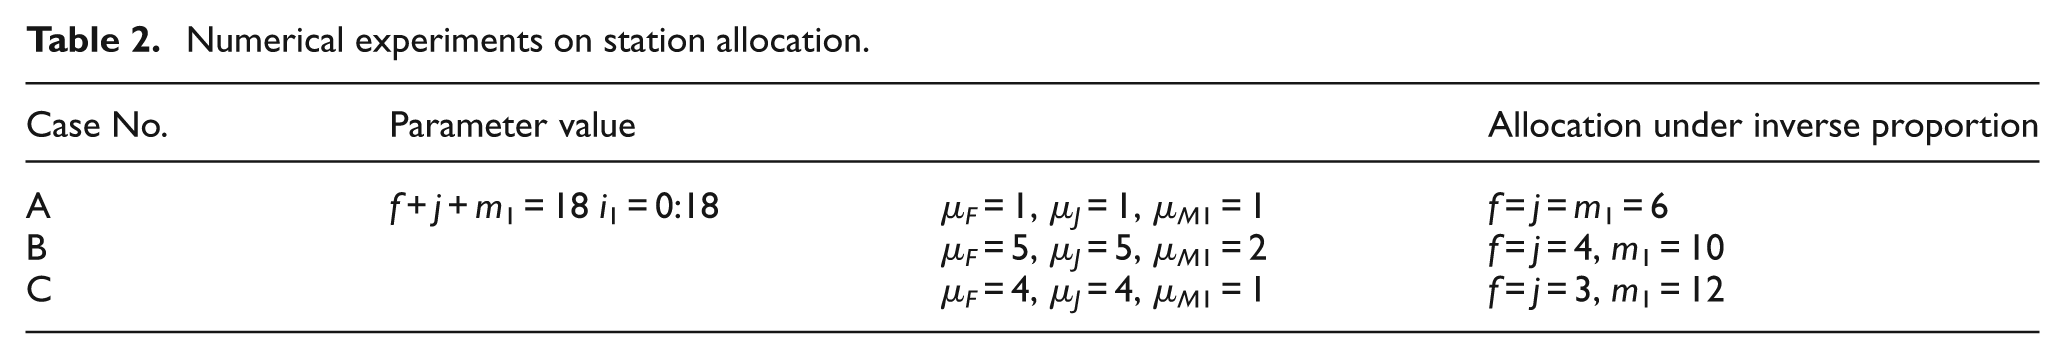
Because the operating time follows an exponential distribution with the same value of expectation and standard deviation, that is, when the operating time with a larger deviation is longer, the allocation under the inverse proportion (IP) is not the optimal solution. In the stochastic model of resource allocation, IP is also part of our experiments, where TPpro represents the TP under this IP relationship, to investigate its applicability.
As shown in Figure 2(a)–(c), the following conclusions can be drawn:
The resource allocation under IP with operating time is not the optimal allocation in stochastic conditions.
The greater the difference of the average operating rates of the three types of stations, the further the optimal allocation deviates from the allocation under IP. Also, the number of stations with a high operating rate in the optimal allocation is greater than that in the allocation under IP.
As the inventory scale increases, the optimal allocation adjusts towards the allocation under IP, and the gap between TPmax and TPpro first becomes smaller and then becomes larger. This result illustrates that the inventory could reduce the gap between the two types of allocation at a certain stage.
TP continues to increase as the inventory scale increases (normal repair system when i1 = 0); however, the marginal utility decreases gradually.
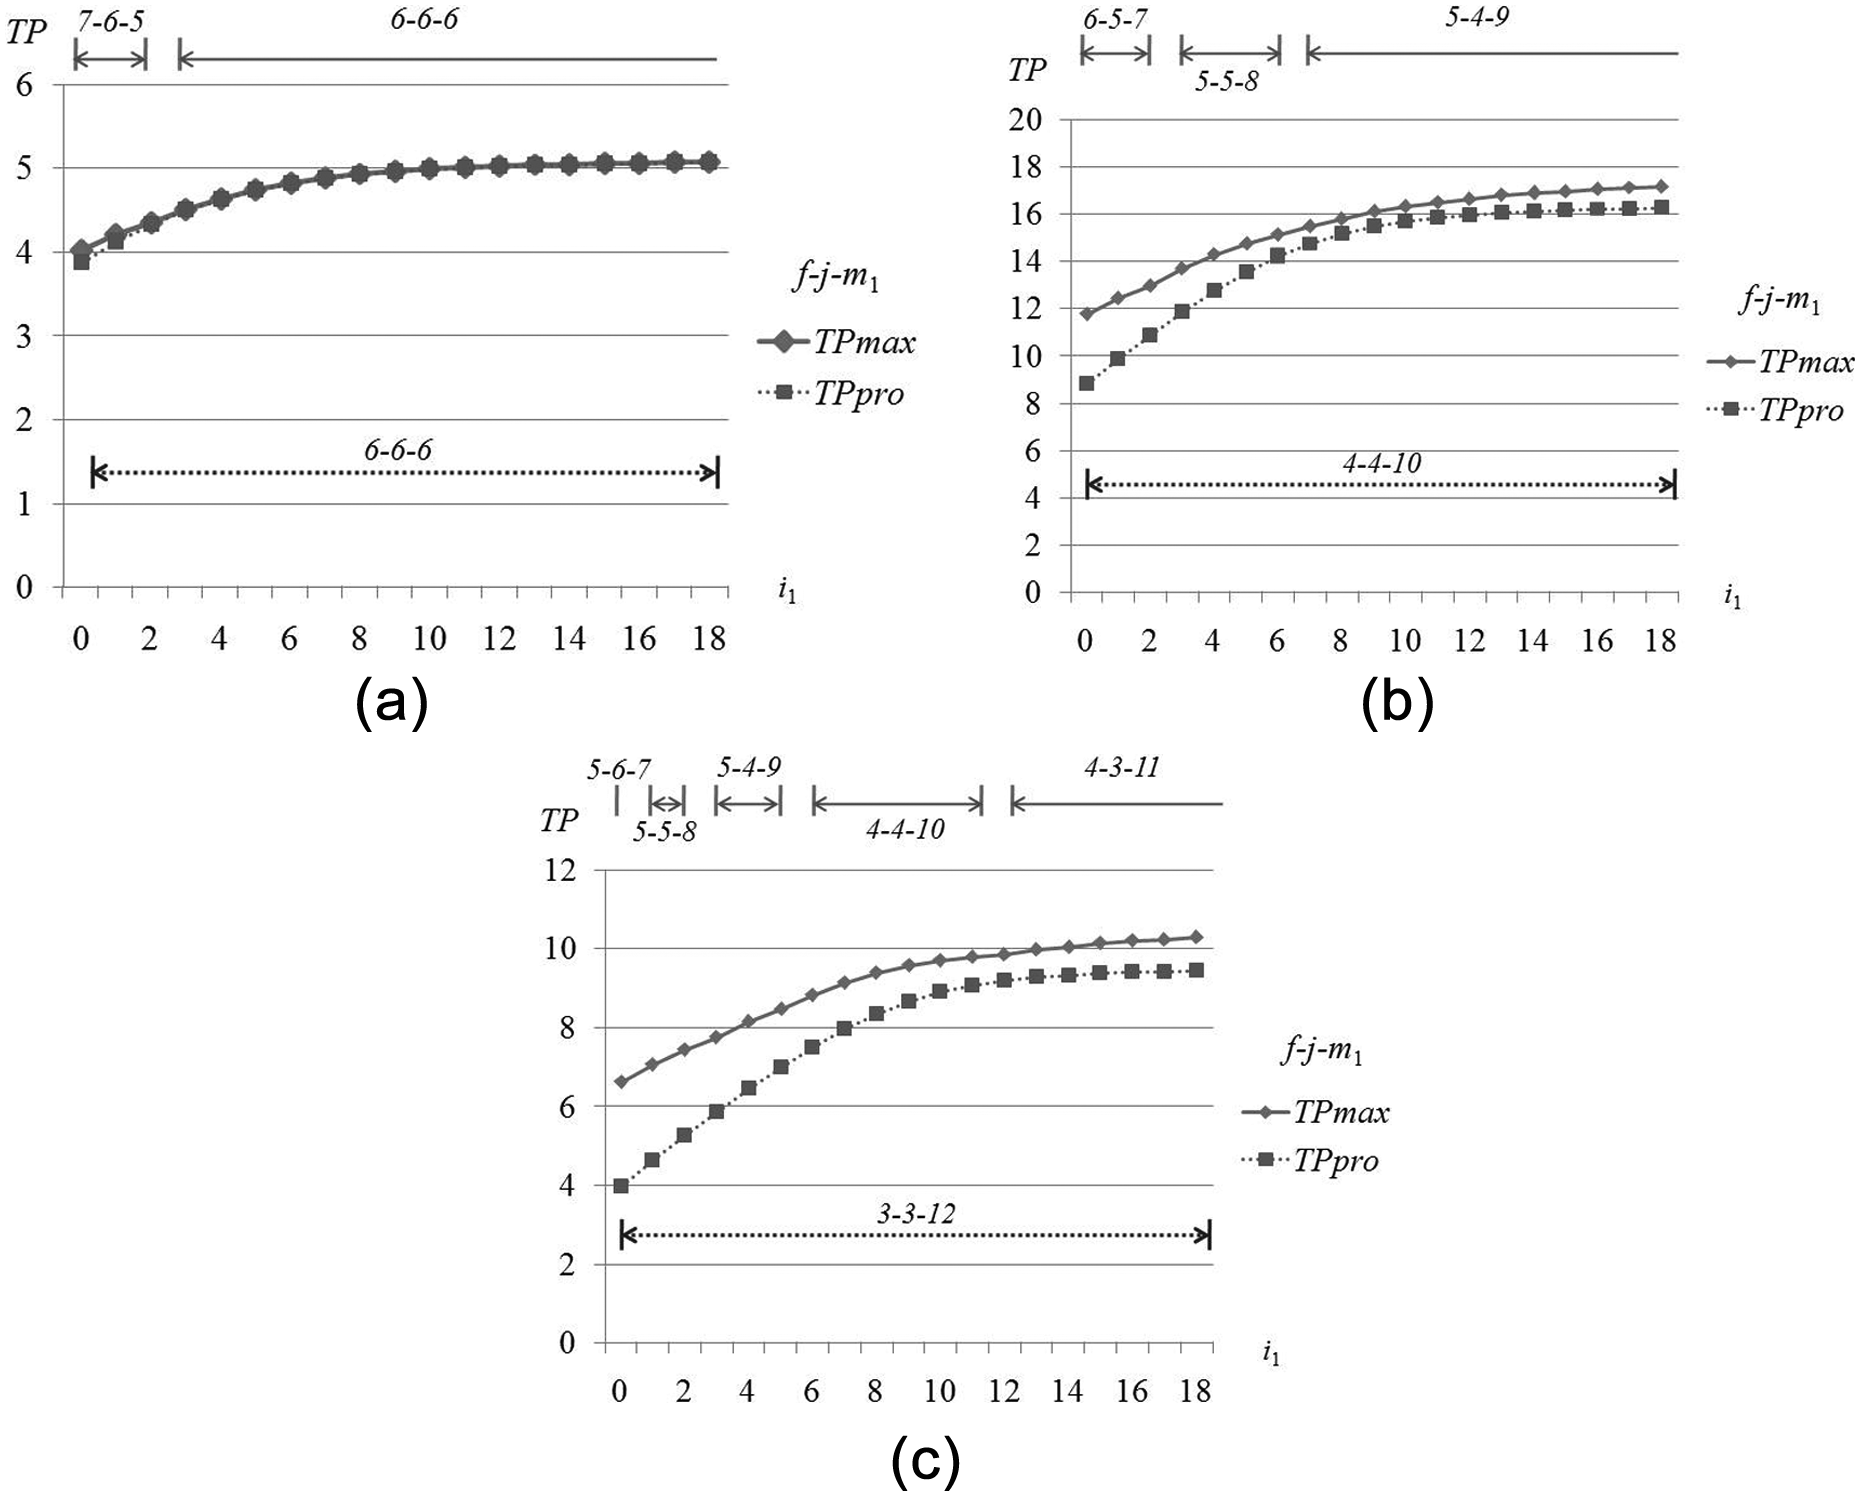
Numerical results on station allocation: (a) Case A, (b) Case B, and (c) Case C.
Inventory scale
Case C is shown in Figure 3 to discuss the performance on inventory scale.
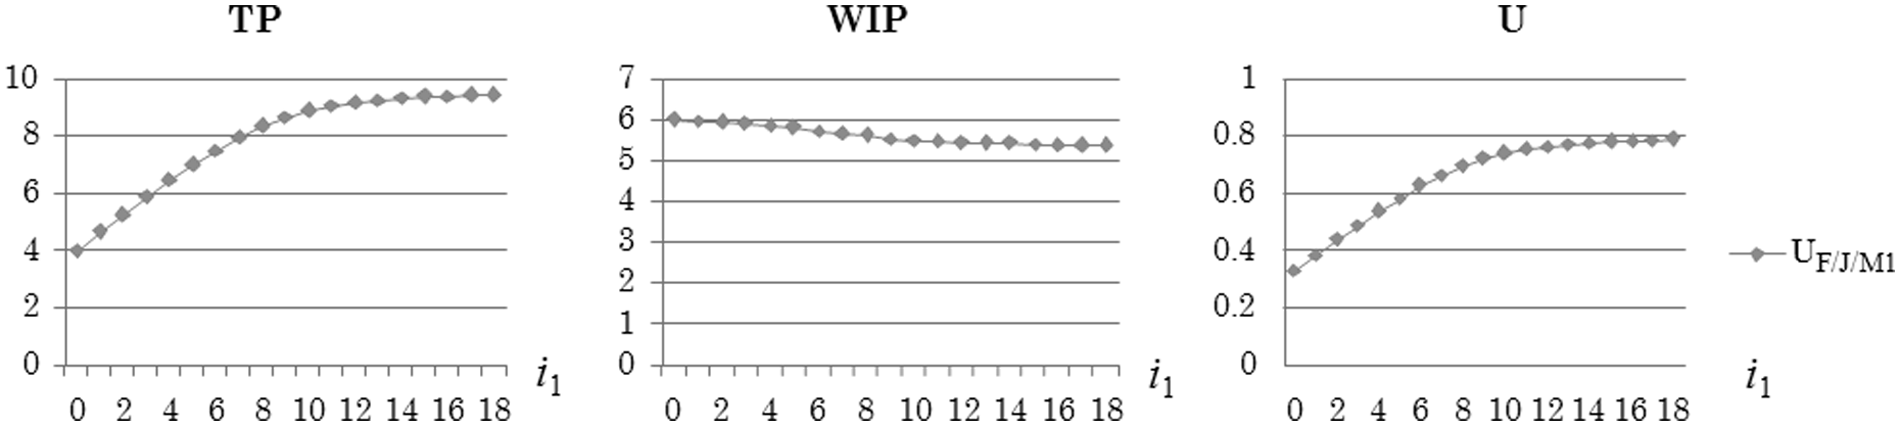
Numerical results of Case C on inventory scale.
The following are the conclusions drawn from the data details:
The marginal utility is displayed on the curve of TP, UF, UJ, UM1, and i1.
Weak variation of WIP when i1 increases. WIP varies only 9.88% when i1 increases from 1 to 18.
Equivalent value of UF, UJ, and UM1 on the allocation under IP. Total operating rate (station scale × station operating rate) leads to the equivalence of the utilities of the three types of stations.
Station scale
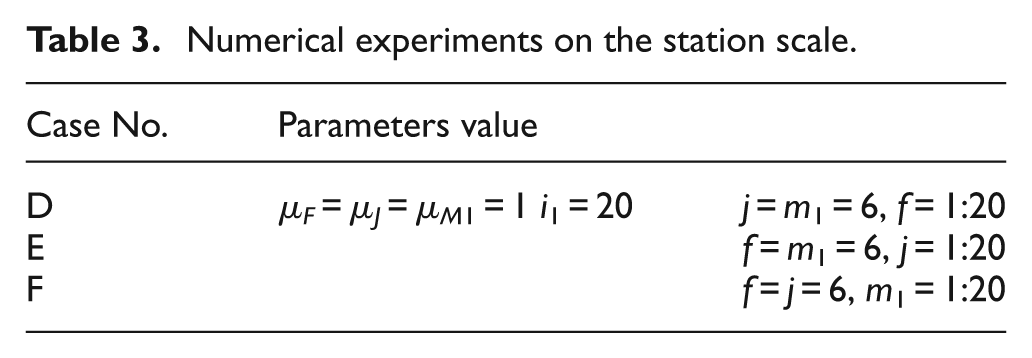
In this section, experiments on the station scale are presented to discover how the variance of a specific station scale affects system performance. The parameter details are shown in Table 3.
Numerical experiments on the station scale.
Conclusions that are drawn from Figure 4 are as follows:
From the experiments, the fork station and join station appear to exhibit a similar pattern, which is different from the repair station, particularly the WIP figure.
Marginal utility is displayed on the curve of TP, UF, UJ, UM1, and i1. The experiment on the repair station highlights a turning point when the repair-station scale reaches 6, which is the allocation result under IP; then, the indicators remain unchanged as the scale increases.
The WIP index is approximately linear with f and j, though exhibits a weak variance with m1 (only 2.88% variance with m1 = 1:20).
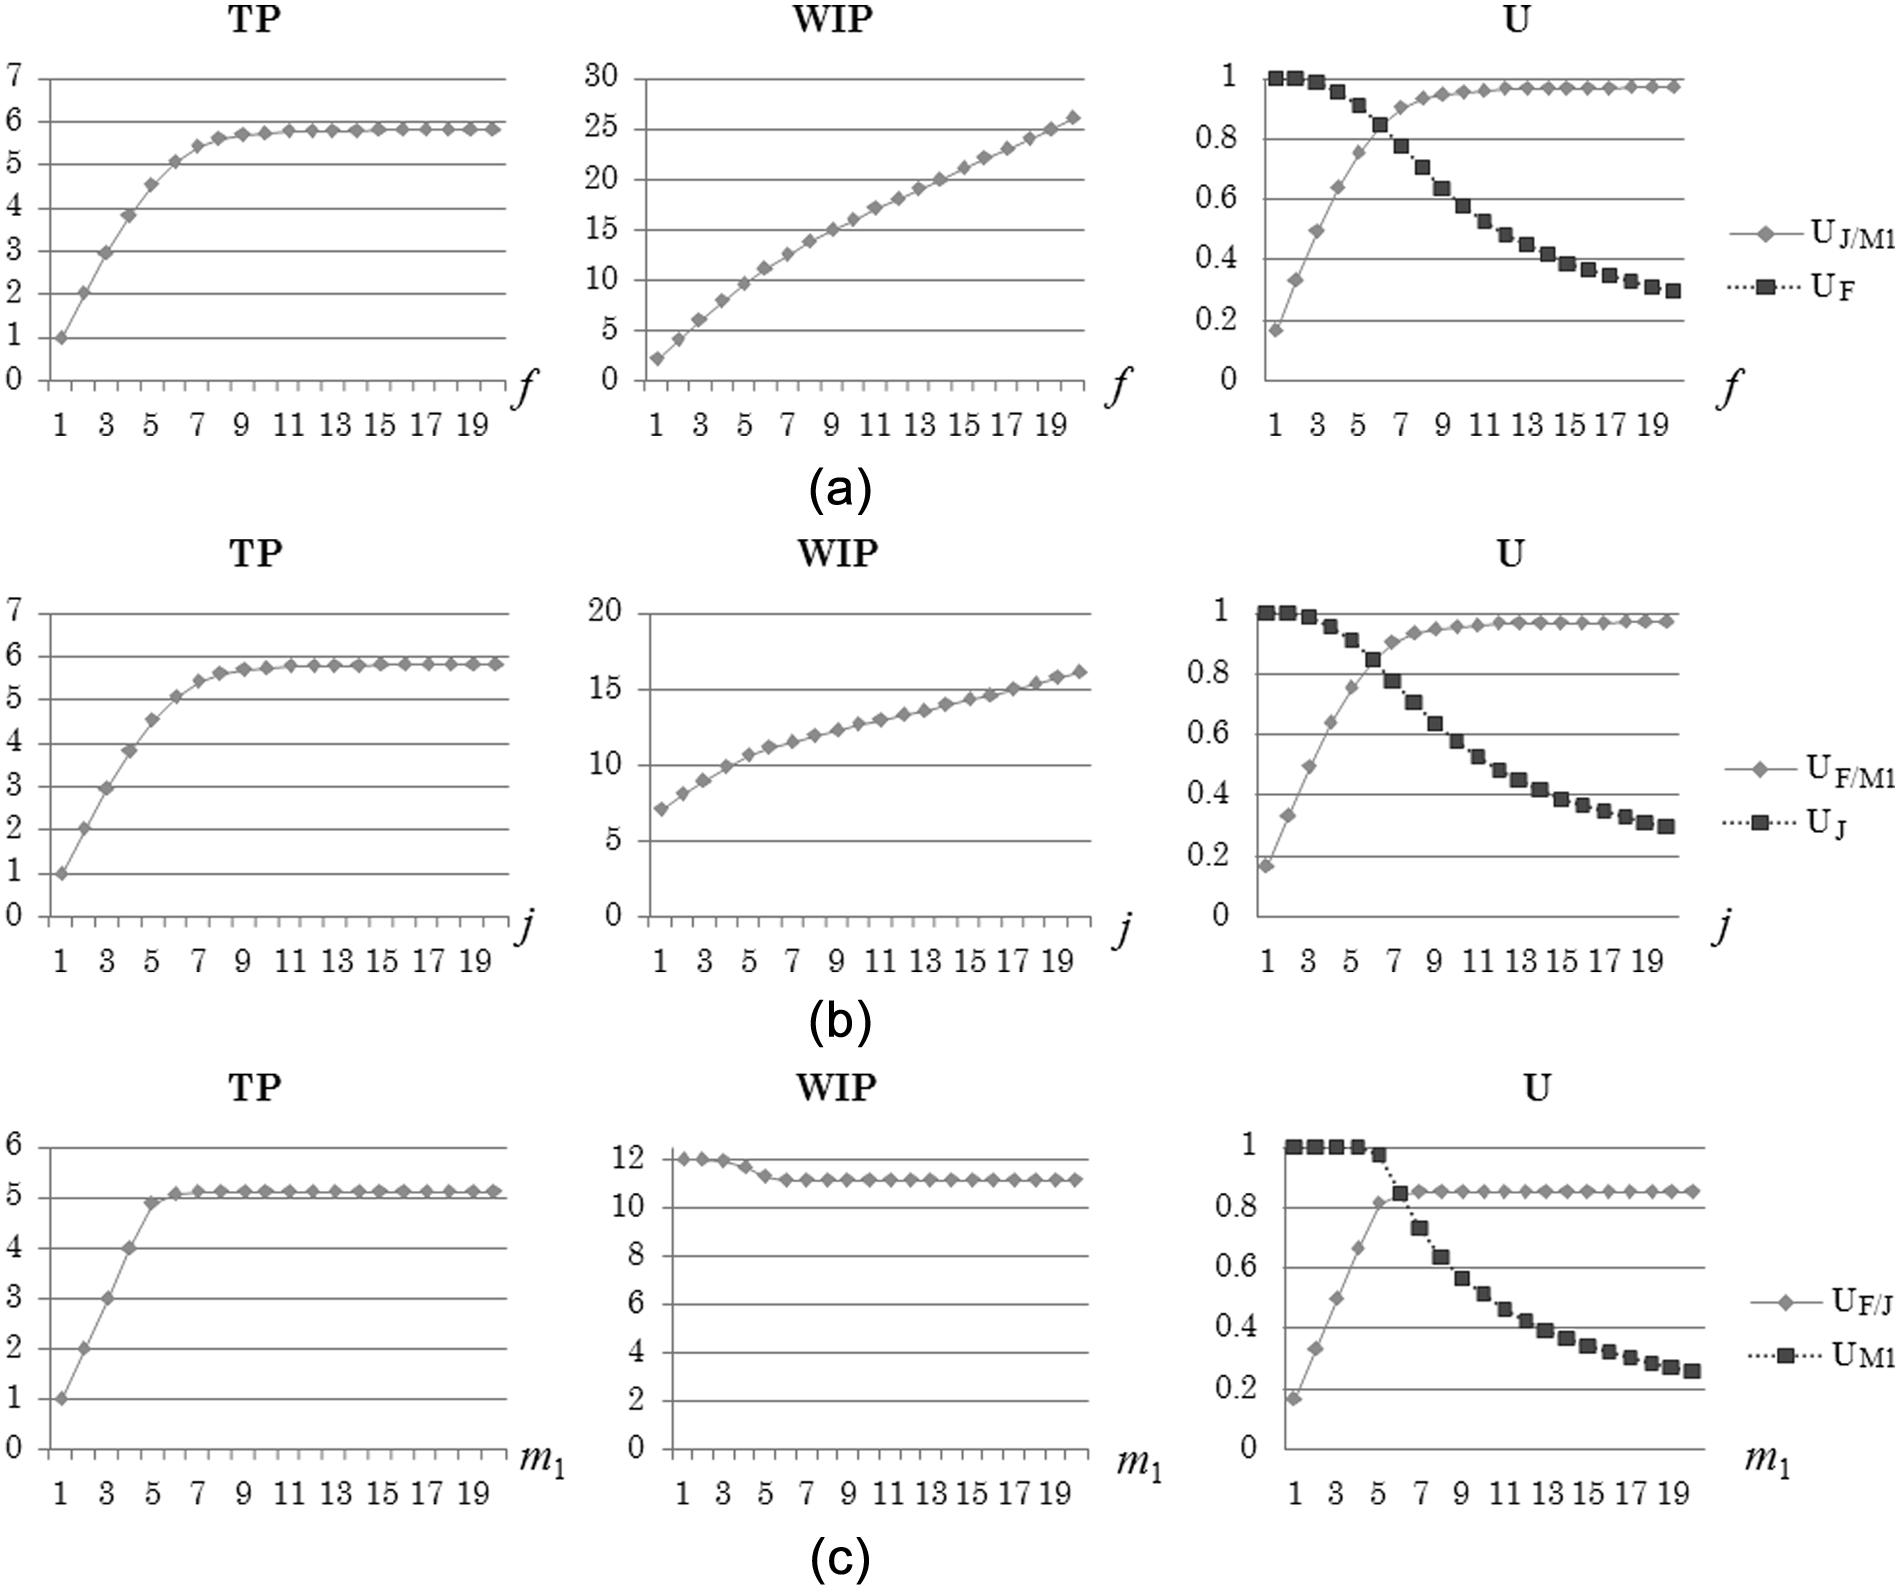
Numerical results on the station scale: (a) Case D, (b) Case E, and (c) Case F.
The F-zone and J-zone show a more important effect on the performance indicators as the system inputs and outputs, whereas the M-zone prefers to affect the system efficiency as only a bottleneck zone.
Operating rate
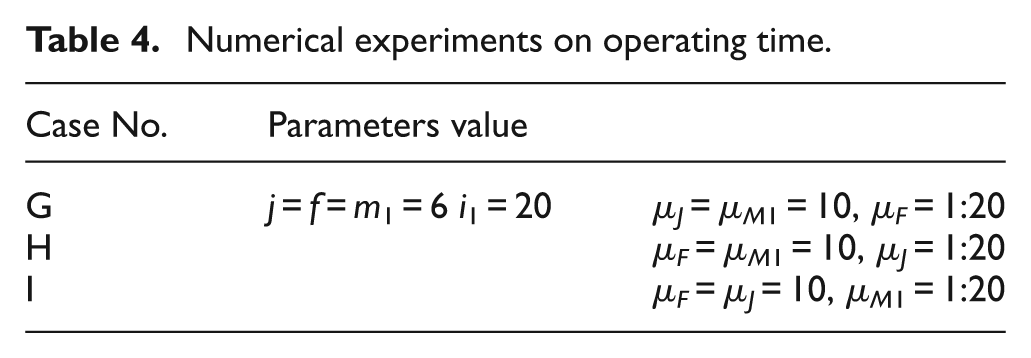
To examine the effect of operating rate on system performance, experiments, which are denoted as cases G, H, and I (see Table 4), were implemented with an incremental operating rate; the calculated results are shown in Figure 5.
Numerical experiments on operating time.
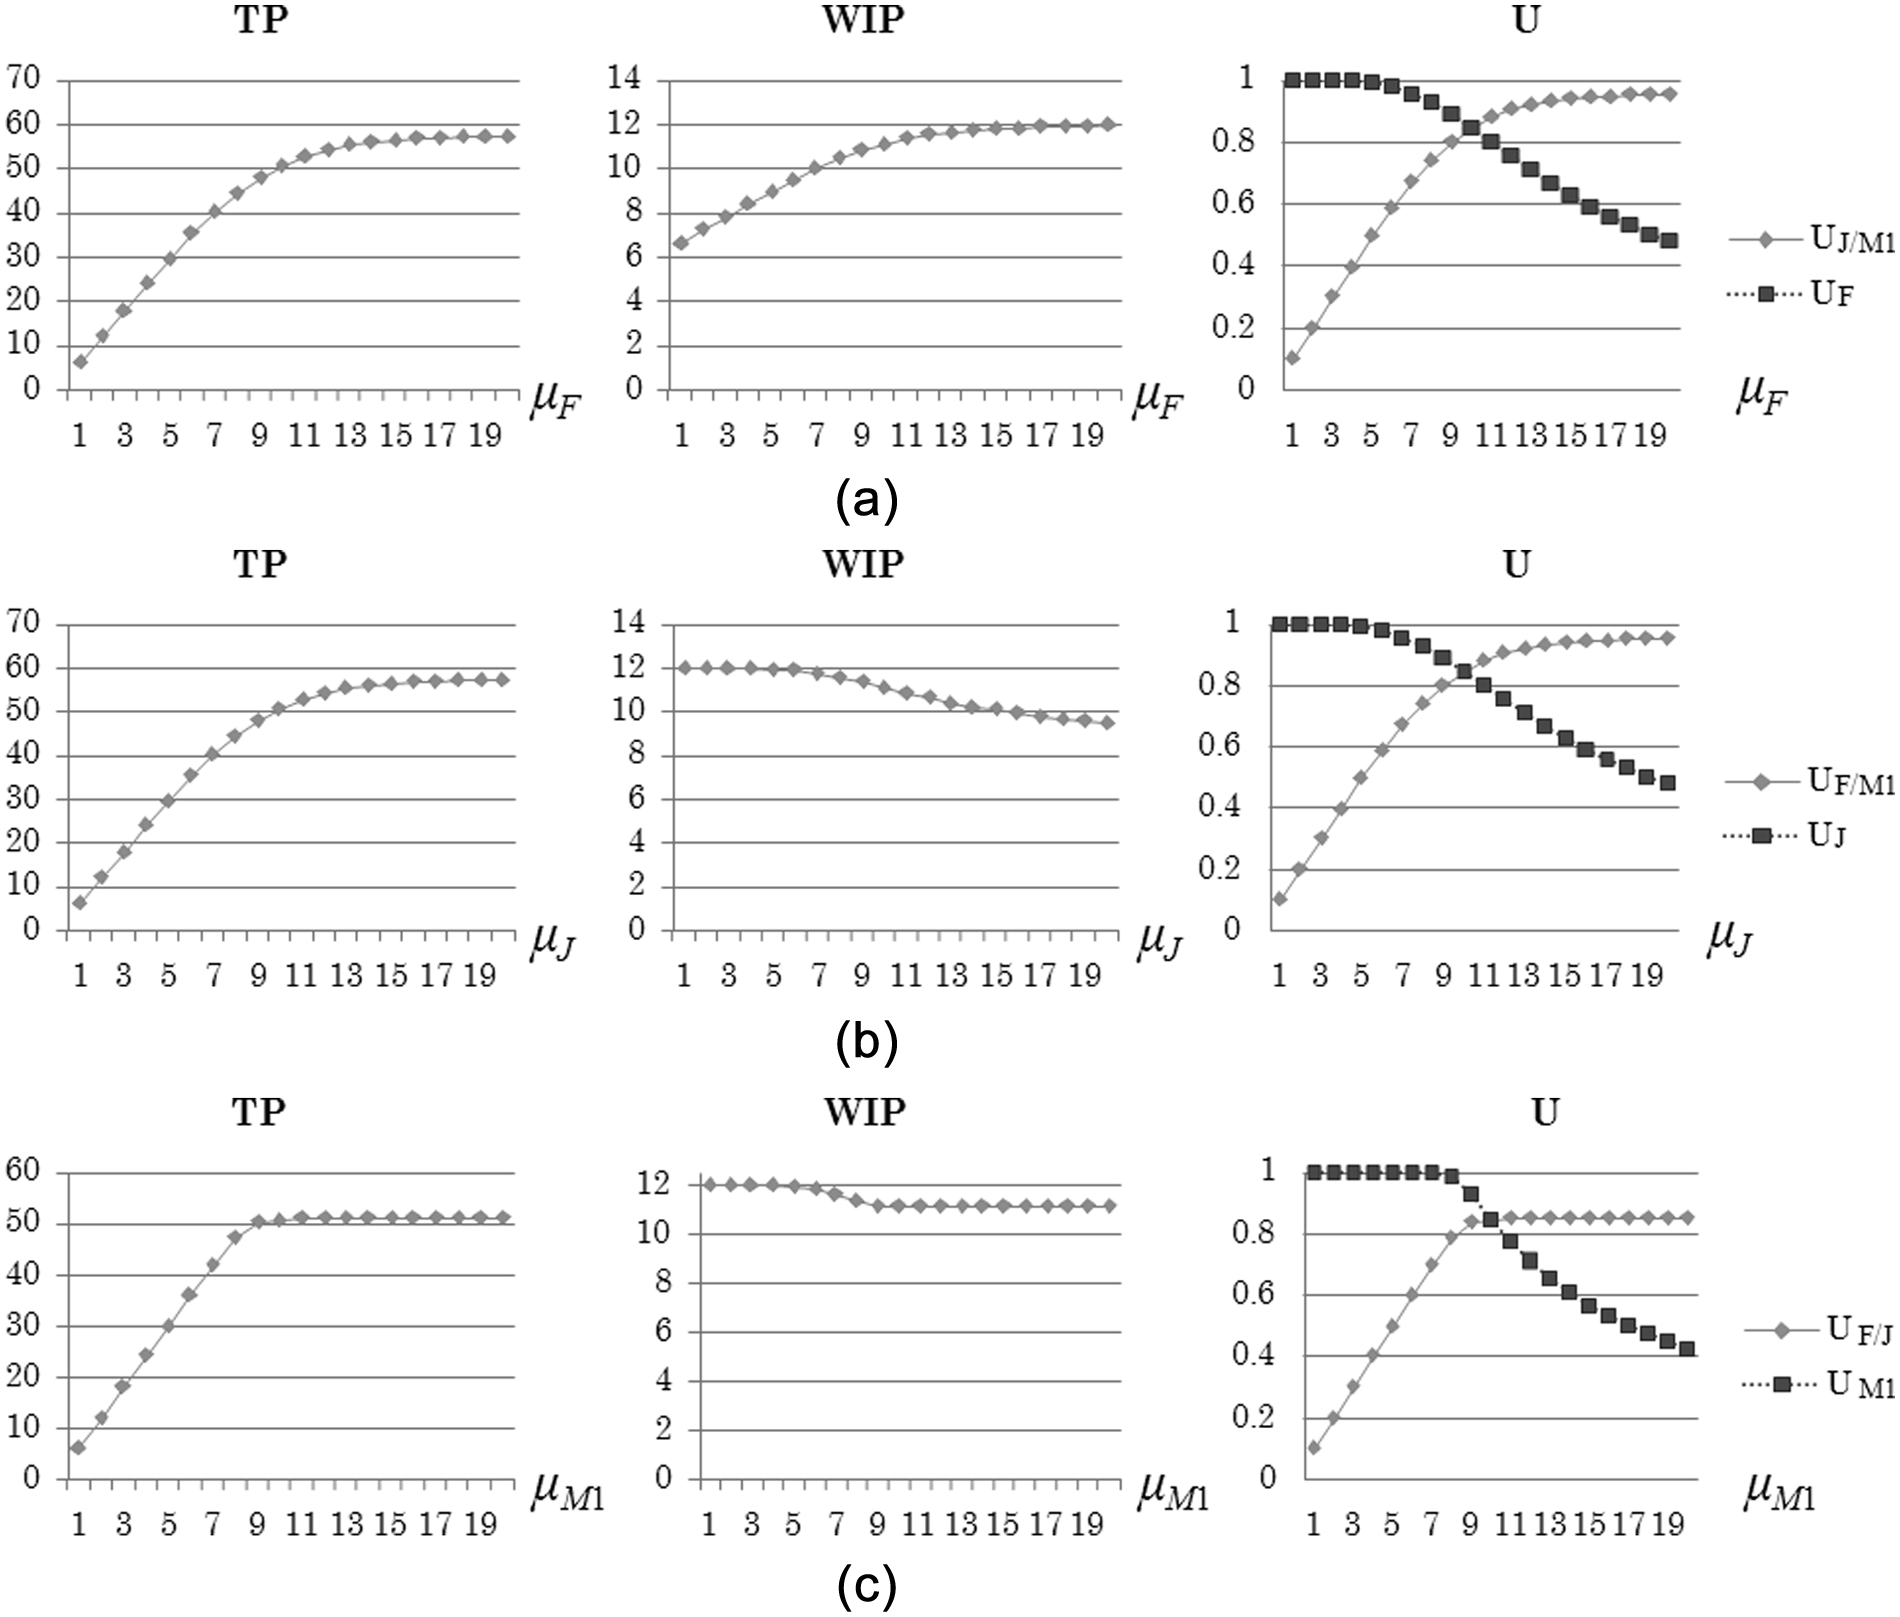
Numerical results on operating time: (a) Case G, (b) Case H, and (c) Case I.
Similar patterns are observed in Figure 4; the following are for emphasis:
In the previous Case E, WIP follows the same trend as the join-station scale increases; on the contrary, in Case H, WIP decreases as the join operation rate increases. It is likely that in Case E, an increasing join-station scale has a stronger pull on the fork operation in terms of utilisation directly through the SNS channel backwards, whereas the join operation is restricted by the total repair-operating rate in the M-zone although the join-station scale has increased. As a test, another experiment was performed to show that the system input dominated by the fork operation exceeds the output from the J-zone, which increases the WIP.
The equivalence of indicators, where the total repair-operating rate (repair-station scale × μM1) has the same level. It can be concluded that the function of the inventory buffer weakens the single effect of the repair-operating rate or repair-station scale on system performance due to the intrinsic structure that was modelled.
Performance analysis of a multi-component system
Based on the proposed method in a single-component system, several adjustments are introduced into the Markov stochastic model of a repair system with multiple rotable components, as shown in Figure 6, which contains three rotable components. Because the structure of the multi-component system corresponds with the single-component system under the assumption of independence of component operation, the previous CTMC model is still applicable in the multi-component case.
Repair system with multiple rotable components.
The stochastic variables are extended as Bh(t), Jh(t), and so on, where h represents the different components. Using numerical experiments, in which the scale of states is less than 104, the performance analyses resulted in similar trends as those of the single-component system. This result verifies that the performance pattern is decided by the problem structure provided that our multi-component system model is just extended quantitatively and could be separated into independent single-component systems to perform the calculation procedures. However, as is well known, the Markov method encounters a space ‘explosion’ in our following attempt to enhance the scale of the numerical experiments. However, considering the actual background in which a repair system with rotable components is implemented, most problems lead to a model with a feasible scale.
The performance analysis of a multi-component system is not shown here due to its similar pattern with the single-component system after large number of numerical cases.
Summary
For repair system with rotable components, previous research rarely focused on the performance of the entire system, particularly the relationship between the system performance and key resource allocation.
In this study, the cost of inventories, facilities, stations, and so on is ignored; this study only concerns the performance indicators with resource allocation theoretically. However, in a real production system, where a rotable component strategy is applied, such as in the field of aero-maintenance, the cost of resources cannot be ignored, and furthermore, it would somehow prioritise system efficiency.
The allocation under IP remains, to an extent, as a guiding strategy to allocate stations within a single-component system, except in the stage of small inventory scale.
The indicators clearly show a marginal effect on inventory scale, stations scale, and the operating rate, which should be underlined to coordinate and optimise the structure of resources.
The presence of rotable-component inventory weakens the process of the repair operation at the system level. For example, in Figure 4(c), the utilisation of the fork and join stations only increases 70% compared with 90% in Figure 4(a). In addition, the M-zone and inventory buffer for rotable components form a more ‘viscid channel’ than that of the SNS one when the end position ‘pulls’ the input process. The F-zone and J-zone have a more important effect on the performance indicators as the system input and output, whereas the M-zone prefers to affect the system efficiency only as a bottleneck zone.
In reality, a repair system with rotable components is widely implemented for large-scale logistics equipment with high expenditures on rotable components, and most facilities, such as join stations or fork stations, maintain an unchangeable construction after the initial installation. Consequently, the allocation of key resources is fundamentally prioritised. Fortunately, concerning the size of component inventories and the category of rotable components, the CTMC approach could solve this issue in an acceptable scale, which is supported by the explanation of algorithmic complexity.
Further research must still be conducted on the basis of these results, for example, the performance of a multi-component system with complicated constraints, such as precedence.
Footnotes
Declaration of conflicting interests
The authors declare that there is no conflict of interest.
Funding
This research received no specific grant from any funding agency in the public, commercial or not-for-profit sectors.