
Abstract
An integrated finite element analysis–evolutionary algorithm simulation approach is proposed in this work to model the density characteristics of the three-dimensional printing, specifically for selective laser sintering process. The approach consists of modeling sintering phenomenon by finite element analysis simulation, which is further fed into an evolutionary algorithm cluster comprising genetic programming. The integrated approach is useful to model the functional relationship of density characteristic of selective laser sintering–fabricated components with respect to laser power, scan velocity and scan spacing. Performance of the proposed model is evaluated against the actual results obtained from the literature. We find that our proposed finite element analysis–evolutionary algorithm model is able to model the selective laser sintering process very well, which can be used to complement the analytically and experimentally obtained results. For the validation of the robustness of the model, we also conducted sensitivity and parametric analyses and investigated the specific influence, and variation, of each of the input process parameters on the density of the selective laser sintering–fabricated component. It was found that scan spacing has the least influence, whereas scan velocity has the highest influence on the density of the selective laser sintering–fabricated component. Non-linear relationships unveiled between the process parameters highlight the capability of the model in simulating the density characteristic of the complex selective laser sintering process in uncertain input conditions.
Introduction
Selective laser sintering (SLS) process deploys the laser beam to selectively fuse the powder into a designed solid object layer by layer. 1 The peculiarity of the SLS process is that it converts the computer-aided design components into solid objects automatically without any use of traditional tools of fabrication. Recently, Garg et al. 2 conducted a survey on applications of empirical modeling methods in the modeling of various additive manufacturing processes. Literature reveals that the characteristics of SLS-fabricated components such as strength, density and shrinkage ratio. exhibit high dependence on the parameters such as material and powder properties and other specifications of machines such as laser power, scan speed and scan spacing. By appropriately selecting the optimum parameter values, the quality of characteristics of the components fabricated from SLS process can be improved. 3 In view of this, the models based on physics behind the process can be formulated. However, it may be a difficult task because the SLS process is dynamic and complex in nature due to the occurrence of multiple phenomena such as transmission and absorption of energy, heating of powder bed, sintering and cooling of components.
Prediction of density of SLS components is generally carried out using finite element analysis (FEA), which requires strong mathematical skills, and the predictive ability depends on the precision of the FEA model used.4–7 Therefore, researchers preferred empirical modeling approaches, such as artificial neural network (ANN), to formulate non-linear models and establish the relationship between density and the process parameters of SLS components. Shen et al. 8 used a back propagation neural network (BP-NN) with adaptive learning and a momentum rate method to predict the density of SLS components. The ANN model shows a satisfactory performance with a prediction accuracy of 93%. A similar application for density prediction is also discussed. 9 Support vector regression (SVR) combined with particle swarm optimization was also applied to predict density of SLS components. 10 It was found that the SVR model outperforms BP-NN model in terms of generalization ability of the given data. Chatterjee et al. 11 studied the effects of SLS parameters (layer thickness and hatch spacing) on the density, hardness and porosity of SLS components. The analysis of variance (ANOVA) model indicates that the layer thickness is a significant parameter that affects the hardness and density of the SLS component. For porosity, both the process parameters were found significant. Liao and Shie 12 studied the main effect and interaction effect of SLS process parameters (pulse frequency, pulse duration, no. of strikes to a spot and particle size) on the porosities of SLS specimens using the ANOVA model. The ANOVA model indicates that all the main effects and interaction effects are significant. The regression model is formulated and residual analysis is conducted to validate the statistical assumptions. Kruth and Kumar 13 studied the effect of three SLS process parameters (scan speed, scan spacing and layer thickness) on the mechanical properties such as hardness, density and surface roughness of the SLS component using the ANOVA model. The ANOVA model indicates that for hardness, layer thickness is significant; for density, scan speed is significant; and for surface roughness, scan speed and scan spacing are significant. Similar studies for the study of process parameters on mechanical properties of SLS specimen are discussed by Beal et al. 14 Two process parameters, laser power and scan speed, were considered. The performance characteristics studied were density, stress and flexural modulus. The ANOVA model indicates that the laser power and scan speed contribute significantly to density and modulus, whereas the laser power describes stress significantly.
A brief summary of the literature reveals that the prediction of density of SLS components is mainly carried out using the computational intelligence (CI) methods such as ANN and SVR. Several novel approaches of soft computing methods have been proposed such as hybridizing differential evolution algorithm with receptor editing property of immune system,15–17 artificial bee colony algorithm with Taguchi’s method,18,19 differential algorithm with Taguchi’s method, 20 cuckoo search algorithm (CS) 21 and immune algorithm with hill climbing local search algorithm22,23 to optimize the unit production cost of the machining operations of materials. Among the statistical models, regression, response surface methodology (RSM) and ANOVA have been used. Only few applications of FEA were found. The optimal architecture of ANN is determined either through trial-and-error approach or by hybridizing it with heuristic optimization methods such as genetic algorithms and particle swarm optimization. This indicates that some skill/knowledge is needed to select the optimal architecture of ANN for faster training and better accuracy of the model. SVR does not provide an explicit formulation between the input and output process parameters and gives output values in crisp form. For the regression analysis, RSM and ANOVA, the models are assumed, which induces ambiguity in the predictive ability of the model. Alternatively, an evolutionary algorithm (EA), namely, genetic programming (GP), which evolves the model structure and its coefficients automatically, can be applied.24,25 Based on few recent applications of GP in real world,26–29 it was found that the main reason for its diversified applications with an excellent capability to capture the dynamics of the process is by coupling it with the other classical statistical learning and classification strategies. This has indeed been a source of motivation to work on coupled computational engineering methods.
Therefore, an integrated FEA–EA approach is proposed in the prediction of density of an SLS-fabricated component. The integrated approach consists of data generated from FEA simulation which is further fed into the paradigm of an evolutionary cluster comprising GP, which was specifically designed to formulate the functional relationship of density characteristic of SLS-fabricated components with respect to laser power, scan velocity and scan spacing. The performance is compared to those of the results mentioned in literature. Sensitivity and parametric analyses are then conducted for the proposed model to accentuate the principle behind the process and unearth the dominant process characteristics and hidden non-linear relationships.
FEA simulation model
Mathematical modeling of laser sintering process
The sintering rate in amorphous systems as a function of the sintering process parameters is defined using Frenkel’s equation. The equation, however, does not model the behavior of the powder substrate. Scherer
30
developed a quantitative model to derive an explicit relationship between porosity, φ, and strain rate
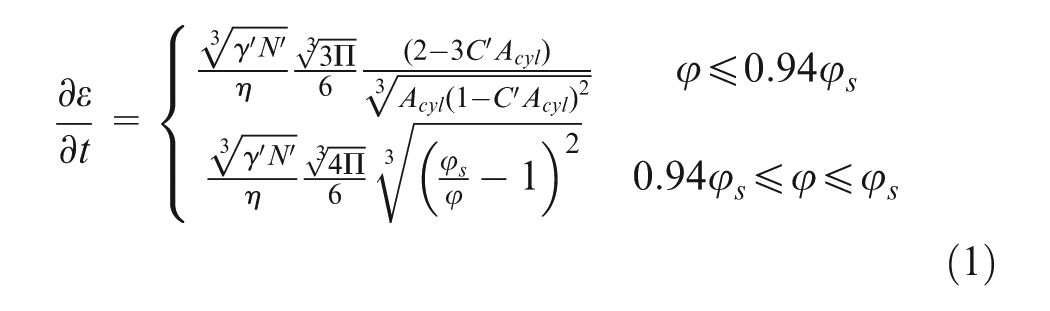
where γ′ is the surface energy, η represents the material viscosity at a given temperature, Acyl is the aspect ratio of cylinder as defined by Scherer, N′ is the number of particles per unit volume of fully dense material and C′ is a constant which is equal to
The viscosity, η, of a material can be defined as an Arrhenius function of temperature, T, given by
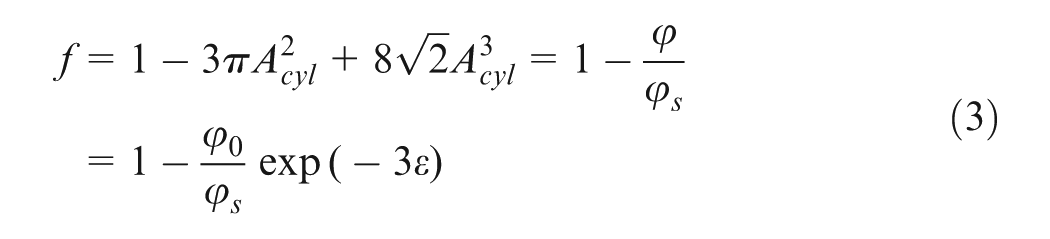
where η0 is the coefficient of viscosity and ΔE is the activation energy, RT is the room temperature. During the process of sintering, the void fraction f would decrease, which can be defined mathematically as 30
For a given porosity φ, the corresponding magnitude of Acyl can be obtained from equation (3). This can be substituted in equation (1) to obtain the corresponding free strain rate
where C is a constant that depends on temperature, powder material and size. For spherical powder particle of radius r, the constant is expressed as
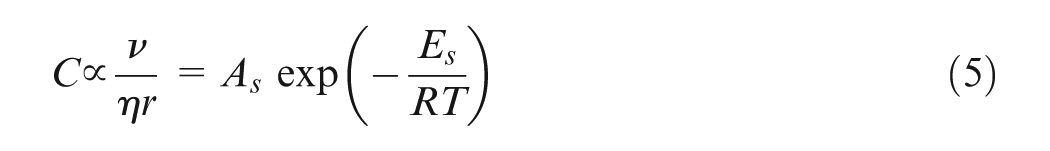
where As is an Arrhenius constant, and Es is the sintering activation energy.5,35
Analytical model of scanning moving laser beam
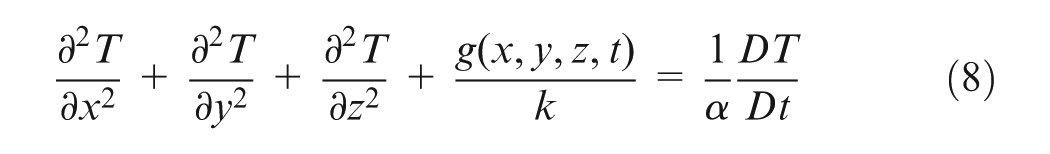
The analytical model of a moving laser beam is normally considered as a point source of heat, which has an energy of g W. 36 The energy will be released continuously over time moving along the positive x-axis with a constant velocity u, in a fixed layer of material maintained at a fixed material temperature. The incident laser beam in analytical modeling is assumed to be point source. This is a valid assumption considering the fact that the total scan length along x-axis will be much larger than the incident diameter of laser source. The transient heat conduction equation in Cartesian coordinate system under constant thermodynamical properties is defined as
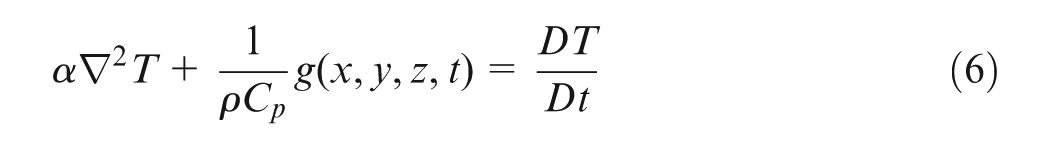
where
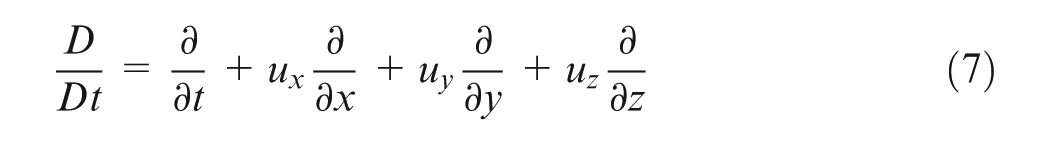
Substituting equation (6) into equation (7), we get
The temperature is represented as a function of space and time, defined as T = T(x, y, z, t). For a laser point heat source emitting g W starting from its initial position at y = 0, z = 0 and transiting across positive x-axis with a constant velocity u, the volumetric heat source g(x, y, z, t) can be given by a Dirac delta function defined as

where gc is the heat constant equal to the energy of point heat source at x = 0, y = 0 and z = 0. For transient heat source problems, the coordinate system is also allowed to transit which can be achieved by introducing a new coordinate
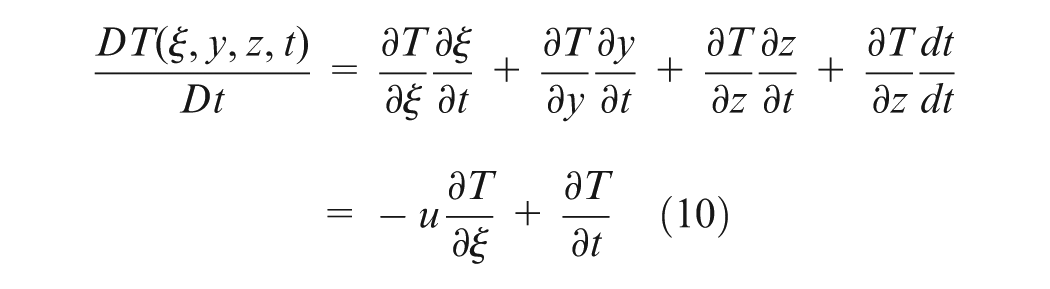
Differentiating equation (11) with respect to x becomes
The heat conduction equation (equation (11)) in ξ, y, z coordinate system moving with the heat source is given by 37
Simulation algorithm
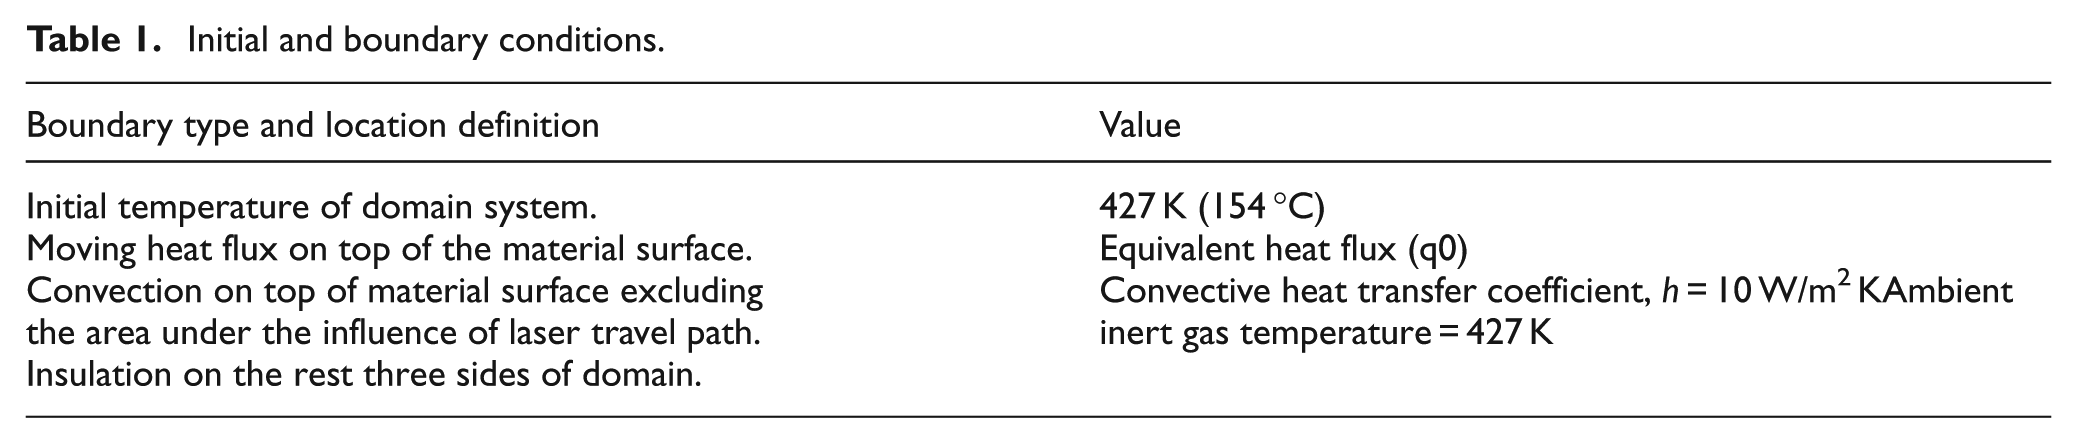
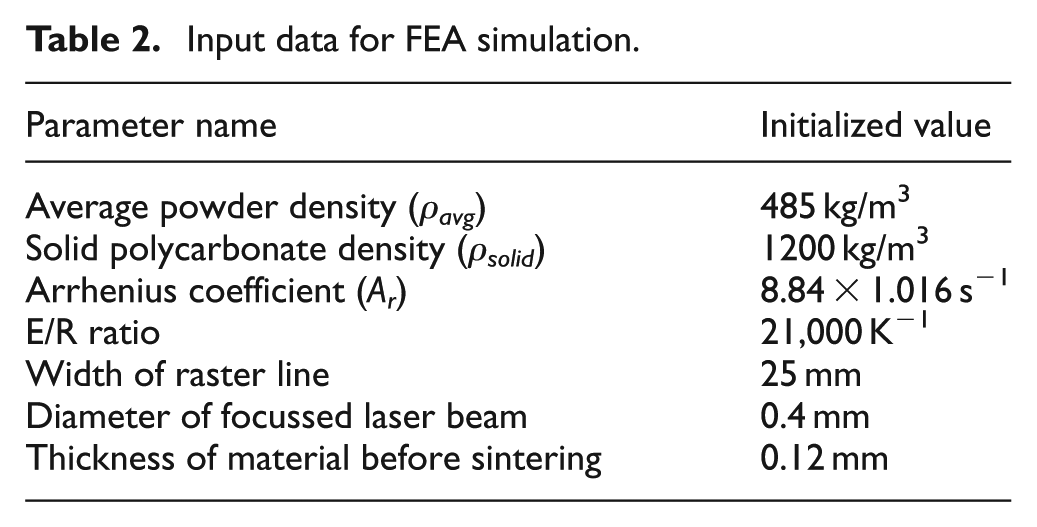
The commercial FEA software ANSYS® is adopted in this article to model the SLS process for measuring the density of the component, with the equations and the boundary conditions moving laser path discussed in Singh and Prakash. 36 The specimen has dimensions of 2 mm × 2 mm × 1.2 mm created in volume mesh using SOLID70 with an element size of 0.4 mm. SOLID70 has three-dimensional (3D) thermal conduction capability having eight nodes with a single degree of freedom, temperature, at each node. The purpose of the conducting simulation was to examine the time-dependent temperature distribution. The laser energy was incident to each element in the powder bed. In this algorithm, the heat flux is incident on each element of the powder bed one by one. It implies that when the heat flux moves to the next element of the powder bed, the flux on the previous element is stopped. This iterative process continues until it covers the entire domain of the powder bed. This refers to the dynamic nature of the SLS process, where the element of the powder bed gets heated when flux approaches and gets cooled when flux passes through it. The analysis done in the evaluation of temperature distribution is used to solve the sintering model. The final solution is obtained by embedding the thermal property values of powder bed, the heat flux model and the sintering model using the ANSYS parametric design language. The mode of heat application in the ANSYS model used in our work is illustrated in Figure 1. The boundary conditions along with the input data adopted in this work, directly adapted from Singh and Prakash, 36 are given in Tables 1 and 2, respectively.
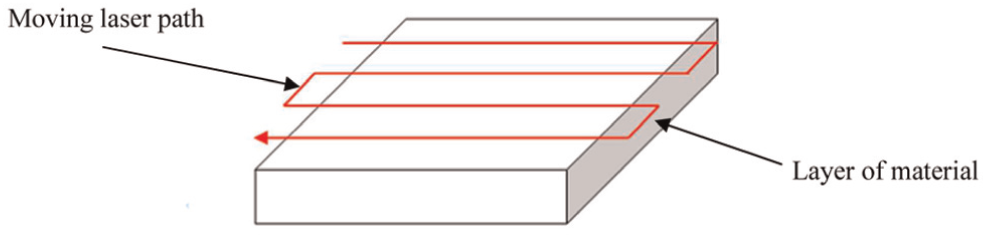
Illustration of moving laser path in FEA simulation.
Initial and boundary conditions.
Input data for FEA simulation.
Integrated FEA–EA approach
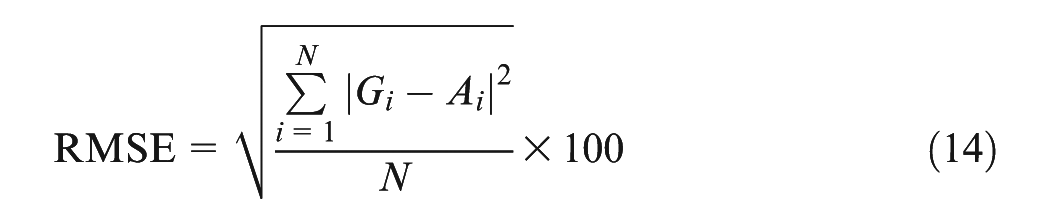
The density characteristic of the SLS-fabricated component is modeled entirely using an integrated FEA–EA simulation approach as shown in Figure 2. In this approach, the FEA is integrated in the paradigm of popular EA, GP. The data generated using the FEA approach evaluated the three important characteristics, namely, temperature, density and shrinkage of the SLS process in an ascending order. Three input process parameters, laser power (x1), scan velocity (x2) and scan spacing (x3), were considered. Output parameter considered is the density of the fabricated component. The collected data from FEA model are then fed into the paradigm of GP. Selection of training and testing data set affect the learning phenomenon of the GP algorithm. In this work, 80% of the collected data were randomly chosen as the set of training samples with the remainder as the set of testing data. The training data were used for formulating the models while the test data samples were used for testing the generalization ability of the models. The initial population of individuals is generated by combining the elements randomly from the functional and terminal set. The terminal set consists of input process parameters and random constants. The range of random constants chosen is −10 to 10. The function set can include elements such as arithmetic operators (+, −, /, ×), non-linear functions (sin, cos, tan, exp, tanh, log) or Boolean operators. The performance of the individuals in the initial population is evaluated based on the fitness function, namely, root mean square error (RMSE) given by
where
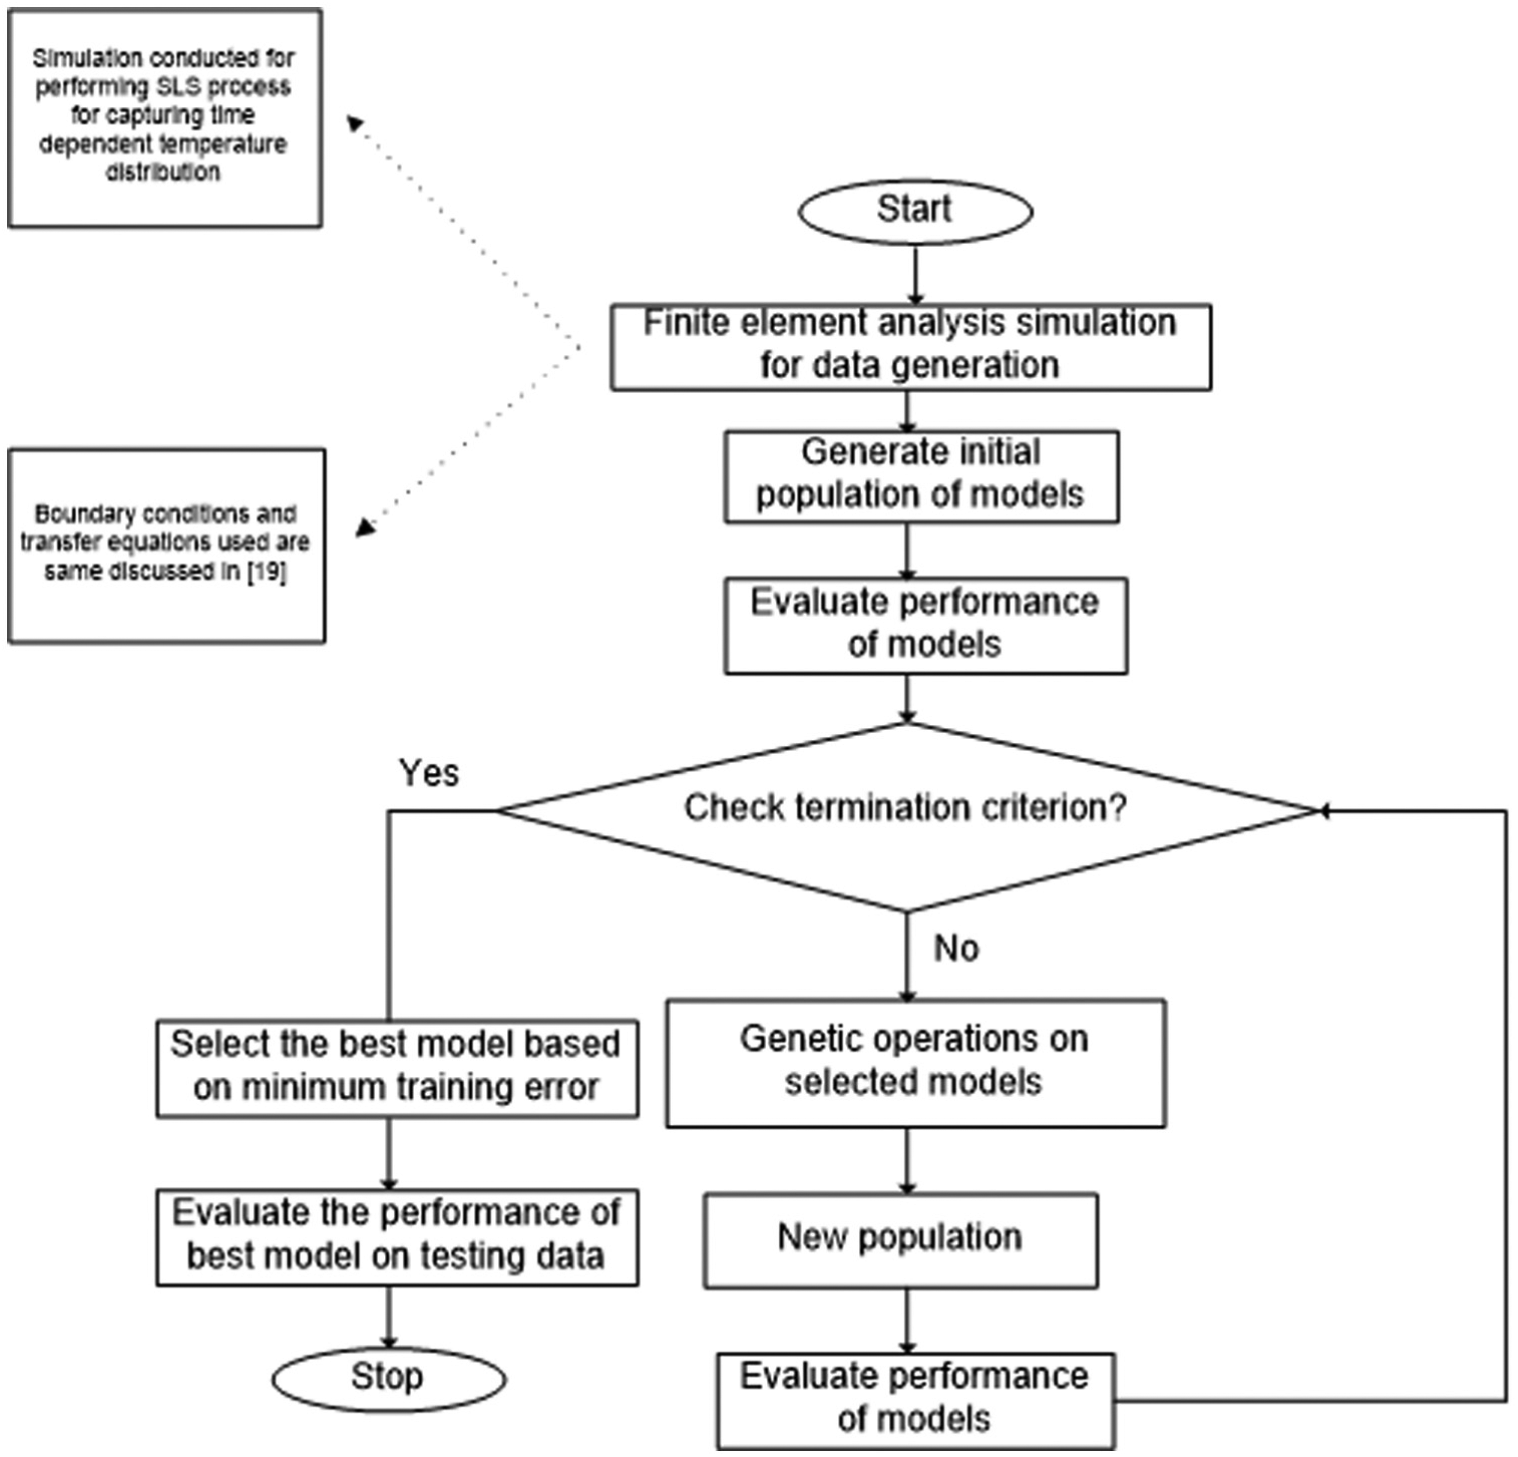
Flowchart showing mechanism of FEA–EA approach.
Descriptive statistics of the input and output process characteristics for the SLS process.
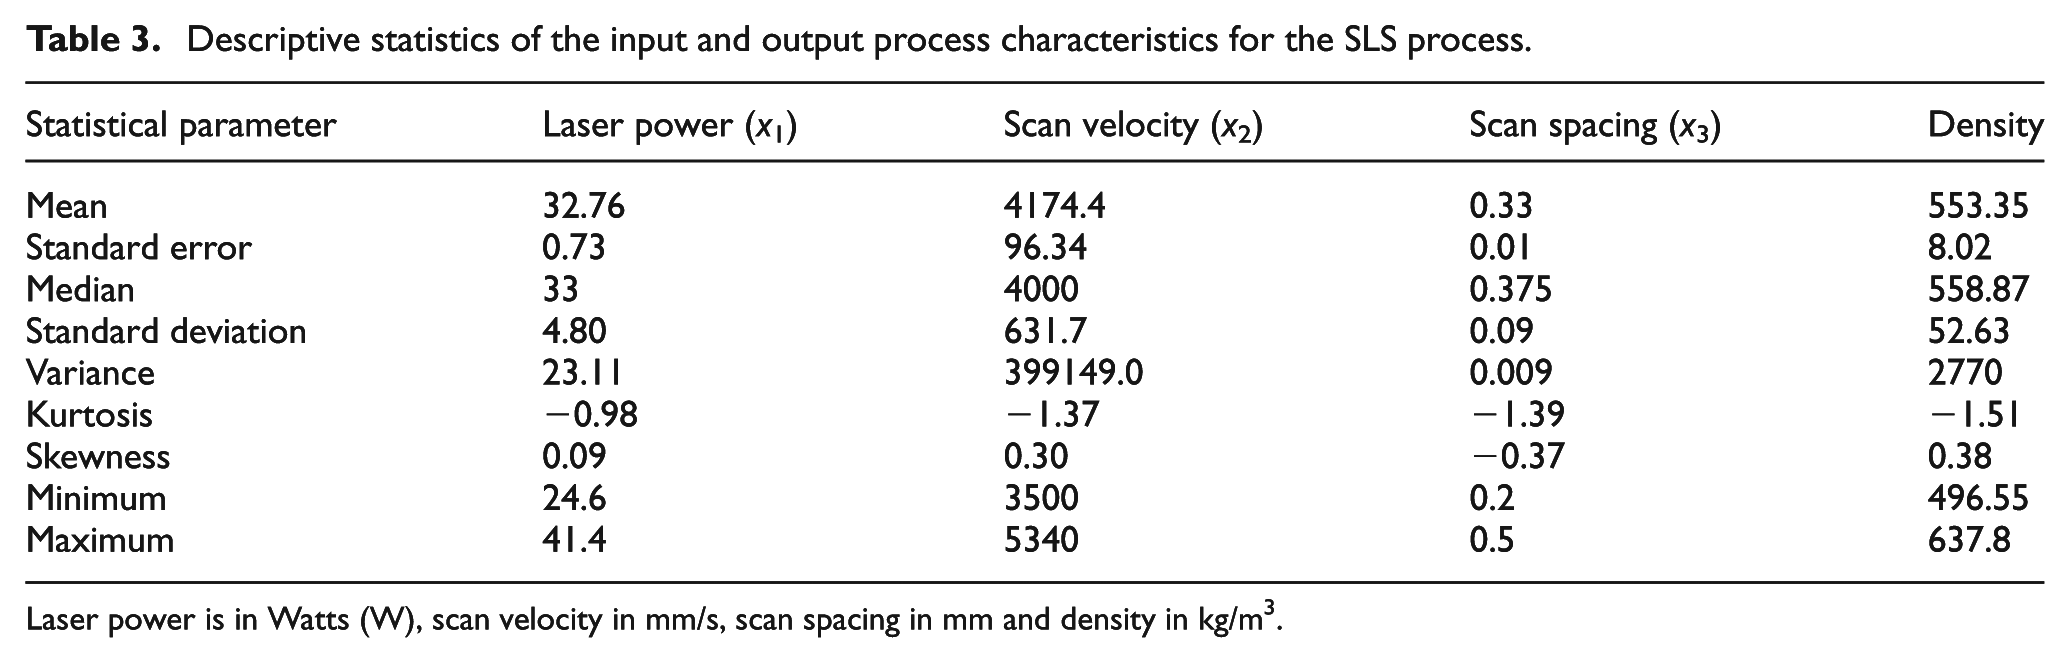
Laser power is in Watts (W), scan velocity in mm/s, scan spacing in mm and density in kg/m3.
The performance of the initial population is evaluated and the termination criterion is checked. The termination criterion is specified by the user and is the maximum number of generations and/or the threshold error of the model. If the performance does not match the criterion, the new population is generated by performing the genetic operators on the selected individuals of the initial population. Genetic operators applied are crossover, mutation and reproduction. Tournament selection method is used to select the individuals for the genetic operations. This selection method maintains genetic diversity in the population and thus avoids local/premature convergence. Tournament sizes of 2, 4 and 7 are preferred. The models with lowest fitness value reproduce or copied in the next generation. The crossover operation, namely, subtree crossover is used. Figure 3 shows the functioning of subtree crossover in which the branch of the two models is chosen randomly and swapped. The mutation used is subtree mutation (Figure 4) in which the branch of the model is replaced with the newly randomly generated model/tree. As recommended by Koza, 38 the probability rates of reproduction, crossover and mutation are 85%, 10% and 5%, respectively. This indicates that most of the new population came from the application of crossover operation. The iterative phenomenon of generating new population continues as long as the termination criterion is met. The best model is selected based on minimum RMSE and its performance is evaluated on testing data.
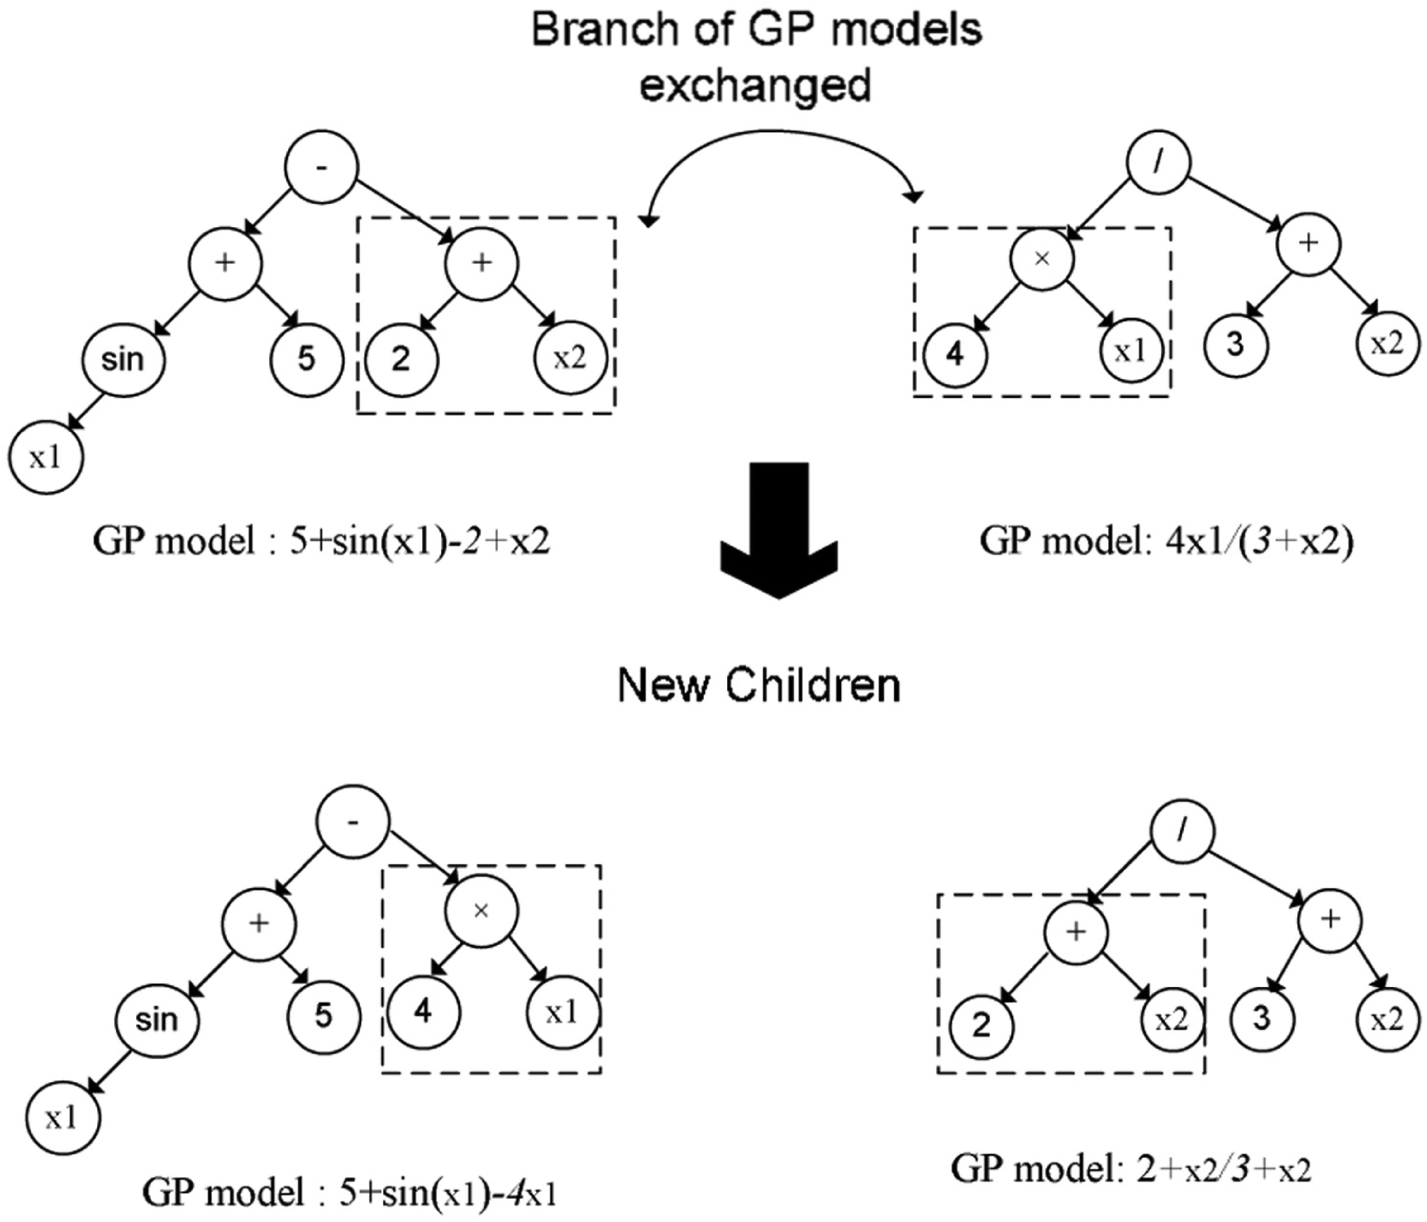
Subtree crossover operation.
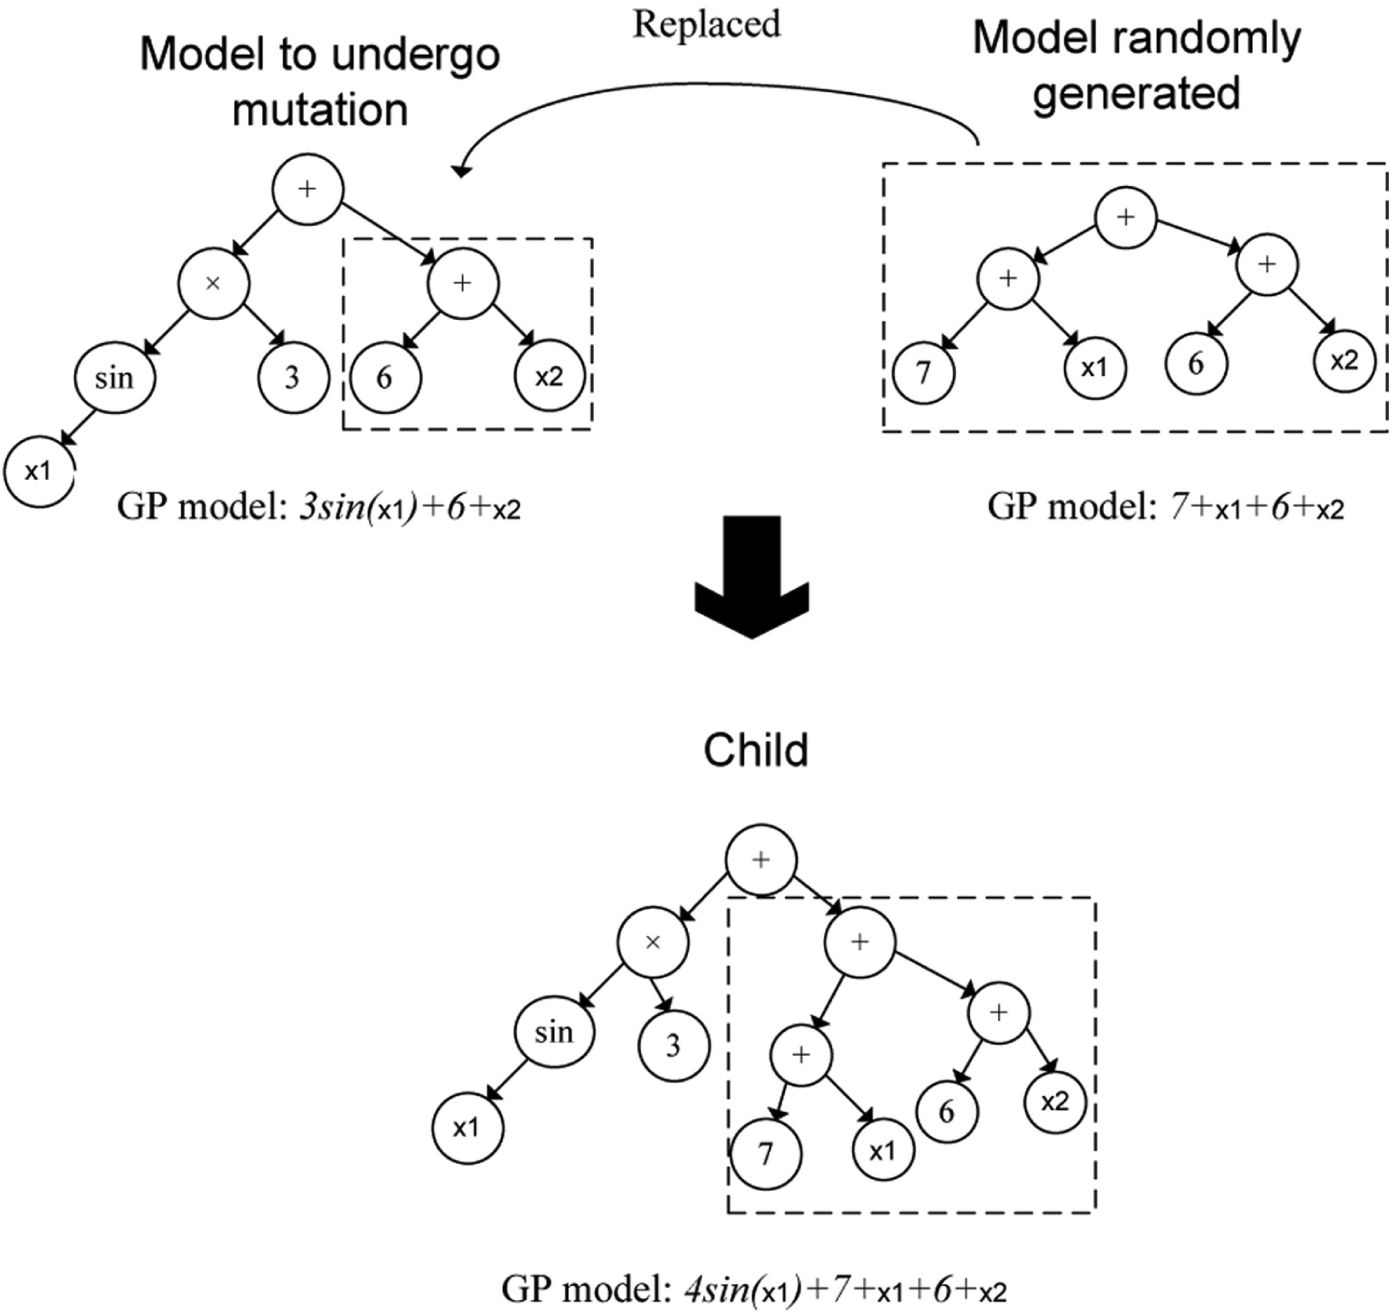
Subtree mutation operation.
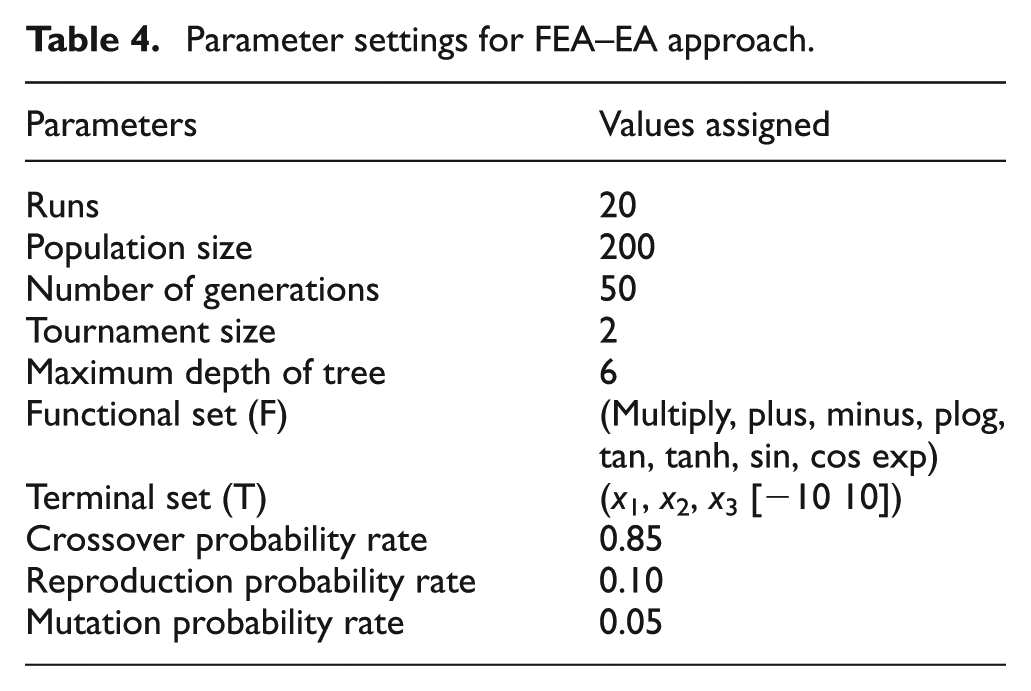
Parameter settings for implementation of FEA–EA
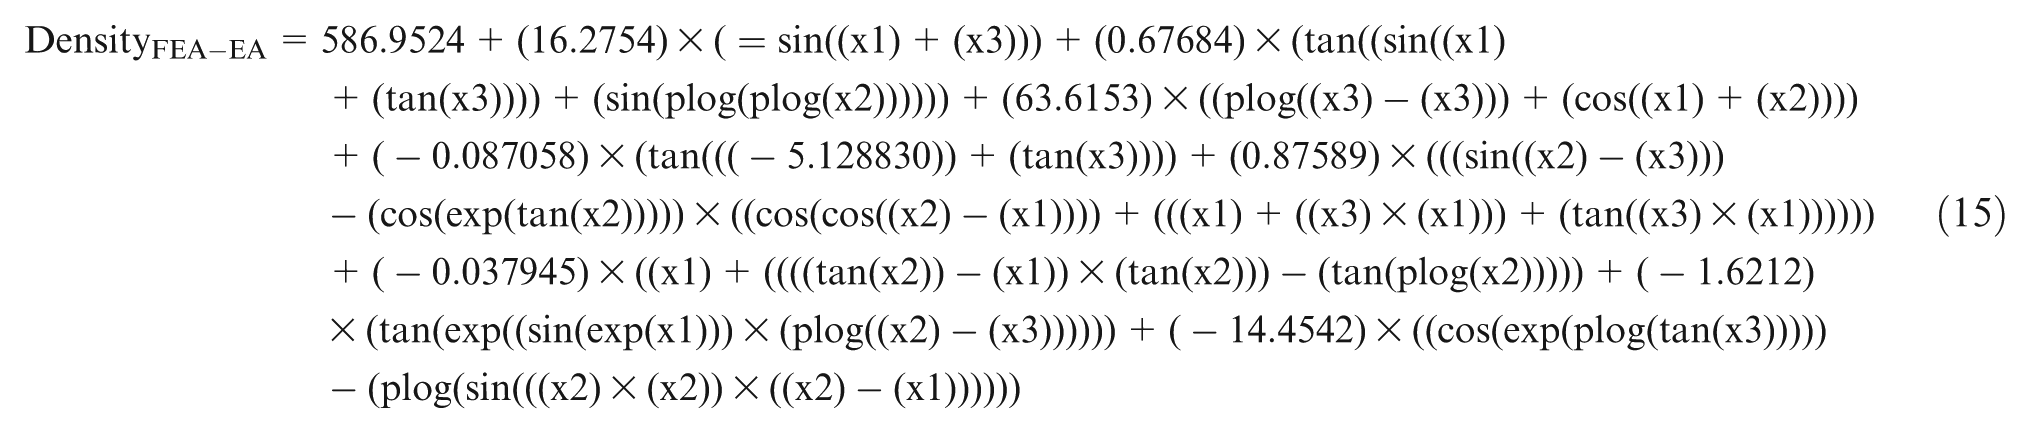
For effective implementation of the proposed approach, we have used the same parameter settings for FEA as discussed in Singh and Prakash 36 (Table 2). The parameter settings for GP are adjusted using the trial-and-error method (Table 4). A wide range of elements are chosen in the function set so as to generate the mathematical models of different sizes. Depending on the problem, the values of population size and generations are set. A study of applications of GP in modeling of several manufacturing systems by Garg et al.39–46 indicated that the population size and number of generations should be set to a low number for the good amount of data samples having the lower dimensions. The size and variety of forms of the model to be searched in the solution space are determined by the maximum depth of the gene. When the correct number of data samples for the SLS process was determined, the maximum depth of the gene was chosen with a value of 6. FEA–EA approach was implemented in MATLAB R2010b for the prediction of density of SLS-fabricated component and was applied to data set generated from FEA simulation. The best model (equation (15)) was selected based on the minimum RMSE on the training data from all the runs
Parameter settings for FEA–EA approach.
Statistical evaluation of the proposed model to those of actual results
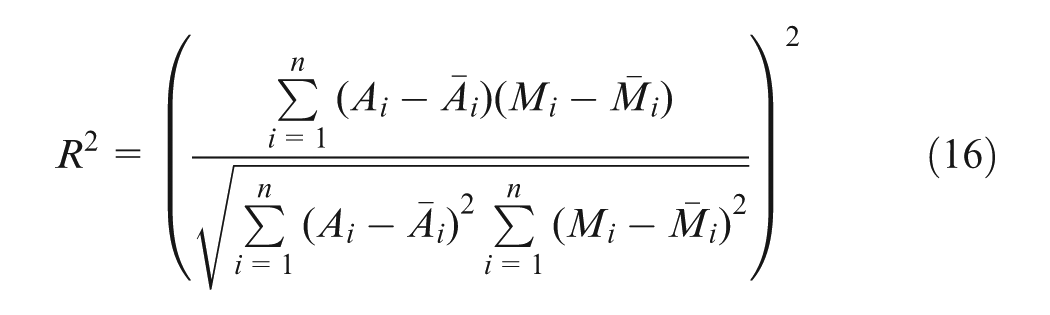
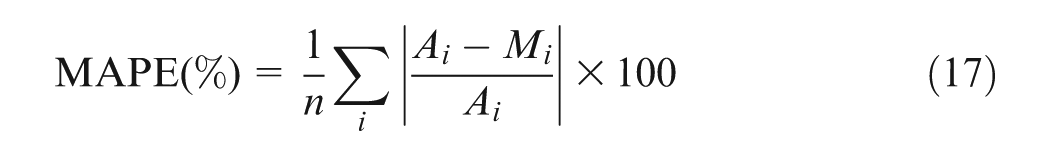
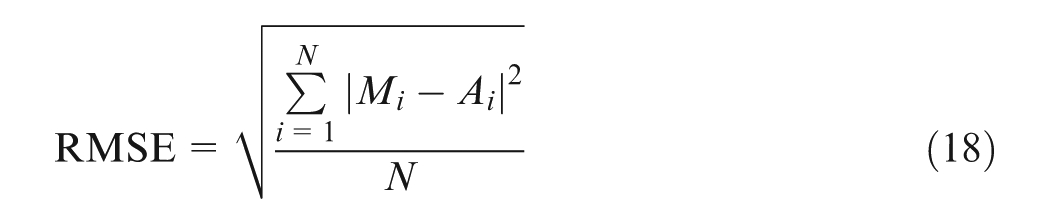
The results obtained from the proposed FEA–EA model are illustrated in Figure 5 using the training and testing data for evaluation of density characteristic of SLS component based on given input variables. Performance of the proposed model is evaluated with an actual density values mentioned in the literature47,48 using the five metrics: square of the correlation coefficient (R2), mean absolute percentage error (MAPE (%)), RMSE, relative error (%) and multi-objective (MO) error function. The five metrics used the following relationships
where
Statistical evaluation of the FEA–EA model on training and testing data.
The results of the training phase (Figure 5(a)) indicated that the proposed model has well learned the non-linear relationship between the output density characteristic and the input variables of SLS-fabricated component with the high correlation values and relatively low error values. The result of the testing phase (Figure 5(b)) indicated that the model has adapted to the mechanism of the SLS process satisfactorily, with values of R2 as high as 0.98.
MO values of the proposed model were computed on the training and testing data (Table 5). The descriptive statistics of the relative errors of the model are shown in Table 6, which illustrates error mean, standard deviation (Std dev.), standard error of mean (SE mean), lower confidence interval (LCI) of mean at 95%, upper confidence interval (UCI) of mean at 95%, median, maximum and minimum. The lower MO error values on the testing data and the lower values of range (UCI–LCI) of the confidence intervals of the model indicate that it is able to generalize the density characteristic of SLS-fabricated component reasonably well based on varying input experimental conditions.
Multi-objective error of the model.
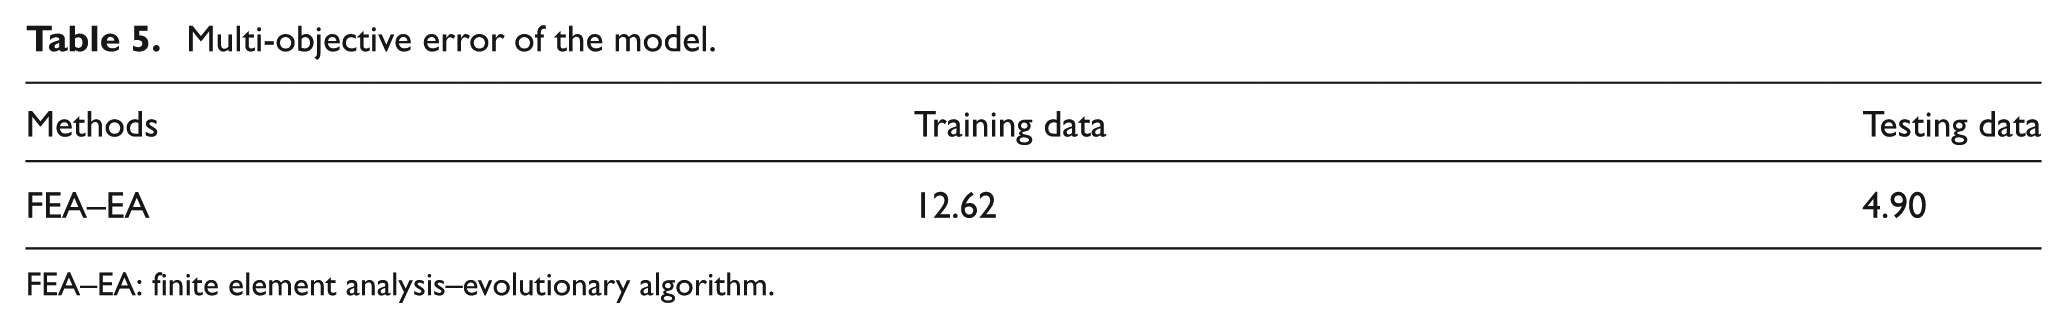
FEA–EA: finite element analysis–evolutionary algorithm.
Descriptive statistics of relative error (%) in prediction of density of SLS component.
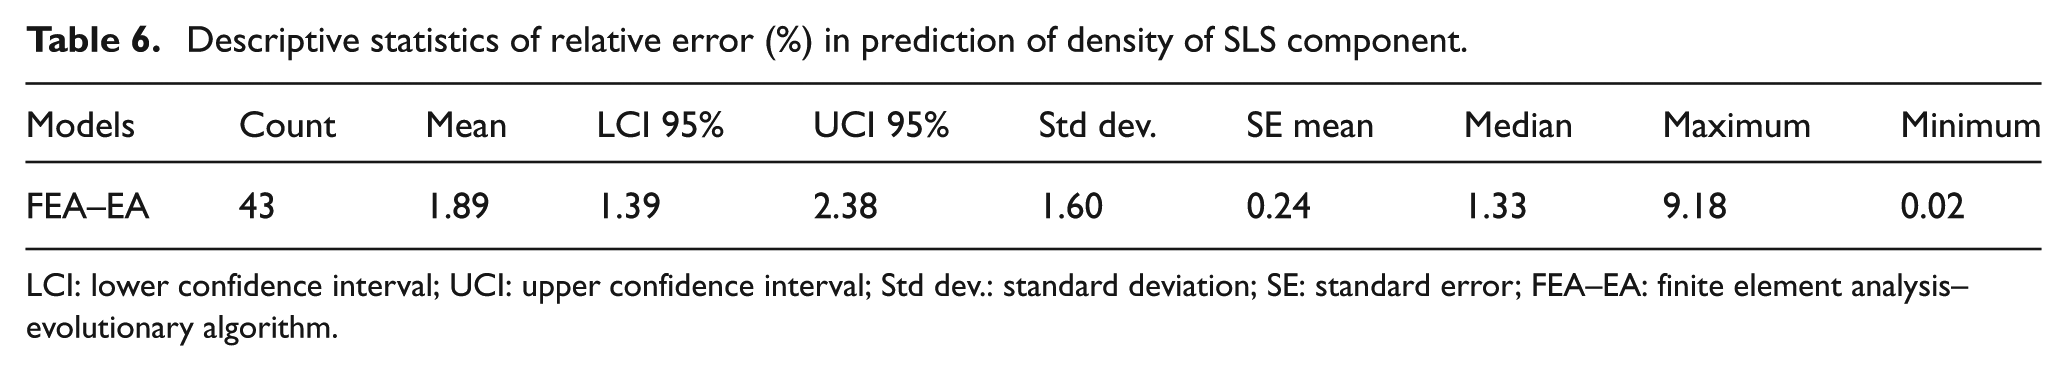
LCI: lower confidence interval; UCI: upper confidence interval; Std dev.: standard deviation; SE: standard error; FEA–EA: finite element analysis–evolutionary algorithm.
The goodness of fit of the model was evaluated based on the hypothesis tests (Table 7). We used t-tests to determine the mean and F-tests to calculate variance. For both sets of t-tests, the p-value of the model was >0.05, so there is not enough evidence to conclude that the actual values and predicted values from the model differ. Therefore, the models had a statistically satisfactory goodness of fit.
Hypothesis testing to evaluate goodness of fit of the model.
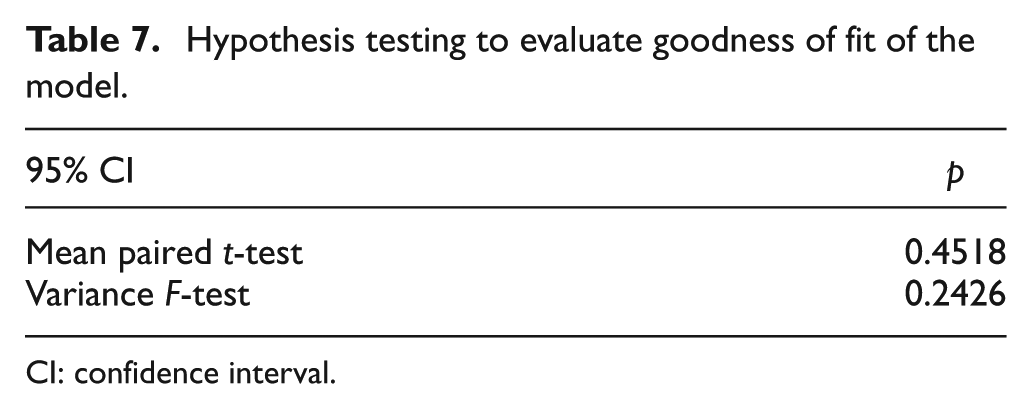
CI: confidence interval.
Thus, from the statistical comparison presented, it can be concluded that the proposed model is able to capture the dynamics of the SLS process in prediction of density of the SLS-fabricated component.
Sensitivity and parametric analyses of the proposed model
Sensitivity and parametric analyses about the mean were conducted for the validation of robustness of our FEA–EA model. The sensitivity analysis (SA) percentage of the density to each input parameter was determined using the following formulas

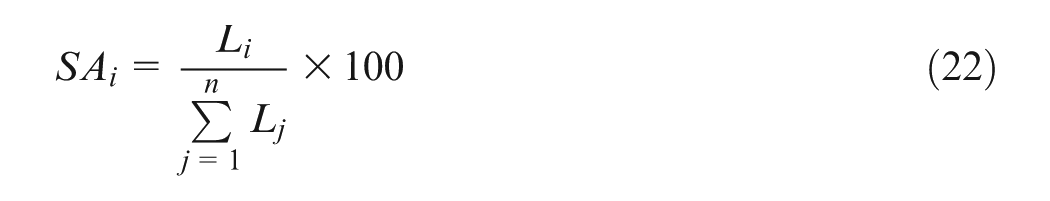
where
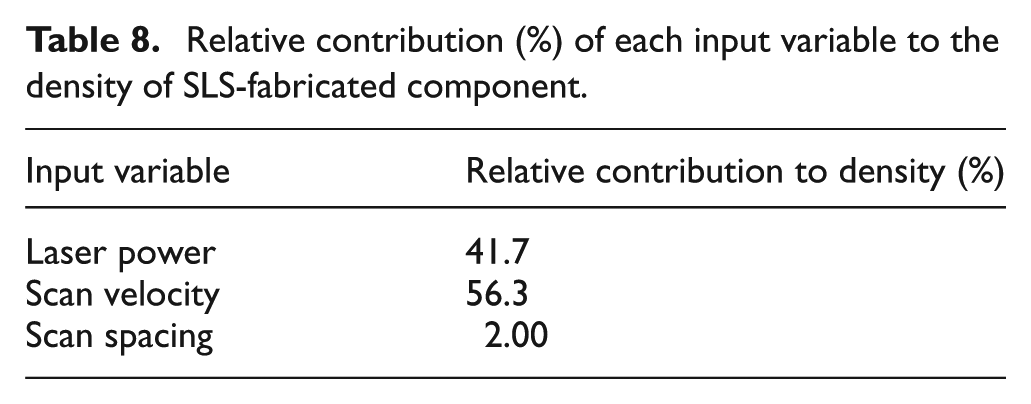
Table 8 shows the sensitivity results of input variables used to predict the density characteristic of the SLS-fabricated component. The process input variable, namely, the scan velocity, has the highest impact on density characteristic of SLS-fabricated component followed by laser power, whereas scan spacing has the least impact (Table 8). This result shows that by regulating the parameter scan velocity, the greatest variation in the density characteristic of SLS-fabricated component was obtained. The parametric analysis provided a measure of the relative importance among the inputs of the FEA–EA model and illustrates how the density characteristic of SLS component varied in response to the variation in input variables. For this reason, on the formulated FEA–EA model, the first input was varied between its mean ± definite number (0.2) of standard deviations, and the density characteristic of SLS component is computed, whereas the other input variable was fixed at its mean value. This analysis was then repeated for the other input variable. The results confirmed that, for example, the density characteristic of SLS-fabricated component follows a non-linear and dynamic relation with respect to the two input variables such as laser power and scan velocity (Figure 6). There was hardly any change observed in density when scan spacing was varied. The results comply well with those mentioned in the literature.47,48 Therefore, the FEA–EA model can be used to effectively represent empirical relationships between the density characteristic of SLS-fabricated component, laser power, scan velocity and scan spacing.
Relative contribution (%) of each input variable to the density of SLS-fabricated component.
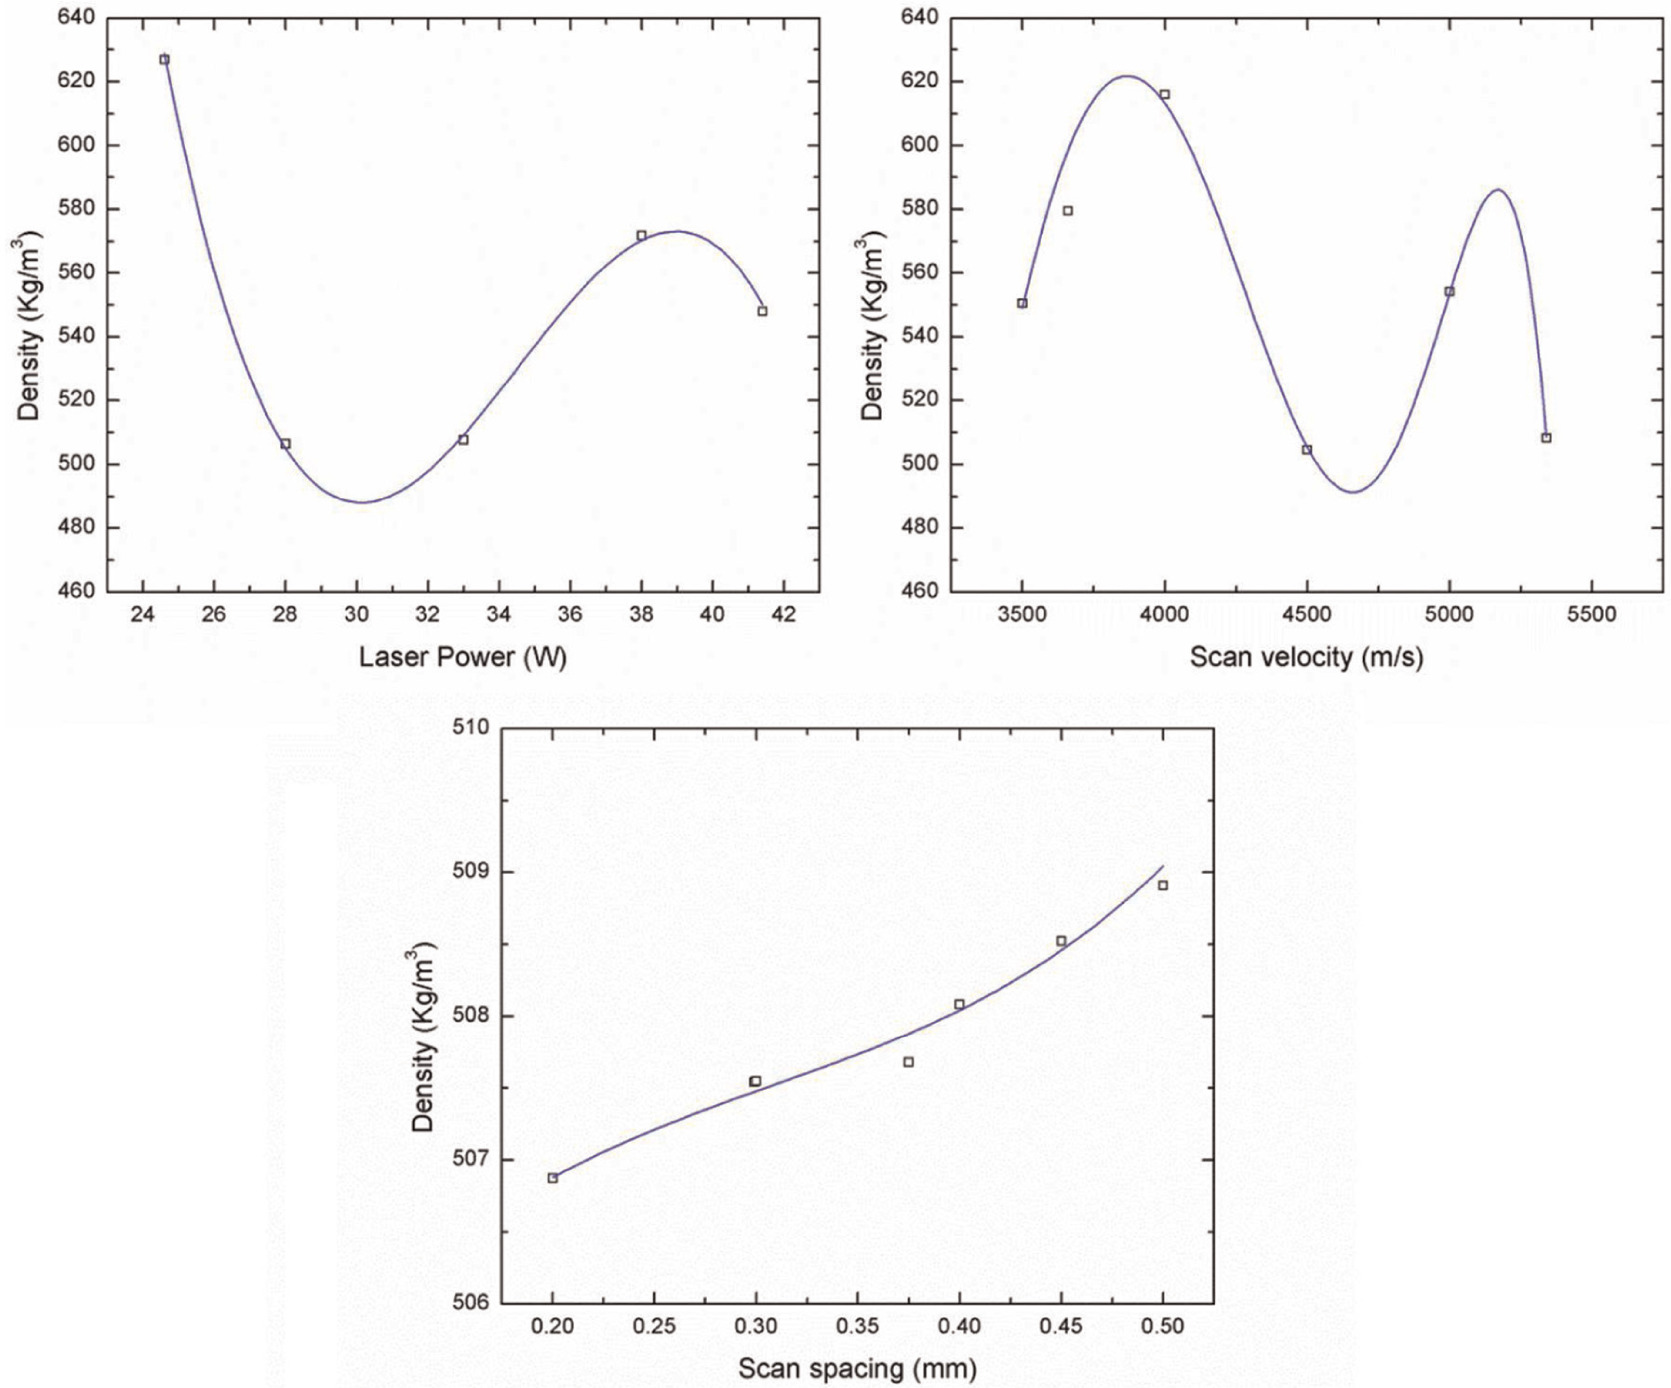
Parametric analyses showing the effect of input variables on the density of SLS-fabricated component.
Conclusion
This work establishes the motive behind studying the density characteristic of SLS-fabricated component. The literature emphasizes the importance of using coupled CI methods in effective modeling of complex processes involving multiple input–output variables. We propose a coupled FEA–EA model for simulating the density characteristic of the SLS-fabricated component. The results show that the proposed model was able to capture the dynamics of the process with predictions obtained well in agreement with the results obtained from the literature. The robustness of the model is validated by unveiling hidden non-linear relationships and dominant input process parameters. In this way, we have successfully formulated a robust coupled computational approach, which can be used in real time for process monitoring and control. The higher generalization ability of the model obtained is beneficial for optimizing the performance of the SLS process by predicting the density under uncertain input process conditions. The method evolves a model that represents the explicit formulation for density of laser-sintered 3D printing parts. Thus, the vital economic factors such as time and cost for estimating density characteristic using the trial-and-error approach for conducting experiments can be reduced. Future work will include the study of effect of additional input parameter laser spot light on the density of SLS-fabricated prototype.
Footnotes
Acknowledgements
The first two authors made equal contribution in this work and are both equally considered as first author.
Declaration of Conflicting Interests
The author(s) declared no potential conflicts of interest with respect to the research, authorship, and/or publication of this article.
Funding
The author(s) received no financial support for the research, authorship, and/or publication of this article.