
Abstract
In this article, Deform© three-dimensional package was used to develop a numerical model for friction stir process of Polyamide 6 based on Lagrangian incremental formulation, and additional experiments were done to verify this objective. For this purpose, the friction stir process was used to disperse the multi-walled carbon nano-tubes among the polymer matrix of Polyamide 6 homogeneously. Thermo-mechanical properties, for example, effective plastic strain distribution and material flow together with temperature, were successfully predicted for friction stir processing of Polyamide 6. X-ray diffraction and scanning electron microscopy were used to study the properties of fabricated nano-composite. According to the results, multi-walled carbon nano-tubes were homogeneously and straightly dispersed throughout Polyamide 6. The straight and non-curved dispersion of multi-walled carbon nano-tubes results in the growth of their reinforcement capability. Comparing the result of simulation and experimental friction stir process refers to good agreement between simulation predictions and actual observations. Temperature distribution study shows that the peak temperature appears at the interface of tool-shoulder/work-piece and the temperature distribution on the interacted surface is asymmetric. On the other hand, the analysis of effective plastic strain indicates that the material shearing of advancing side is higher than that of the retreating zone.
Keywords
Introduction
Properties of the outermost layer of polymer such as hardness and crystallization are critically required for a wide range of special applications considering wear resistance, coating, friction, and so on. On the other hand, polymers generally do not satisfy the surface properties required for previously mentioned successful applications. Thus, the outermost layer of polymers usually needs to be modified without affecting the bulk properties. 1
Friction stir process (FSP) is generally a structure modification method acting through intense plastic deformation. However, it is an alternative method recently applied to intersperse nano-particles into the matrix in order to make surface non-composite. In this case, the surface of the material changes to a composite with higher mechanical properties without changing bulk material. 2
During FSP, a tool with a shoulder and pin provides semi-solid–state plastic deformation in the work-piece. The tool is rotated and inserted into the work-piece and, then, travels along a specified path. The friction between the work-piece and shoulder as well as between the work-piece and pin leads to heat generation and temperature increase. It should be noted that, however, it should not reach the melting point of the work-piece.
Polyamide 6 (PA 6) is one of the most widely used thermoplastics all over the world. It has various applications such as gears, bearings, accessories, auto parts, and power tool housings. However, special applications cannot be applied successfully to PA 6 due to lack of special surface properties. 3
According to the exceptional thermal, mechanical, electrical, optical, and/or other properties of carbon nano-tubes (CNTs), they are widely used as fillers for a wide variety of materials. Several studies have been conducted on approaching a uniform distribution of CNTs among matrix materials, as one of the main issues. 4
Although numerous studies have been conducted on numerical modeling of FSP and fabrication of composites by FSP, almost all of them are about FSP of metals, and, unfortunately, there is little information about FSP of polymers.
Barmouz et al. 5 used the FSP for in situ dispersion of nano-clay particles in high-density polyethylene. Liu et al. 6 studied the microstructure and mechanical properties of aluminum matrix composite reinforced with multi-walled carbon nano-tubes (MWCNTs). Ciliberto et al. 7 optimized the process of friction stir welding (FSW) of T joints in joining dissimilar aluminum alloys for the aeronautical application. Prisco et al. 8 studied the influence of welding parameters and post-weld aging on tensile properties and fracture location of AA2139-T351 joints fabricated by FSW. Paradiso et al. 9 used the FSP to refine the grains of AZ31 Mg alloy as starting sheets for super-plastic forming process. Barmouz and Besharati Givi 10 used the multi-pass FSP for in situ dispersion of the SiC particles throughout the Cu matrix. Cavaliere 11 evaluated the mechanical properties of 2618 aluminum alloy friction stir processed with 20% of alumina.
Pashazadeh et al. 12 developed a three-dimensional (3D) numerical model for FSW of copper sheets using the Deform© 3D software. In this work, the temperature, effective plastic strain, and material flow behavior of copper were studied during the FSW process. Using Deform 3D software, Asadi et al. 13 simulated thermo-mechanical model of AZ91 magnesium alloy for FSP. According to the reports, structural transformations of work-piece were predicted during FSP, in addition to temperature, effective plastic strain, and material flow behavior. Guerdoux and Fourment 14 used 3D software Forge3 for finite element (FE) simulation of three phases of FSW.
Zhang and Zhang 15 developed a fully coupled thermo-mechanical model in which the shoulder of the tool plays a significant role in material flow of the upper surface. Buffa et al. 16 used the Deform 3D software for FE simulation of FSW based on Lagrangian incremental formulation. Zhang et al. 17 developed a two-dimensional (2D) model based on Lagrangian–Eulerian incremental formulation using the Abaqus software. Bozkurt 18 optimized the process parameters of FSW to obtain the maximum mechanical properties for the joints of polyethylene. Arici and Selale 19 investigated the effect of tilt angle of FSW tool on the mechanical properties of the joints of polyethylene sheets. Arici and Sinmaz 20 studied the effect of double-pass FSW on the mechanical properties of the joints of polyethylene sheets. Aydin 21 analyzed the effect of process parameters of FSW and pre-heating on the mechanical properties of ultra-high-molecular-weight (UHMW) polyethylene joints. Rezgui et al. 22 used the Taguchi method to optimize the FSW parameters for joining the polyethylene sheets. Saeedy and Givi 23 investigated the critical FSW parameters for joining the polyethylene sheets. Rezgui et al. 24 optimized the FSW parameters for joining high-density polyethylene.
In this study, Deform 3D software was used to develop a 3D Lagrangian incremental–based model to predict effective plastic strain, temperature, and material flow behavior of PA 6 in the FSP zone. Additionally, FSP was used to disperse the MWCNTs in the polymer matrix of PA 6. And microstructure of the fabricated surface nano-composite was evaluated using scanning electron microscopy (SEM). Also,X-ray diffraction (XRD) analysis was used to investigate the homogeneous state of MWCNTs in the polymer matrix.
Experimental procedure
The PA 6 used in this study was commercial grade TECAST™. The MWCNTs were of carboxyl (MWCNTs-COOH) type and were prepared by catalytic chemical vapor deposition (CVD) method.
Before FSP, a groove with cross-section of 1 × 6 mm2 was developed on the work-piece, and then, the MWCNT powder was poured and compressed into the groove. Finally, the FSP tool was plunged inside the work-piece and, then, traveled along the developed groove to distribute the MWCNT particles inside the stirred zone of PA 6 matrix.
Due to the lack of information about the FSP of PA 6, several trials and errors were conducted to achieve the optimum FSP parameters. A combination of 2000 r/min and 100 mm/min of rotational and traverse speeds, respectively, has been obtained to achieve a proper distribution of MWCNTs and appropriate quality of surface nano-composite.
To observe the MWCNTs, SEM was operated under acceleration voltages of 5 and 10 kV. The SEM is of field emission type and works in high and low vacuum cases (for nonconductive samples). XRD patterns of samples were recorded under a voltage of 40 kV and a current of 30 mA for Cu radiation
FE simulation
Deform 3D software was selected to simulate the FSP of PA 6 with arbitrary Lagrangian–Eulerian formulation. In this simulation, it was assumed that (1) the work-piece model is a rigid-viscoplastic material, (2) the material model of tool is rigid, (3) the thermal properties of the tool and work-piece are constant, and (4) there is a constant friction coefficient between the tool and work-piece (Table 1).
Thermal properties of the work-piece and FSP tool.
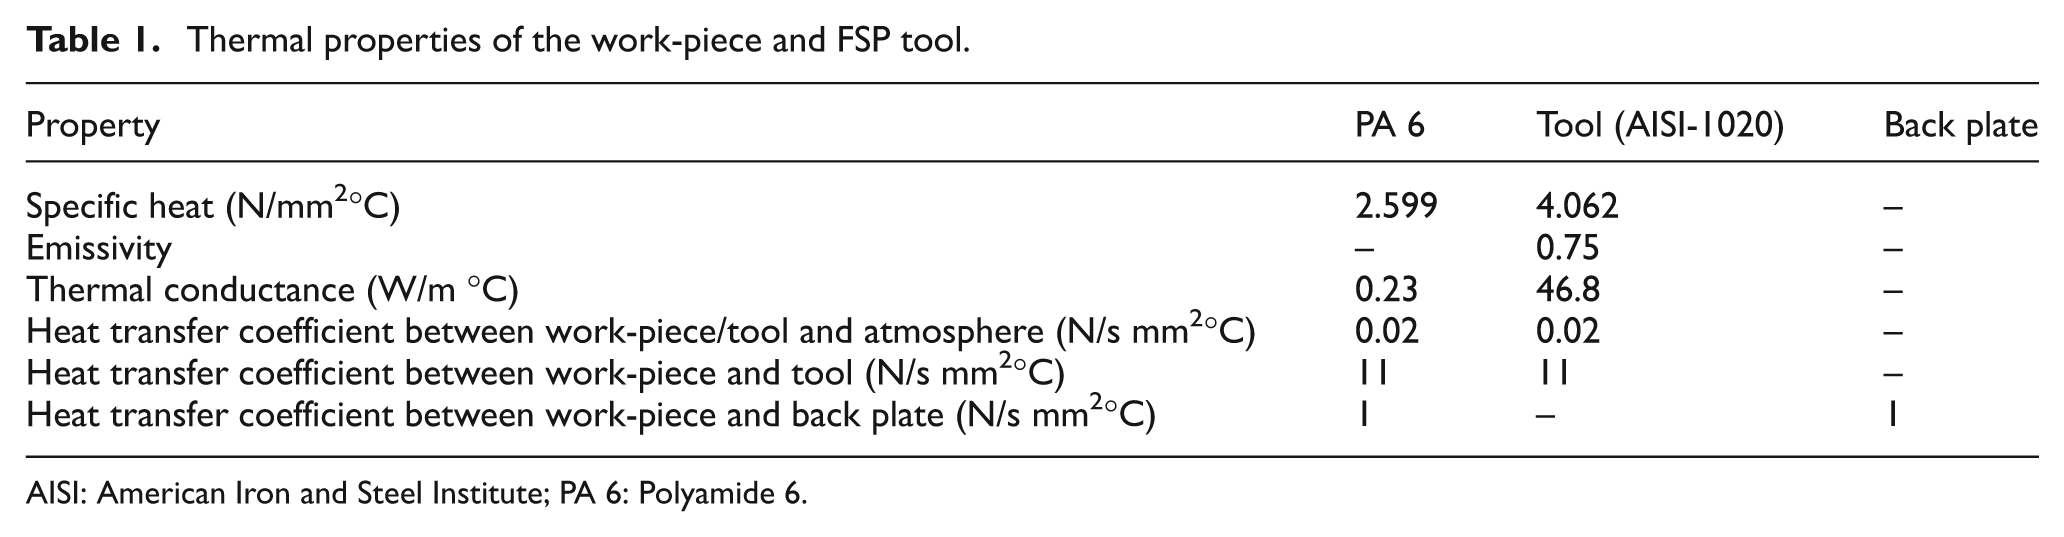
AISI: American Iron and Steel Institute; PA 6: Polyamide 6.
Furthermore, the bottom surface of the work-piece was fixed in three main directions and assumed to be in contact with atmosphere in order to simplify the problem. The free surfaces of tool and work-piece were assumed to be in contact with atmosphere at a constant temperature of 20 °C.
Governing equations
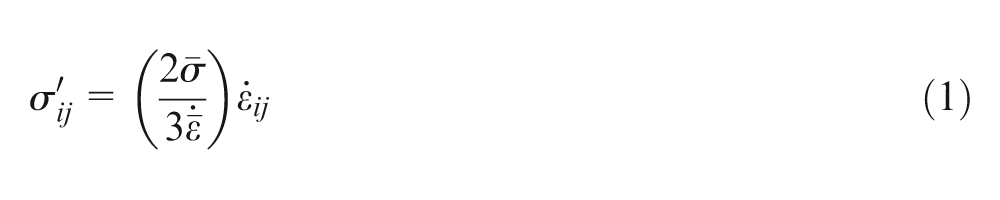
The rigid-viscoplastic model was selected as the work-piece material. This model results in nonlinear equations that may be solved by various iterative numerical methods. The rigid-viscoplastic model may be derived from various principles. In this work, the following equation was used for rigid-viscoplastic material 12
Moreover, the von Mises was selected as the material flow criterion
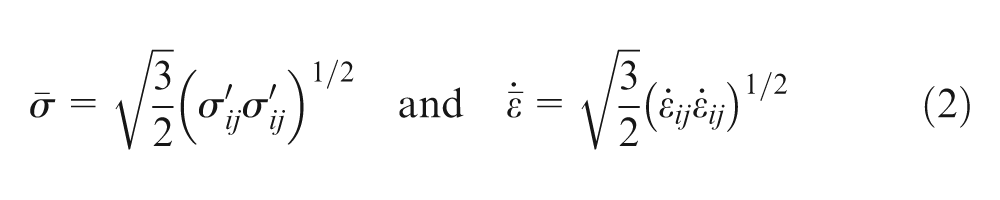
where
To find the actual solution, the following functional equation was used
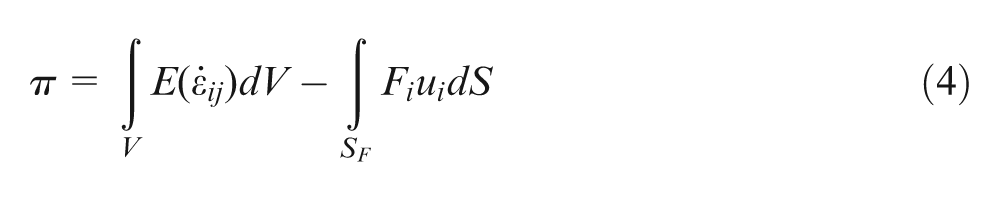
where
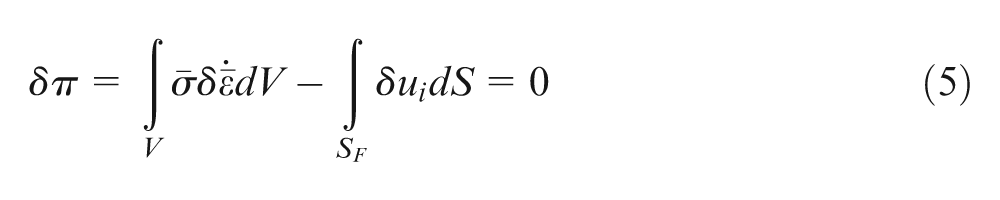
To solve the assumed boundary value problem, the first-order variation of the functional equation should be obtained as follows
To satisfy the incompressibility condition, penalized form of first-order variation of functional equation is used as follows
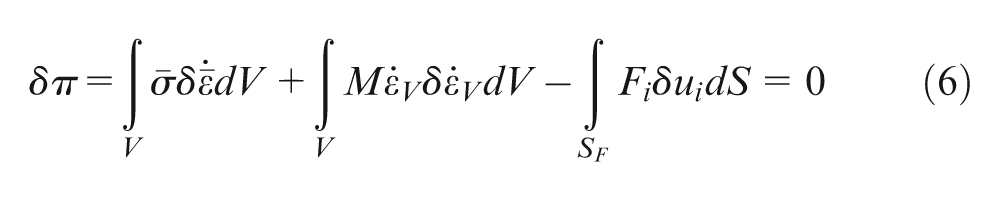
where M,
Equation (6) is the principal formulation of rigid-viscoplastic material model based on Lagrangian incremental formulation. This equation should be coupled with heat transfer model to simulate the FSP
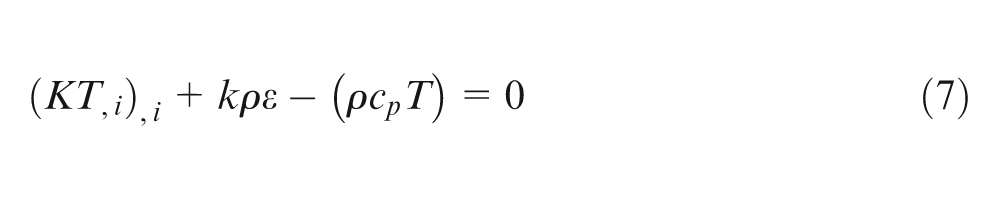
where K, T,
Finally, the equation for energy balance based on weighted residual method can be written as follows
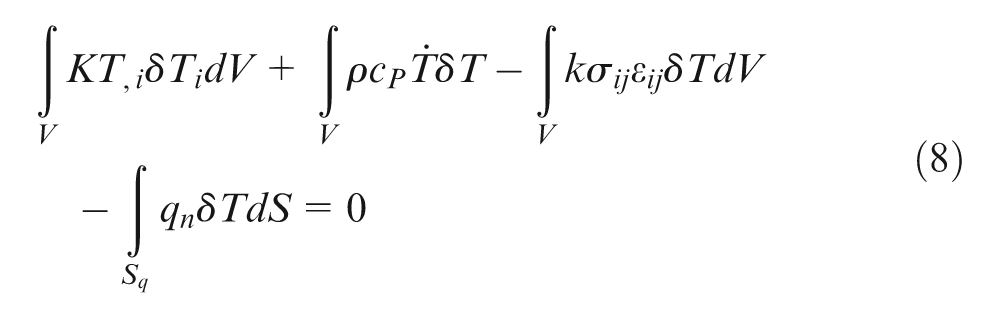
where qn denotes the heat flux.
Material model, boundary conditions, and process parameters
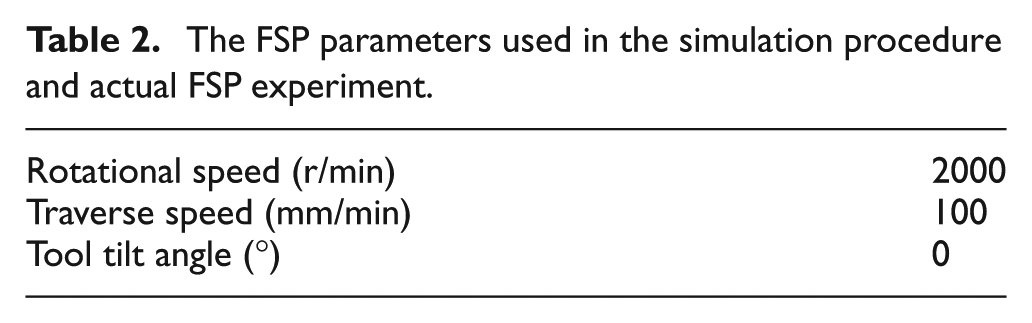
The rigid and rigid-viscoplastic models were selected for the tool and work-piece materials, respectively. The tool and work-piece were meshed using the tetrahedral minimum mesh sizing method, and 0.5 and 0.7 were selected as the minimum mesh size of the tool and work-piece, respectively. Figure 1 demonstrates the schematic layout of work-piece and tool. In rigid-viscoplastic model, only the plastic region of deformation was considered, and the relation of flow stress–plastic strain at different temperatures of 20 °C, 35 °C, 55 °C, 65 °C, and 80 °C and strain rates of 0.33 × 10⁻³, 1.67 × 10⁻³, 3.33 × 10⁻³, and 1.67 × 10⁻² s−1 was interpolated in linear space. 25 The flow stress–strain diagrams of PA 6 are illustrated in Figure 2. Table 2 refers to FSP parameters used in the simulation procedure and actual FSP experiment. The FSP parameters used in the simulation procedure and actual FSP experiment are given in Table 2.
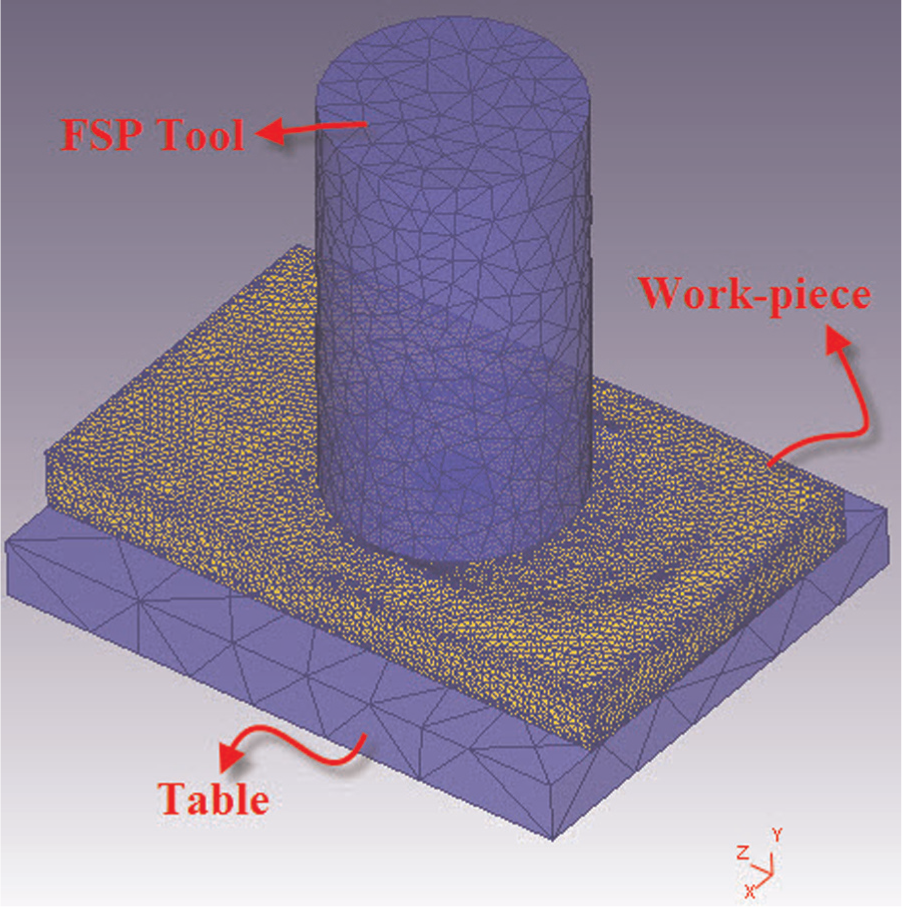
The schematic layout of work-piece and tool.
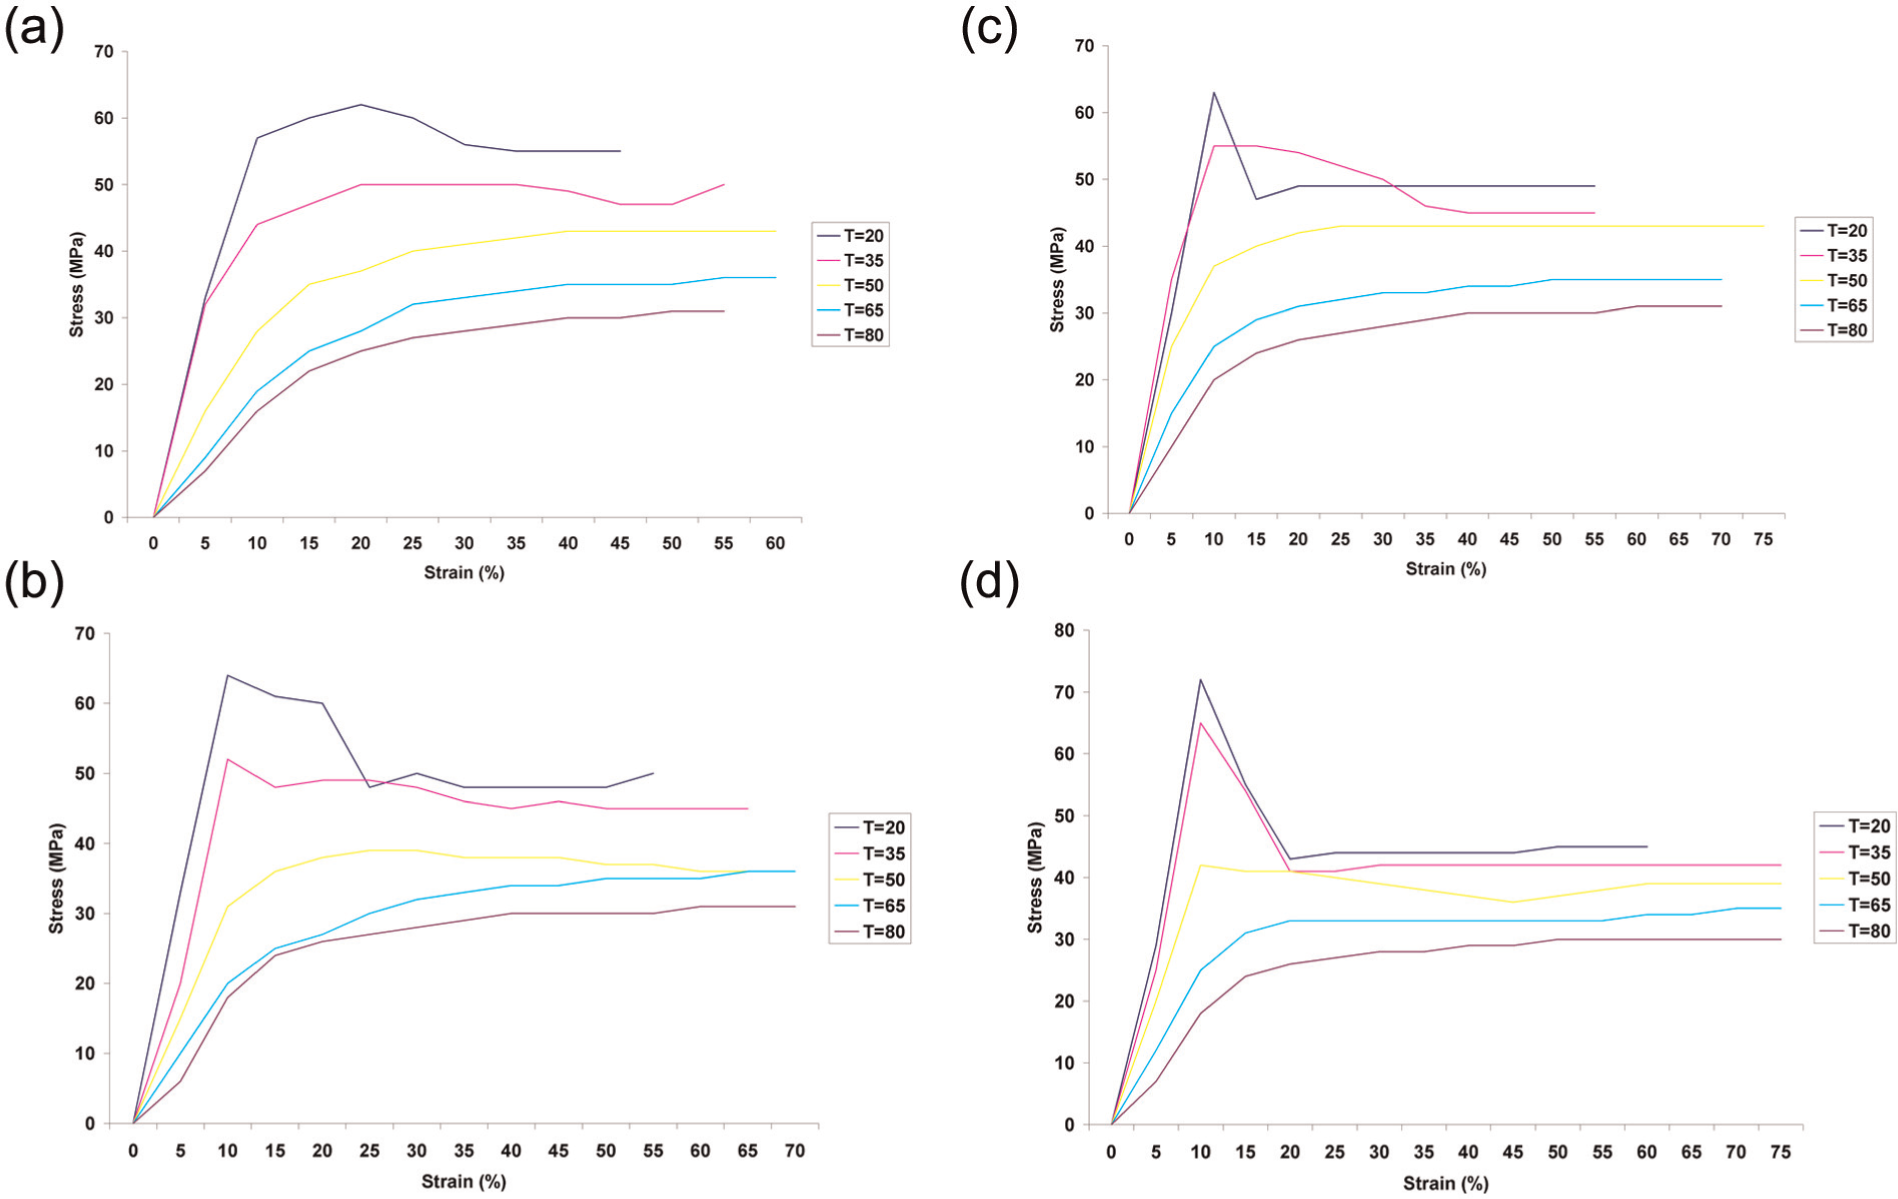
The stress–strain curves of pure PA 6 at different temperatures for strain rate of (a) 0.33 × 10⁻³, (b) 1.67 × 10⁻³,(c) 3.33 × 10⁻³, and (d) 1.67 × 10⁻².
The FSP parameters used in the simulation procedure and actual FSP experiment.
Friction model
Constant shear friction model was selected for simulation as follows
where f, L, and y indicate stress resulted by friction, coefficient of friction, and shear yield strength of softer material (work-piece), respectively. In order to calibrate the friction coefficient, the temperature predicted by simulation at a point 6 mm away from FSP centerline was compared with temperature of the same point in experiment. After several trials and errors, it was observed that there is the same coefficient, that is, L = 0.3, for simulation and experiment.
Results and discussion
Experimental results
Macro-quality investigation of fabricated surface nano-composites
As mentioned, several specimens were produced by different combinations of FSP parameters. According to the findings, heat generation in low rotational speeds was not sufficient to increase the temperature of PA 6 matrix to its glass transition temperature (Tg ) and soften it. Therefore, the PA 6 matrix has become tattered during FSP. On the other hand, heat generation in high rotational speeds was excessively high and led to melting of PA 6. Due to high fluidity of molten PA 6 matrix, the FSP became out of control and PA 6–MWCNT mixing procedure would not be successful.
Figure 3 illustrates the macro-surface appearance of the specimen fabricated by the optimum combination of 2000 r/min and 100 mm/min of rotational and traverse speeds, respectively. As illustrated, the PA 6–MWCNT mixing procedure was apparently successful in the optimum combinations of FSP parameters.
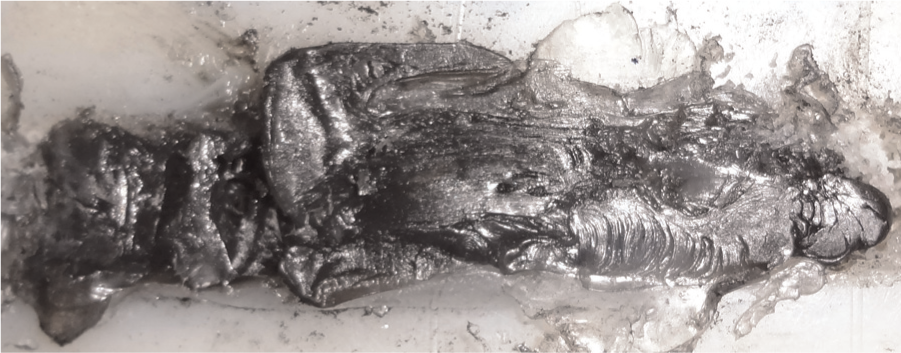
The macro-surface appearance of the specimen fabricated by the optimum combination of 2000 r/min and 100 mm/min of rotational and traverse speeds, respectively.
Dispersion state investigation by XRD patterns
The XRD patterns of pure PA 6, pure MWCNTs, and the specimen fabricated by the optimum combination of 2000r/min and 100 mm/min of rotational and traverse speeds, respectively, were compared in order to investigate the effect of MWCNTs on crystallization behavior of PA 6. According to Figure 4, existence of α form of crystals is reflected as 2θ = 20° and 2θ = 24° for both specimens. The α phase is crystalline sheets of hydrogen-bonded chains formed between decussate chains. As seen, the intensity of α-phase peaks for neat PA 6 is higher than that of PA 6/MWCNT nano-composite. On the other hand, significant narrowing can be observed in the α-phase peak of PA 6/MWCNT nano-composite in comparison with neat PA 6. According to Figure 5, a peak was observed for pure MWCNTs at 2θ = 25° that cannot be seen in the XRD pattern of nano-composite specimens (Figure 4). It indicates proper dispersion of MWCNTs in PA 6 matrix.
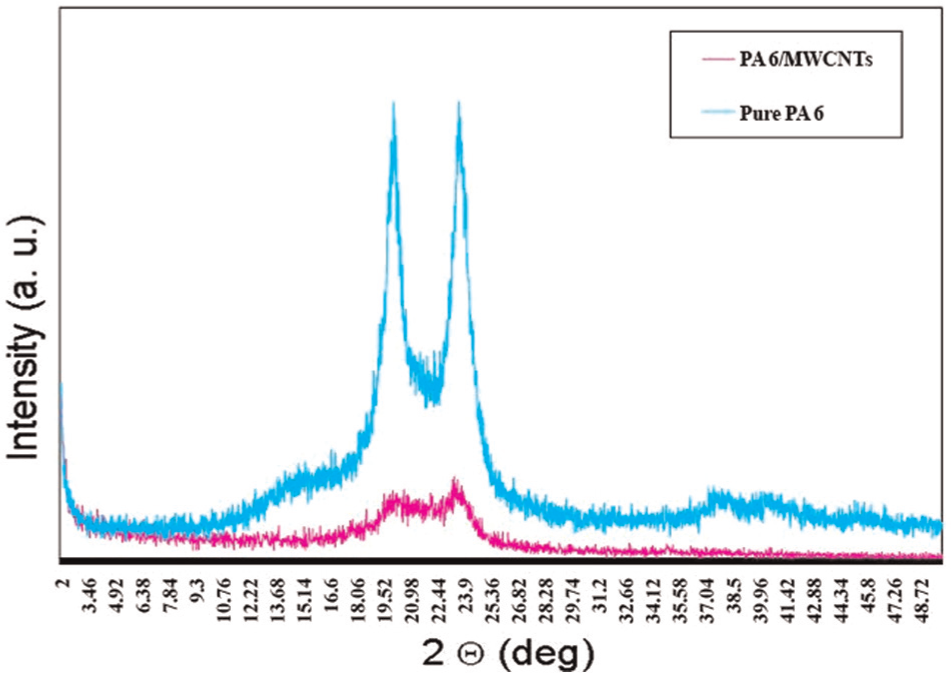
XRD patterns of pure PA 6 and the specimen fabricated by the optimum combination of FSP parameters.
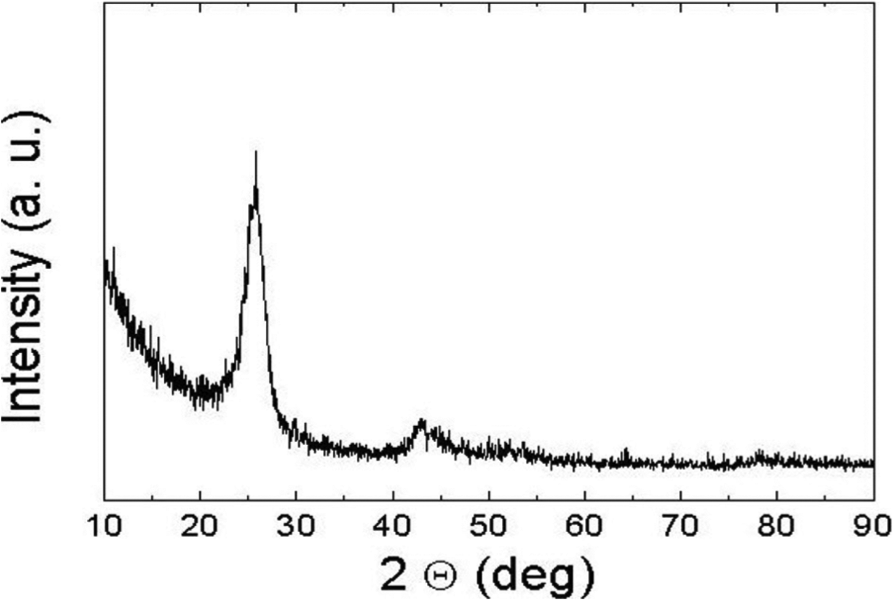
The XRD patterns of pure MWCNTs.
Dispersion state investigation by SEM
Figure 6 illustrates the MWCNTs observed by SEM. It is clearly seen that the nano-tubes are approximately 15–20 nm in diameter and several micrometers in length. Figure 7 shows the SEM observation of homogeneous dispersion of MWCNTs in PA 6 matrix fabricated by 2000 r/min and 100 mm/min of rotational and traverse speeds, respectively. The contrast variations are due to the scattering difference in electrons from different depths. As shown, the interwoven nano-tubes in the nano-composite are drawn in an approximately straight line contrary to extreme flexible and curved structure of MWCNTs. On the other hand, it is clearly seen that the MWCNTs are dispersed with a preferred orientation after FSP. This orientation is most likely toward traverse direction of FSP tool because the MWCNTs are forcibly guided to the back of FSP tool in the opposite direction of FSP tool traverse. Straightness of interwoven nano-tubes increases the reinforcement capability of MWCNTs provided for the polymeric matrix in comparison with the curvature interwoven nano-tubes produced with other traditional methods such as melt mixing. Also, results of straight dispersion of MWCNTs are very close to those of theoretical reinforcement pointed by Fisher et al. 26
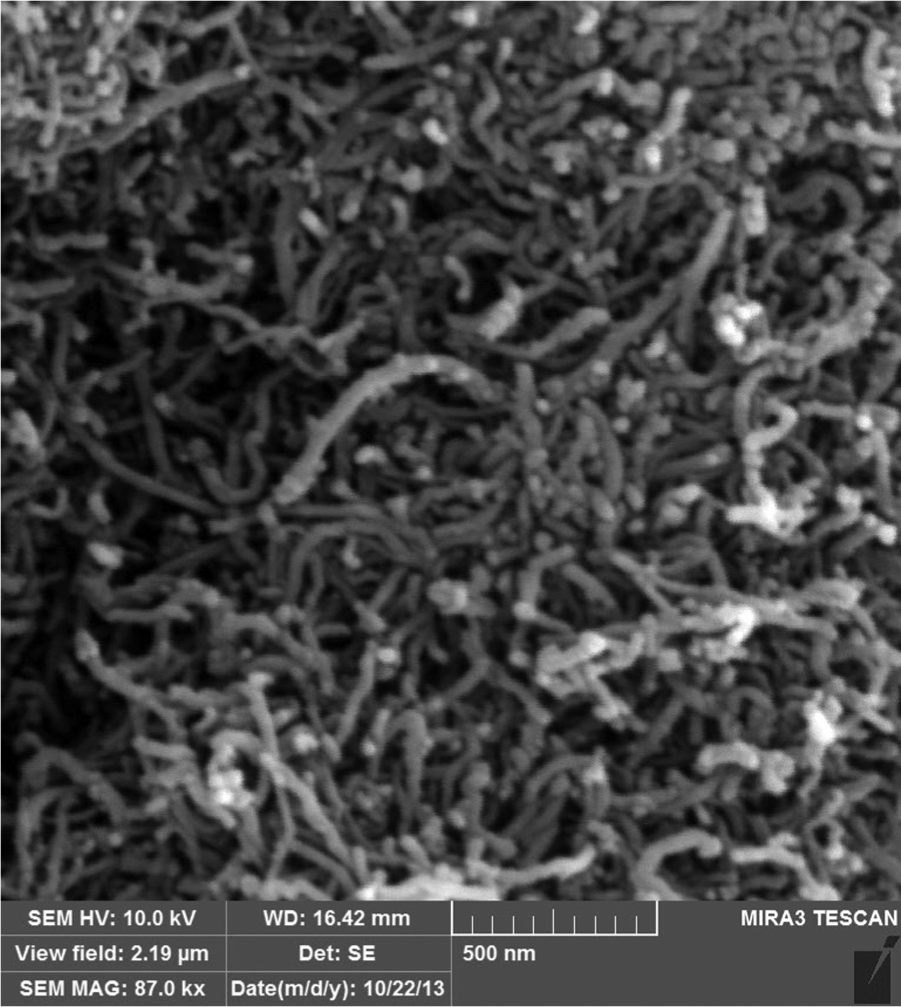
The MWCNTs observed by SEM.
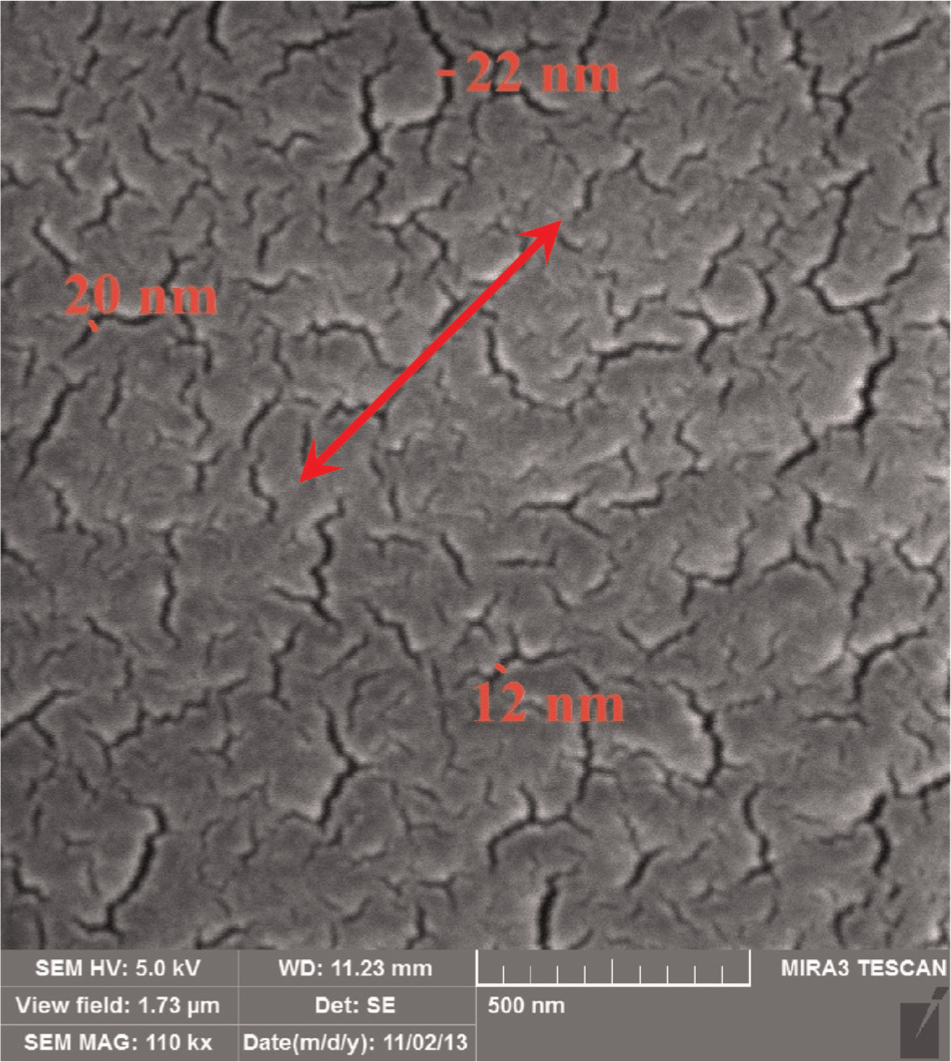
The homogeneous dispersion of MWCNTs in matrix of PA 6 fabricated by 2000 r/min and 100 mm/min of rotational and traverse speeds, respectively.
FE simulation results
The temperature distribution, effective plastic strain, and material flow behavior of the work-piece were predicted as follows.
Temperature distribution
Initially, it is necessary to check the accuracy of the simulated model. For this purpose, it is important to verify it by comparing its results with those of the experimental data. Considering that maximum temperature is basis of verifying the simulated model, the experimental maximum temperature record was compared by the predicted maximum temperature record. Figure 8 demonstrates the maximum temperature record of a point 5.5 mm away from the FSP centerline. As seen, the experimental and predicted maximum temperatures are 151 °C and 147 °C, respectively. The error of 2.5% between simulation predictions and experimental data was obtained at 2000 r/min and 100 mm/min rotational and traverse speeds of the tool.
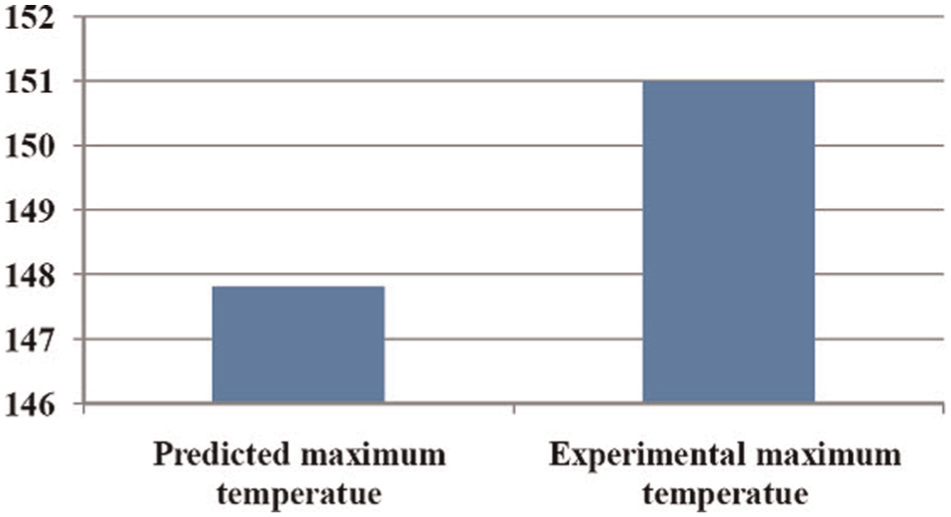
The maximum temperature record of a point located 5.5 mm away from the FSP centerline.
Figure 9 shows the temperature contours along the tool path after 18 mm tool feed. As illustrated, the peak temperature is 185 °C, appearing at the interface of tool-shoulder and work-piece. Moreover, there is an asymmetric temperature distribution on the interacted surface of the work-piece. There is a good agreement between this observation and metal FSP reported by Liu et al., 6 Paradiso et al., 9 and Barmouz and Besharati Givi. 10
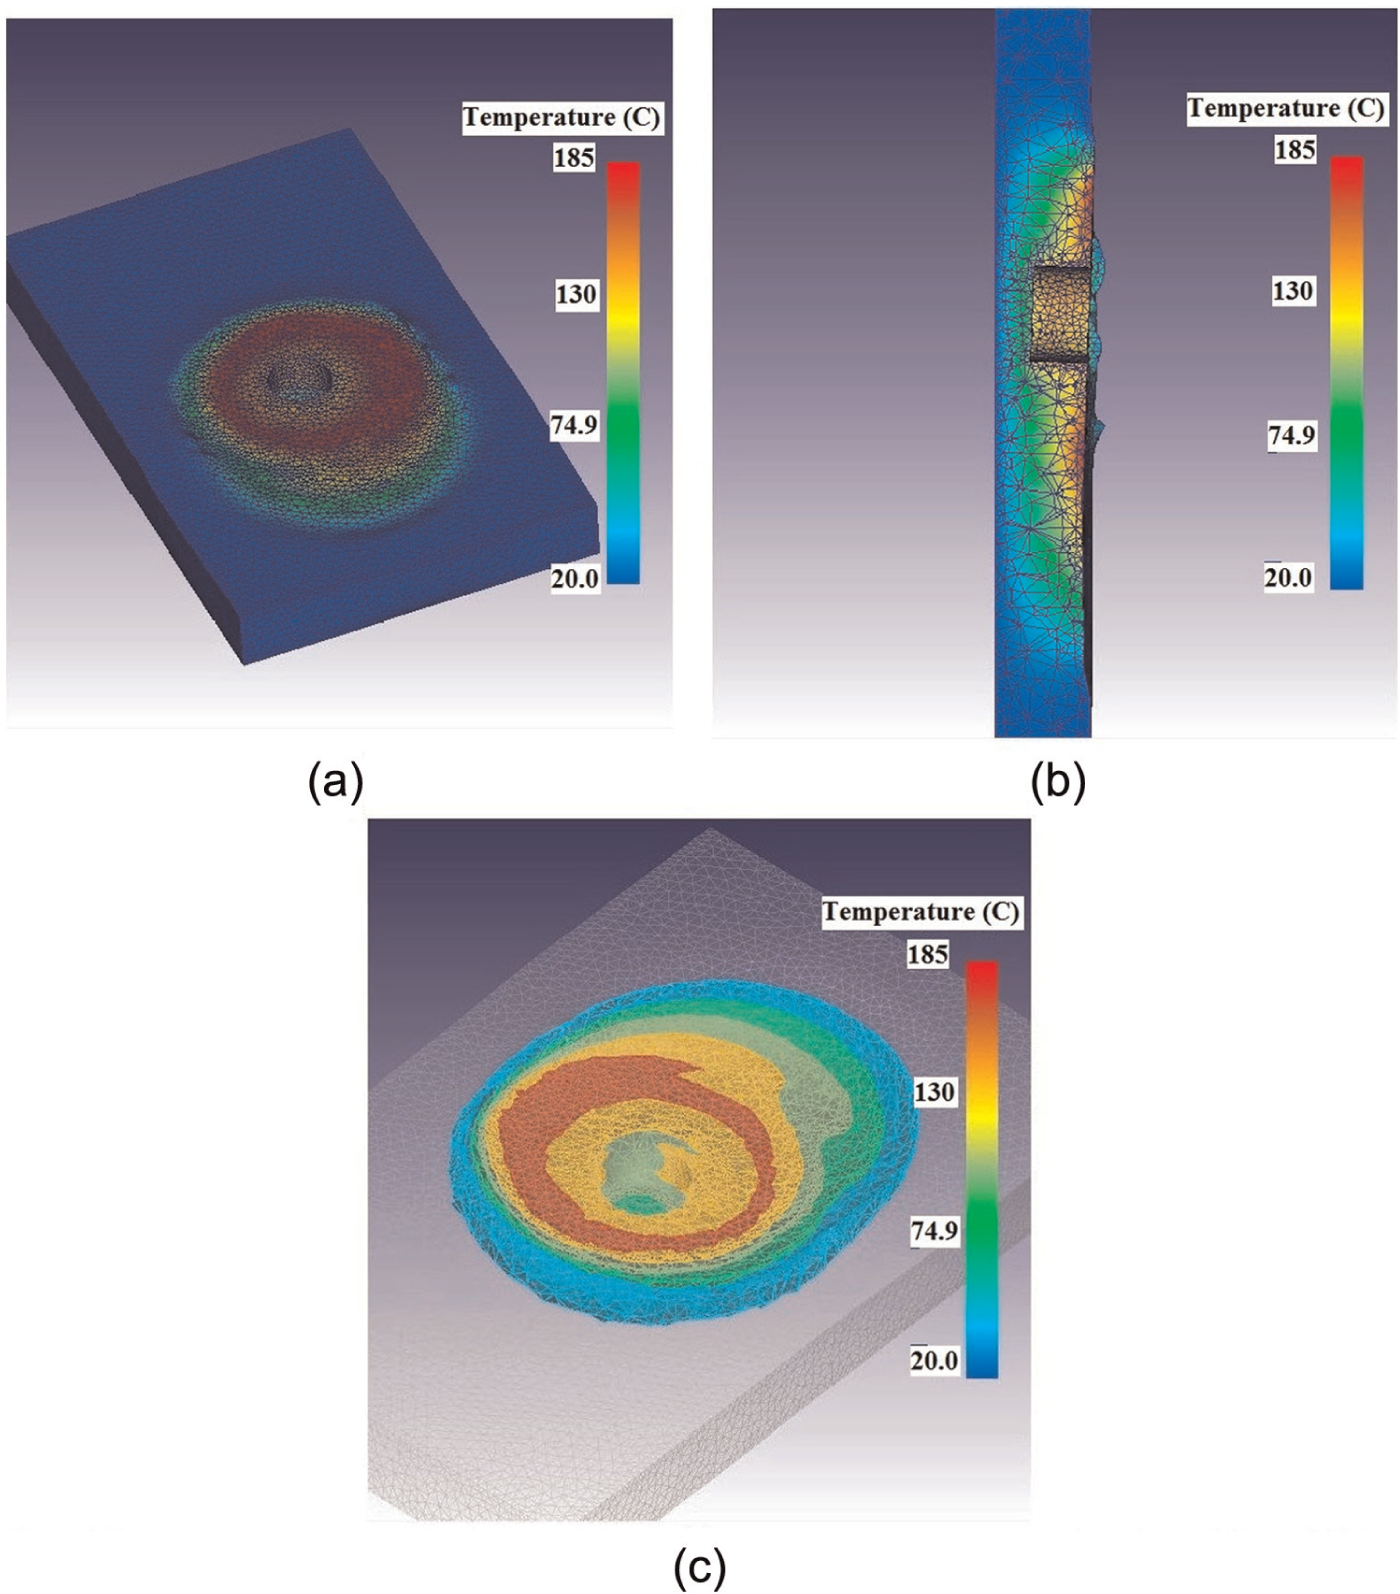
The temperature contours along the tool path after 18 mm tool feed (a) at surface, (b) in midline cross-section, and (c) in bulk.
To more accurately investigate the temperature of the work-piece, it is necessary to plot the temperature records of points located at advancing and retreating sides of work-piece. The points are arranged in steps and depth of 2 mm from surface. Figure 10 shows the schematic location of selected points. As seen, points b1, b2, and b3 are located in the advancing side; b4 on the FSP centerline; and b5, b6, and b7 in the retreating side. According to Figure 11, the more the distance from the center of tool, the lower the temperature of each point because effective plastic strain decreases as the distance from the center of the tool increases (section “Effective plastic strain”). The maximum peak temperatures of 124 °C and 120 °C at advancing and retreating sides are observed at points b3 and b5, respectively.

The schematic location of selected points for temperature history analysis.
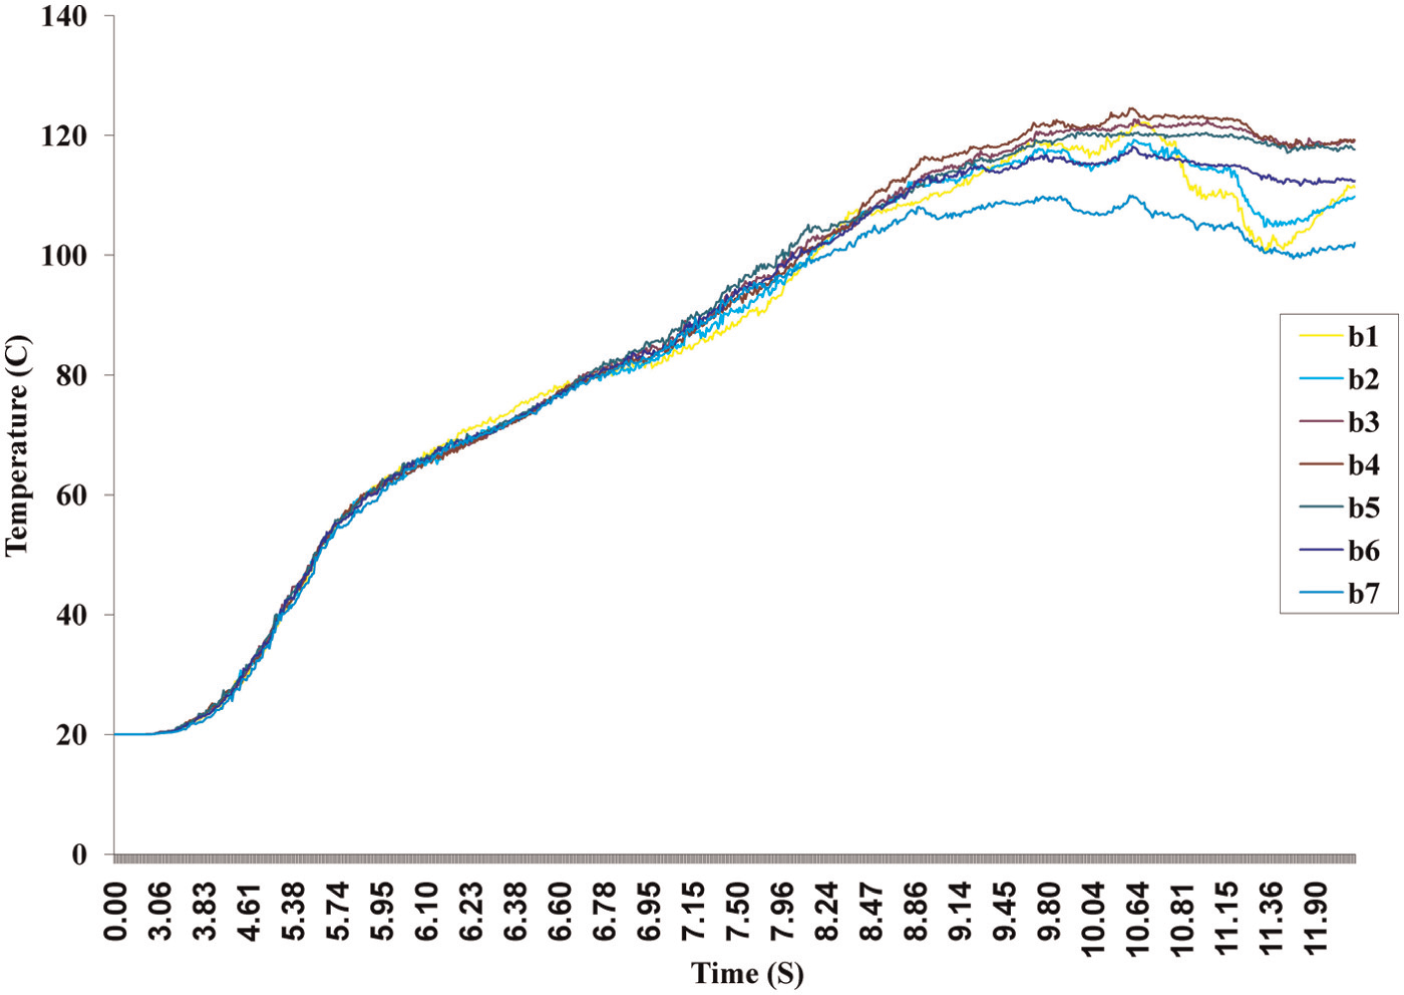
The temperature history of selected points located at advancing and retreating sides of work-piece.
Effective plastic strain
It is well known that the work-piece, during the FSP, is affected by high plastic deformations under high pressure. Figure 12 illustrates the effective plastic strain counters along the tool path after 18 mm tool feed. For more detailed information, the tool path cross-section is presented also in Figure 12. Accordingly, the effective plastic strain decreases from the top surface to bottom because the tool-shoulder accelerates the material flow near the top surface.
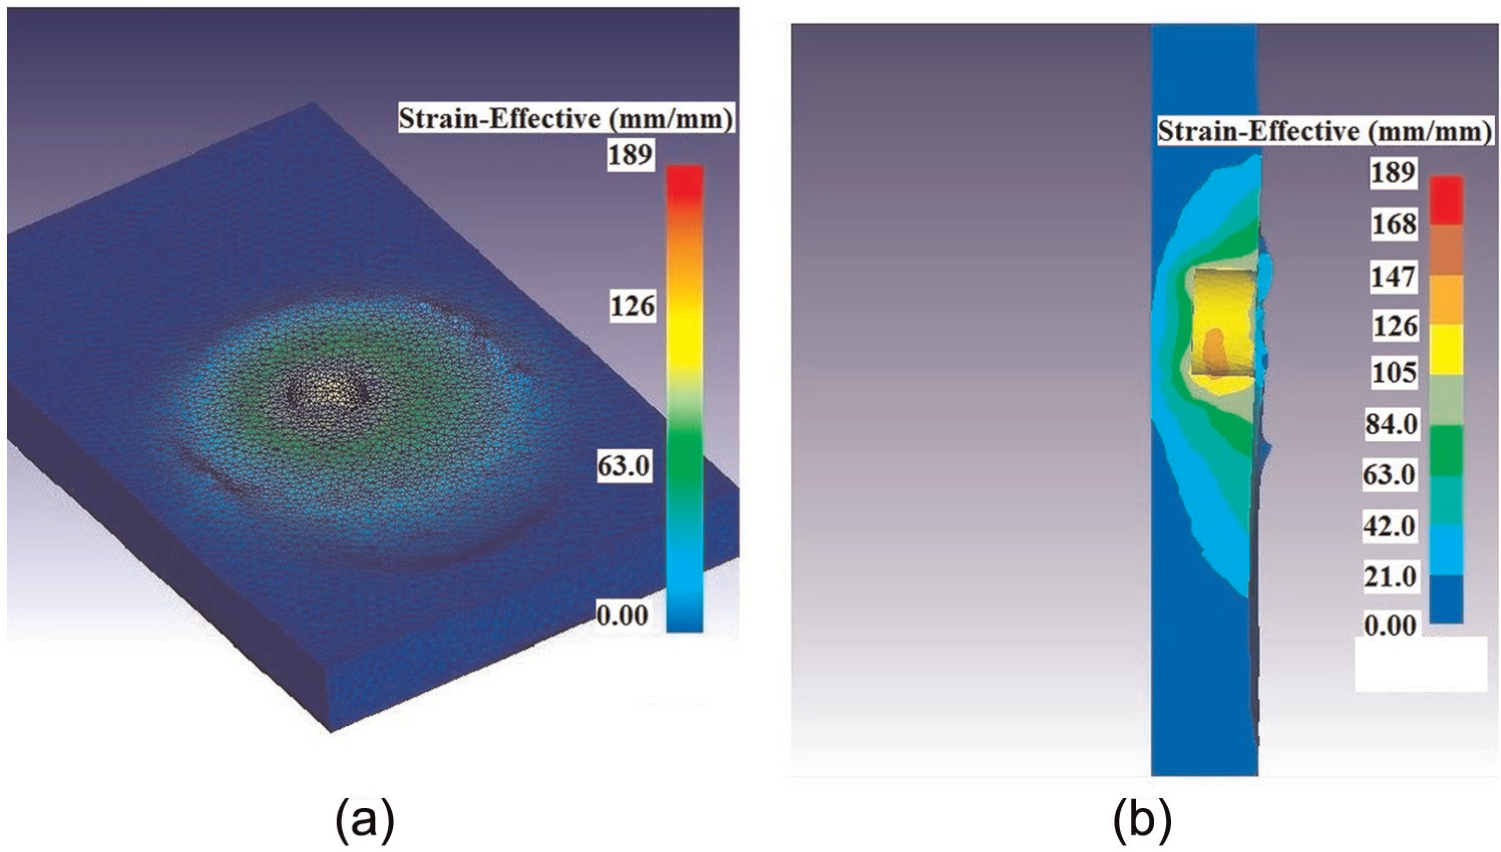
The effective plastic strain counters along the tool path after 18mm tool feed (a) at surface, (b) in midline cross-section.
To more accurately investigate the effective plastic strain of work-piece, it is necessary to plot the effective plastic strain records of points located at advancing and retreating sides of work-piece. The points b1, b2, b3, b4, b5, b6, and b7 introduced in section “Temperature distribution” are selected to be plotted. Figure 13 shows the historic curves of effective plastic strain for selected points. It is clearly seen that the effective plastic strain of the advancing side is greater than that of the retreating side. Thus, material shearing mostly occurs at the advancing side. On the other hand, the more the distance from the center of the tool, the less the effective plastic strain. As a result, the maximum temperature of each point decreases with an increase in distance from the center of the tool.
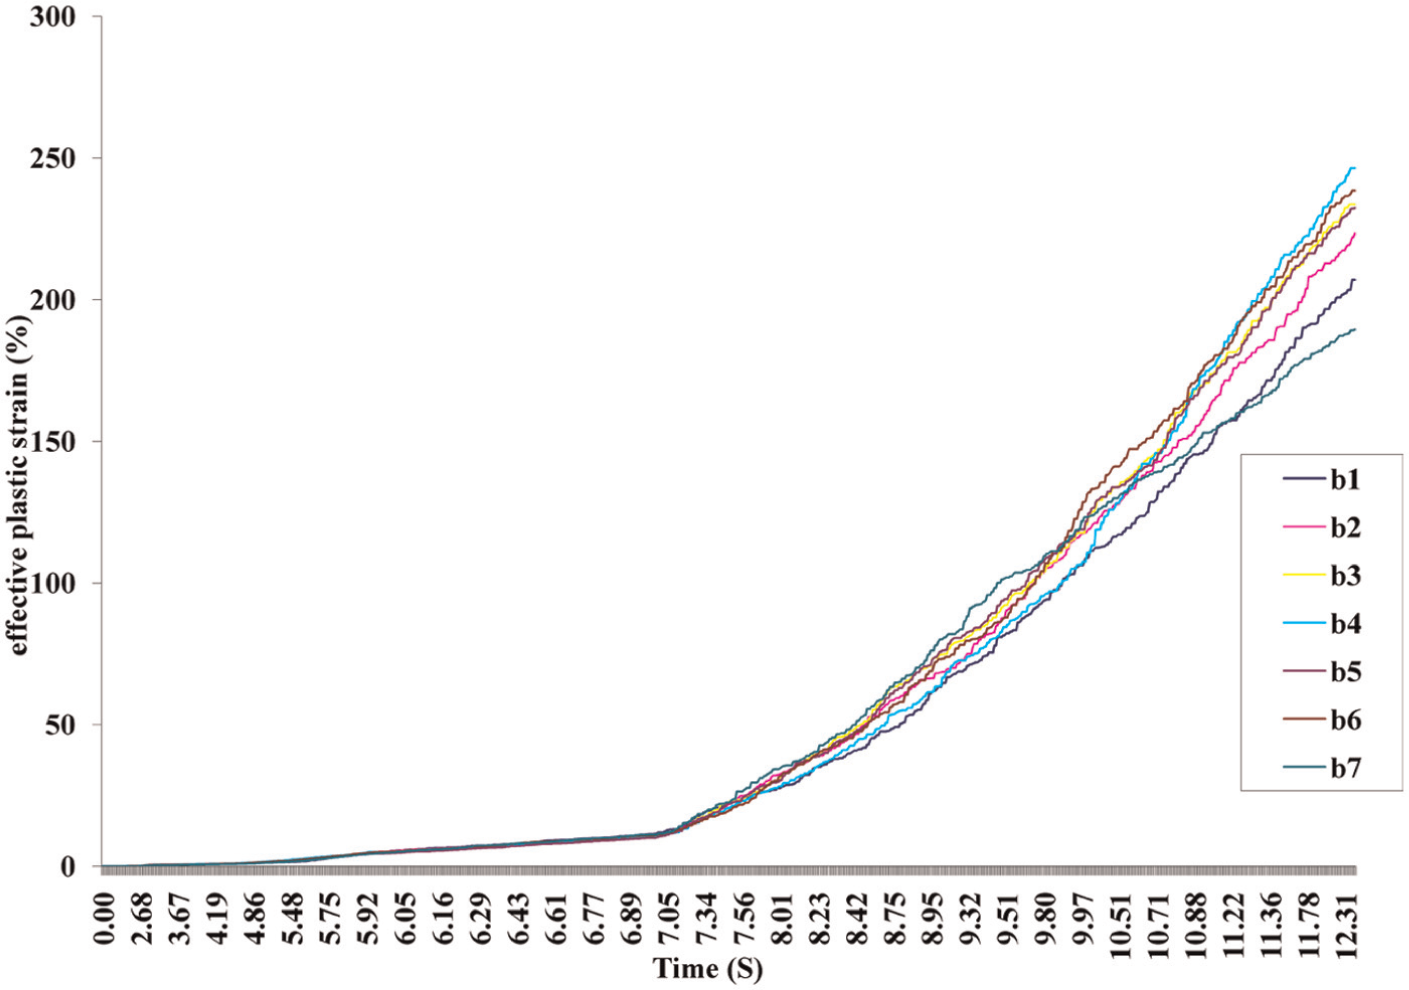
The historic curves of effective plastic strain for selected points.
Material flow behavior during FSP
Understanding the material flow behavior of the work-piece during the FSP may be helpful in selecting the optimum tool-pin and tool-shoulder shapes. In this work, the point tracking system was used to trace the selected points when the tool passes through them. These points are located in different depths from surface in increments of 0.5 mm. Figure 14 illustrates the schematic layout of point tracking during the FSP. As shown, the points p1, p2, p3, p4, p5, and p6, which are close to the tool-shoulder, turn around the tool-pin toward the retreating zone with higher diameter in comparison with tool-pin diameter because the tool-shoulder, in addition to the tool-pin, accelerates the material flow near the top surface. This is why the stirred zone has broader cross-section near the top surface. The points p7, p8, p9, and p10 turn around the tool-pin with approximately the same diameter of the tool-pin. The points p11 and p12 illustrate the material flow behavior at the lower side of stirred zone. As seen, point p11 moves up to the surface, while the movement of point p12 is negligible. It is clear that the material close to the lower side of tool-pin moves upward to the stirred zone, but the material under the stirred zone is not affected during the FSP.
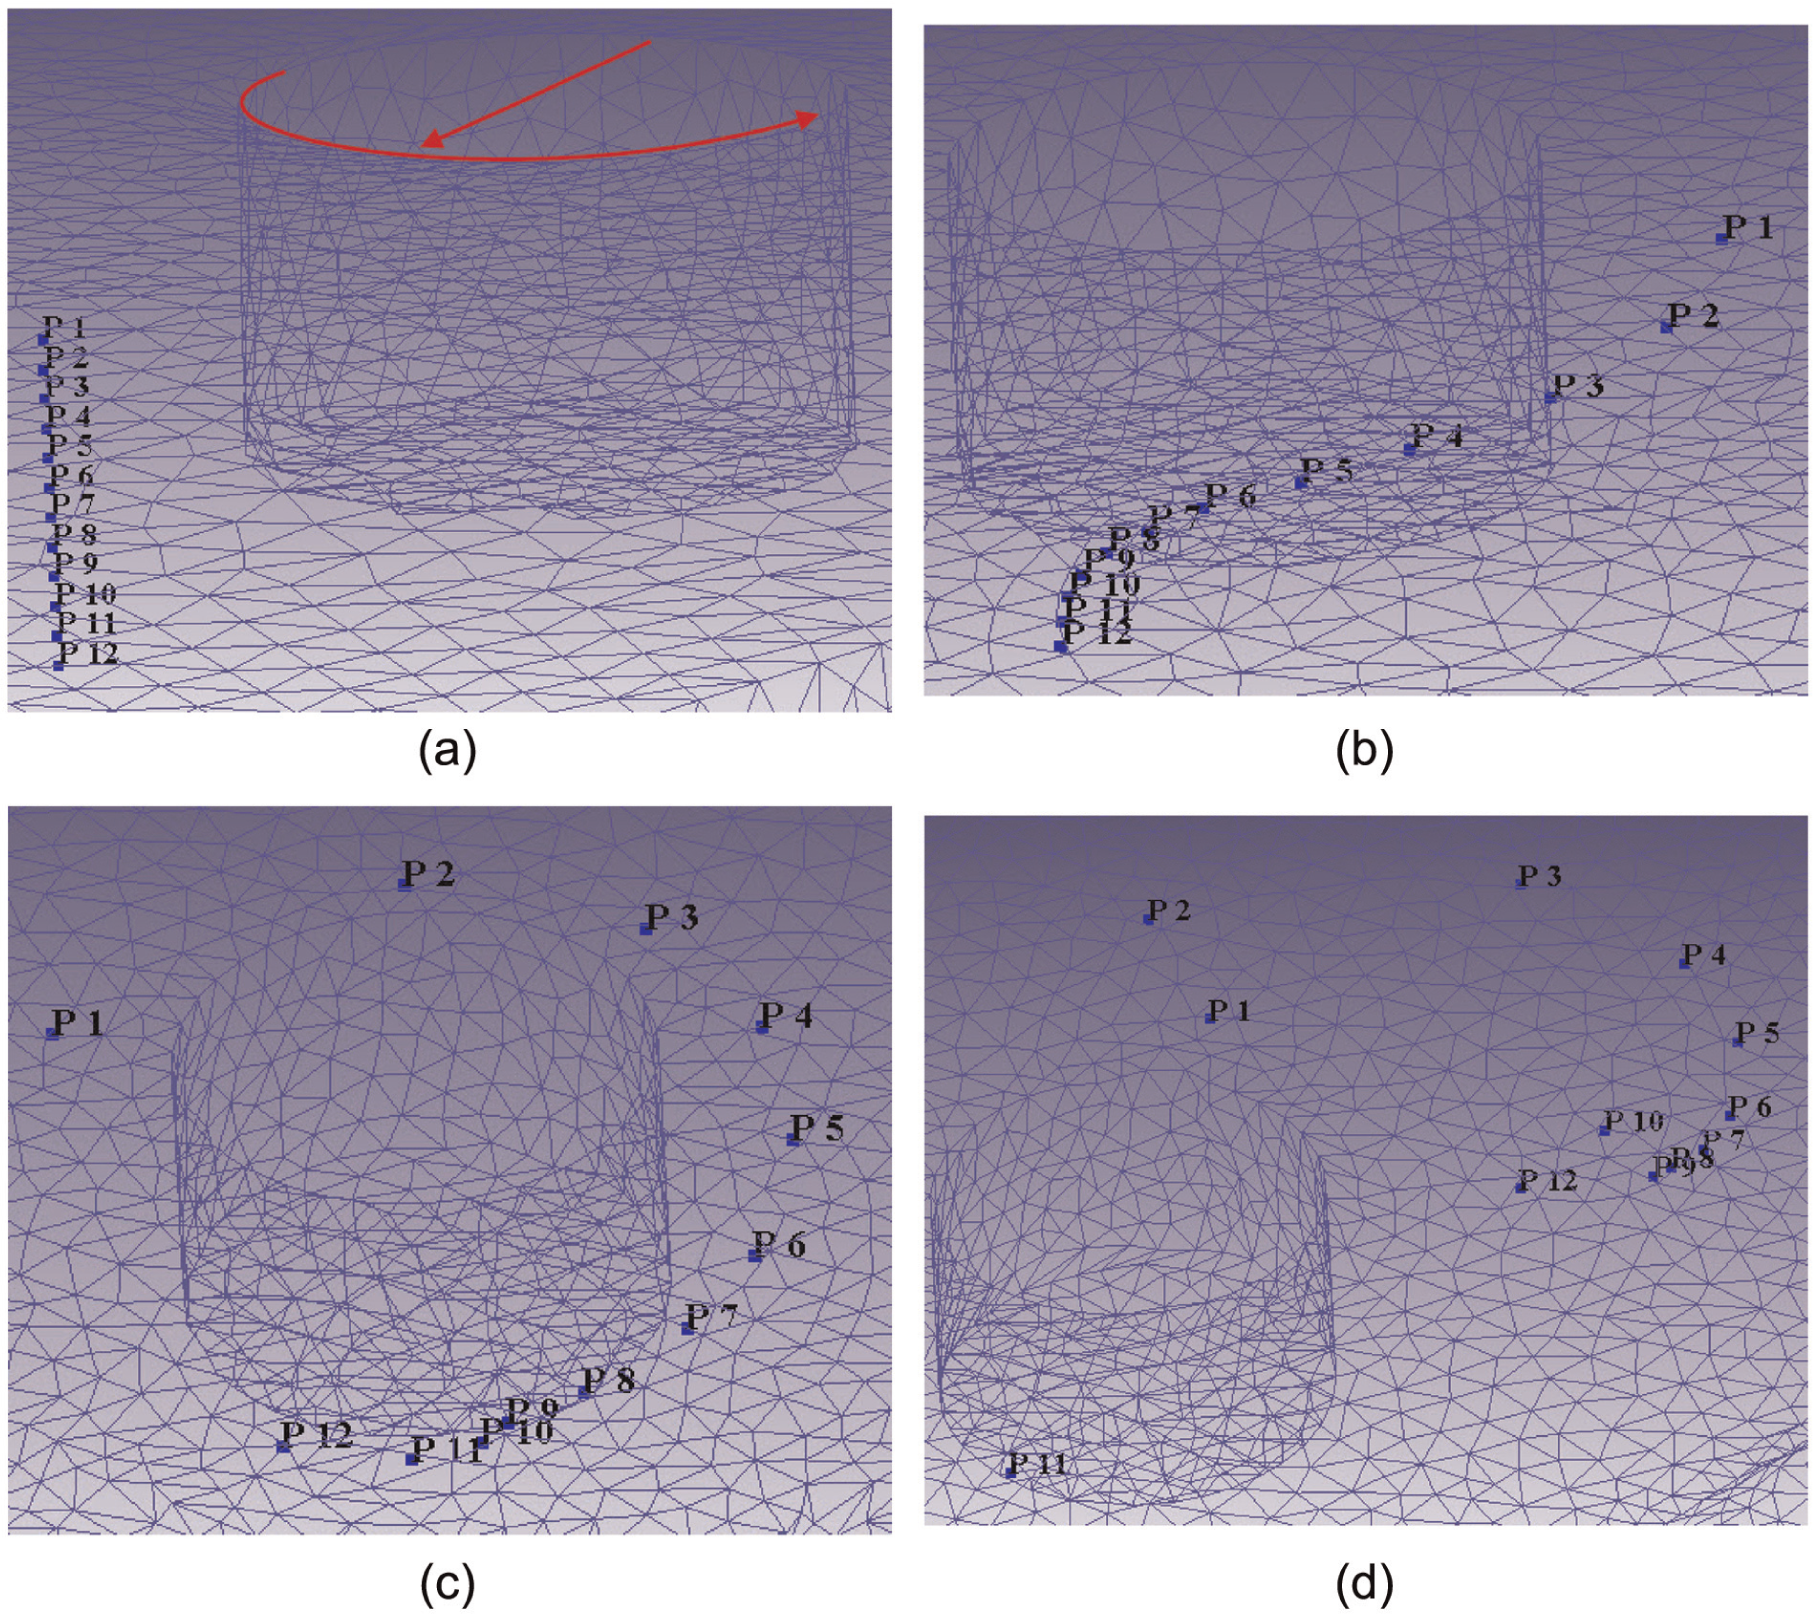
The schematic layout of point tracking during the FSP procedure. (a) beginning of tool traverse; (b) approaching the tool shoulder to the points; (c) approaching the tool pin to the points; (d) end of tool traverse.
Conclusion
This study investigated the FSP in dispersing the MWCNTs throughout the polymer matrix of PA 6 in order to fabricate surface nano-composite and predict the thermo-mechanical properties such as effective plastic strain distribution and material flow behavior together with temperature of PA 6 during the FSP using FE simulation. The following results were drawn from this study:
The SEM observation and XRD patterns indicate homogeneous and fine distribution of MWCNTs throughout the polymer matrix of PA 6. Also, the SEM observation indicates that the interwoven nano-tubes in the matrix are drawn in an approximately straight line and dispersed with a preferred orientation.
Straight and non-curved dispersion of MWCNTs increases their reinforcement capability and, thus, makes the experimental reinforcement results closer to those of theoretical one.
Comparing the result of simulation and experimental FSP refers to good agreement between simulation predictions and actual observations.
Temperature distribution study shows that the peak temperature appears at the interface of tool-shoulder/work-piece, and the temperature distribution on the interacted surface is asymmetric. Also, the more the distance from the center of the tool, the less the temperature at the stirred zone.
The analysis of effective plastic strain indicates that the material shearing of advancing side is higher than that of the retreating zone, and effective plastic strain of stirred zone decreases as distance from the center of tool increases.
The point tracing results accurately justify the vase-shaped cross-section of stirred zone.
Footnotes
Declaration of conflicting interests
The authors declare that there is no conflict of interest.
Funding
This research received no specific grant from any funding agency in the public, commercial, or not-for-profit sectors.