
Abstract
This work is aimed to develop a heat transfer model of friction stir welding process and subsequently to utilize the same for transient thermal analysis under differential influence of process parameters. The heat generation is assumed due to friction and plastic deformation at the tool–workpiece interface. A contact state variable is defined to estimate the amount of heat generation due to plastic deformation. The symmetric heat flux at the interfaces of flat tool shoulder surface, tool pin side, and bottom surfaces acts as heat input to the system by neglecting the effect of transverse tool speed. The heat generation from both the side and bottom surfaces of pin plays a significant role for the development of the temperature. Thermal history of friction stir welded AA1100 and AA6061 is estimated by developed numerical model and is compared with experimental results under similar welding conditions, thus validating the developed model. The experiments reveal that the temperature distributions are not symmetric with respect to welding line and maximum temperature occurs behind the tool pin. With the addition of heat generation due to plastic deformation, the heat transfer model precisely predicts the maximum temperature and time–temperature profiles at different welding conditions.
Keywords
Introduction
Friction stir welding (FSW) is one of the recently developed solid-state joining processes where similar or dissimilar materials such as aluminium, magnesium, and their alloys are joined by plasticization. 1 The process consists of a rotating tool that is plunged into two plates tightly abutted along a line and the line is traversed by the rotating tool. During the process, heat is generated by plastic deformation as well as by the friction between the tool and the workpiece. The workpieces are ultimately joined by the stirring action of the tool to soften the material with excellent combination of mechanical properties.2–4 This method is often preferred due to low residual stress, low energy input, and fine grain size compared to the conventional fusion welding processes. 5 Hence, the understanding of the heat transfer mechanism in the workpiece can be helpful to predict thermo-mechanical interactive phenomena, thermal history during the welding process, and the mechanical properties of the weld joint that finally evaluate the weld joint quality.
Several researchers have analysed the thermal aspects of FSW and concluded that the estimation of temperature profile intuitively depends on precise consideration of heat source model along with boundary interaction in terms of contact condition. 6 Chao et al. 7 have considered the heat generation between workpiece and tool shoulder surface and formulated the standard boundary value problem, which was solved by inverse approach minimizing the error between experimentally measured temperature profiles and numerically calculated frictional heat generation at the tool shoulder–workpiece interface. Chao and Qi 8 considered a constant heat flux from tool shoulder–workpiece interface and adjusted the flux in trial-and-error procedure until all the calculated temperature agrees well with experimental values. The similar strategy is utilized to simulate the transient temperature distribution, residual stress, and distortion of the FSW process considering the effect of heat generation from shoulder–workpiece interface due to friction and plastic deformation. 9 Gould and Feng 10 developed an analytical heat transfer model based on the well-known Rosenthal equation that describes a quasi-stationary temperature field over a semi-infinite plate due to a moving heat source by considering frictional heat on tool shoulder. Tang et al. 11 experimentally measured the heat transport at tool shoulder–workpiece interface and observed that temperature distribution was symmetric around weld centreline with maximum temperature range 80%–90% of the melting temperature. Bendzsak and colleagues12,13 applied the computational fluid dynamics (CFD) method in coupled heat transfer and material flow model by considering heat input from the tool shoulder surface only.
It is obvious that most of the mathematical models consider the heat input from tool shoulder only, whereas heat generation at the tool pin–workpiece interface is rarely considered. Colegrove et al. 14 showed that 20% of the total heat was attributed to the pin through the developed heat transfer model, although the addition of heat due to tool pin had little effect on temperature profile. Russell and Sheercliff 15 investigated the effect of tool shoulder and pin geometry on heat input during FSW and used the Rosenthal equation for a uniformly moving point heat source to describe the effect of pin geometry on heat generation. Maalekian et al. 16 conducted thermal analysis of friction welding process using various heat generation models that were based on different friction mechanisms at the tool shoulder–workpiece interface. The inverse heat conduction approach predicted the heat generation rate accurately, whereas the constant friction coefficient approach produced the most inaccurate temperature profile. Frigaard et al.17,18 reported the functional relationship between the generated heat and various FSW parameters. The heat input was proportional to the third power of the shoulder diameter. However, the contact area between the shoulder and the material surface has a significant effect on the heat input. Henceforth, a non-uniform heat generation due to friction was considered during welding. Dong et al. 19 carried out a coupled thermo-mechanical analysis of the FSW process using a simplified two-dimensional axisymmetric heat transfer model. Song and Kovacevic20,21 used a moving heat source model during FSW, and the heat generation at the tool shoulder–workpiece interface was considered as sliding contact frictional heat. Schmidt et al. 22 considered surface heat flux model to characterize the heat transfer mechanism by the contact conditions at the tool–workpiece interface and described it was sliding, sticking, or partial sliding/sticking condition.
The literature review reveals the information that there are two sources of heat generation for FSW process. The heat is generated by friction between the tool and workpiece and plastic deformation away from the tool–workpiece interface. The frictional heat is dissipated over the contact surface, whereas heat generation due to viscous dissipation is distributed over volume.23,24 The tool–workpiece interface can be further subdivided into shoulder–workpiece and tool pin–workpiece interfaces. In most of the mathematical models,7–10,19–21,25,26 the heat generation from the tool pin is neglected. The heat generation between tool–workpiece interfaces is greatly influenced by frictional heat, but the effect of heat generation due to plastic deformation is rarely considered since the volumetric heat generation accounts only ∼5% of total heat generation. 25 Moreover, the difference in temperature distribution between advancing and retreating sides due to non-symmetric heat flux distribution is rarely observed in the literatures. There is lack of considerable information about the simplified shape of moving heat source during numerical study of heat transfer in FSW process.
In this work, a comprehensive finite element–based three-dimensional (3D) heat transfer model is developed to predict transient temperature distribution in AA1100 and AA6061 materials that are welded by FSW process. The model considers temperature-dependent material properties. A dedicated heat source model using sliding and sticking conditions of friction is incorporated through user subroutine of commercially available software ABAQUS. However, the volumetric heat generation due to plastic deformation is neglected here. The frictional heat flux from all the surfaces of tool pin is included in this modelling approach to enhance the reliability of the numerical model. An indigenous experimental set-up is also developed to study the heat transfer aspect of FSW process. The numerical model is utilized to validate the experimentally extracted temperature data and weld macrographs. The model is then used to investigate the effects of various process parameters on temperature distribution of the weld joint.
Theoretical background
Figure 1 describes the schematic layout of FSW process that is divided into five stages: tool plunge-in period, initial dwell, weld period, final dwell, and tool plunge-out period. The temperature-dependent thermal properties, convection, and radiation on the surfaces open to atmosphere are considered in this analysis. The workpiece material is considered to be isotropic and homogeneous. No melting occurs during the welding process. The thermal boundary conditions are symmetrical across the weld centreline. The numerical model calculates the transient temperature fields within the solution geometry when rotating tool advances in a specified direction.
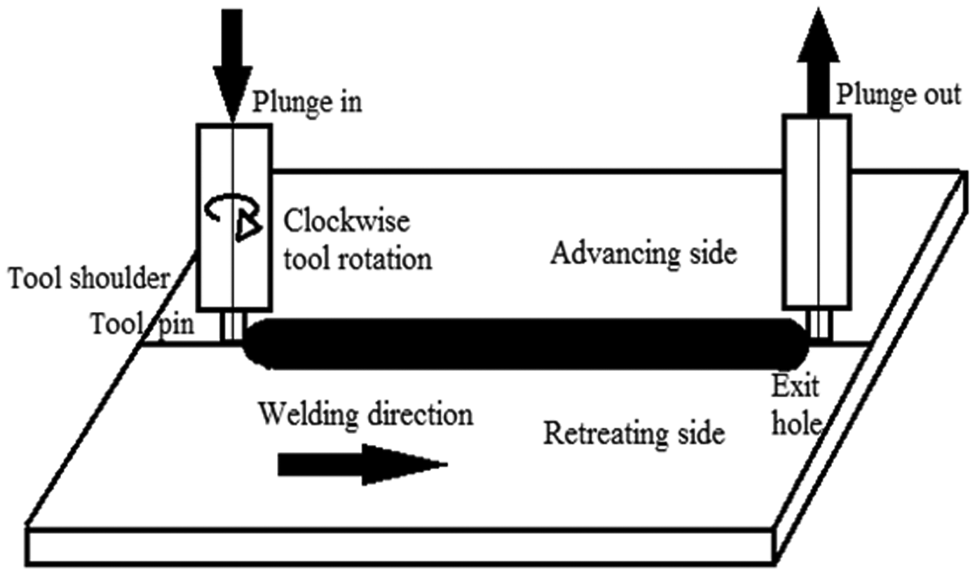
Schematic representation of friction stir welding.
Heat generation in FSW is considered by two mechanisms. One is due to friction and the other is due to plastic deformation where heat is transferred into the workpiece following the Fourier’s law of heat conduction. The transient temperature field in spatial coordinates (x, y, z) is estimated by solving 3D nonlinear heat transfer equation in which the tool moves along positive y-direction. The governing equation is written as
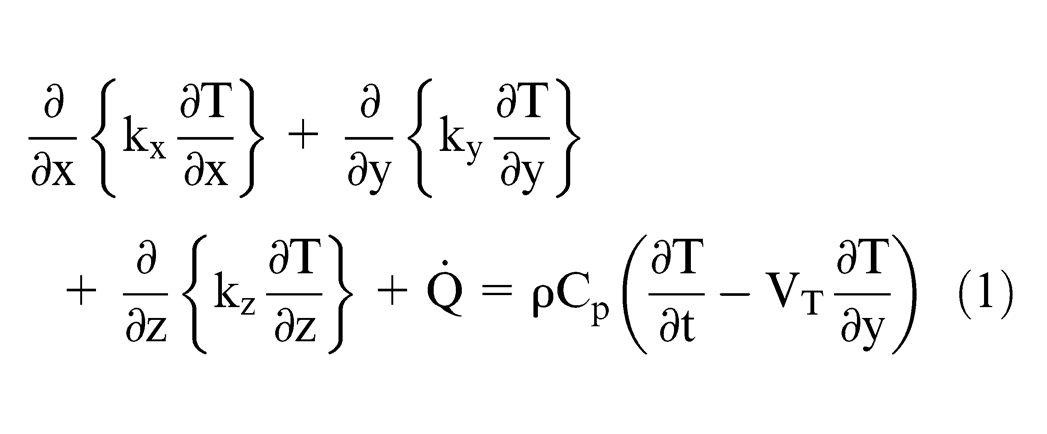
where ρ, Cp, and k refer to density, specific heat, and thermal conductivity, respectively, of the workpiece material;
Boundary condition for thermal model is specified through surface interaction of the solution domain and is schematically represented by Figure 2. The initial condition is expressed as

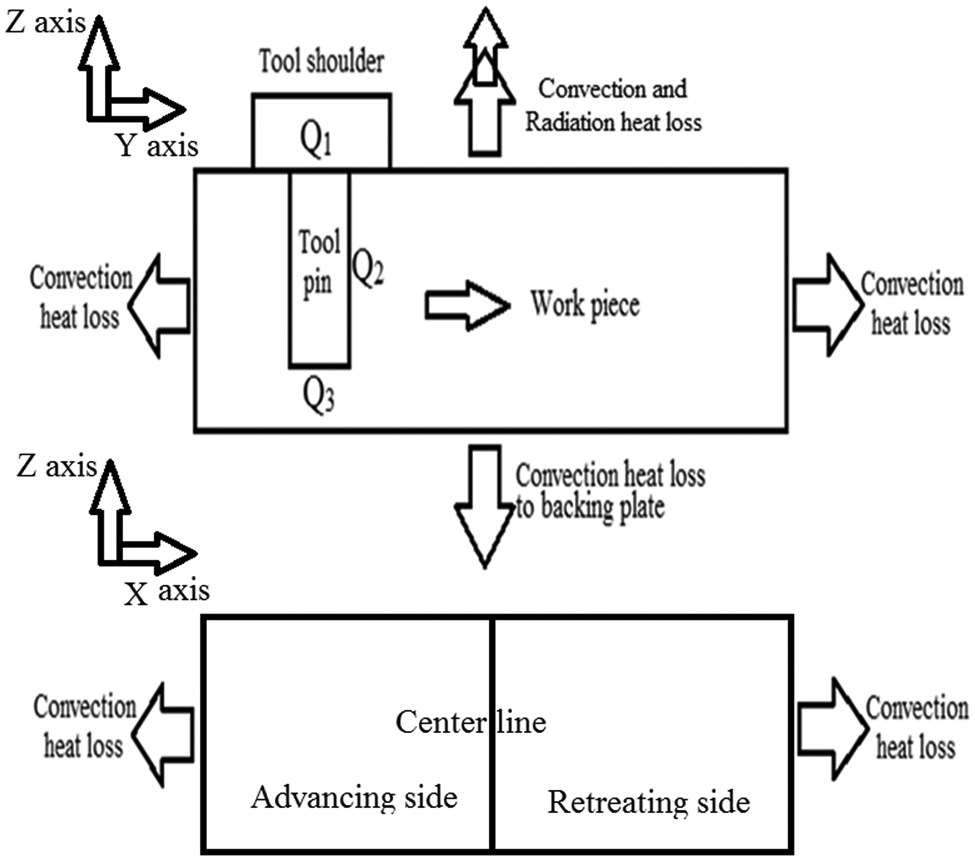
Schematic illustration of thermal boundary condition used in the model.
where Ti is the ambient temperature at time t = 0. There is convection and radiation heat loss from the top surface, and all other surfaces are subjected to convection heat loss. Mathematically, the boundary condition is expressed as
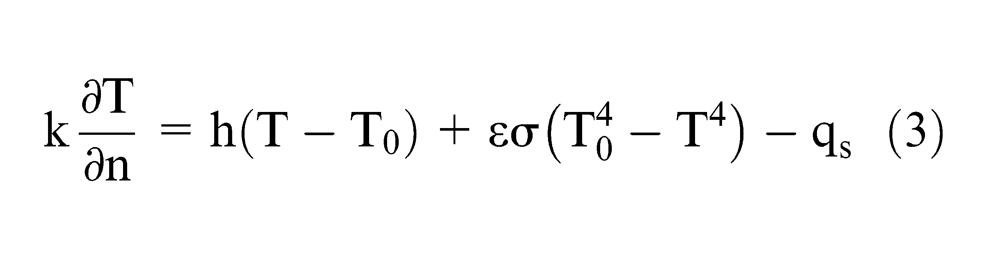
where n is the normal direction vector of boundary, h is the convection coefficient, qs is the heat flux between the tool and the workpiece, ε is the emissivity, and σ is the Stefan–Boltzmann constant. The second term of right-hand side in equation (3) indicates the radiation heat loss.
Heat generation model
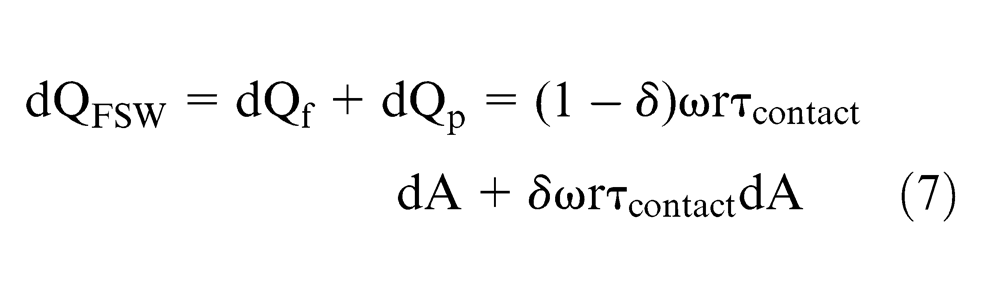
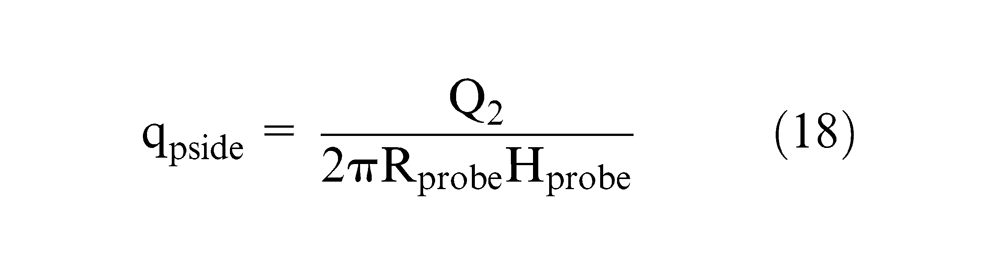
The heat generation during welding process is due to mechanical work introduced by the tool. It is characterized by the contact conditions at the interface and is described as sliding, sticking, or partial sliding/sticking conditions. 27 The contact condition under the shoulder can be described by sliding friction, using a friction coefficient μ and interfacial pressure p or sticking friction based on the interfacial shear strength at an appropriate temperature and strain rate. In this work, the total heat generated by the tool is assumed due to both sliding and sticking friction models. The heat generated at the interface of tool and workpiece due to friction is Qf and due to plastic deformation Qp. Therefore, the frictional heat on an elemental area dA at the tool–workpiece interface is expressed as 22
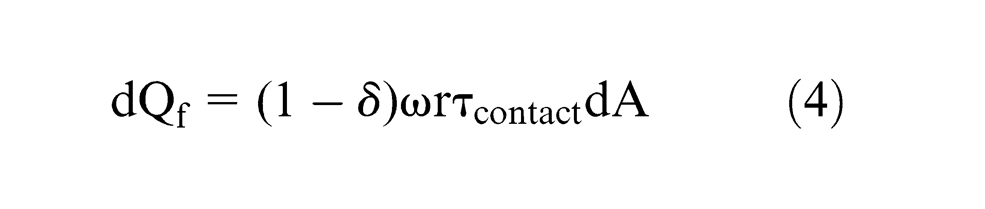
where δ is a contact state variable, which relates the velocity of the contact workpiece surface with the velocity of the tool surface. The contact state variable is assumed to change linearly with the distance from the centre of the pin and is expressed as
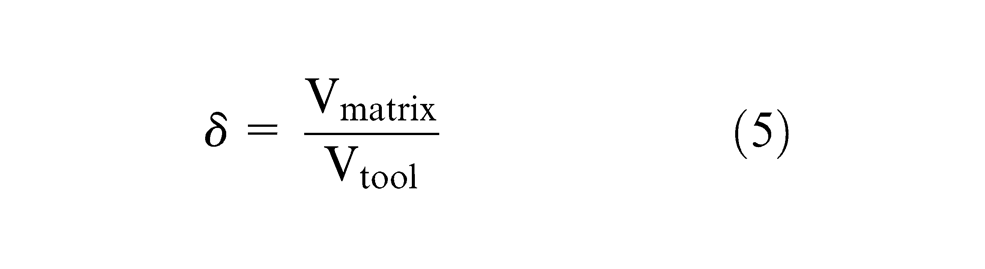
where
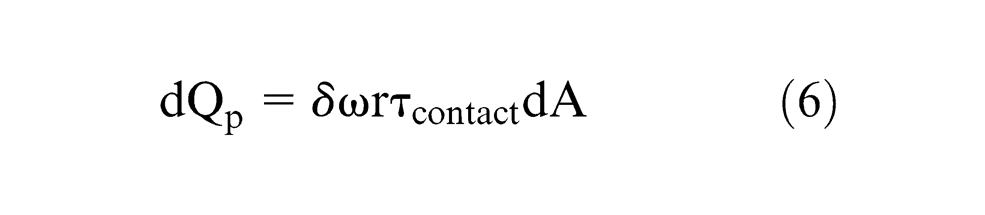
Therefore, total elemental heat due to friction and plastic deformation is given by
For sliding friction, the contact shear stress is

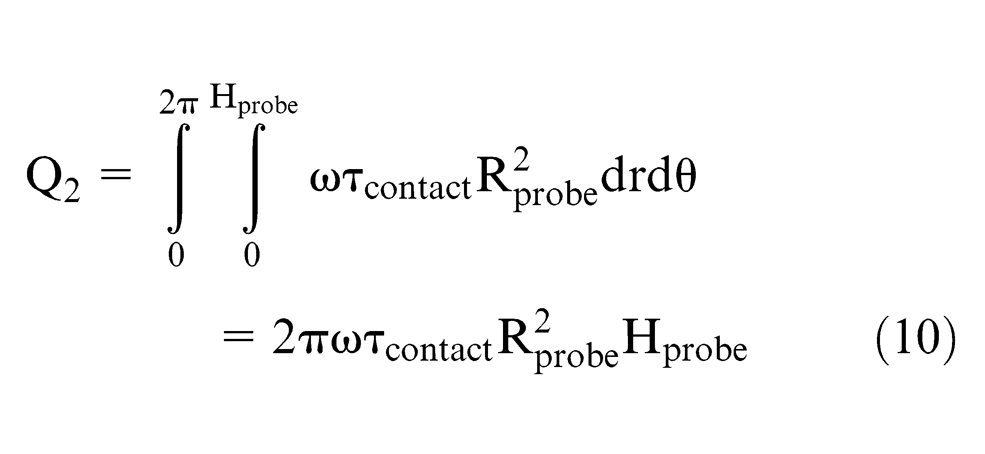
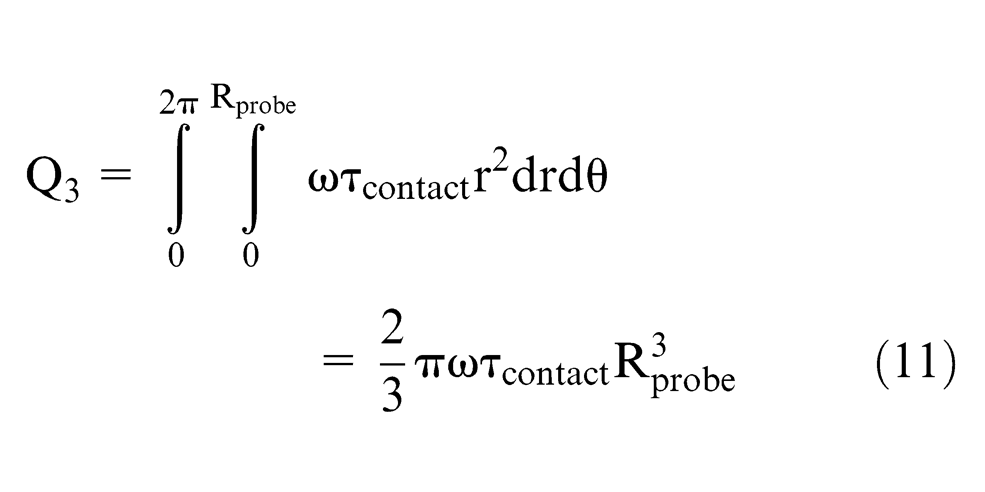
The heat energy generated at the contact interface between a rotating FSW tool and a stationary workpiece is subdivided into Q1, Q2, and Q3, that is, on the tool shoulder’s surface, tool pin’s side surface, and tool pin’s tip surface, respectively. The analytical estimation of heat generation from the flat shoulder is expressed as
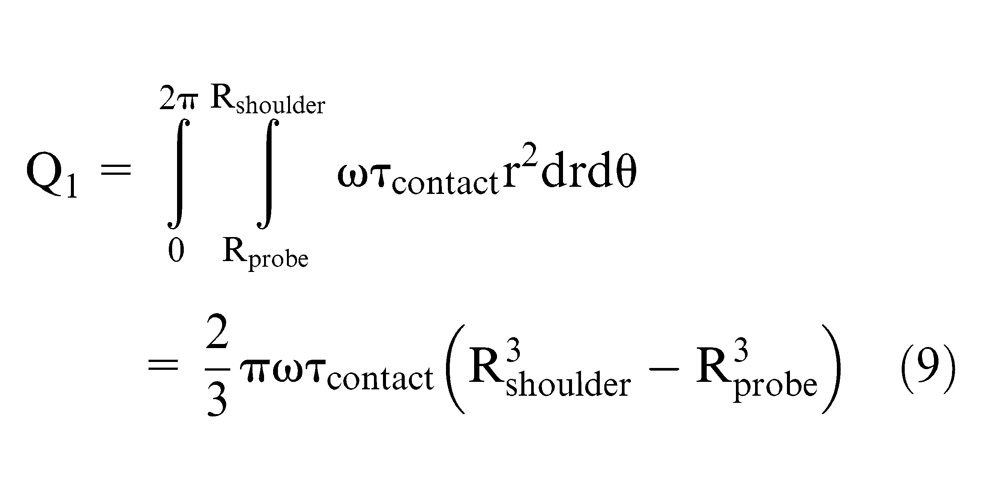
Heat generation from the probes is expressed as
Therefore, the heat generation due to sticking condition with flat shoulder is expressed as
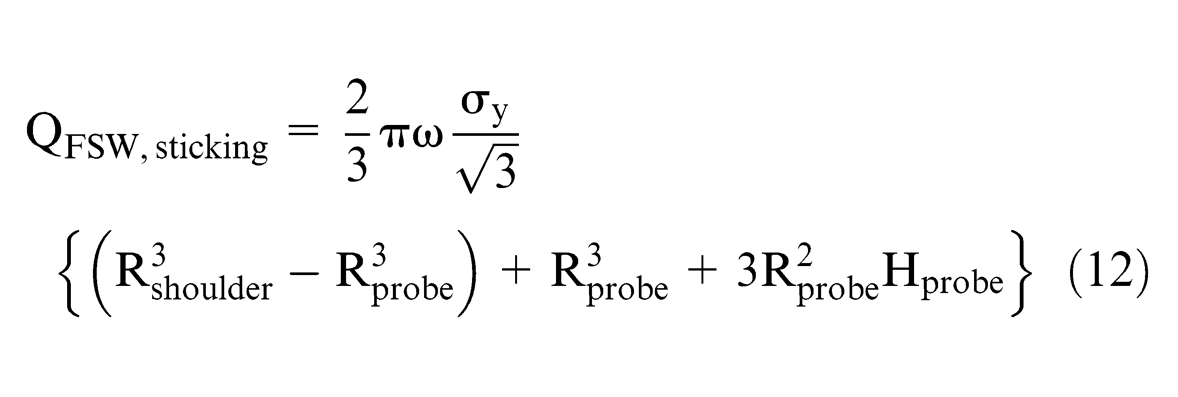
For the sliding condition, the heat generation is given by
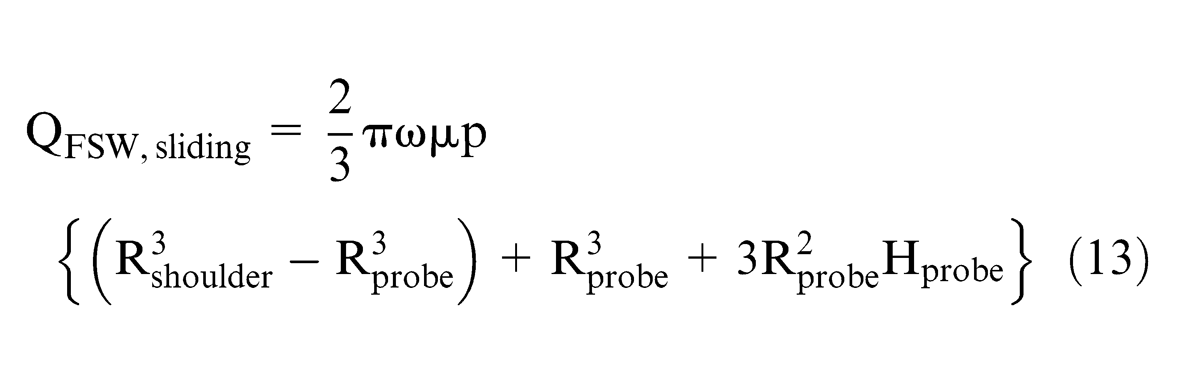
Therefore, the total heat generation due to sliding and sticking is expressed as
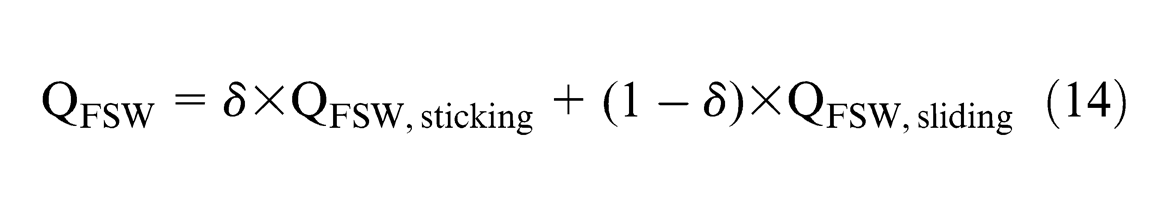
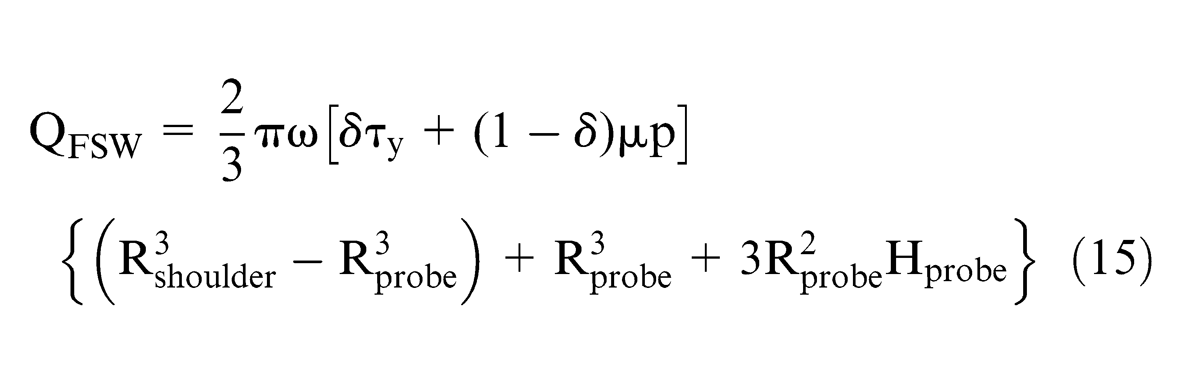
For a flat shoulder and straight cylindrical tool, the total heat generation is a linear combination of sliding and sticking condition and is expressed as
There is no straightforward mechanism to estimate the extent of slip (δ). In this case, the contact state variable is calculated by imperial relationship. The extent of slip is estimated by fitting the measured values at various relative velocities 25 and is expressed as
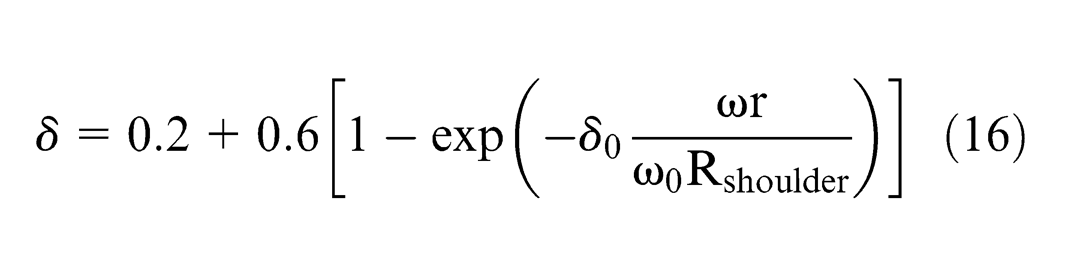
where δ0 is an adjustable parameter, r the distance of the point from tool axis, ω the angular velocity of the tool, and ω0 the normalizing rotational velocity, which can be taken as the mid-point of the range of rotational speeds. In this case, δ0 is considered as 1.014 26 and other parameters are varied with welding conditions.
The plunging force applied to the plate surface by the tool creates a uniform pressure over the shoulder surface. It is assumed that the distribution of heat flux over the tool shoulder surface varies linearly and in the tool pin surface it varies uniformly. Hence, the surface heat fluxes are expressed as


where
Computational methodology
The thermal simulation of the FSW process is performed using commercial software ABAQUS. The solution domain of the model is assumed as rectangular plate. The plunging depth of the tool shoulder is 0.1 mm. The shoulder is flat and perpendicular to the workpiece. The natural convective heat transfer is considered for the top and side surfaces of the workpiece. 28 However, the higher convective heat transfer coefficient is used for the bottom surface, which is equivalent to the surface film conductance between the workpiece and the backing plate. 29
The procedure of physical modelling is adopted according to the actual experiment where the numerical solution returns the temperature profile in temporal and special domains. FSW process is divided into five time instants as depicted in Figure 1: plunge time, initial dwell time, welding time, final dwell, and plunge-out time. In this simulation, 15 s is the initial dwell period for preheating the sample that makes it easy to weld and 5 s is the final dwell period to facilitate easy removal of the tool from the workpiece. However, total simulation runs for 250 s that includes the cooling period after finishing the weld. In this analysis, the workpiece is meshed using eight-noded brick element of type DCC3D8. The temperature is considered as single degree of freedom at each node with fine meshing in the weld zone. The in-house developed heat source model is interacted with ‘DFLUX’ user subroutine of the software. The plunge-in velocity of the tool (∼0.12 mm/s) and plunge-out velocity (∼1.16 mm/s) are considered in this simulation. The temperature-dependent thermal properties of the aluminium alloy are incorporated in the analysis that makes the analysis nonlinear in nature. 30
Experimental investigation
In this study, the experiments are carried out to test and validate the developed numerical model in terms of estimated thermal history of FSW process on aluminium alloy. A vertical milling machine with 7.5 hp motor capacity is used to perform experiment as described in Figure 3. The tool is mounted in the vertical arbour using suitable collate. The edges of the test pieces are machined to obtain a neat square butt. They are clamped to the horizontal bed with zero root opening. The butt line is aligned with the centreline of the FSW tool. The clamping of the test pieces is done such that the movement of the plates is totally restricted under both plunging and translational forces of the FSW tool. The tool rotational speed (r/min) and translational speed of the bed are set prior to each welding. After plunging the rotating tool at the interface of the two plates and visually ensuring full contact of the tool shoulder with the plate surface, the horizontal movement of the bed is turned on. The tool is made of SS304 with the shoulder and pin diameters of 20 and 6 mm, respectively. The welding tool is kept perpendicular to the plate. The shoulder has a flat profile. The pin length is slightly less than the thickness of the workpiece and is 5.75 mm for AA1100. The chemical composition of the aluminium alloy is depicted elsewhere. 30 The melting temperature of AA1100 is considered as 660 °C. The experimental conditions are described in Table 1.
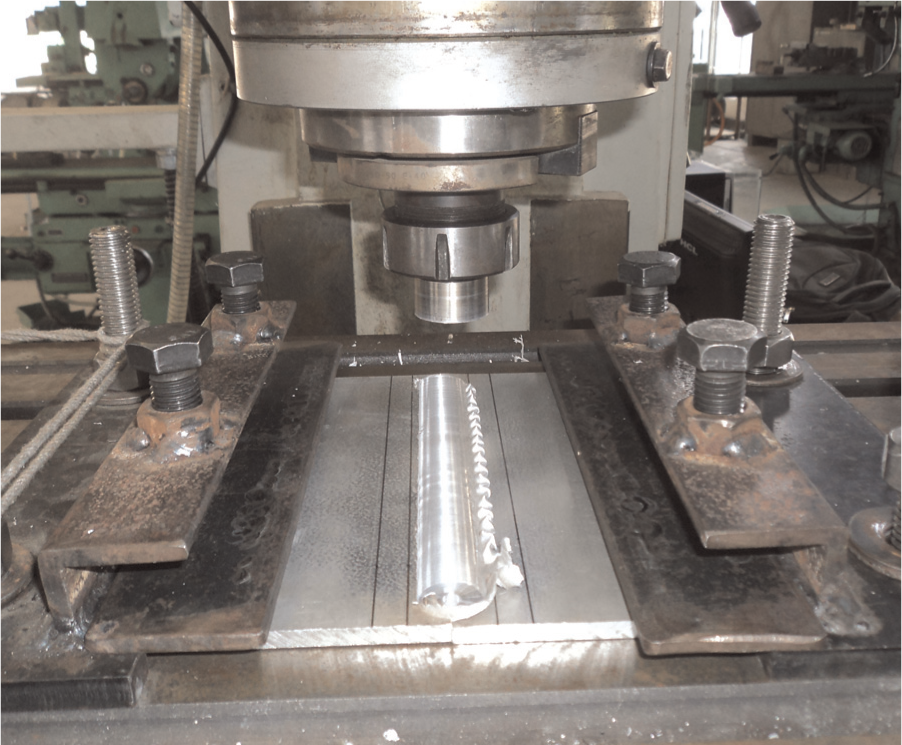
Experimental set-up of FSW.
FSW process parameters for AA1100.
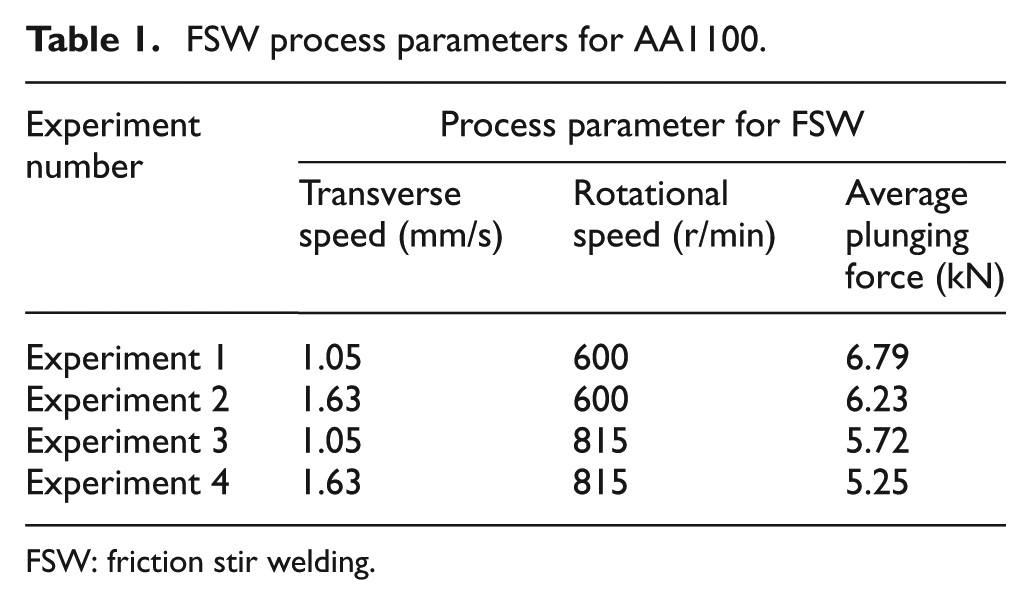
FSW: friction stir welding.
Figure 4 describes the location of thermocouples placed at eight different points on the top surface of workpiece. The K-type thermocouples are located at 13, 18, 23, and 28 mm away from the weld seam line, respectively. All the temperature measurements are made in a group of four on the advancing side and other group on the retreating side of weld. For measurement of tool plunging force, a fixture with four strain gauges at four hexagonal supporting member of backing plate is used, which convert force into corresponding voltage. This voltage is measured by data acquisition system with amplifier and multiplies it with calculated factor. Two test samples of 200 mm long, 100 mm wide, and 6 mm thick AA1100 are butt welded by FSW process.
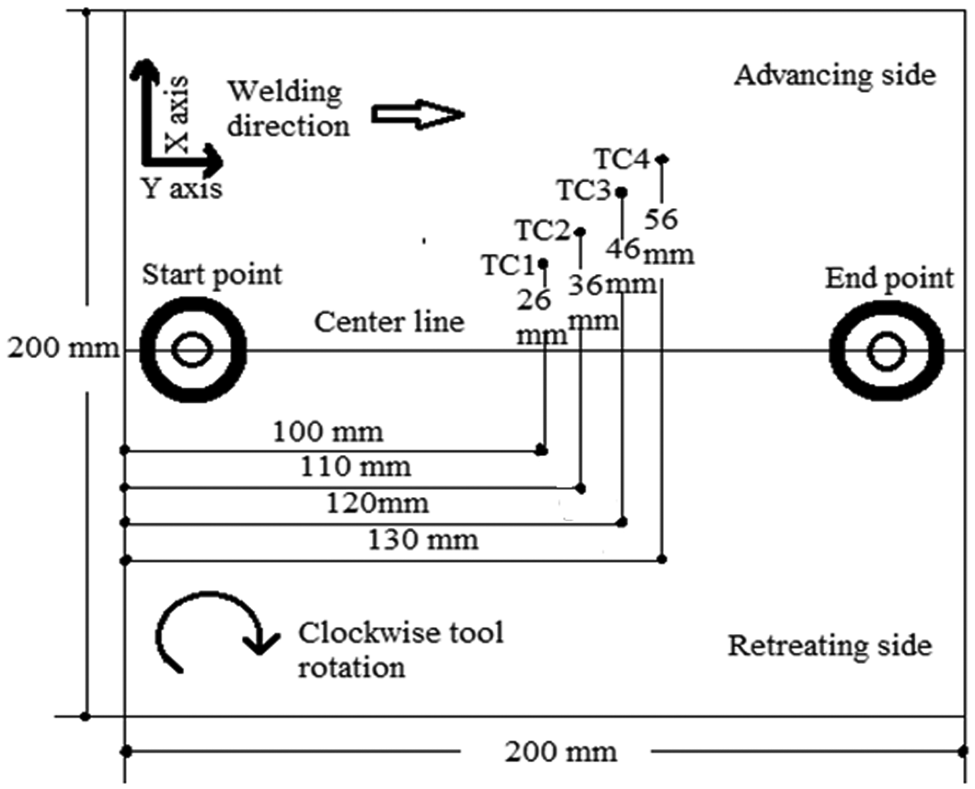
Locations of thermocouples in FSW experiments corresponding to Table 1.
Results and discussions
The numerical model is developed to simulate the process in terms of temperature distribution within the solution domain and the results are compared with two different FSW experiments on AA1100 and AA6061-T6.
Validation of numerical model with experimental results
The numerical model is first validated with in-house developed experimental results. Four experiments are carried out to measure temperature history during joining of AA1100. The experimental conditions are reported in Table 1.
The transient temperature is recorded from the thermocouple points corresponding to Experiments 1, 3, and 4 of Table 1. The time–temperature history of advancing and retreating sides is depicted in Figures 5–7. The temperature profile of each thermocouple point corresponding to the welding time relates the displacement of the tool from the starting point. The maximum values of the temperature on advancing and retreating sides are depicted in Table 2. Since the thermocouple TC1 is closest to the joint line, its peak temperature is higher than that of the others. It is also obvious from Figures 5–7 that there is delay to reach peak temperature away from the centreline and the similar trend is observed for all cases due to the location of thermocouple points. So the contemplation from all experimental data indicates that in a defect free welding, the peak temperature is ∼324.4 °C–370.1 °C at 3 mm away from shoulder edge for thermocouple point TC1. It is also obvious that the temperature on the advancing side at all four locations is higher than the retreating side, although the temperature is measured in similar points. As the tool moves away from the centreline, the temperature difference is reduced and reaches equilibrium at certain distance due to similar rate of heat diffusion. This temperature difference is the cause of asymmetric heat generation and flow of plasticized material owing to difference in relative velocity between advancing and retreating sides. However, the temperature in advancing side close to the weld centreline is higher than that of the retreating side.
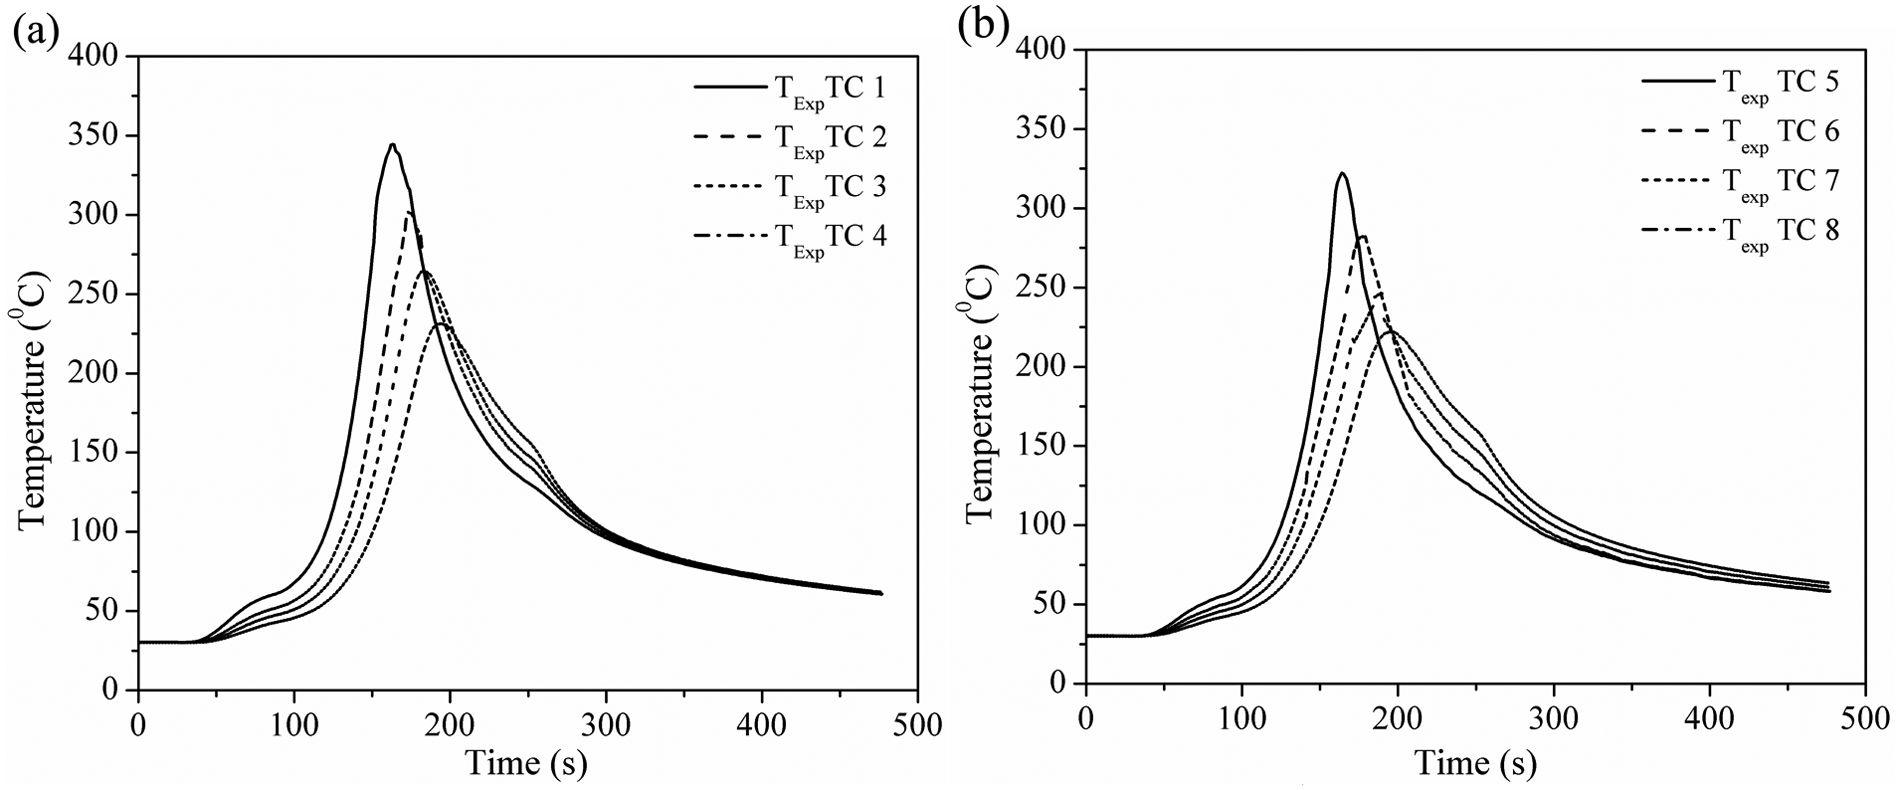
Thermal history of Experiment 1 in Table 1: (a) advancing side and (b) retreating side for AA1100.
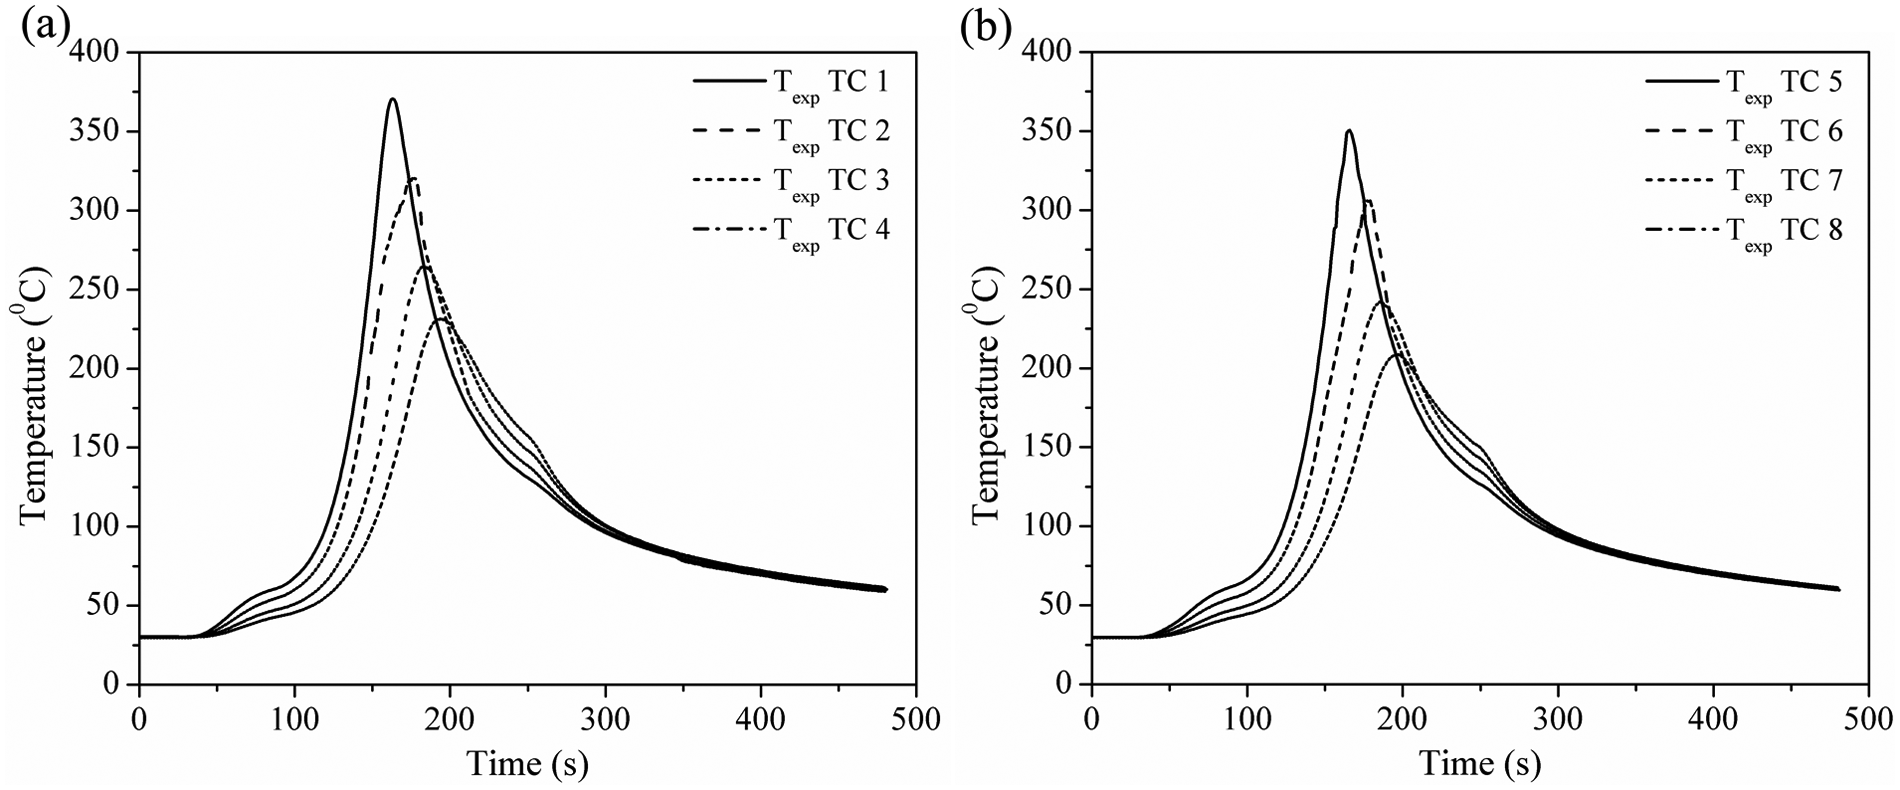
Thermal history of Experiment 3 in Table 1: (a) advancing side and (b) retreating side for AA1100.
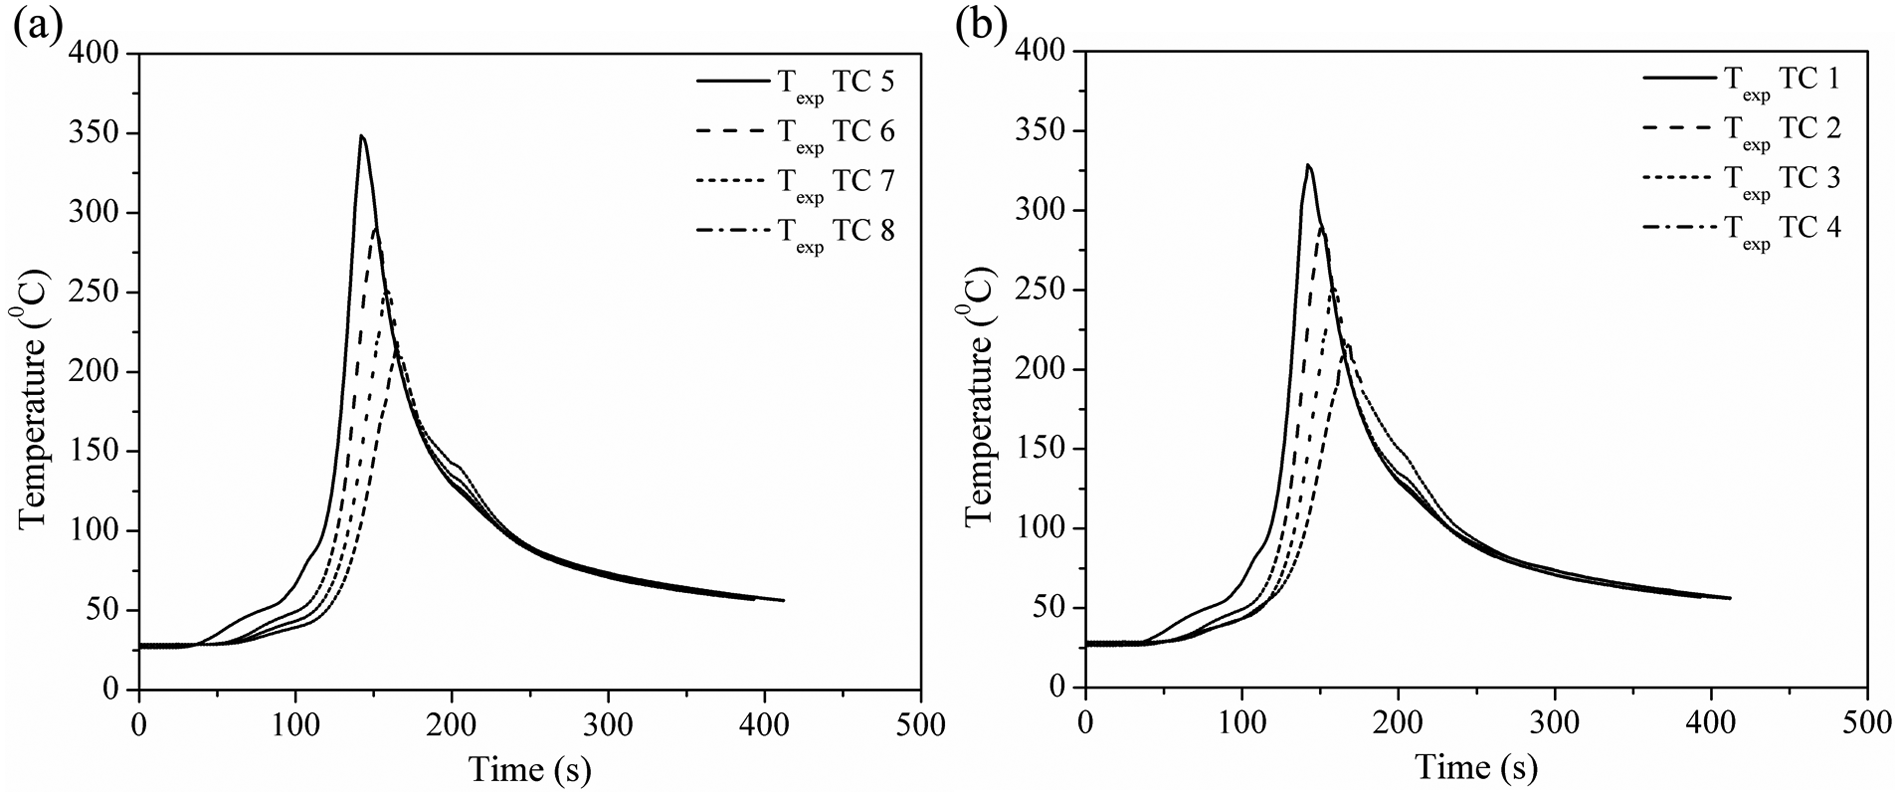
Thermal history of Experiment 4 in Table 1: (a) advancing side and (b) retreating side for AA1100.
Maximum temperatures at different thermocouple points corresponding to experimental conditions of Table 1.
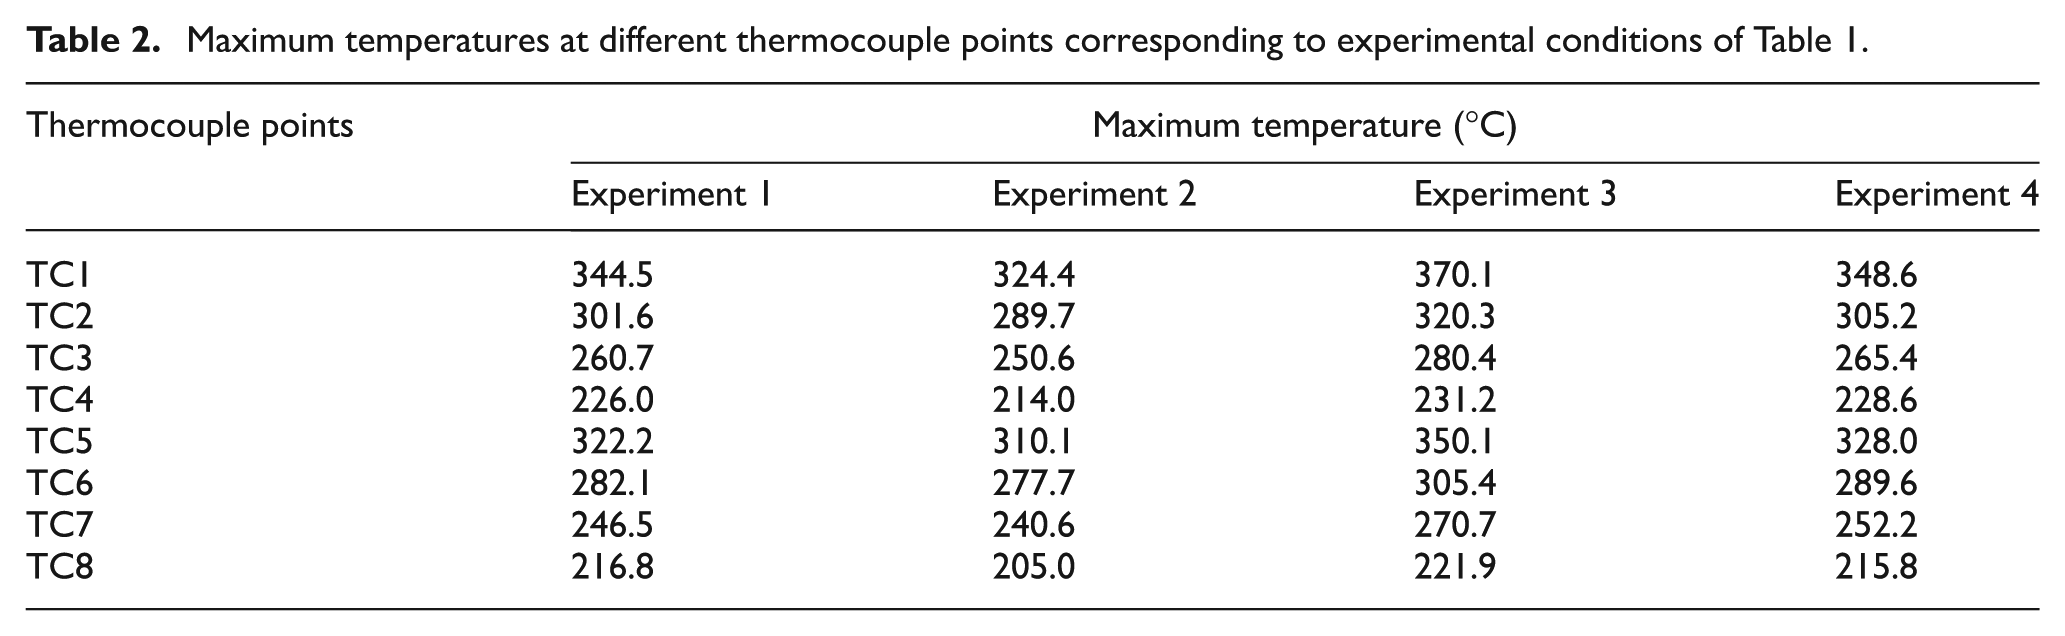
Figure 8 depicts the comparison of peak temperature between advancing and retreating sides for all experimental conditions of Table 1. The right axis of Figure 8 indicates the percentage of melting point temperature for aluminium alloy, which is defined with reference to maximum peak temperature of a thermocouple point. The melting point of aluminium alloy is considered as 660 °C. 30 The percentage of melting point at different locations varies between 52.2% and 56.1%. In FSW, the maximum temperature is decided by combined factor of welding speed, rotational speed, and plunging force during welding. It is obvious that as tool rotational speed increases, heat generation rate increases whereas increase in welding speed promotes the decrease in heat generation rate and these phenomena are obvious by the nature of the peak temperature depicted in Figure 8.
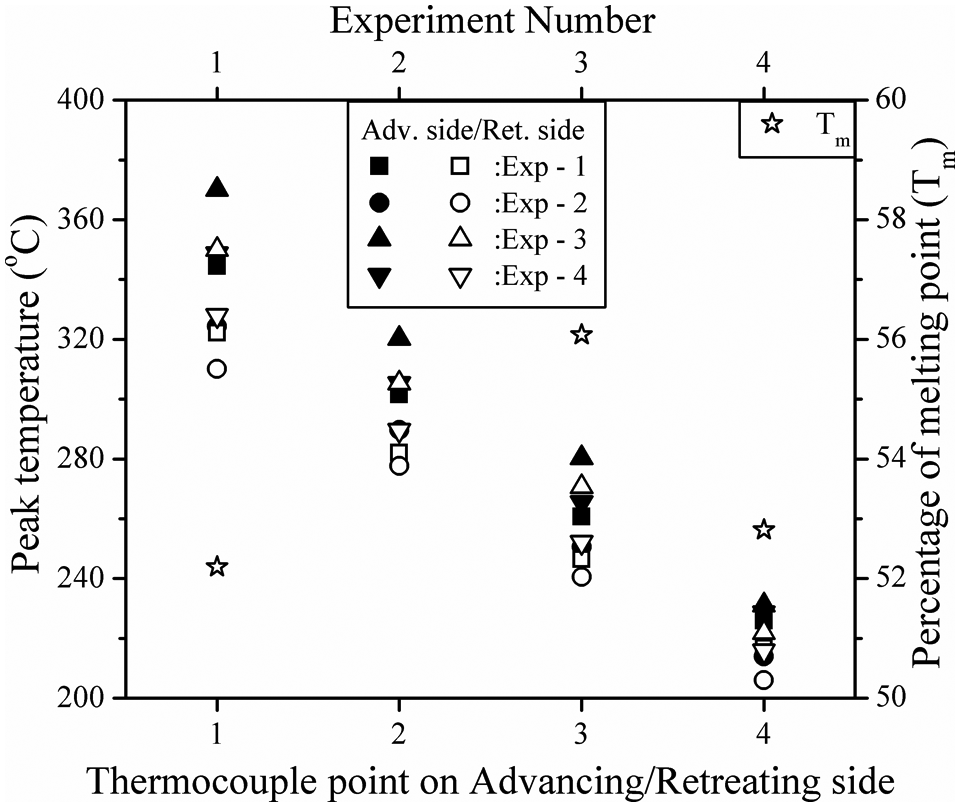
Comparison of peak temperature of four experimental conditions at four points in advancing side and four points in retreating side for AA1100.
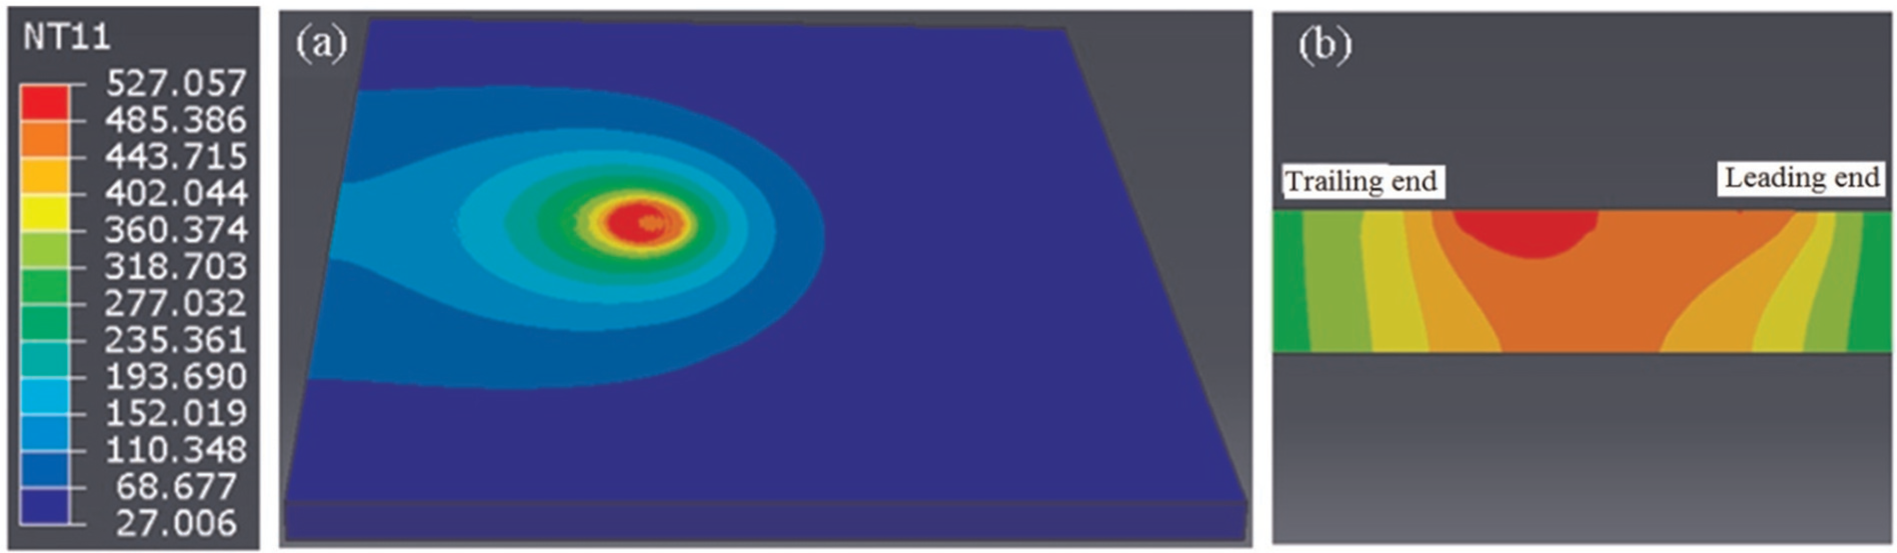
In this work, a 3D transient thermal simulation is performed using symmetric heat source profile corresponding to process parameters of Experiment 2 of Table 1. Temperature-dependent thermal properties and coefficient of friction of AA1100 are considered for the analysis. 30 The temperature profiles at points TC1, TC2, TC3, and TC4 in advancing side of welding joint are used to validate the numerical model. Figure 9(a) describes 3D temperature distribution when the rotating tool moves with axial speed of 1.63 mm/s. The amount of generated heat is assumed as direct merchandize product of tool rotation along with sliding and sticking of the material. The simulated result of Figure 9(b) shows that the temperature distributions are not symmetric around the welding line and the maximum temperature occurs behind the tool pin. This temperature difference arises due to plastic deformation and material flow around the rotating tool, which moves from advancing side to retreating side with additional heat due to friction and produces higher temperature behind the tool pin. At the same time, the highest temperature is always found in the workpiece material right below the tool shoulder and the temperature progressively decreases from this region as a function of the distance in the radial and through-thickness directions.
Temperature distribution of Experiment 2 in Table 1 during simulation: (a) isometric view and (b) cross-sectional view for AA1100.
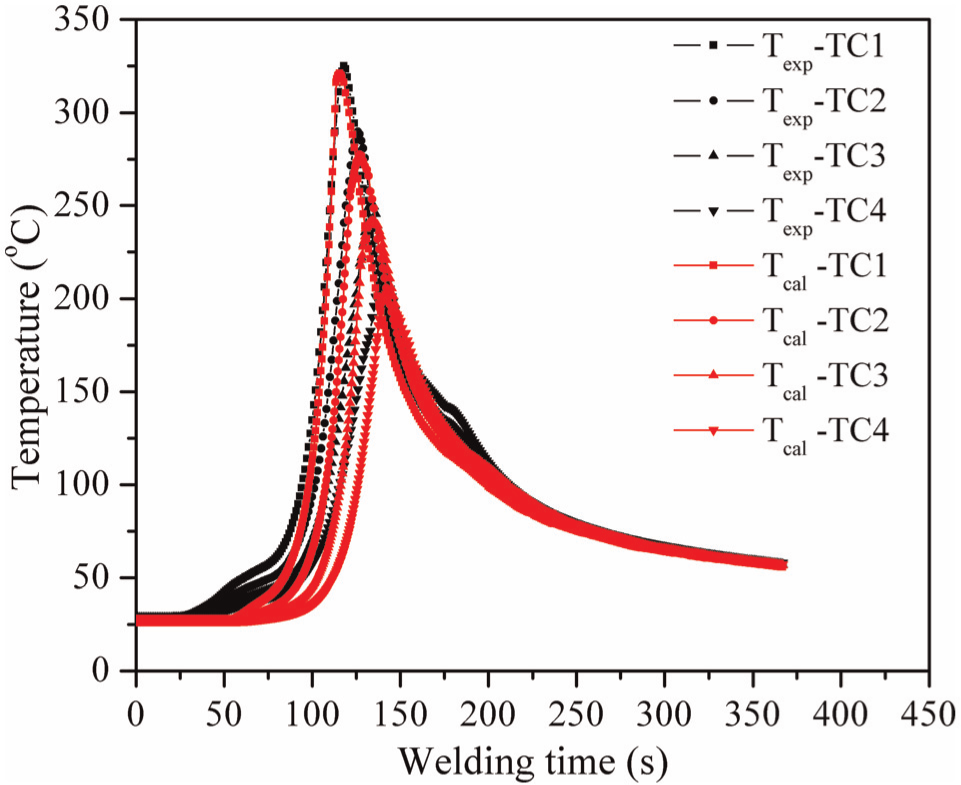
The comparison between estimated time–temperature profiles using numerical model and Experiment 2 (Table 1) is depicted in Figure 10. This comparison corresponds to the welding condition of 1.63 mm/s transverse speed and 600 r/min rotational speed of the tool. It is observed that the calculated and measured thermal histories for all thermocouple locations of advancing side of the weld show decent equivalent result, although the advancing side underestimates and the retreating side overestimates the temperature profile due to symmetric nature of heat source assumption. The depicted result in Figure 10 also indicates that the calculated and measured temperature profile is of similar nature and the maximum temperatures are well agreed with experimental values. Additionally, it can be concluded that the use of a moving heat source technique with symmetric heat source is proved to be a reliable method to simulate temperature profile of FSW process.
Comparison between experimental and calculated time–temperature profiles on the advancing side of Experiment 2 in Table 1 for AA1100.
Figure 11 shows the calculated isotherms to define welding zone and the comparison with experimentally obtained microstructure morphology. Weld zone is demonstrated as stirred zone where the grains are roughly equiaxed within the peak temperature range of ∼527 °C–485 °C and often an order of magnitude smaller than the grain size of parent material. In thermo-mechanical-affected region, the grains are little coarser within the peak temperature range of ∼485 °C–443 °C. The heat-affected zone (HAZ) is experienced with peak temperature range of 390 °C–207 °C. It is obvious that the temperature isotherm provides useful information about various microstructural zones and the estimated cooling rate of various weld zones can be linked with probable microstructures.
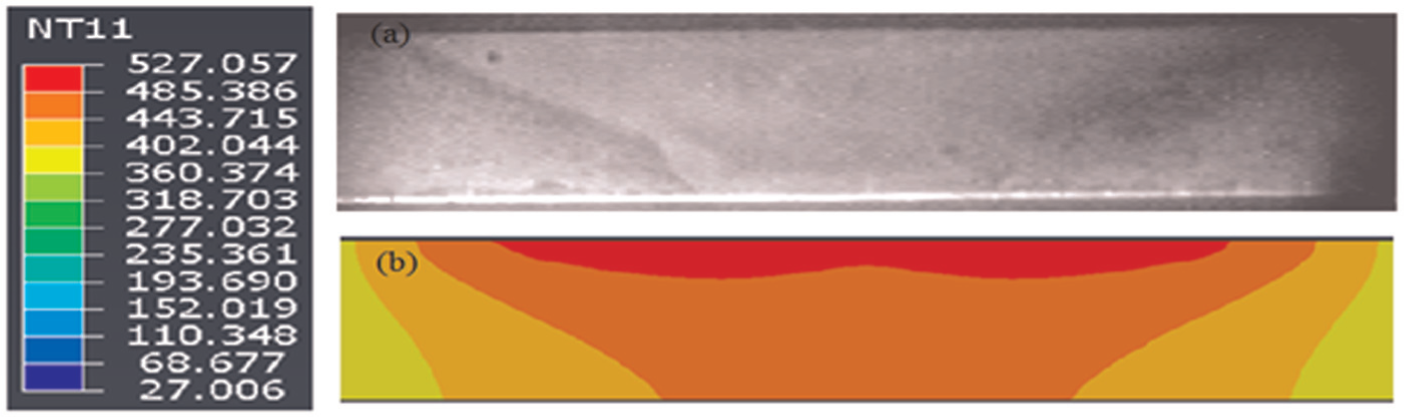
Comparison of experimental and simulation weld zones for Experiment 1 in Table 2: (a) experimentally measured macrograph and (b) simulated isothermal temperature profile of AA1100.
Validation of numerical model with literature results
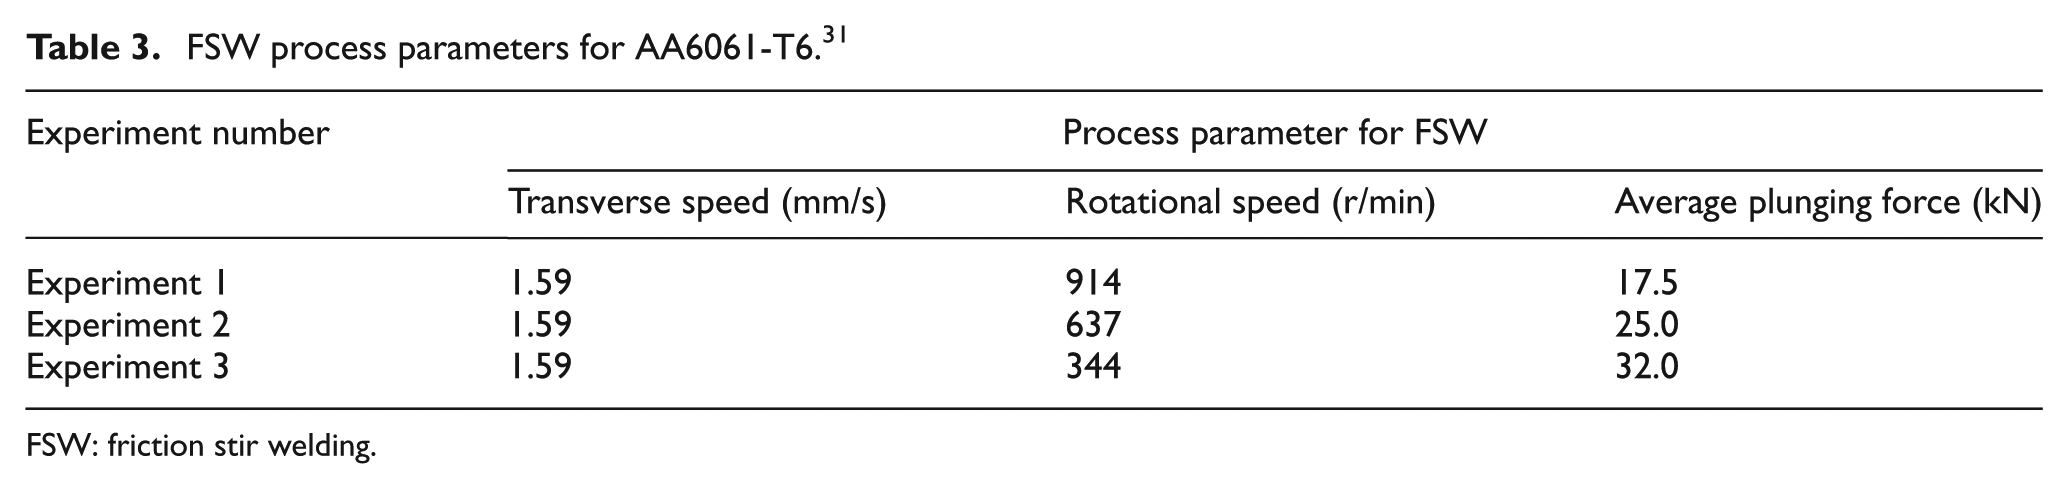
To validate the numerical model, one set of experimental data are considered from the literature for the material AA6061-T6. 31 The welding process parameters are depicted in Table 3. The diameter of the tool shoulder is 50 mm and the diameter of the tool pin is 12 mm. The workpiece is 12.7 mm thick and is butted with another workpiece. Figure 12 depicts the time–temperature history of four selected special points. The location of the measuring points is 2.0 mm beneath the upper surface and the points 1, 2, 3, and 4 are 8, 12, 16, and 25 mm away from the joint line, respectively. In this case, the shoulder diameter is large enough to produce wide peak temperature zone since the maximum temperature sustains for a long time. It is also found that the peak temperature for point 1 is close to 85% of the material melting point temperature. The temperature profile and peak temperature attained in all cases are almost in similar range because of low transverse tool speed, and this resembles the fact of considering symmetric heat source profile. The temperature rise also depends on contact condition. At low rotation and transverse welding speed, the contact state variable intensifies the fraction of heat generation due to plastic deformation and is found to have a significant effect on the resulting temperature especially at low-energy levels.
FSW process parameters for AA6061-T6. 31
FSW: friction stir welding.
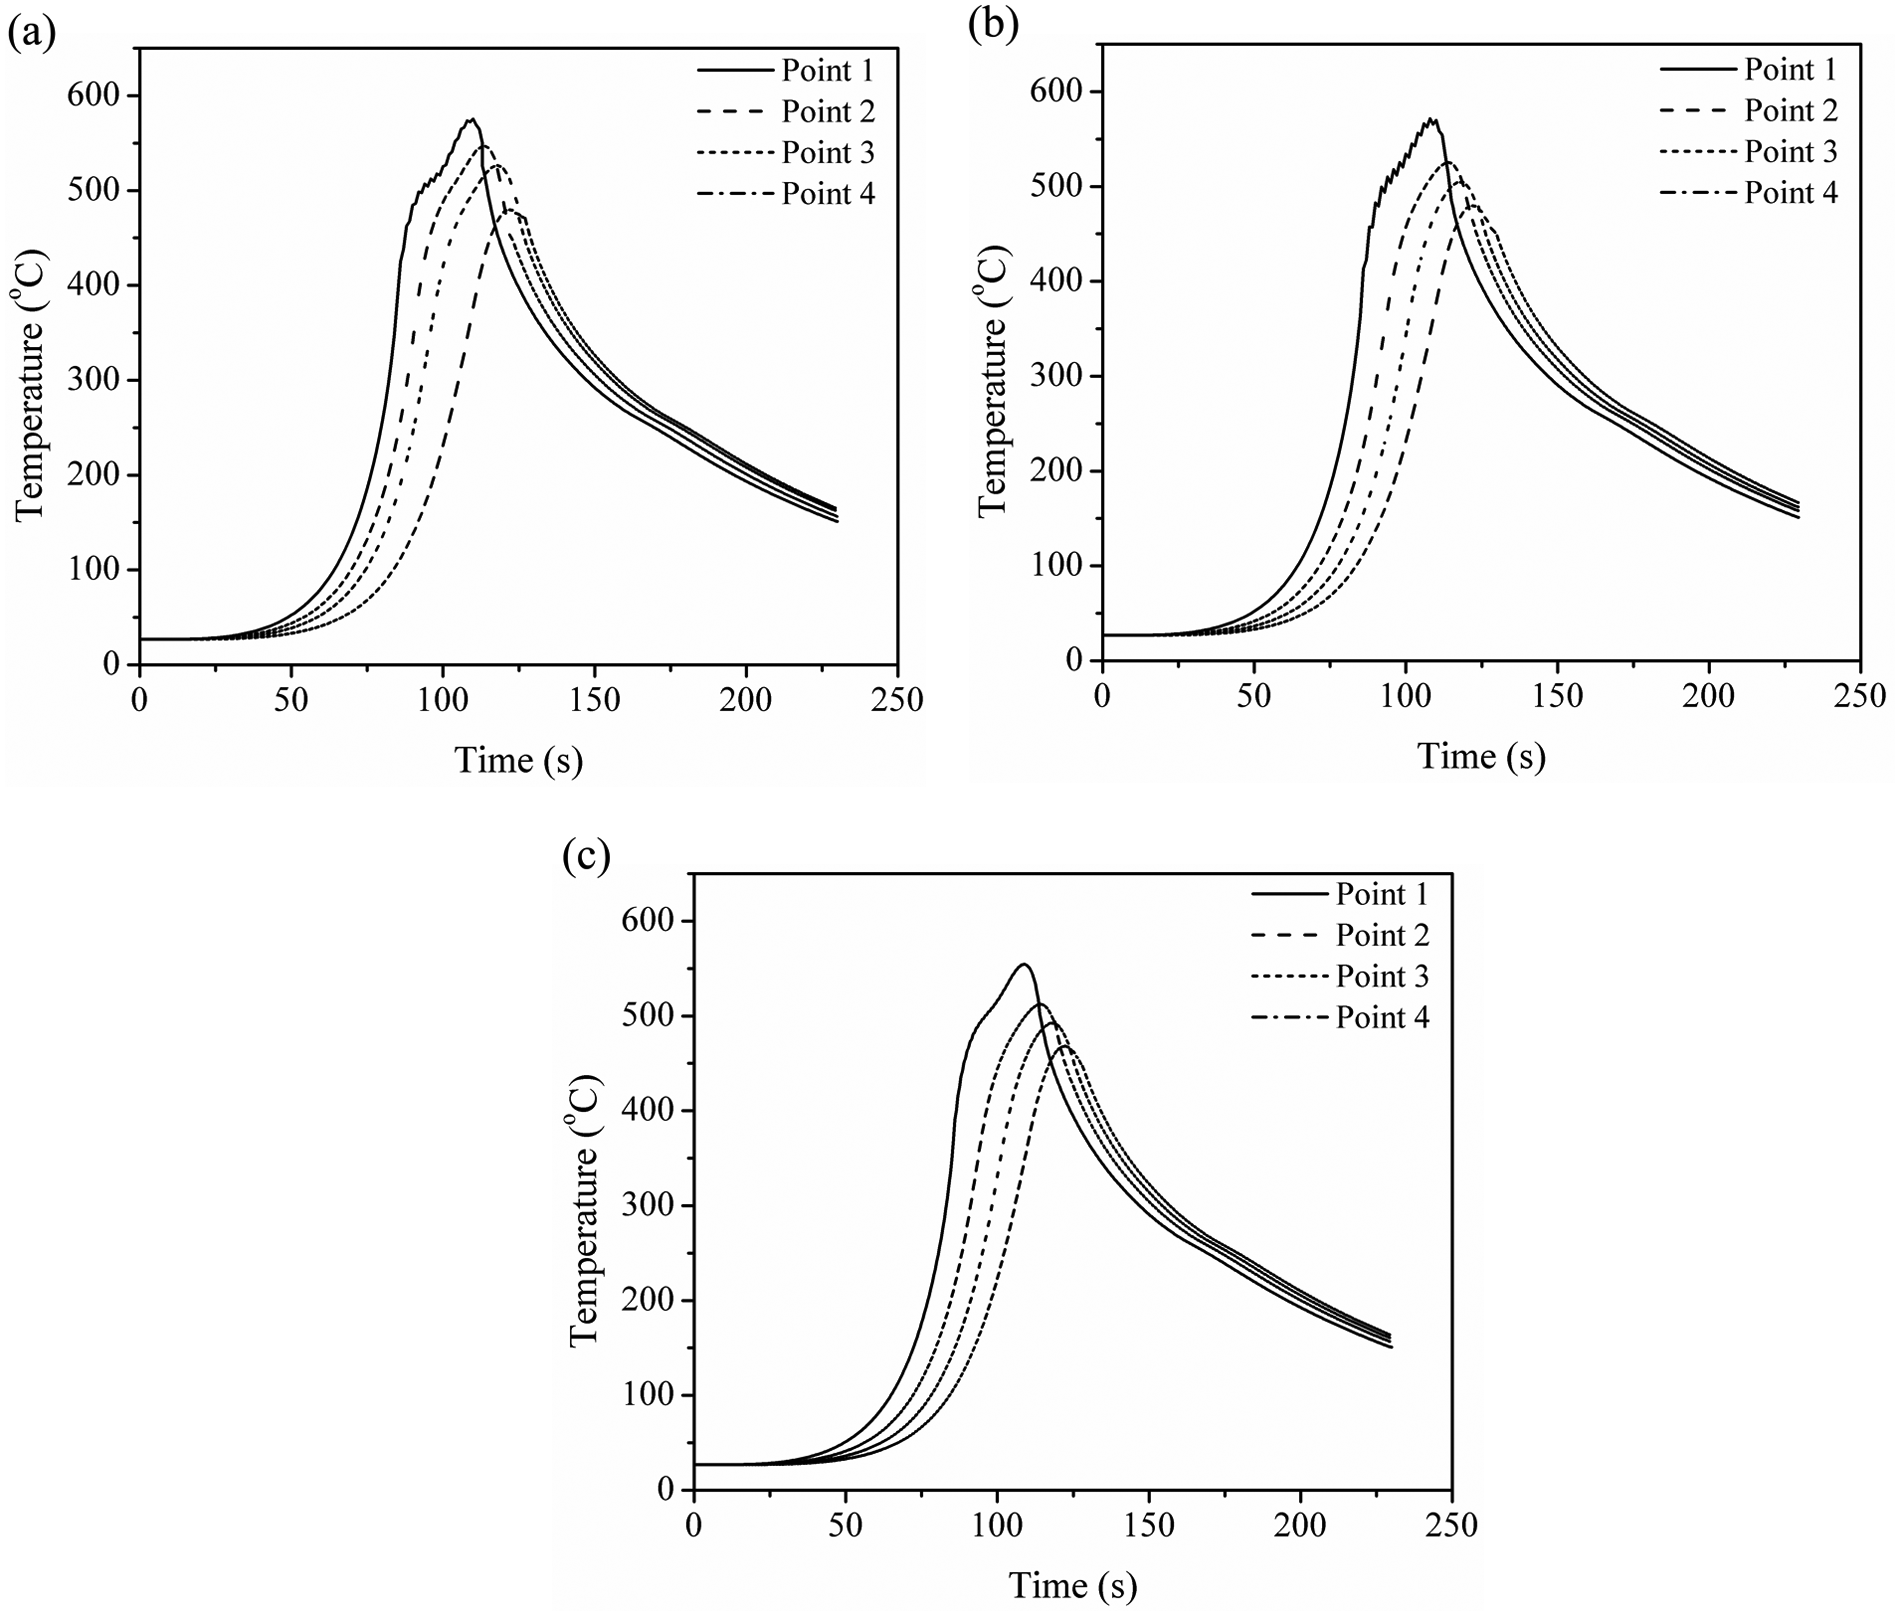
Temperature history of three experimental conditions in Table 3 during simulation: (a) Experiment 1, (b) Experiment 2, and (c) Experiment 3 for AA6061-T6.
Figure 13 shows a comparison between the experimentally measured temperature profiles from Trial 2 and the model results. Relatively better agreement between the profiles is obtained by optimum heat transfer film surface coefficient of backing plate. It is obvious from Figure 13 that there is insignificant temperature rise during dwell period and almost zero temperature gradient in that period. However, the stiff temperature gradient is observed before reaching peak temperature.
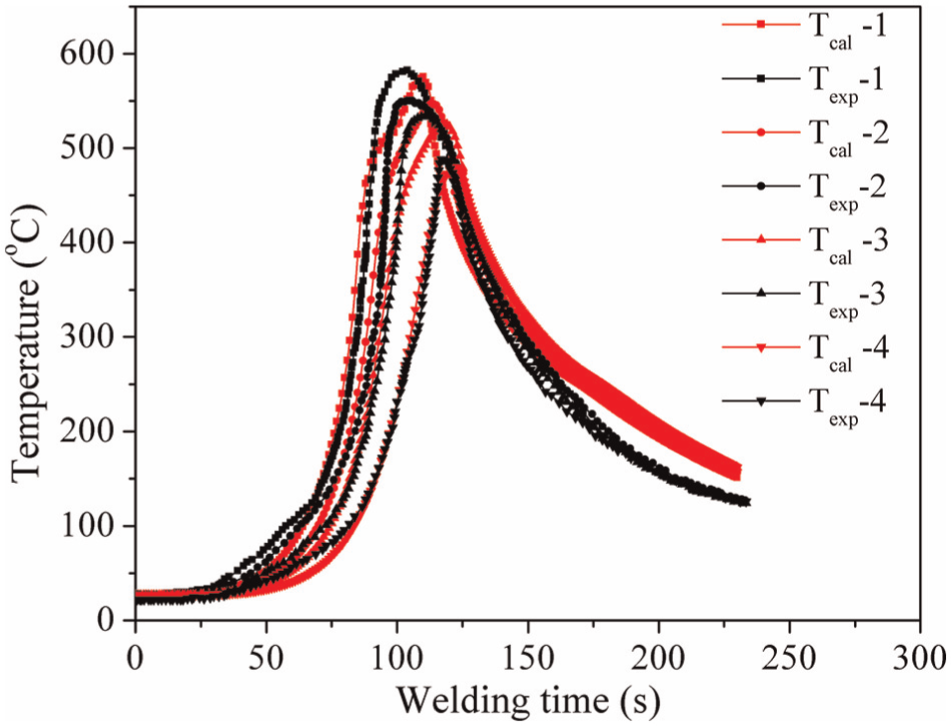
Figure 14 depicts the error percentage of peak temperature, which is defined by
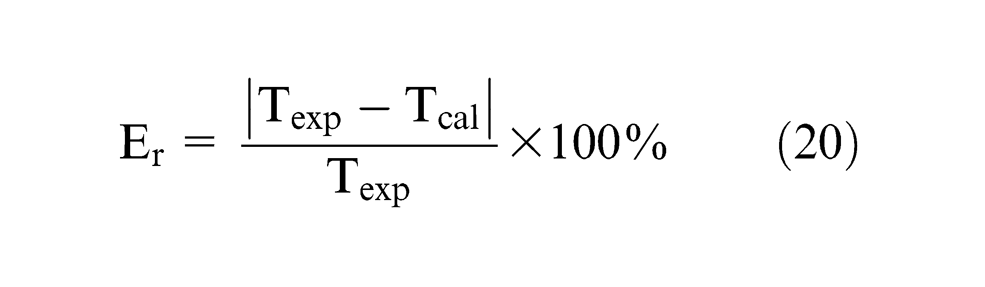
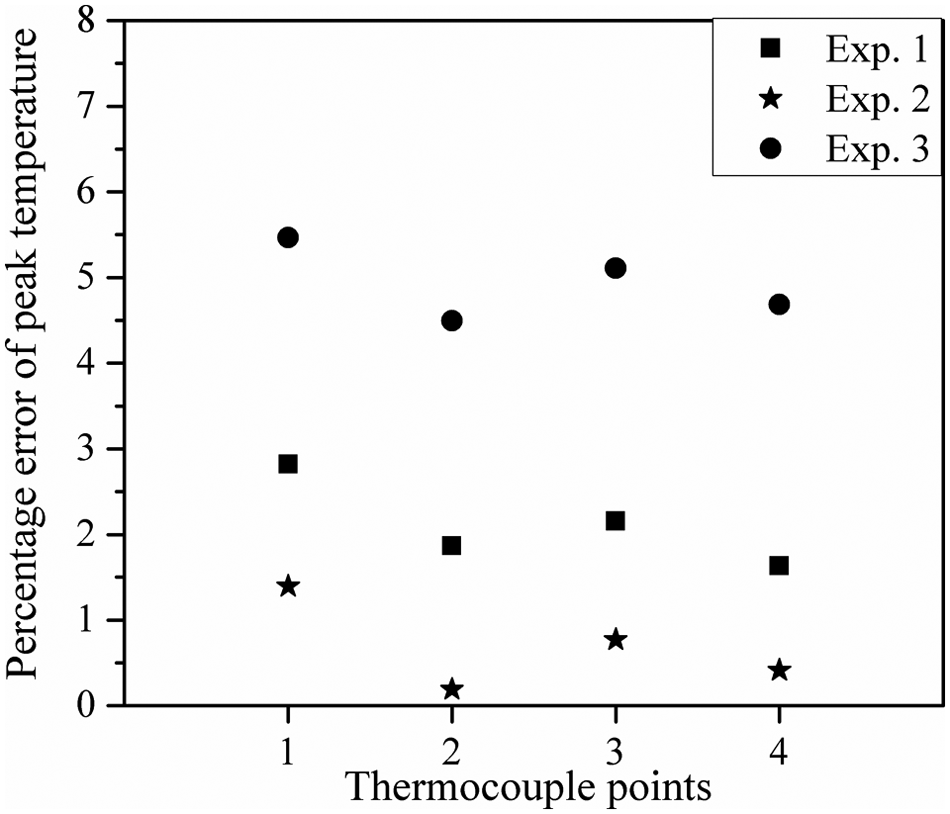
Estimated percentage error of peak temperature in comparison between simulated and experiments corresponding to Table 3.
where
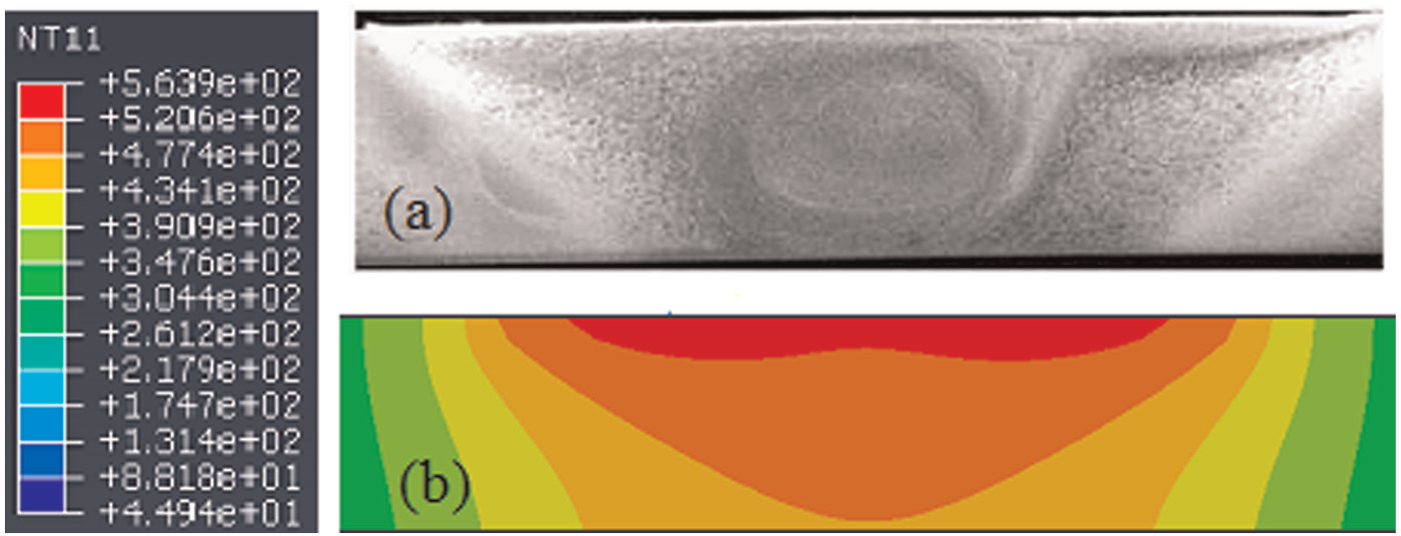
In FSW process, the microstructural morphology consists of the weld nugget, the thermo–mechanical-affected zone (TMAZ), the HAZ, and the base material. The microstructure morphology is related to the local thermal history. Based on shapes and grey levels on the microstructure morphology, the weld cross-sectional area relates to the local peak temperature experienced in each region and the corresponding isotherms are compared in Figure 15. The calculated temperature in the centre part corresponding to the nugget zone is around 563 °C. In the ‘V’ shape area, the temperature range is between 485 °C and 390 °C, which belongs to TMAZ. The temperature range of 390 °C–207 °C corresponds to HAZ. Figure 15 shows that the calculated isothermal weld cross section is nearly equivalent with experimental microstructure morphology and hence verifies the reliability of numerical model. 32
This model thus makes it possible to effectively use a symmetric heat source in numerical model to demonstrate comprehensive heat transfer analysis of FSW process. Temperature distributions are not symmetric around the welding line and maximum temperature occurs behind the tool pin of the advancing side. However, further validation of cooling rate and influence of it on mechanical properties of weld joint are necessary to enhance the reliability of process model reported in this work.
Conclusion
To study the transient temperature field in FSW of aluminium alloy, a 3D finite element model is developed. The model results are compared with the literature reported and in-house experimentally measured temperature profile at different locations of workpiece. The following conclusions are drawn from the analysis:
Effect of heat generation due to plastic deformation (surface) is accompanied in the pin to estimate heat flux for moving heat source. The heat generation both from the pin side and the bottom surfaces has effective role in this analysis.
Temperature distributions are not symmetric around welding line and maximum temperature occurs behind the tool pin.
The comparison between experimentally measured and calculated thermocouple record agrees well, even though the advancing side temperature underestimates and the retreating side overestimates the predicted model results due to symmetric heat generation by sliding and sticking conditions.
Percentage error of peak temperature in experimental and calculated thermocouple record at different locations is less than 5.5%, which is reasonable for the reliability of the proposed model.
The inclusion of non-symmetric heat source model will definitely enhance the scope of predicting different temperature profiles between advancing and retreating sides. This is the future scope of the work to enhance the reliability of mathematical modelling.
Footnotes
Appendix 1
Declaration of Conflicting Interests
The author(s) declared no potential conflicts of interest with respect to the research, authorship, and/or publication of this article.
Funding
The author(s) disclosed receipt of the following financial support for the research, authorship, and/or publication of this article: This research work was supported by the Department of Mechanical Engineering, Indian Institute of Technology Guwahati, by providing experimental facility to carry out the experiments.