
Abstract
In this work, the effect of activated tungsten inert gas welding process parameters on the depth of penetration of super duplex stainless steel alloy 2507 has been analyzed using response surface methodology. The design matrix for conducting the experiments was generated using the central composite rotatable design of response surface methodology of design of experiments. The input process parameters like current, torch speed and arc gap were varied at five levels. Based on the generated design matrix, bead-on-plate welds were made on 10-mm-hick super duplex stainless steel plate. The depth of penetration, which is the response in the present analysis, was measured on the samples. A second-order response surface model was developed. Then, response optimization was performed for obtaining the maximum depth of penetration using desirability approach. The validation of the model showed good agreement between the predicted and actual values of depth of penetration.
Keywords
Introduction
Super duplex stainless steel (SDSS) alloy 2507 is a newly developed structural material used in many industrial applications like chemical, petrochemical, power, oil and gas industries, food and pharmaceutical industries and marine and desalination plants where superior corrosion resistance is required. SDSS alloy 2507 has an optimum phase balance of ferrite (body-centered cubic (BCC)) and austenite (face-centered cubic (FCC)) phases; they exhibit higher resistance to stress corrosion cracking and mechanical strength when compared to other kinds of stainless steels such as type 304 L and 316 L austenitic stainless steels.1,2 The mechanical properties of the SDSS alloy 2507 are excellent in the temperature range of −50 °C to 300 °C. Due to the higher ferrite content than austenitic stainless steels, SDSS alloy 2507 is ferromagnetic and its thermal conductivity is high and thermal expansion is low. The ferrite:austenite (F:A) ratio influences the mechanical, chemical and electrochemical properties of SDSS weld joints.3,4
SDSS alloy 2507 structural components are normally produced using tungsten inert gas (TIG) welding processes. TIG welding is chosen over other arc welding processes because of its high-quality weld deposit. The major advantage of the TIG welding process is its improved mechanical and metallurgical properties. TIG welding process was used in welding of thin section of stainless steel materials and welding of the root pass of various components. The major limitations of the TIG welding process are its lack of ability to weld thicker materials in a single pass, poor tolerance to variation in minor element compositions and low productivity. The thickness of stainless steel material that can be welded in a single pass is limited to 3 mm using argon as shielding gas.5,6 A novel variant of the TIG welding process is the activated flux or activated tungsten inert gas (A-TIG) welding process which overcomes the limitations of TIG welding process. Many researchers have studied the A-TIG welding of austenitic and duplex stainless steel materials.7–12 In A-TIG welding, a thin coating of an activated flux is applied on the surface of the material prior to welding which leads to a drastic increase in the weld bead penetration. The activated flux applied on the joint area constricts the arc which in turn increases the current density, and the electromagnetic force acting on the molten pool increases the depth of penetration (DOP) compared to that of the conventional TIG welding at the same welding parameters.7–9
The A-TIG welding process is an emerging process for welding of different metals and alloys. The process is gaining importance as the DOP achievable during A-TIG welding is 300% more when compared to conventional TIG welding. Increased DOP during A-TIG has been attributed to the constriction of arc as well as the reversal of Marangoni convection.8,9 It has been demonstrated that the plate thickness up to 12 mm can be easily welded in a single pass with an increased productivity of 2–4 times. It has been demonstrated that the use of A-TIG welding in stainless steels reduces residual stresses and distortions significantly.6,13 The weld quality and weld bead geometry of A-TIG-welded SDSS 2507 joints strongly depend on the selection of process parameters. Design of experiment (DOE) is one of the methods used for optimization of process parameters. DOE is a statistical method used to design the experiments with a very limited number of trials and to optimize the process variable to obtain the desired response. 14 The response surface methodology (RSM) is one kind of DOE, which is traditionally used and was established by Box and Wilson 15 in 1950. Therefore, optimizing the A-TIG welding process parameters using RSM is very important. Researchers have used DOE for optimization and modeling of process variables. RSM is used to generate input and output relationship between process variables and to predict the response for the given input variables within the limit.16–23
Balasubramanian et al. 24 have conducted the bead-on-plate welding experimental trials based on the DOEs and obtained the influencing process variables on the weld bead geometry. Benyounis et al. 25 have applied root mean square (RMS) to optimize the process parameters using desirability approach. Manonmani et al. 26 have developed mathematical equations to predict the bead geometry of laser-butt-welded stainless steel sheets using RSM. Sivasakthivel et al. 27 have studied the effect of process variables on the surface roughness of end milling process and predicted the surface roughness in terms of machining parameters using RSM.
Karthikeyan and Balasubramanian 28 have applied RSM to optimize the friction stir spot-welding process variables to find the maximum lap shear strength of spot weld of AA 6061 aluminum alloy. Sahoo et al. 29 have optimized the influencing machining process parameters of computer numerical control (CNC) end milling using RSM. Rajakumar et al. 30 have optimized the process parameters of the friction stir welding process using RSM.
Literature related to optimization of A-TIG welding of duplex stainless steel alloys are limited. The present research work involves the optimization of A-TIG welding process using RSM for the welding of SDSS alloy 2507. The analysis was carried out to study the influence of A-TIG welding process parameters on the DOP in 10-mm-thick SDSS 2507 alloy plates and to predict the optimum welding conditions using desirability approach for achieving maximum DOP in single-pass welding. The process parameters identified are quite useful for the fabrication and manufacturing industries.
RSM
RSM is a set of mathematical and statistical techniques. RSM is very valuable for the modeling, optimization and analysis of problems in which a response of significance is influenced by a number of process parameters called variables, and the objective is to optimize the response. 14 RSM is defined to identify the relationships between the controllable input welding variables and the desired responses. Generally, the objective is to estimate the input process parameters at which the responses achieved will be optimum. The optimum can be either a minimum or maximum of a certain function in terms of the input process parameters. RSM is the most capable tool that can give important information about the interaction effects between the process parameters. It also gives the necessary information for design, process optimization and multiple responses for various fabrication and manufacturing processes.31,32 When all independent variables are assumed to be measurable with negligible error, the response (Y) can be expressed as given below

where xk is the number of independent process variables called factors. In the common applications of RSM to optimize the response “Y,” a regression model is developed. The second-order polynomial equation can be given as
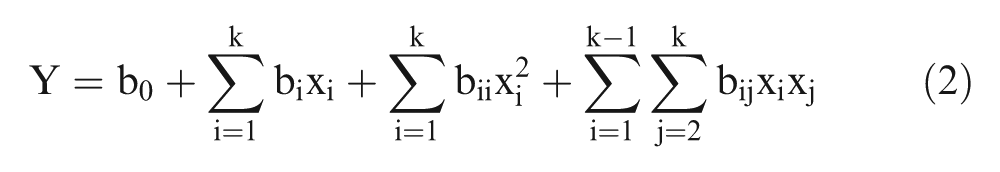
where parameters bij = 0, 1, …, k are called the regression coefficients
Experimental procedure
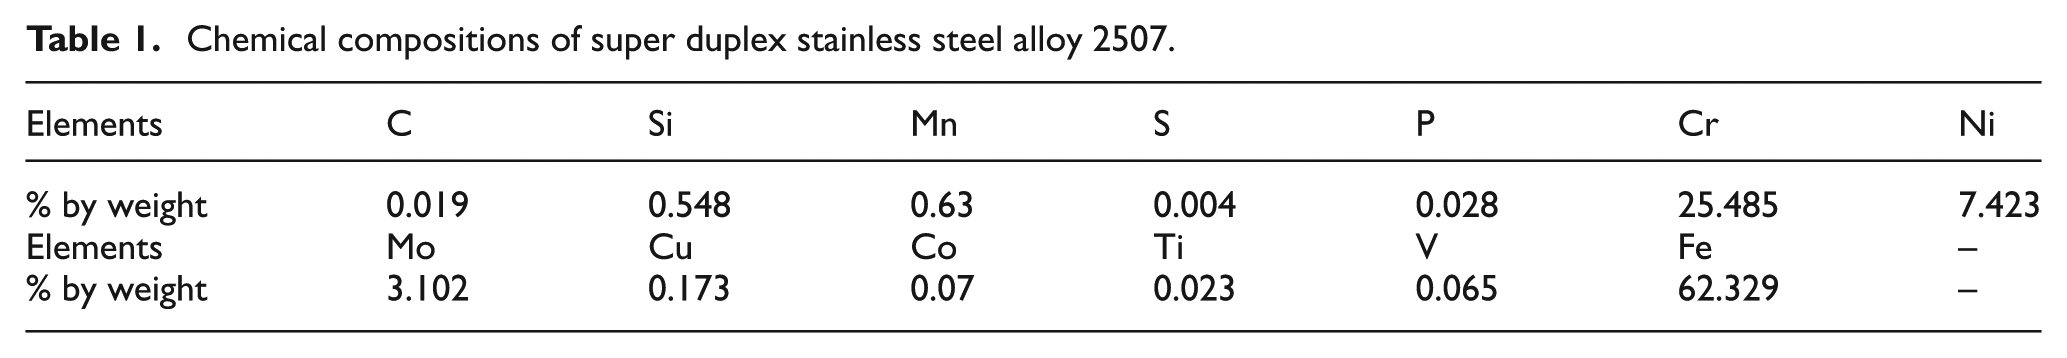
The steps involved in employing RSM for optimizing the A-TIG welding process for SDSS alloy 2507 is shown in Figure 1. Table 1 shows the chemical composition of SDSS 2507 alloy. A-TIG welding input process variables which influence the weld bead geometry have been identified from the literature.33–36 The experimental design matrix was developed as per central composite rotatable design (CCD) of RSM. Three factors were varied at five levels resulting in a rotatable CCD matrix consisting of two replicates of factorial points, two replicates of axial (star) points and six center points.
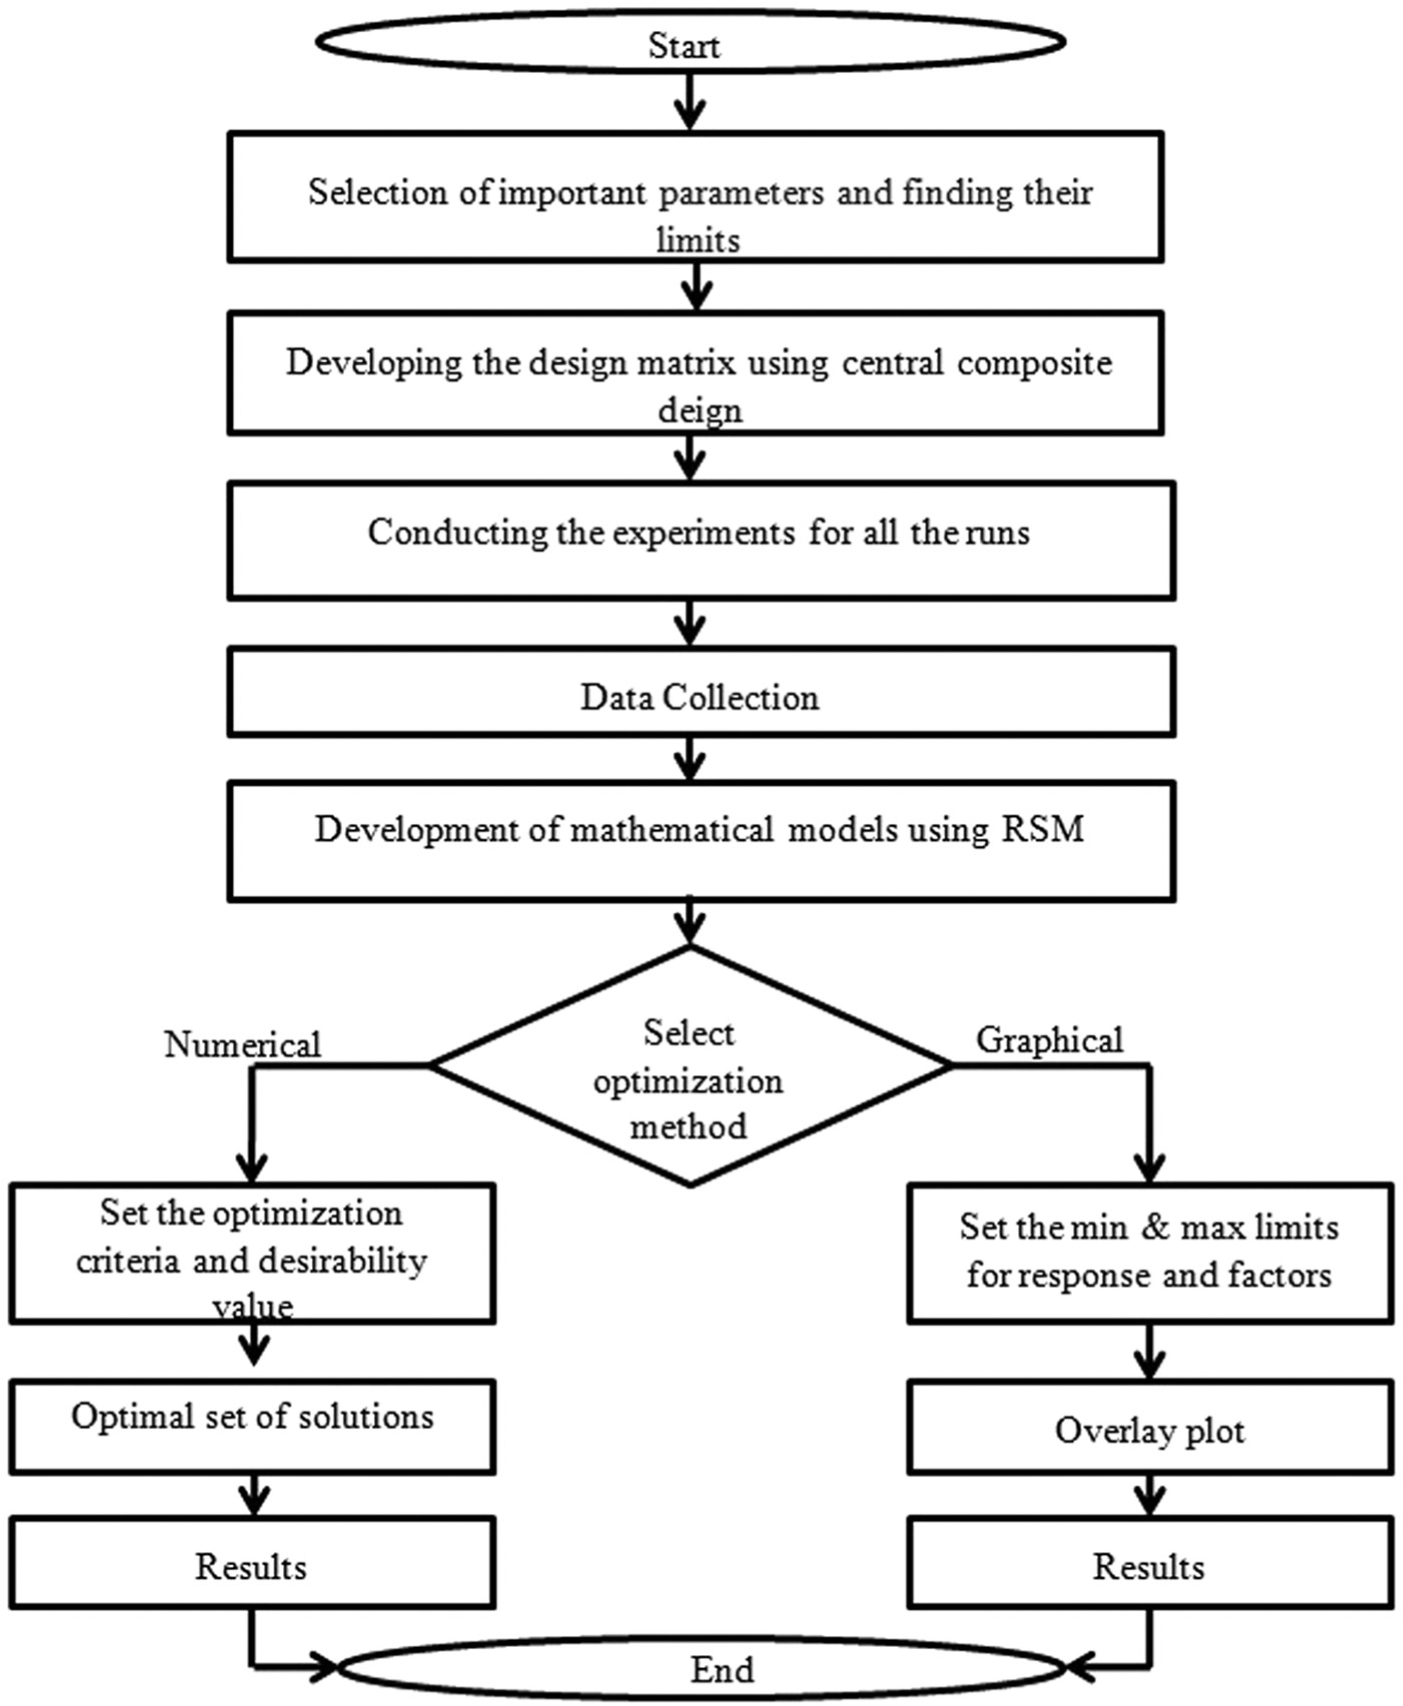
Steps involved in employing RSM for optimization of A-TIG welding for SDSS alloy 2507.
Chemical compositions of super duplex stainless steel alloy 2507.
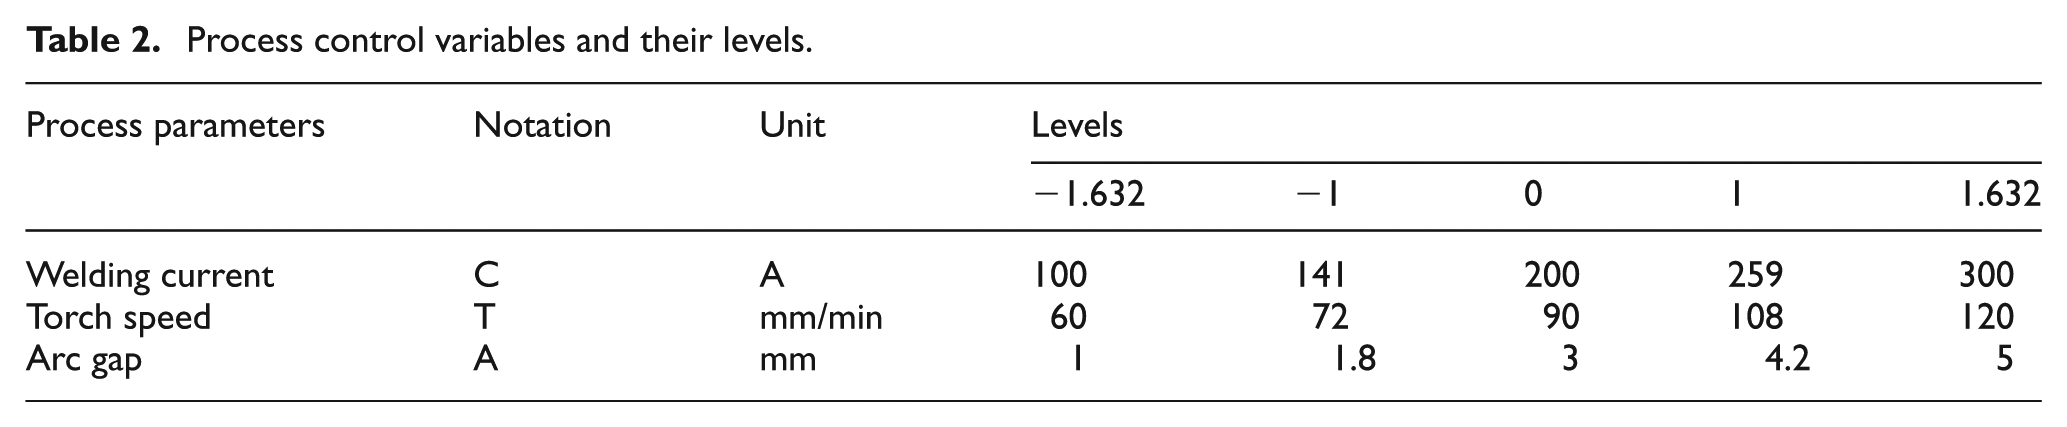
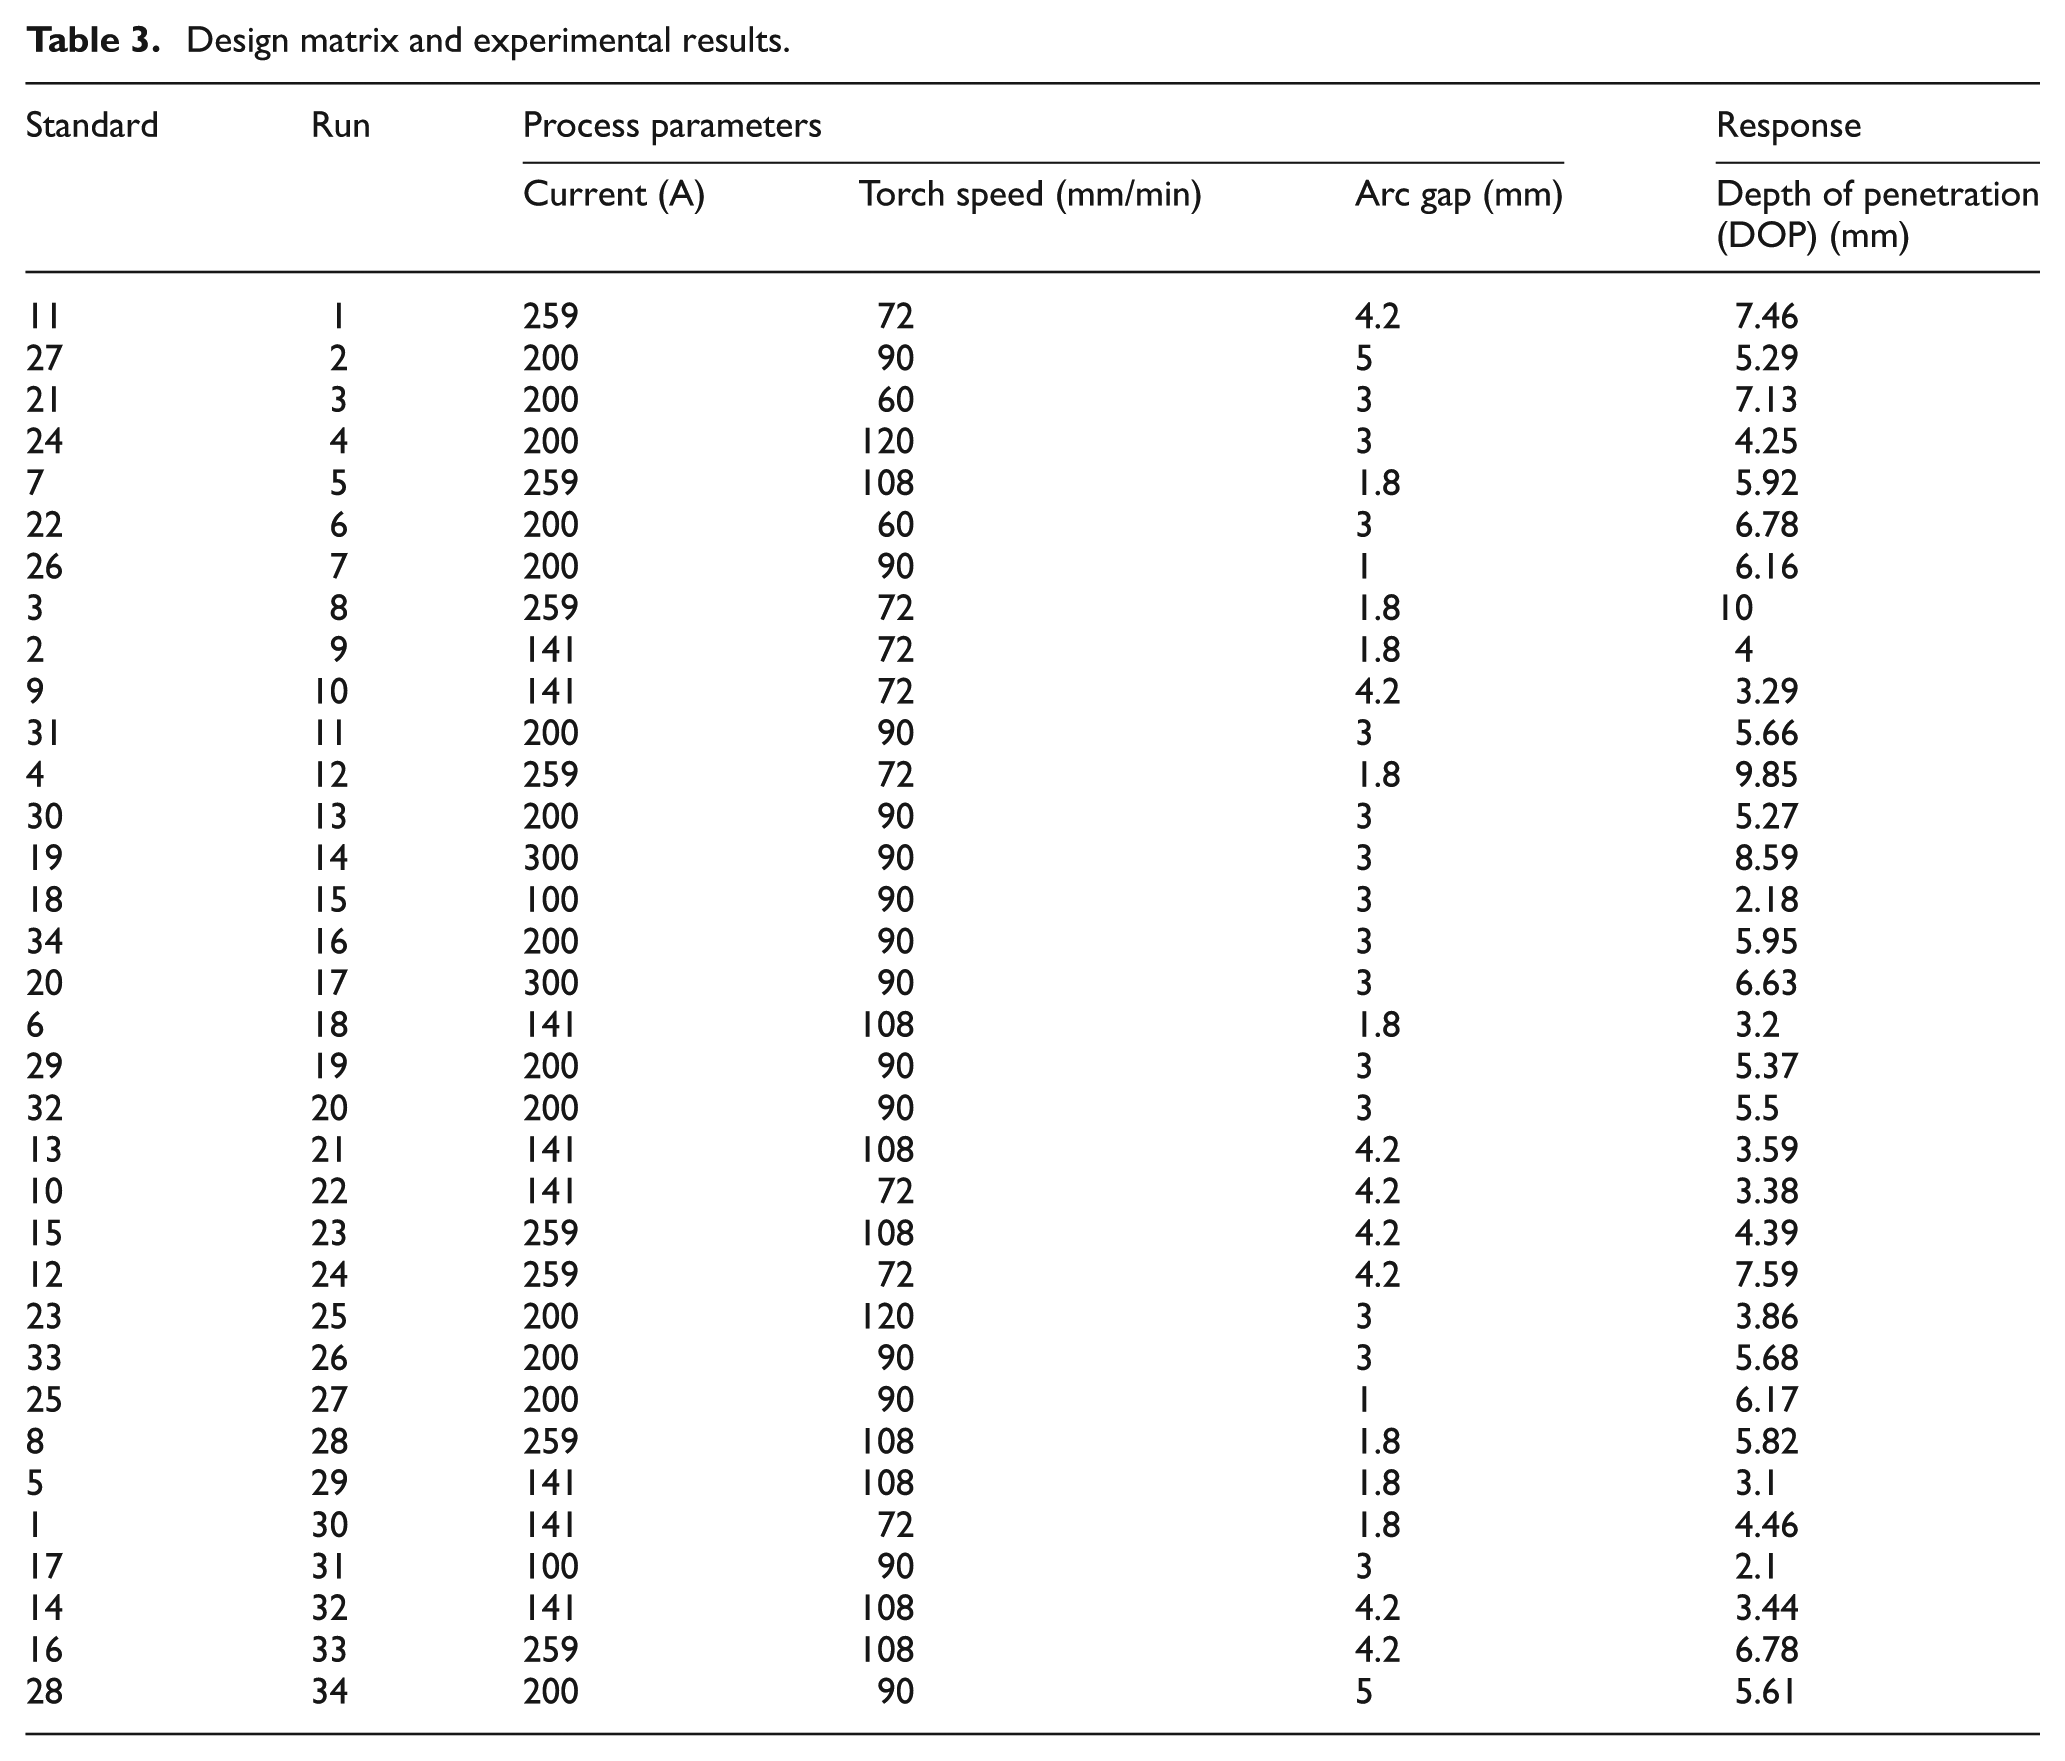
The SDSS 2507 plate size of 280 mm × 115 mm× 10 mm was cut from the large plate, and the surface of the plate was cleaned prior to performing the experimental work with silicon carbide papers to remove dirt and cleaned with acetone. The multicomponent-specific activated flux developed at Indira Gandhi Centre for Atomic Research, Kalpakkam, India, was used in this study. 7 The flux in the powder form was made into a paste by adding acetone. The flux paste was then applied on the surface of the SDSS 2507 plates using a paint brush to a thin layer prior to welding. A-TIG bead-on-plate welds were made on SDSS 2507 plates in single pass. The top surface of bead-on-plate weld trials is shown in Figure 2. The cross section of weld bead profile is shown in Figure 3. A 2% thoriated tungsten electrode of diameter 3.2 mm with 60° tip angle and argon as shielding gas with a flow rate of 10 L/min was used. The A-TIG welding bead-on-plate experimental runs were performed as per the central CCD design matrix to study the effect of A-TIG welding process parameters on the DOP. In order to measure the DOP, the 34 welded samples were cross sectioned in the transverse direction of welding at two locations (30 mm and 90 mm) from the beginning of the weld. The cross-sectioned samples were polished and etched using an electrolytic etching with 50% nitric acid, 50% water at 3 V for 60–90 s to view the weld bead profile (macrostructure). The DOP was measured using measurescope which had the attachment of digital readout counter, which was used to measure both x-axis and y-axis. The data (DOP) were collected at two locations (at 30 mm and 90 mm) for each welded parameter combination, and the average value was taken to minimize the measurement and human error. The input process parameters and measured response (DOP) were fed into the design-expert v7 for statistical analysis. Table 2 shows the process control variables in coded and actual values. Table 3 shows the experimental design matrix with the measured responses.

The top surface of bead-on-plate weld trials.
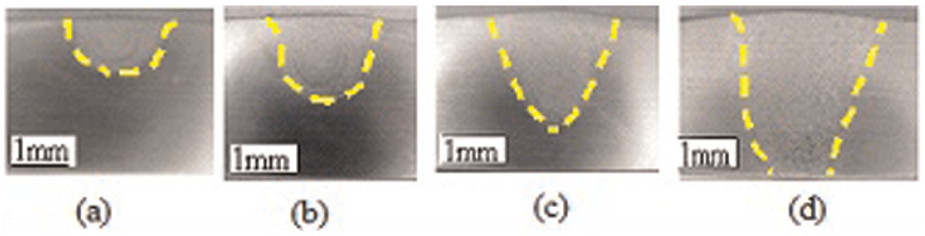
Cross section of weld bead profile.
Process control variables and their levels.
Design matrix and experimental results.
Results and discussion
Design-expert v7 software was used for the statistical analysis of A-TIG welding process parameters. In this work, RSM was used to develop mathematical relationships between the welding variables and the response for predicting the desired optimum DOP. The independent variables were analyzed as a surface to which the mathematical model was fitted. A second-order polynomial equation was generated to represent the response surface “Y” that fitted to the data which is given by
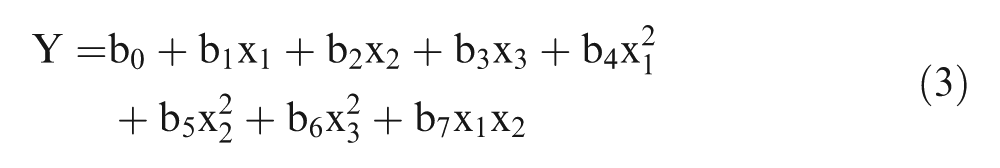
where b0 is the intercept representing the arithmetic averages of all the quantitative outcomes of all runs; b1 to b7 are coefficients. The terms
Development of mathematical models for DOP
ANOVA was performed for estimating the significance of the model at 95% significance level. A model is considered to be significant if the significance probability value (p value) is less than 0.0500. The objective of ANOVA is to investigate whether the A-TIG welding process parameters and the interaction of these parameters have significant effects on the DOP and to recognize whether the model developed is significant. The ANOVA for DOP is shown in Table 4. The lack of fit value of 0.51841 implies that it is not significant. The adequacy measures adjusted R2 is close to 1, as it is desirable, which shows the adequacy of the model. The adequate precision ratio is 28.1327, which represents the signal-to-noise ratio and is greater than 4 exhibiting the adequate model discrimination.
ANOVA of the depth of penetration
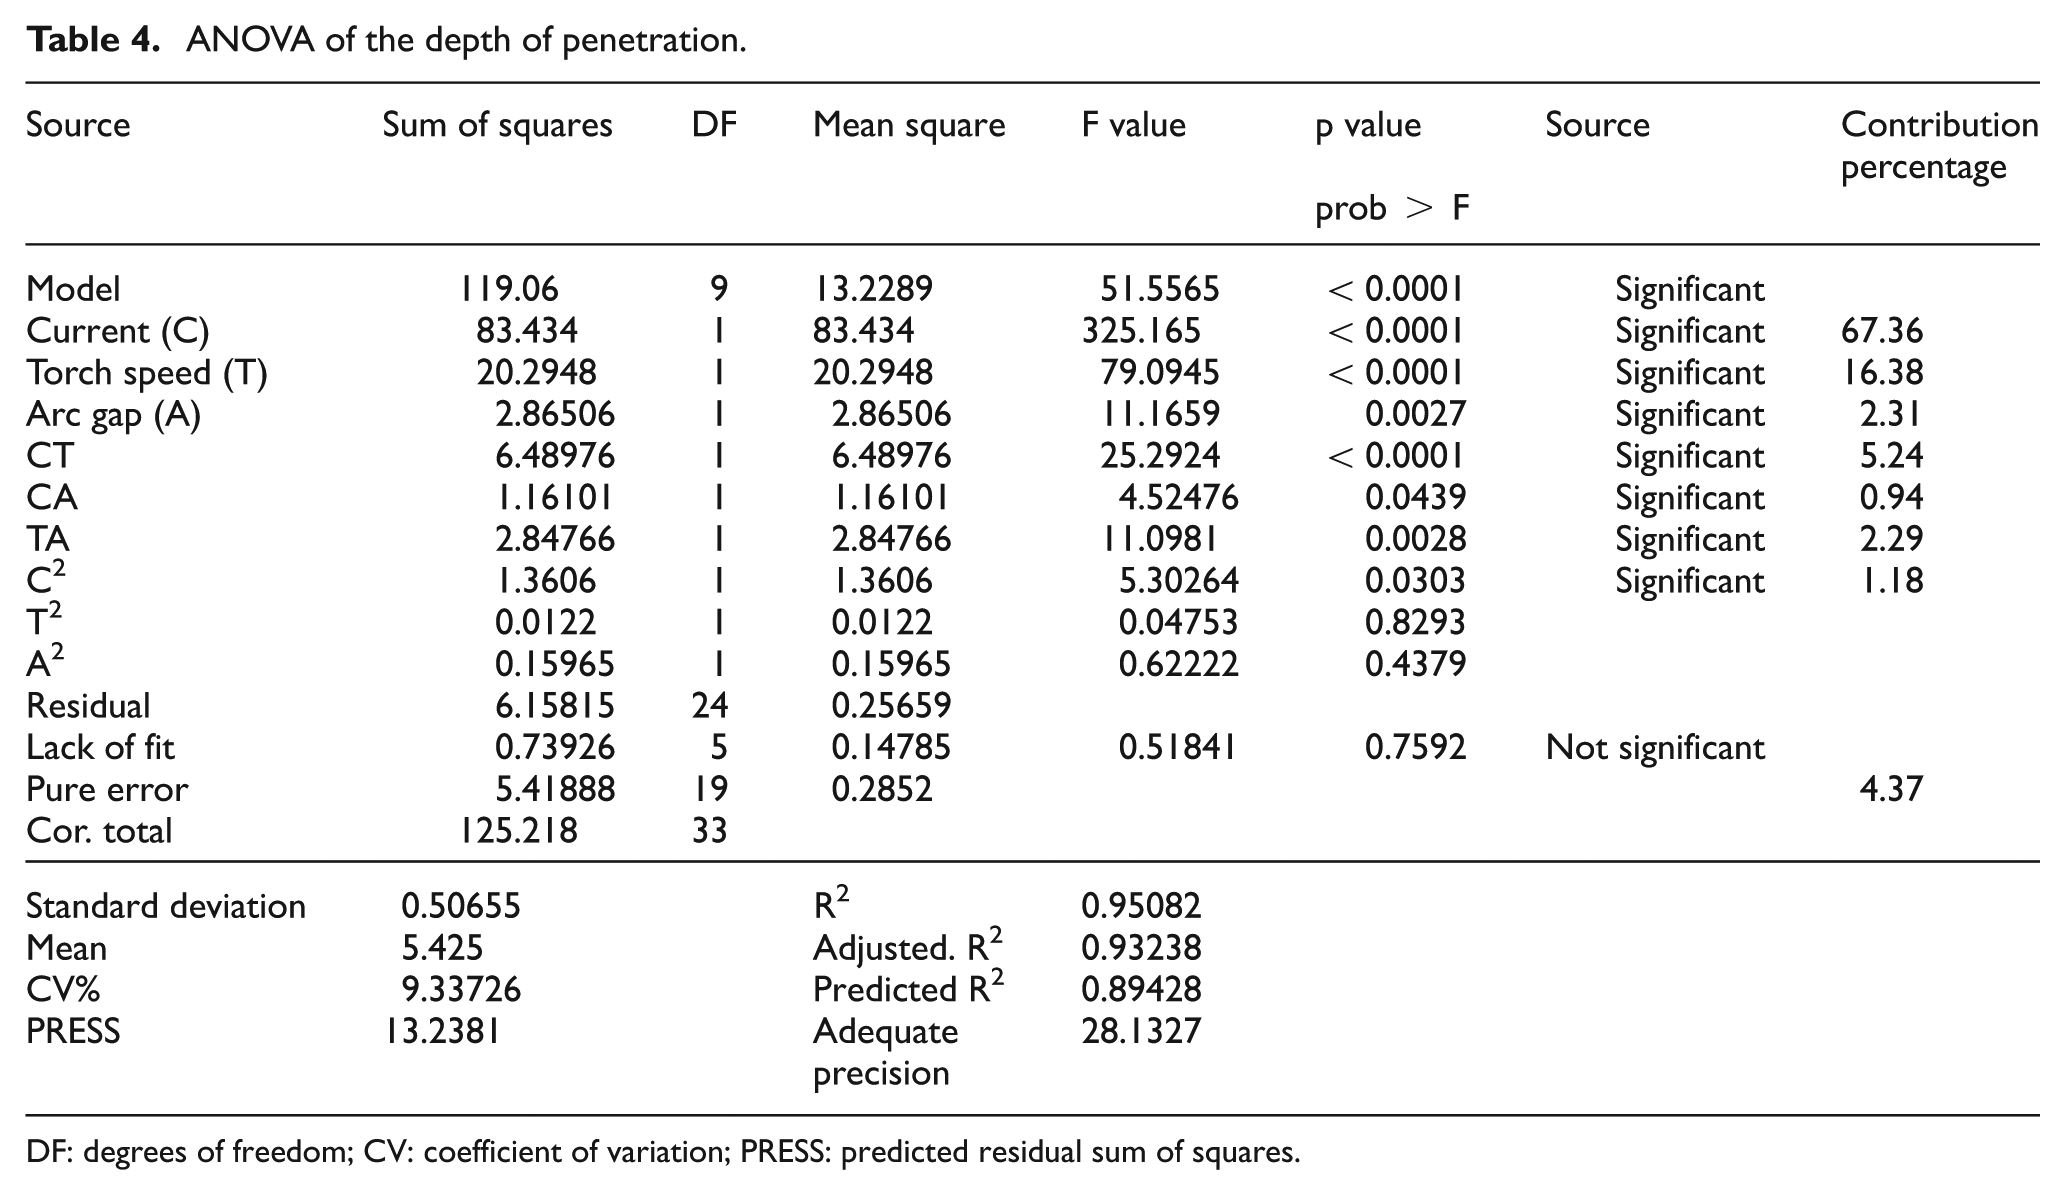
DF: degrees of freedom; CV: coefficient of variation; PRESS: predicted residual sum of squares.
Figure 4 shows the comparison of the actual and model-predicted DOP values and infers the good agreement.
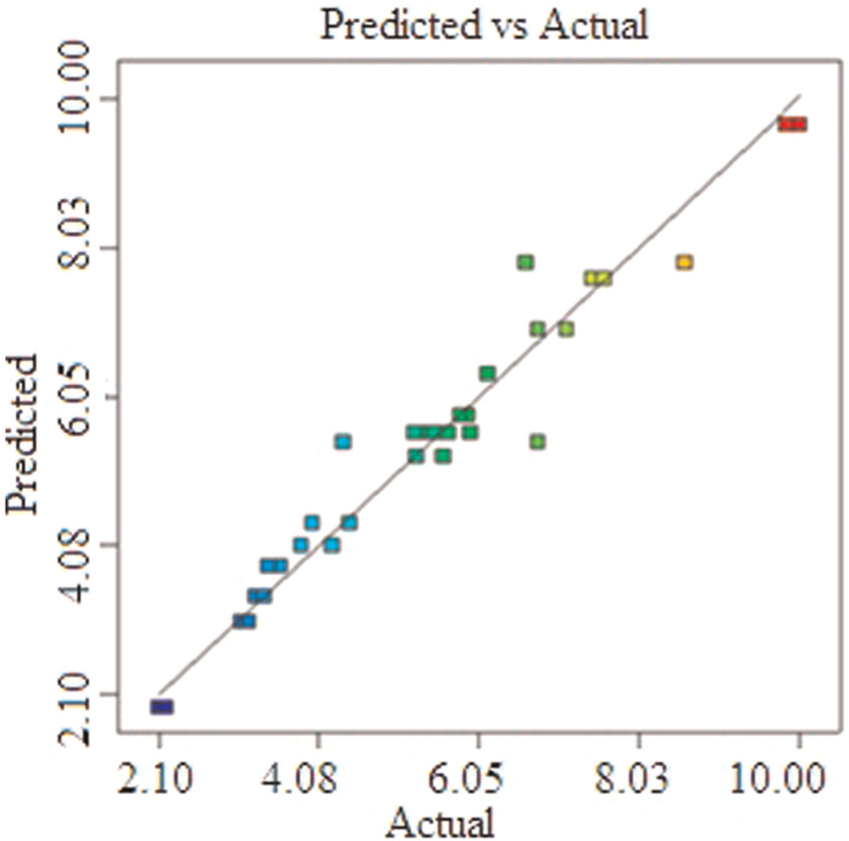
Comparison plot of actual versus predicted depth of penetration.
In this case, current (C), torch speed (T), arc gap (A) and the interaction factors of CT, CA and the quadratic term current (C2) are found to be the significant coefficients for the direct, quadratic and interaction terms, respectively. The R2 value is 0.95082, and the predicted “R2” value is 0.89428, which is in reasonable agreement with the adjusted “R2” value 0.93238. The percentage contribution of each factor was determined, and the factor with higher percentage contribution exhibits more influence on the response. The percentage contribution of parameters on the DOP is shown in Table 4. The current has more percentage contribution on DOP (67.36%), which shows that current is the major factor influencing DOP followed by torch speed (16.38%).
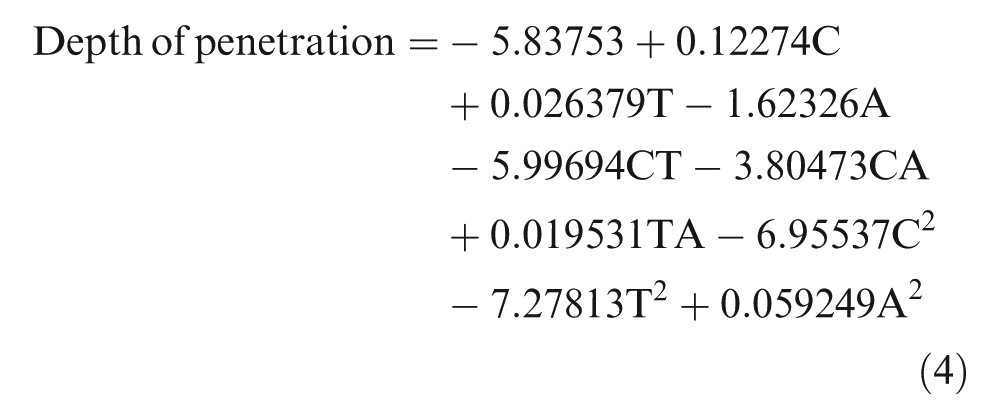
The final mathematical models derived in terms of the actual factors for DOP are given below
Interaction effect of process parameters on DOP
According to ANOVA, the factors and their interactions have significant effects on the response. The effect of each process parameter on the response was determined through the developed response surface models. In this section, an interaction effect of the process parameters is discussed, when an interaction effect between any two process parameters is being examined, the third parameter will be on its central level. The perturbation plot shows the effect of all process parameters on the DOP given in Figure 5. The interaction effects of the process parameters on DOP are shown in Figures 6–8. It is observed from the perturbation and interaction plots that the welding current has a large effect on the DOP, which is also observed in ANOVA (Table 4). With increase in current and at lower torch speed and lower arc gap, the amount of heat input to the material is increased, which leads to an increased DOP. As the current increases from 100 to 300 A for constant torch speed (say 60 mm/min), the DOP increases. Similarly, for a constant current, the increase in torch speed leads to a decrease in the DOP.
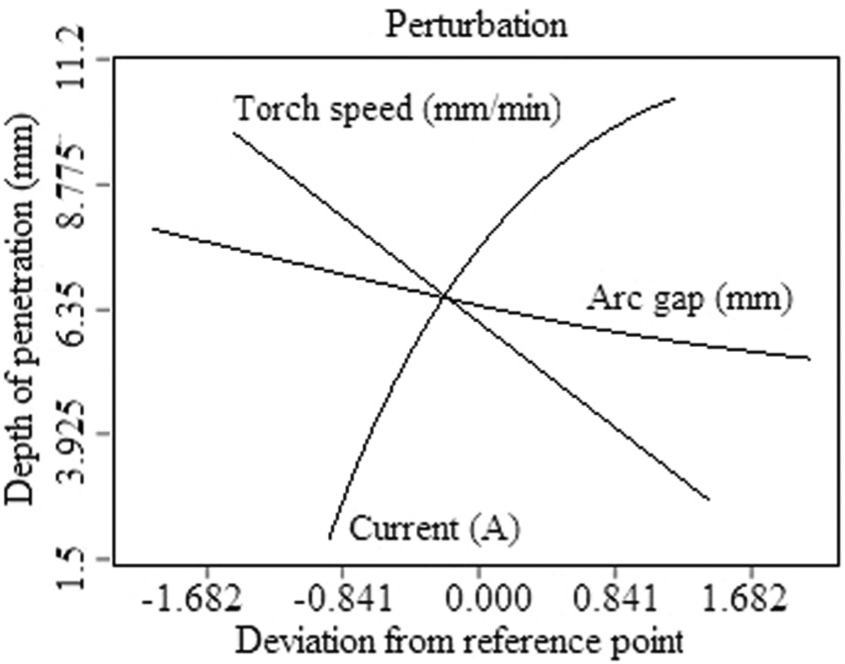
Perturbation plot shows the effect of all process parameters on the depth of penetration.
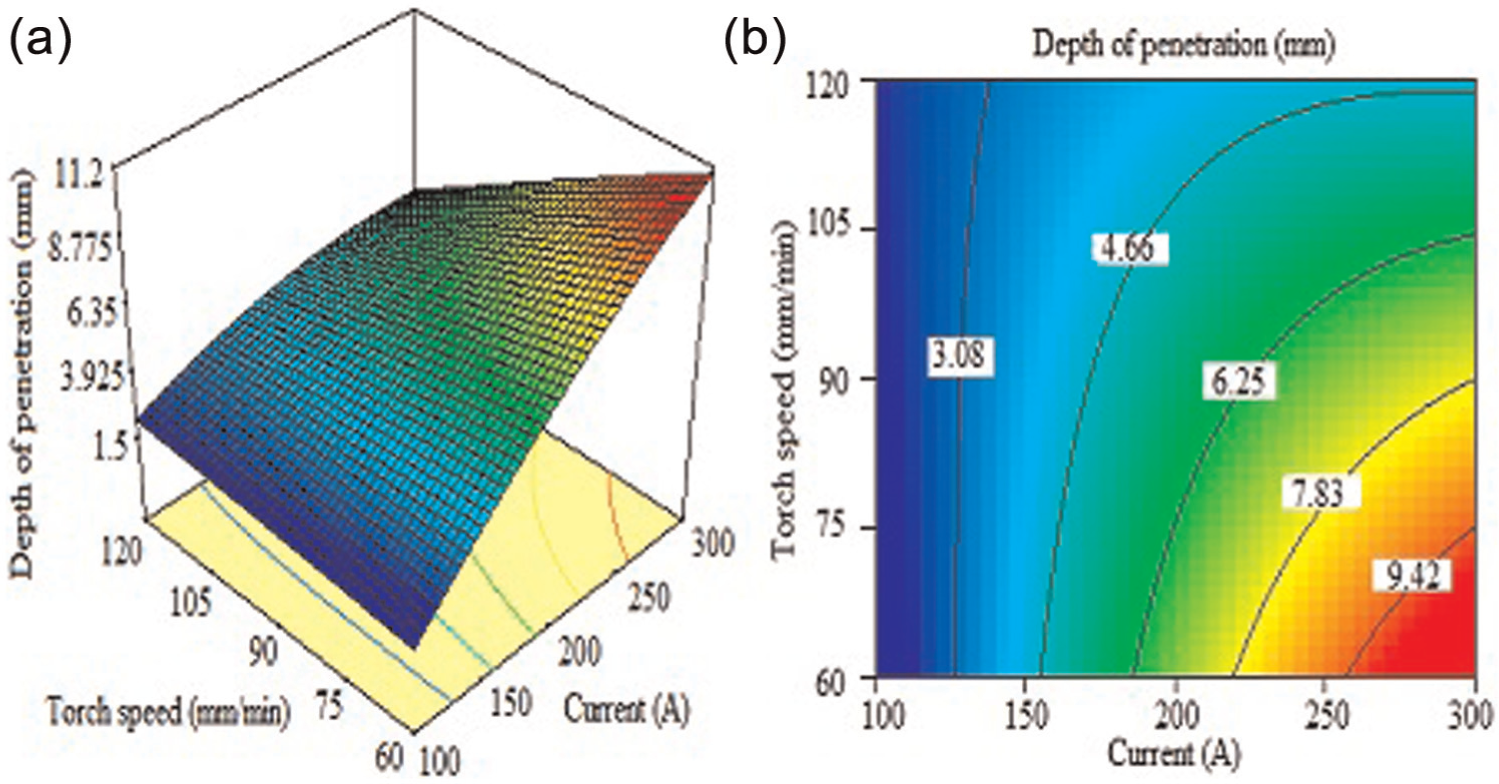
Interaction effect of current and torch speed on the depth of penetration: (a) the response surface and (b) the contour plot.
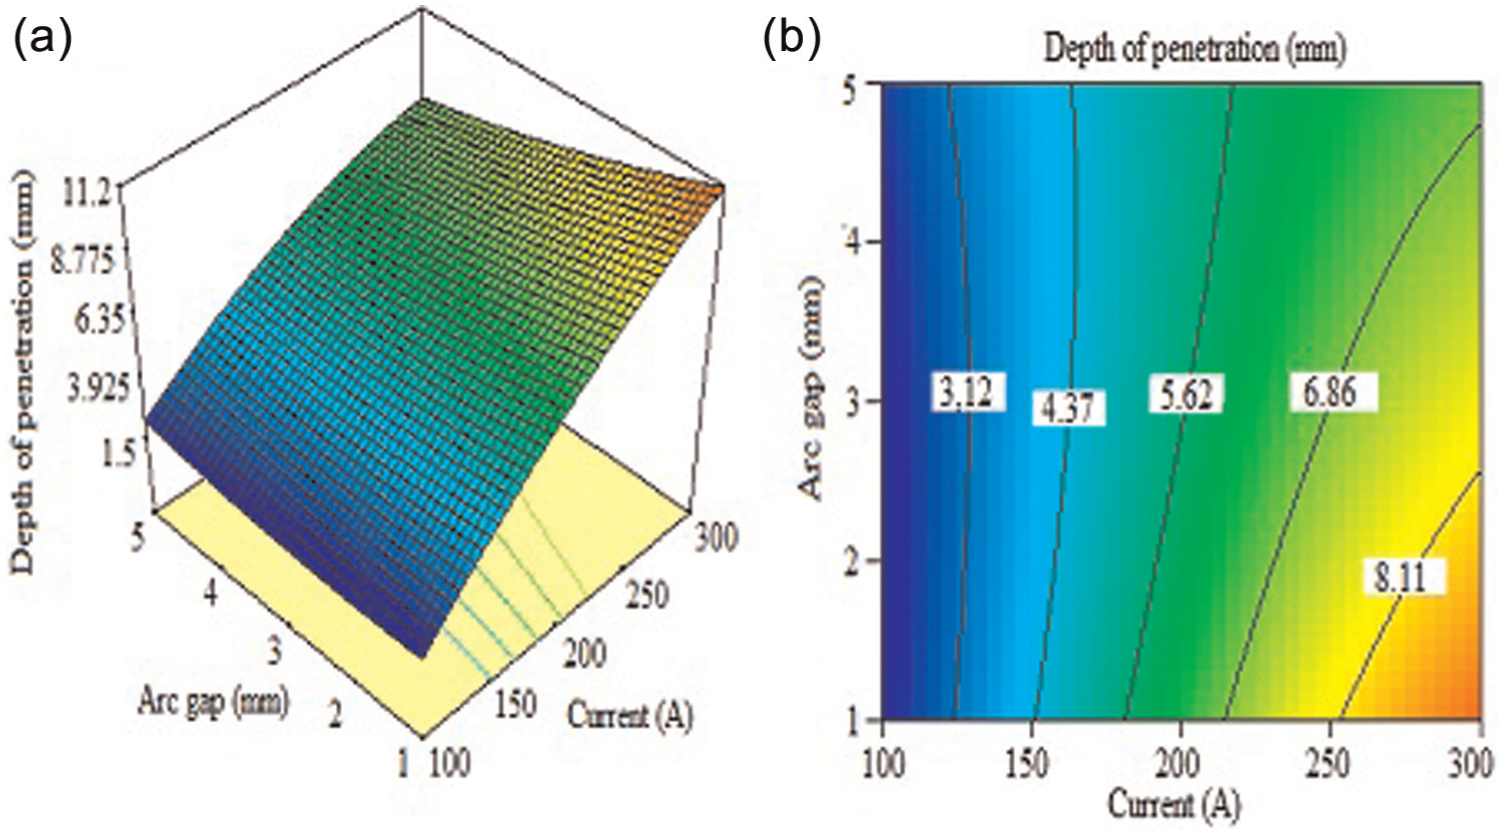
Interaction effect of current and arc gap on the depth of penetration: (a) the response surface and (b) the contour plot.
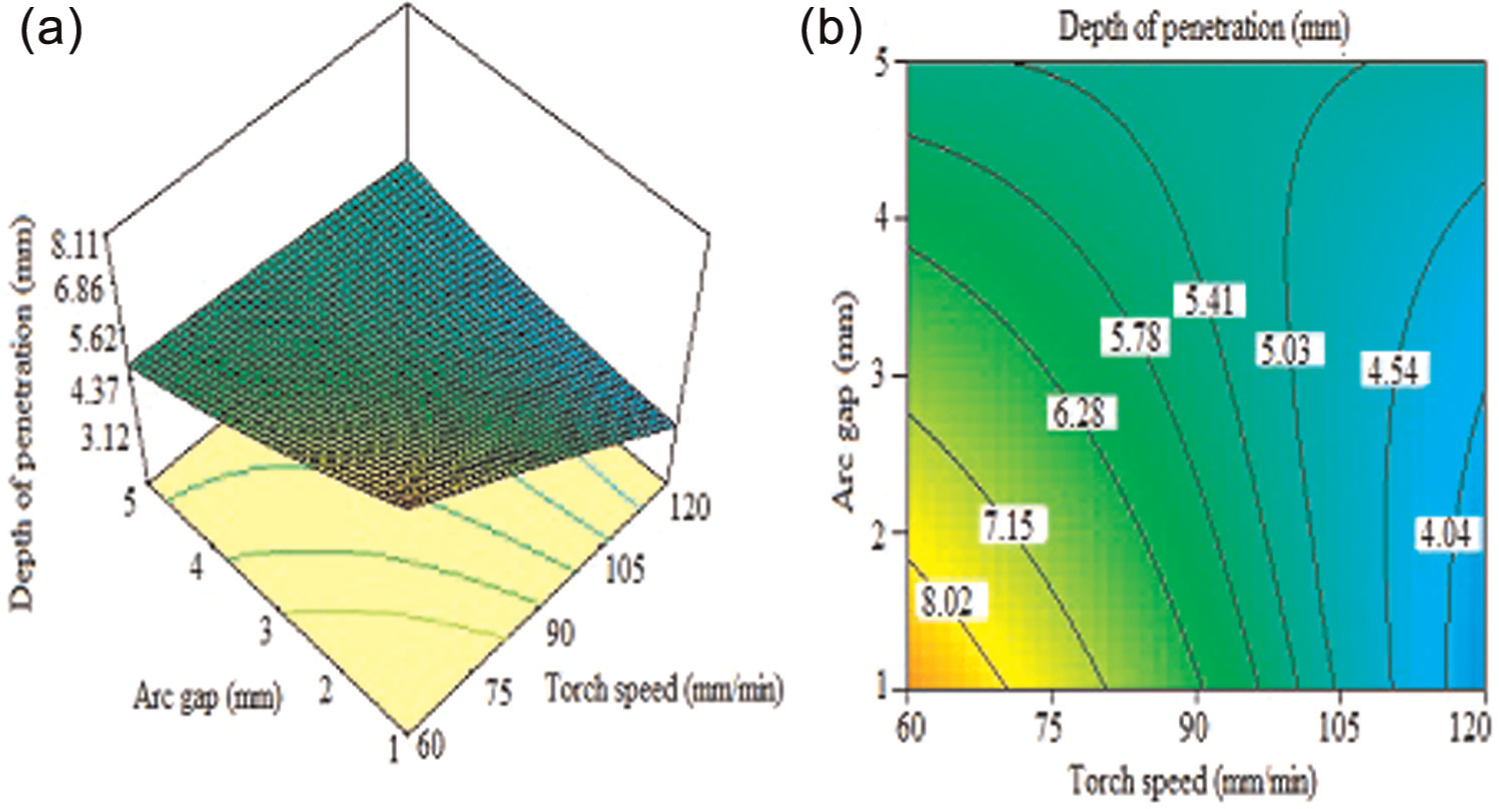
Interaction effect of torch speed and arc gap on the depth of penetration: (a) the response surface and (b) the contour plot.
The interaction effect of current and torch speed on DOP is shown in Figure 6. From the response surface and contour plot, it is observed that as the current increases, the DOP increases due to higher heat input to the base material. As the torch speed increases, the DOP decreases due to lesser heat input to the base material.
The interaction effect of current and arc gap on DOP is shown in Figure 7. At lower arc gap, the arc is constricted leading to high arc energy density in the center of the arc by means of the higher movement of the free electrons. This results in better focus of the arc leading to more DOP. At lower arc gap and higher current, the amount of heat input to the material is increased, which leads to an increased DOP. As the current increases from 100 to 300 A for constant arc gap, say 1 mm, the DOP increases. Similarly, for a constant current (say 60 mm/min), the increase in arc gap from 1 to 5 mm leads to decrease in DOP due to decrease in the energy density. Among the two parameters, the influence of current is more compared to arc gap, which is also observed in the ANOVA Table 4.
The interaction effect of torch speed and arc gap on DOP is shown in Figure 8. It is observed that at lower torch speed and lower arc gap, the amount of heat input to the material is more, which leads to the increased DOP. As the torch speed increases from 60 to 120 mm/min for constant arc gap (say 1 mm), the DOP decreases. Similarly, if the arc gap increases from 1 to 5 mm for constant torch speed (say 60 mm/min), the DOP also decreases.
Desirability approach
The desirability approach analysis method was first proposed by Derringer and Suich 37 in 1980. Desirability analysis technique is generally used for multiple responses into a dimensionless measure of performance called the composite desirability function. The common approach of desirability approach analysis function is to transfer each response Yi into a desirability function di bounded by 0 ≤ di ≤ 1, where the desirable ranges are from zero to one. 14 Engineering, fabrication and manufacturing related industries based problems require optimization process with the multiple responses of interest in such cases. Techniques like overlaying the interaction, response surface and contour plots for each response, constrained optimization problems and desirability approach analysis are being used. Among them, the desirability approach has many benefits like simplicity, flexibility in weighting and giving importance for individual response. In this study, RSM-based desirability approach is used for the optimization of A-TIG process parameter to obtain the maximum DOP. The optimization method is carried out using design-expert software, where the scale of desirability function ranges between d = 0, which implies that the response is completely unacceptable, and d = 1, which implies that the response is more desirable. The goal of the response can be maximum, minimum, in the range, target and/or equal to depending on the nature of the problem. The desirability function for each response can be calculated by the following equations with respect to the goal of the response.
For a goal of minimum, di = 1, when Yi ≤ Lowi; di = 1, when Yi ≥ Highi, and
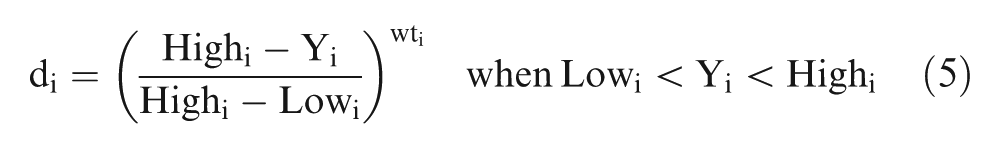
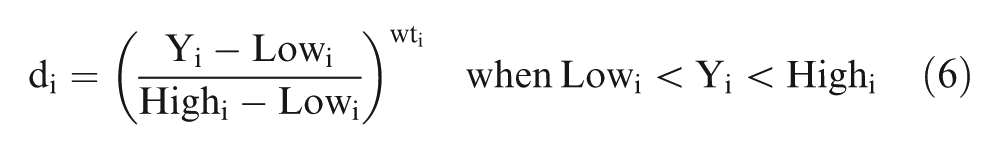
For a goal of maximum, di = 0, when Yi ≤ Lowi; di = 1, when Yi ≥ Highi and
For a goal as target, di = 0, when Yi < Lowi, and Yi > Highi
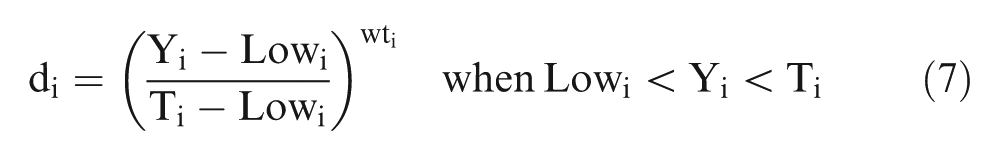
And for the goal within the range, di = 1, when Lowi < Yi < Highi and di = 0 otherwise.
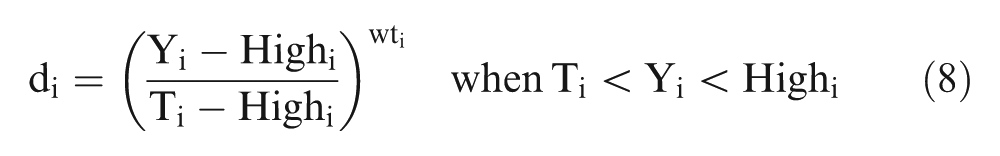
Here “i” indicates the response, “Y” the value of response, “Low” represents the lower limit of the response, “High” represents the upper limit of the response, “T” means the target values of the response and “wti” indicates the weight of the response. The profile of the desirability function can be altered for response by the weight field. Weights can be ranged from 0.1 to 10; a weight greater than 1 provides more emphasis to the goal, weights less than 1 provide less importance. When the weight value is equal to one, the desirability function varies in a linear mode. Solving of multiple response optimizations using the desirability approach involves a technique of combining multiple responses into a dimensionless measure of performance called the overall desirability function, D (0 ≤ D ≤ 1) calculated by
where D is the overall desirability objective function, and n is the number of responses in the measure; each response can be assigned an importance (r), relative to the other responses. Importance varies from the least important value of 1, indicated by (+), the most important value of 5, indicated by (+++++). The high value of D shows the more desirable and greatest functions of the system, which is considered as the optimal solution. The optimum values of factors are determined from the value of individual desirable functions (d) that maximizes the overall desirability objective function (D).
Optimization using desirability approach
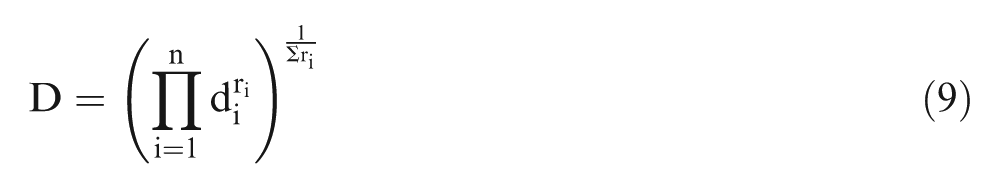
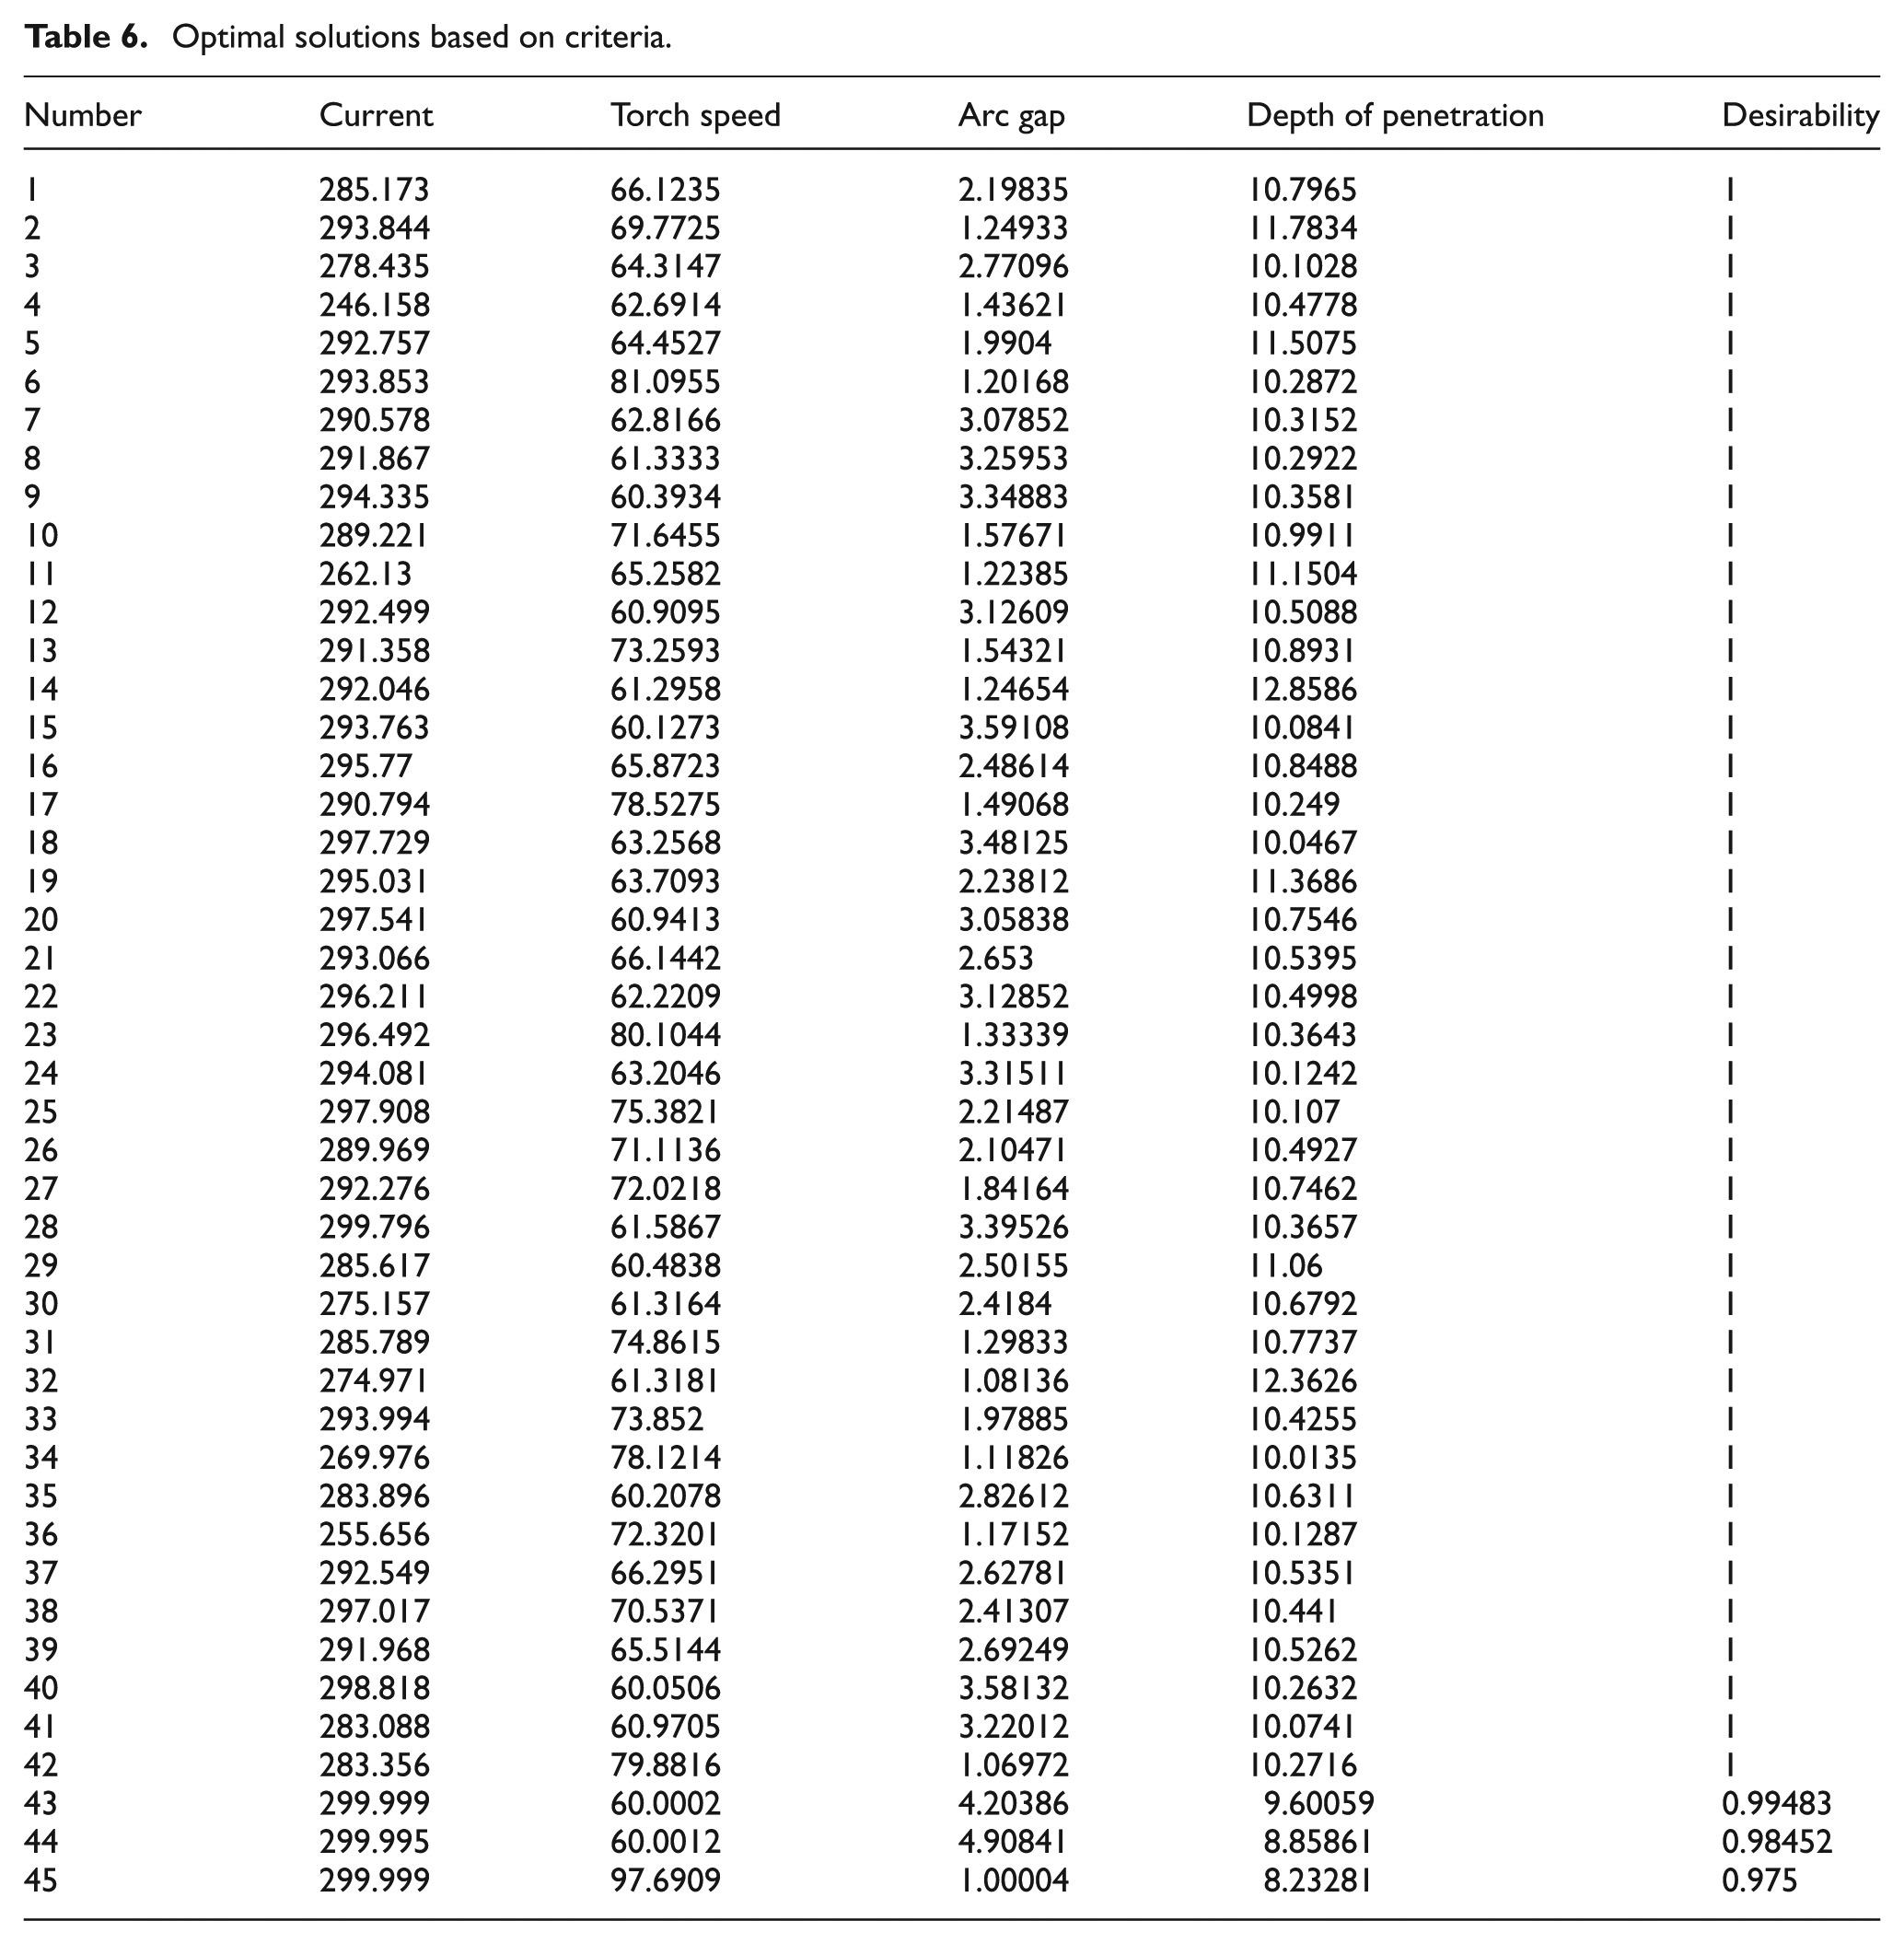
Optimization of process parameters in design-expert software v7 finds for a combination of factor levels that concurrently satisfy essential optimization criteria on each one of the response and process parameters. Numerical and graphical optimization processes are used in this study by selecting the required goals for all parameters and response. The numerical optimization technique combines the goals into an overall desirability function. The numerical optimization aspect in the design-expert software finds one point or more in the factor domain that would maximize this objective function. In graphical optimization with different responses, the design-expert software defines regions where requirements meet the proposed criteria, and overlaying critical response contours are defined on contour plot. In A-TIG welding process, the main aim is to maximize the DOP. Table 5 shows the optimization criteria for generating the optimal solutions. Table 6 shows the optimal solutions which are generated using DOE software based on optimization criteria. The bright yellow area on the overlay plot in Figure 9 shows the regions that met the proposed criteria.
Optimization criteria.
Optimal solutions based on criteria.
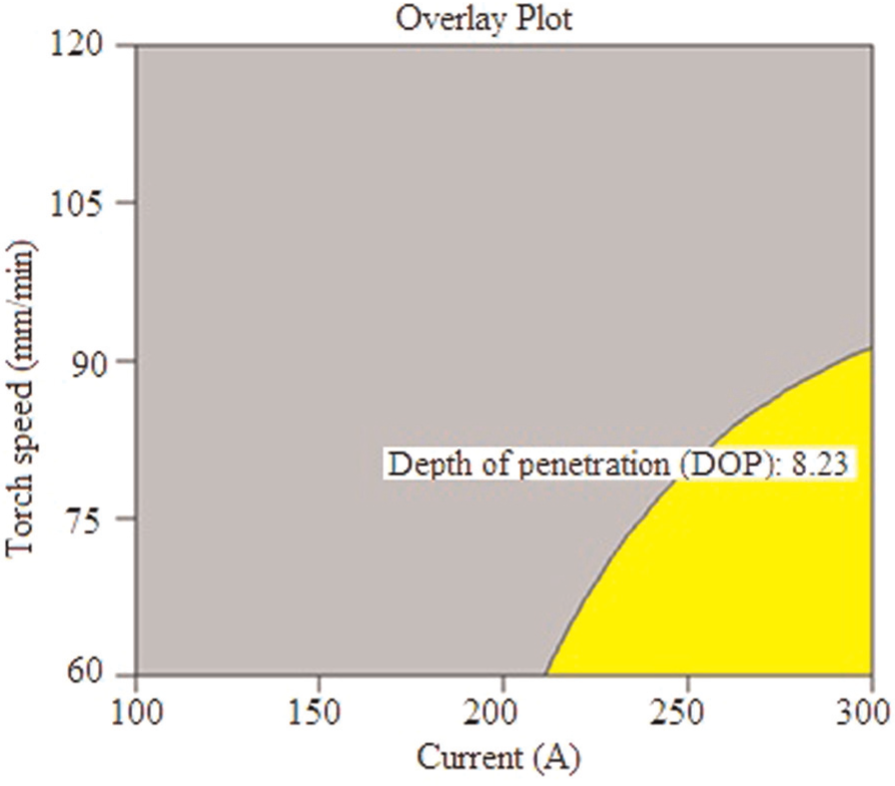
The overlay plot shows the region of the optimal working of welding conditions.
Validation of the optimum solutions identified by the model
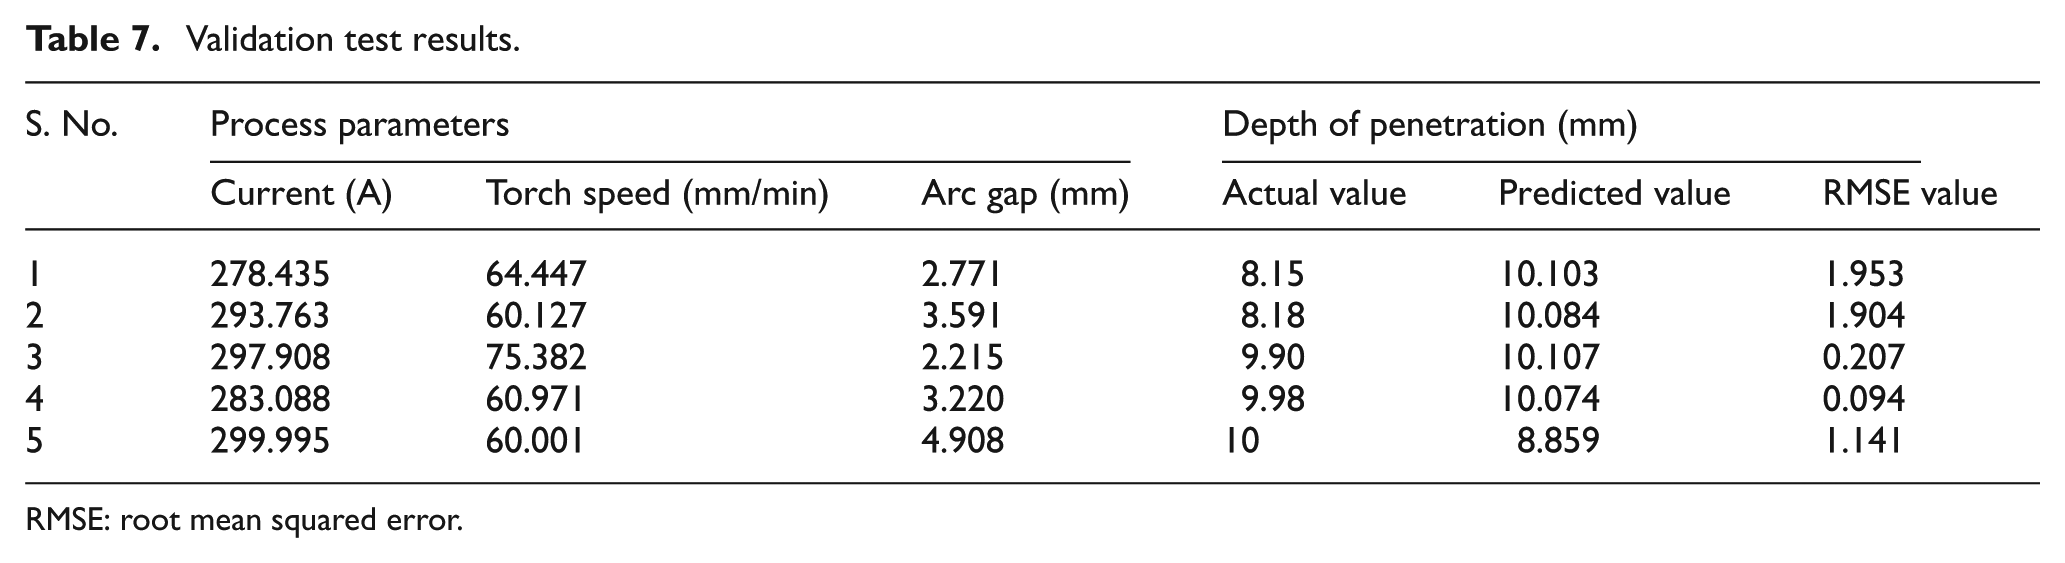
The validation experiments were carried out for the optimal solutions identified in the model for achieving the desired DOP. Randomly, five set of process parameters were chosen from the optimal solutions list for the validation experiments. From Table 7, it is observed that to obtain higher penetration, the current must be higher and the torch speed must be lower. Table 7 shows the actual values of the DOP and model-predicted values, and the calculated root mean squared error (RMSE) for the validation set. The RMSE value shows the minimum difference between the actual and predicted values, which shows the model is fairly accurate. The RMSE value was predicted using the following equation
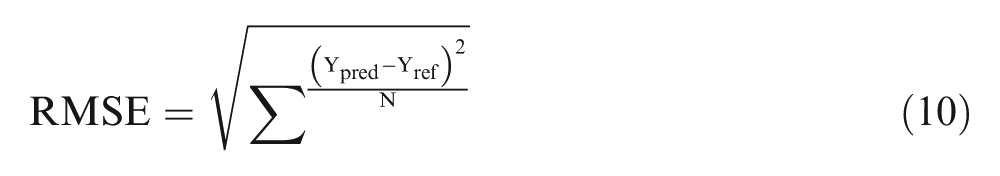
where Yperd is the model-predicted value, Yref is the laboratory measured value and N is the number of samples.
Validation test results.
RMSE: root mean squared error.
Conclusion
The following conclusions are arrived at based on the results of the experiments:
RSM is found to be an accurate technique for optimizing the A-TIG welding process parameters to obtain the maximum DOP of SDSS alloy 2507.
The second-order quadratic model was successfully used to predict the DOP during A-TIG welding of 10-mm-thick SDSS 2507 alloy plates.
The welding current has more effect on the DOP of A-TIG welding of 10-mm-thick SDSS 2507 alloy plates compared to that of the other process parameters.
The optimum solutions identified by the model have been validated, and there was good agreement between the predicted and actual DOP.
The graphical optimization gives the overlay plots, which results in quick visual inspection of the region of feasible response values in the parameters space to select the optimum A-TIG welding process parameter combination.
Footnotes
Acknowledgements
NIT, Tiruchirappalli, and IGCAR, Kalpakkam, are acknowledged for their technical support.
Declaration of conflicting interests
The authors declare that there is no conflict of interest.
Funding
The financial support was granted by the UGC-DAE-CSR Kalpakkam node, Government of India, through project no. CSR-KN/CRS-27/2011-12/639 entitled “Modeling of A-TIG welding of austenitic stainless steels and prediction of residual stresses.”