
Abstract
Formability is an important property requirement in sheet metal forming and mostly useful to automobile and aerospace industries. Every product design starts with finite element simulation before the die design and material selection stage. The forming limit curve along with finite element results acts as tool to investigate whether the design is feasible. Hence, it is of utmost importance that the forming limit curve is accurate over a wide range of strain path. Generally, a forming limit curve is derived from discrete failure strain points corresponding to different strain ratios by fitting a smooth curve. It has been observed from many studies that the generated forming limit curves are devoid of any failure points corresponding to equibiaxial strain path. This is found to be true even when the test conditions are supposed to produce biaxial state of strain. To understand the reason behind this observation, a set of forming limit diagram experiments and finite element analyses were carried out for high-strength interstitial free steel and interstitial free galvannealed steel with three different friction conditions. It was observed that friction plays an important role in right-hand side of the forming limit curve. Finite element results and experimental validation suggest that failure strain points for biaxial strain paths can be obtained only if the tests are conducted with proper lubrication system.
Introduction
A forming limit diagram (FLD) is a diagram containing major/minor strain points, which distinguish between safe points and necked or failed points. The transition from safe to failed points is defined by the forming limit curve (FLC). The formability of sheet metals in complex forming operations is generally limited by tensile instability in the form of localized necking. The maximum amount of strain in sheet that metals can withstand prior to a necking failure is called the limit strain. This is a very important characteristic of sheet metals and is usually represented by the FLD.
The FLD concept was first introduced by Keeler and Backofen. 1 Keeler and Backofen developed the right side of the FLD (i.e. positive minor strain), and Goodwin 2 extended it to the negative minor strain side. As shown in Figure 1, the left side of the FLD consists of negative minor and positive major strains, which represent many strain paths (ratios) from tensile to plane strain tests. The right side of the FLD, as defined by positive minor and positive major strains, covers strain ratios from plane strain to balanced biaxial stretching. 3
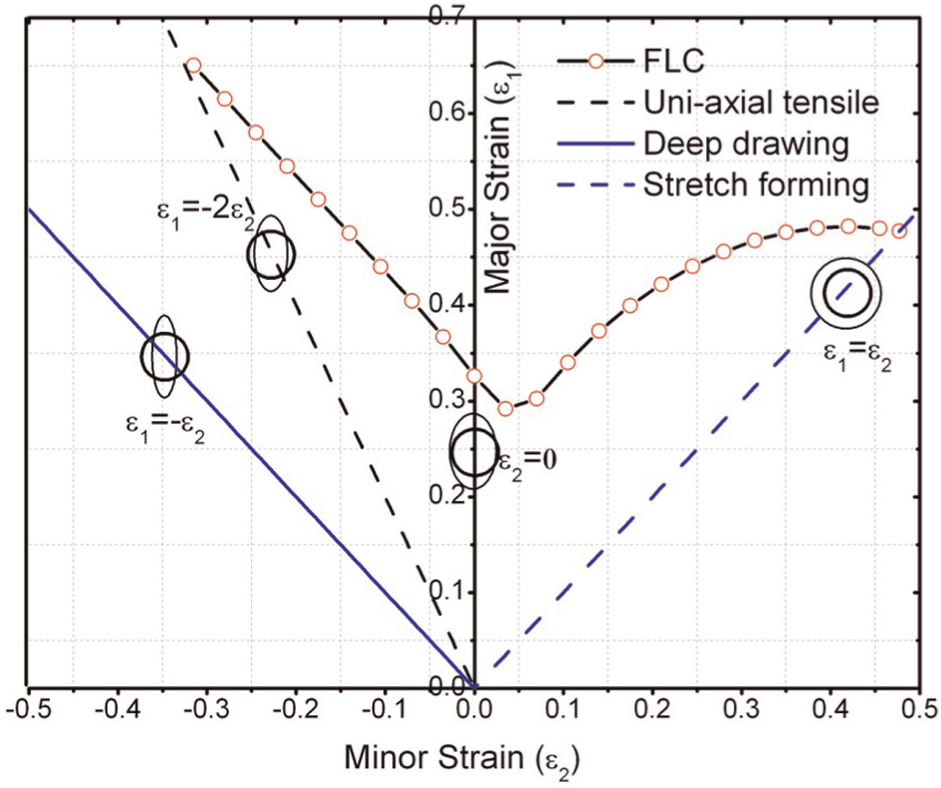
Typical FLC.
The minor versus major strain FLD has been used extensively in the forming industry particularly when working with new materials and dies. Auto-body panel forming is one of the most important manufacturing processes in automotive industry. Intensive efforts have been made continuously for the improvement of panel quality and productivity and for the reduction in manufacturing cost.4,5 Before a production run begins, one blank may be tried out to confirm that the strains in the most severely strained areas are less than the limiting strains. In a complex shape forming, all modes of straining may occur. 6 For a successful forming operation, the strain distribution and the strain history in the severely deformed area are determined. Strains are compared with the limit strains depicted in an FLD. 7
With continuous improvement in material models, today finite element (FE) analysis can predict the large-scale deformation like a forming process very accurately. There results and applicability of an FE simulation often depend on the quality of required material characteristics. An accurate along with the FE prediction of strains can thus be used to predict the possible failure of the material in a sheet metal forming process.
The Nakazima method is characterized by the use of a hemispherical punch and a special lubrication system consisting of an elastic pad, lubrication oil and normally a Teflon foil. Different strain paths (ratios) are realized by changing the width of the strip for rectangular specimen or by altering the size of the notches if circular blanks are chosen for determination of the FLC. 8
Different factors such as strain hardening exponent, anisotropy constant, 9 tool geometry, friction effect, strain rate sensitivity, 10 grain size11,12 and strain path changes12,13 influence the FLDs. Laboratory testing14,15 has shown that the minor strain versus major strain diagram is sensitive to lubrication, sheet curvature, thickness and orientation.
Huang and Cheng 16 studied the influence of lubricant on limitation of formability of cylindrical cup drawing with solid and liquid lubricants and found that the solid lubricant is better than the liquid lubricant in forming. Lovell et al. 17 found increasing formability in forming of complex parts using environment-friendly lubricants. Wang 18 proposed a tribological principle for realizing green metal forming processes. Kim et al. 19 evaluated the effect of tool materials, coatings and lubricants in forming galvanized advanced high-strength steels (AHSS) and determined the critical interface pressure and temperature that initiate lubricant failure and galling in forming galvanized AHSS for a given die material and coating.
At the same time in several literatures,20–22 FLDs are presented that do not depict any failure points in balanced biaxial strain state. In these cases in the right-hand side of the FLD, most of the failure points were observed near the plane strain conditions. This is the case even when a larger sample width has been used, which should represent a balanced biaxial strain path. The reason for not achieving balanced biaxial strain points was not discussed in these studies.
Thus, the major objective of this study is to investigate the effect of tribo system in generation of the FLC. Toward this, experiments have been conducted with three different tribo conditions using high-strength interstitial free (HIF) steel and interstitial free (IF) galvannealed steel. Furthermore, the role of lubrication on limit strain and the location of fracture in the dome are examined. Also, the strain path experienced by a material point is determined from FE simulation, and the observed failure points during the experiments are rationalized based on the simulated deformation history.
Experimental procedures
The mechanical properties of the HIF and IF galvannealed steel sheets were obtained by uniaxial tensile test. Uniaxial tensile test is conducted as per American Society for Testing and Materials (ASTM) E8 standard (ASTM E8/E8M-11:2011 23 ) and the test is carried out in a servo-mechanical tensile test system. The flat specimen of 50 mm gauge length is tested at a fixed strain rate of 10−3 s−1 (i.e. cross-head velocity of 5 mm/min). The mechanical properties obtained from tensile test are shown in Table 1 and the longitudinal and transverse strains are measured simultaneously through a video extensometer during tensile testing. Load is measured by inbuilt load cell attached to servo-mechanical tensile testing system. Engineering stress is calculated by dividing the load with initial cross-sectional area. True stress is calculated from engineering stress by assuming the isochoric deformation.
Mechanical properties.
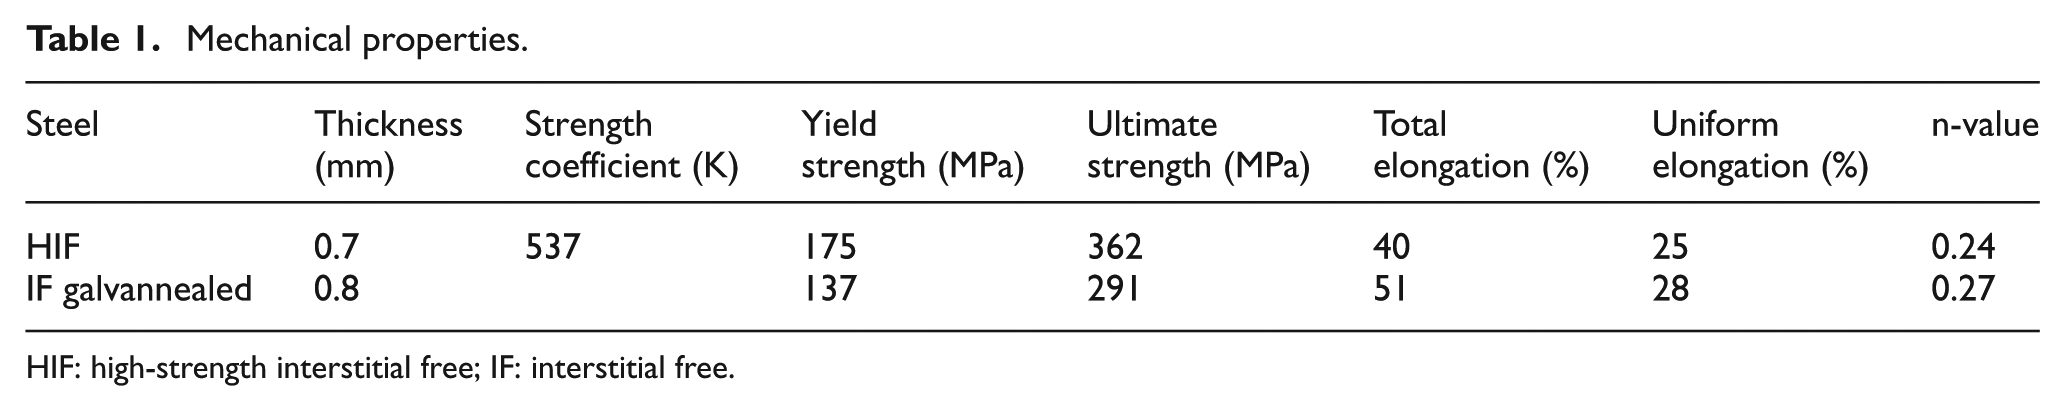
HIF: high-strength interstitial free; IF: interstitial free.
FLCs are generated for HIF and interstitial galvannealed steel grades by Nakazima test procedure (out-of-plane test) 24 according to ISO standard (ISO 12004-2:2008 25 ). The experiments are carried out on a double-action servo-hydraulic forming press. The press is capable of delivering a maximum of 600 kN punching force and 700 kN blank holding force. During the tests, different states of strains are generated by varying the width of the sample. All the samples have a fixed length of 200 mm and the width varied between 25 and 200 mm in steps of 25 mm. Specimens are prepared by shear cutting, and side edges are polished to remove extra edges. Here, the length 200 mm represents the rolling direction. For each blank width, at least three specimens are tested to get maximum number of data points. After test, the center-to-center distance of these dots is measured to calculate major and minor strains.
Two different lubrication systems were used for HIF steel sheets. The first case consists of polyethylene (PE) pad combined with Teflon foil and in the second case only Teflon foil was used. Lubrication systems used for IF galvannealed steel sheets are Teflon foil and rust preventive (RP) oil.
For this work, a hemispherical punch with diameter of 101.6 mm is used. The speed of the punch of 1.0 mm/s is maintained for all the experiments. The test finish criterion (onset of necking) is automatically detected by a drop in load, which stops further punch advance, as shown in Figure 2.
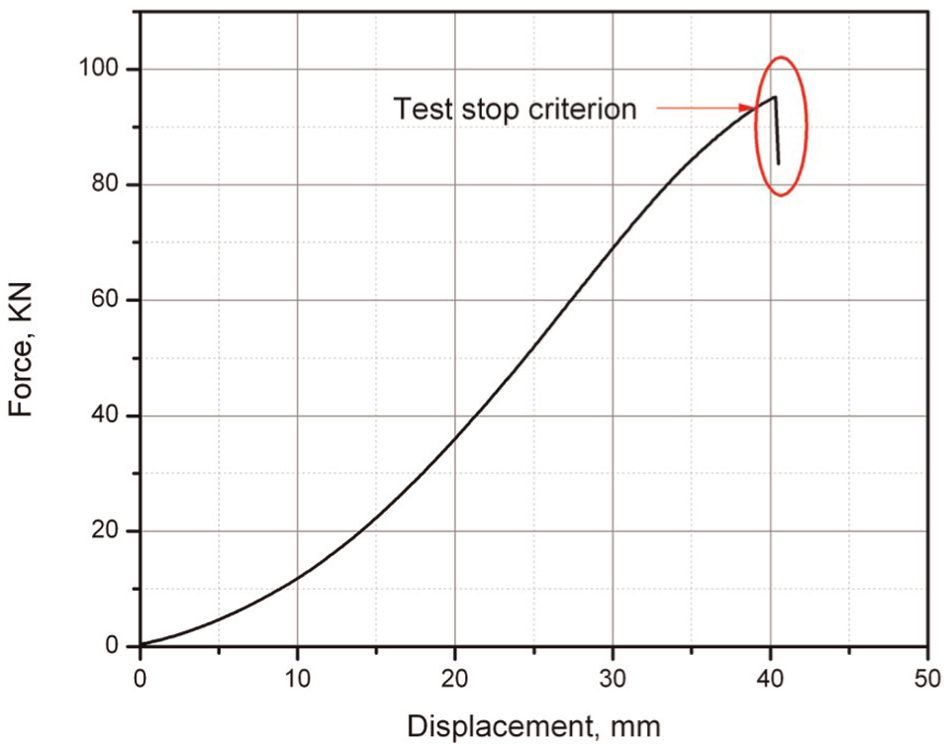
Test stop criterion-based punch load drop.
In this work, the major and minor strains are measured using optical three-dimensional (3D) forming analysis system ARGUS, as shown in Figure 3. 26 The limiting strains are obtained from strain measurement near the fractured region. Finally, FLC is drawn by plotting the minor limit strain component along the abscissa and the corresponding major limit strain component along the ordinate and by drawing a curve that separates the safe region from the unsafe region. The function is fitted through the FLC points using the least square algorithm.
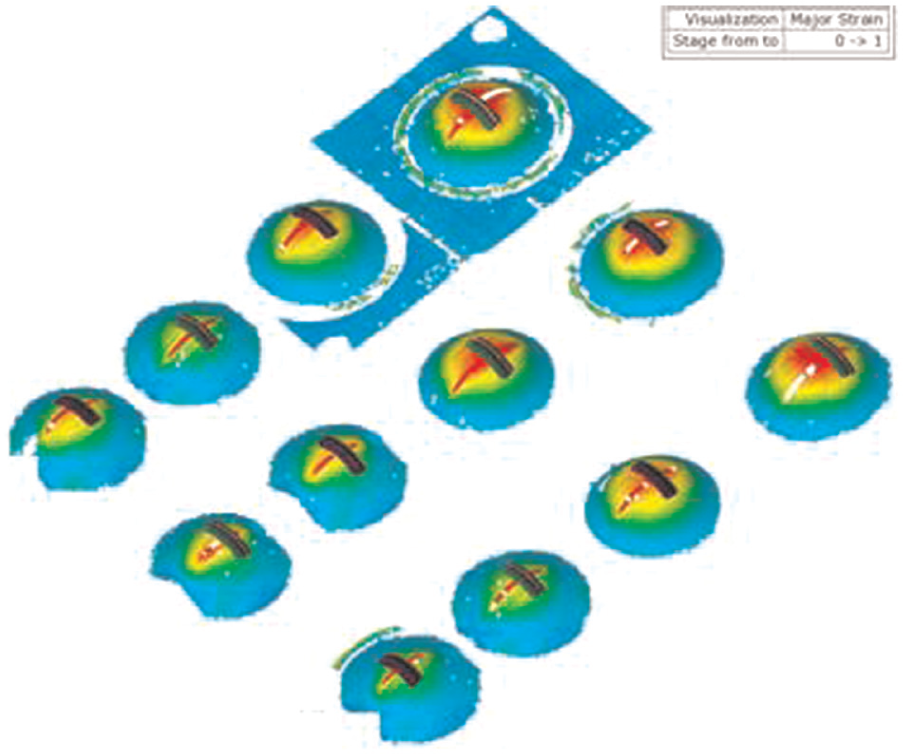
Strain measurement using ARGUS.
To understand the effect of friction on strain path and failure location, tests are conducted with three different tribo conditions, namely, PE pad combined with Teflon foil, Teflon foil and RP oil, as shown in Figure 4. After fracture, the location of fracture and limit strains are compared for different lubrication conditions.
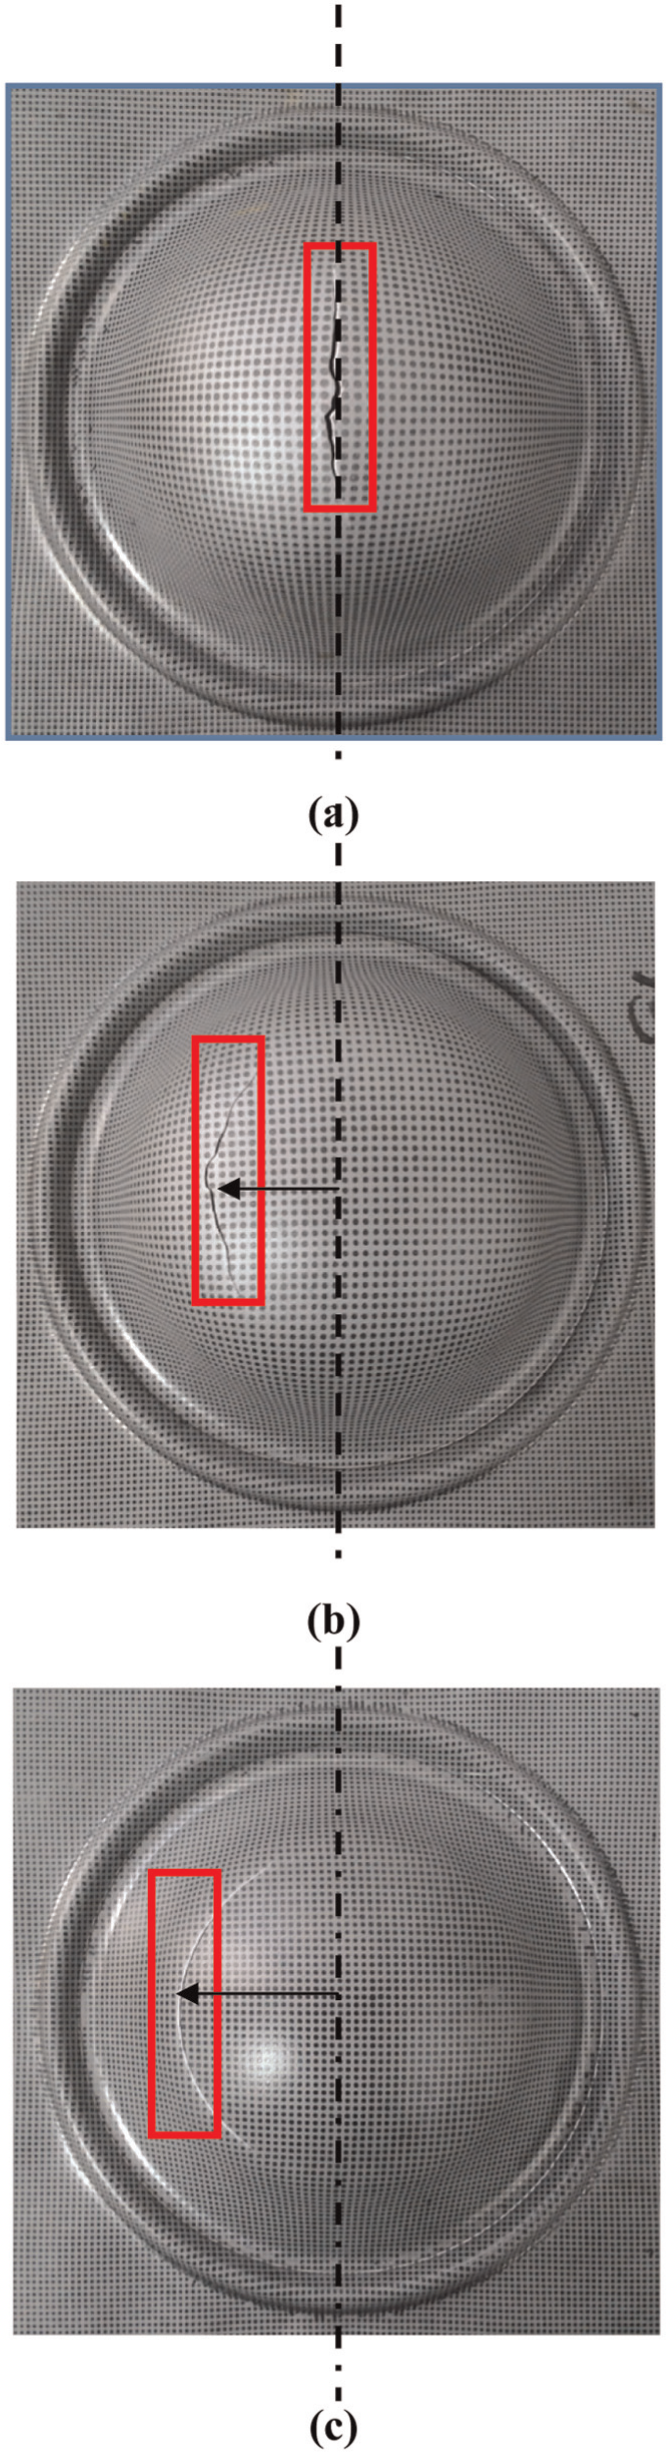
True specimen after experiment: (a) PE pad with Teflon, (b) Teflon and (c) RP oil.
FE simulation of stretch forming
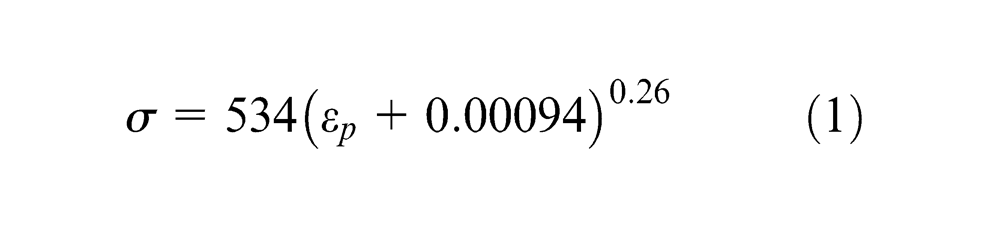
Measurement of strain path is not possible in experiment without continuous monitoring of deformation, so it was decided to simulate the process using FE method with varying friction condition, and the strain paths near the failure regions were determined. A commercially available FE tool, PAM-STAMP 2G, is used for this purpose. An FLD generating tool consists of die, blank holder with draw bead and hemispherical punch, which are modeled as rigid body (Figure 5). The input material properties were obtained from tensile test. The engineering stress–strain data were converted to true stress–strain curve and the flow curve was obtained in the form swift equation as shown in equation (1) and in Figure 6 for IF galvannealed steel sheet
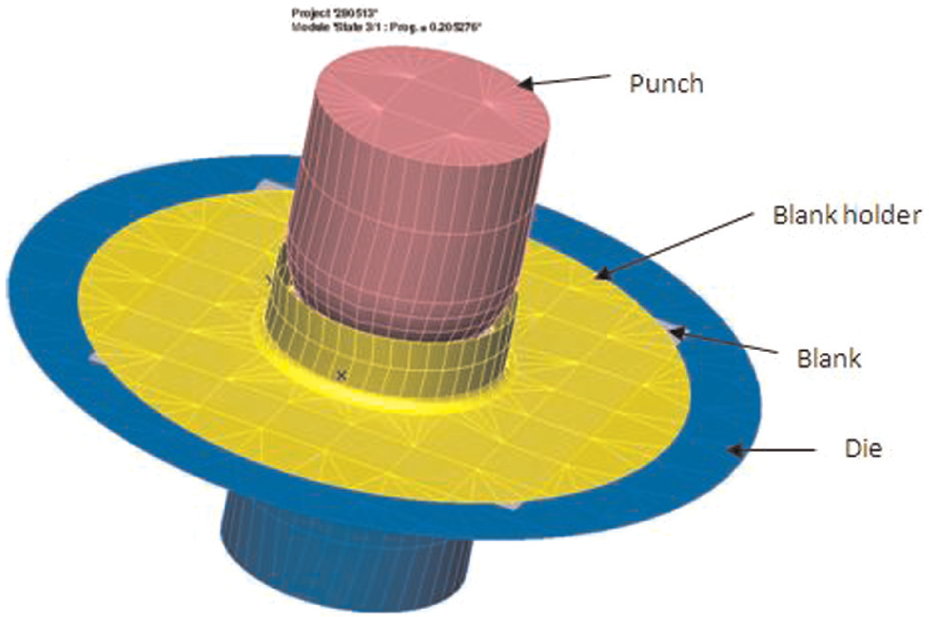
FE model of tool setup.
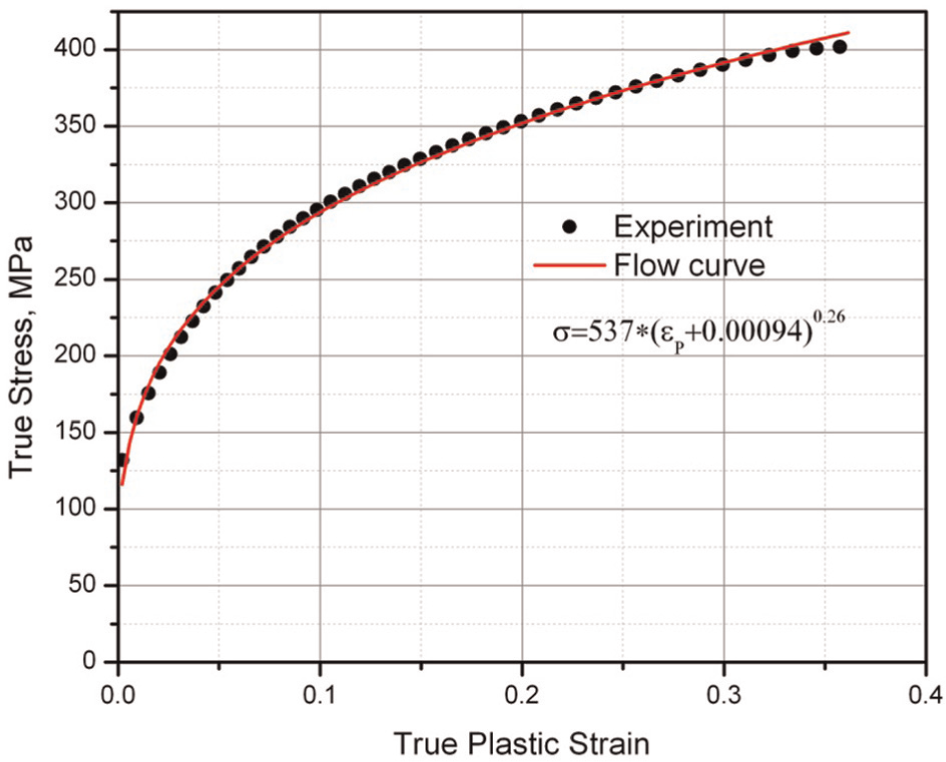
Flow curve for interstitial galvannealed steel.
Sheet blank is modeled using shell element. The minimum element size used in the analysis is of 3 mm. Accurate contact type with Coulombs law is used. 27 The mechanical properties of the steel grades are listed in Table 1. Figure 5 shows the true stress–true plastic strain and its flow curve for IF galvannealed steel, which is used for FE simulation as input material property. The Hill 48 criterion coupled to an isotropic hardening law was used (equations (2) and (3)). Only the anisotropy through the thickness is taken into account, so only one average value r independent of the direction is needed
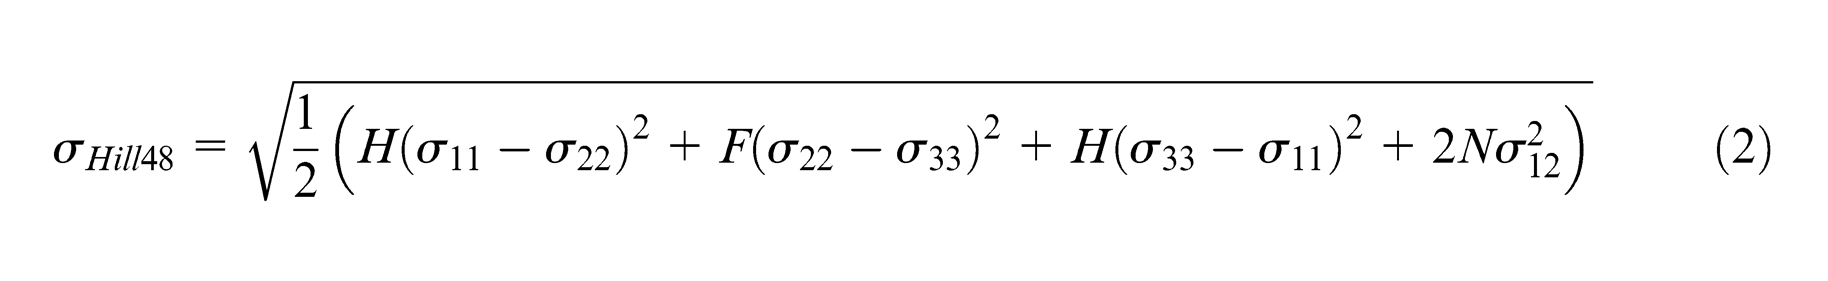
Under the assumption of planar anisotropy

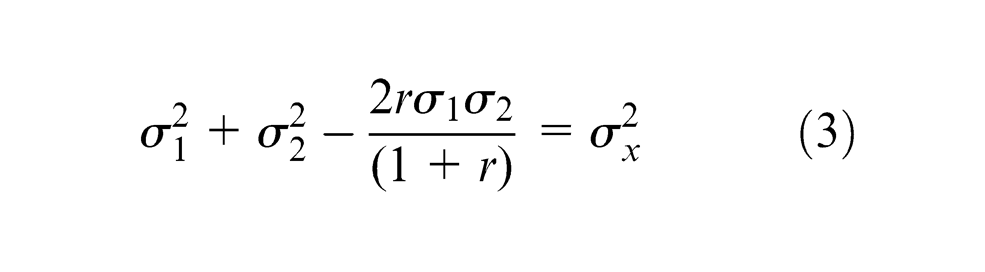
σ 1 and σ2 are the principle stresses and r is the anisotropy parameter.
Simulations were performed with three different friction coefficient values 0, 0.06 and 0.12. Assumptions made that PE pad with Teflon gives nearly zero friction coefficient; Teflon foil alone provides value of 0.06. Furthermore, a linear friction test was conducted and it was observed that the RP oil corresponds to a friction coefficient of 0.12. 28 In all the cases, the simulations were terminated after the dome achieved a height of 50 mm. The failure locations were analyzed with the help of Keeler FLC and also strain path was monitored from start to end of the test.
Result and discussion
In order to show the effect of friction on the limit strains, FLCs for HIF and IF galvannealed steel grades are presented in Figures 7 and 8, respectively, corresponding to different friction conditions. In both the experimental FLCs, it was observed that the influence of friction is negligible on the left-hand side of FLC, but in right-hand side it has significant effect. Particularly, the balanced biaxial strain path is not achieved at all in the case of medium (Teflon foil) and higher friction (RP oil). For example, it can be seen from Figure 7 that when PE pad combined with Teflon foil is used as lubrication, a limiting major and minor strains of 0.4 is achieved, which corresponds to balanced biaxial strain path. This strain path was achieved using a sample size of 200 mm × 200 mm. On the contrary, the same sample size yielded limiting major and minor strain components of 0.45 and 0.25, respectively, when Teflon foil alone is used. Similar trend can be observed in Figure 8, which depicts the effect of Teflon foil and RP oil on the FLD.
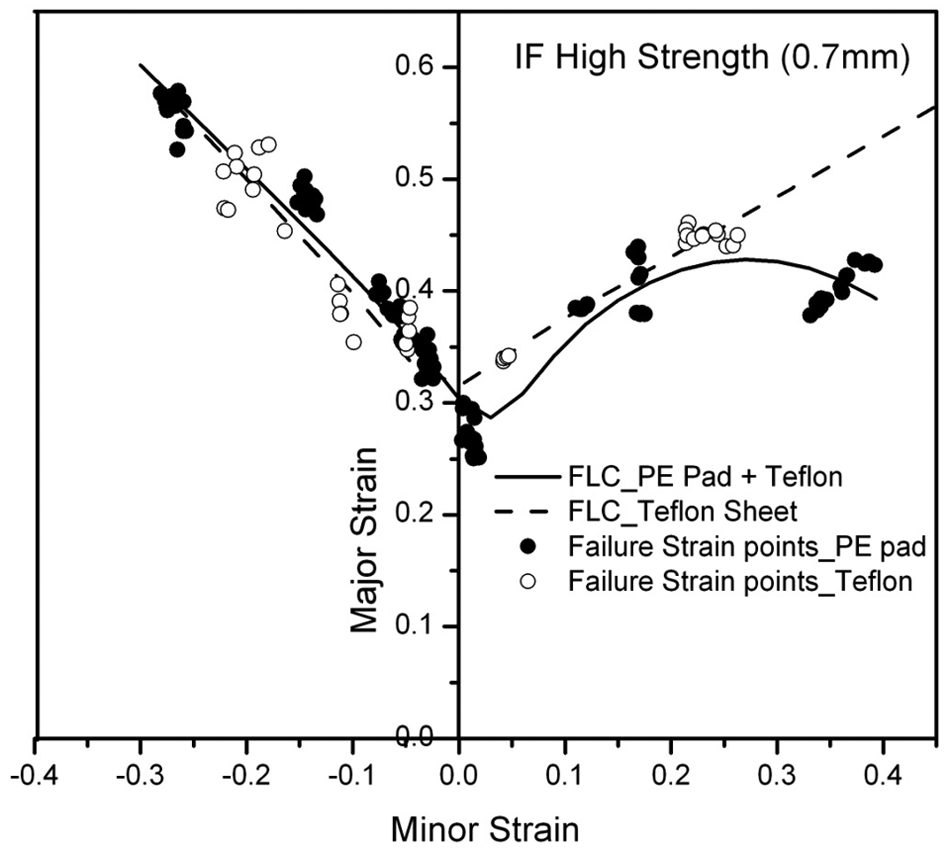
FLC for high-strength IF steel.
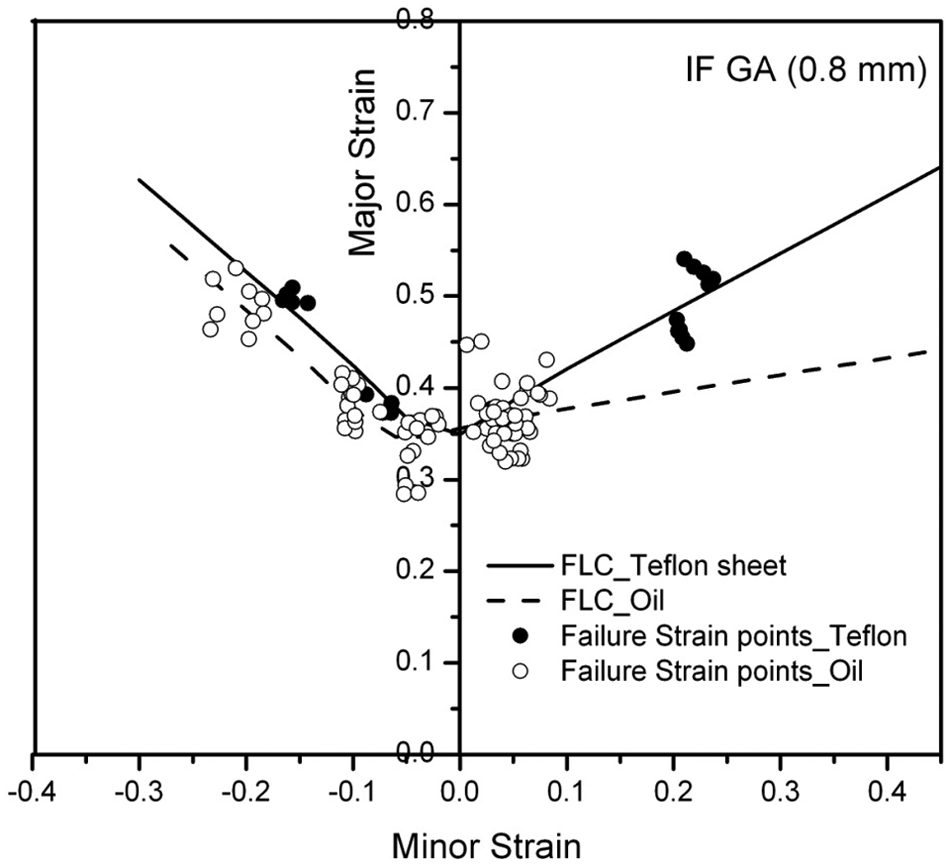
FLC for IF GA steel.
In order to understand the effect of friction on limiting major and minor strains, only the stretch forming experiments were performed with three different lubrication conditions for the same sample size (200 mm × 200 mm). The limiting strains from these experiments were measured with the help of optical 3D forming analysis system software ARGUS. The contours of computed major strain component are shown in Figures 9(a), 10(a) and 11(a).
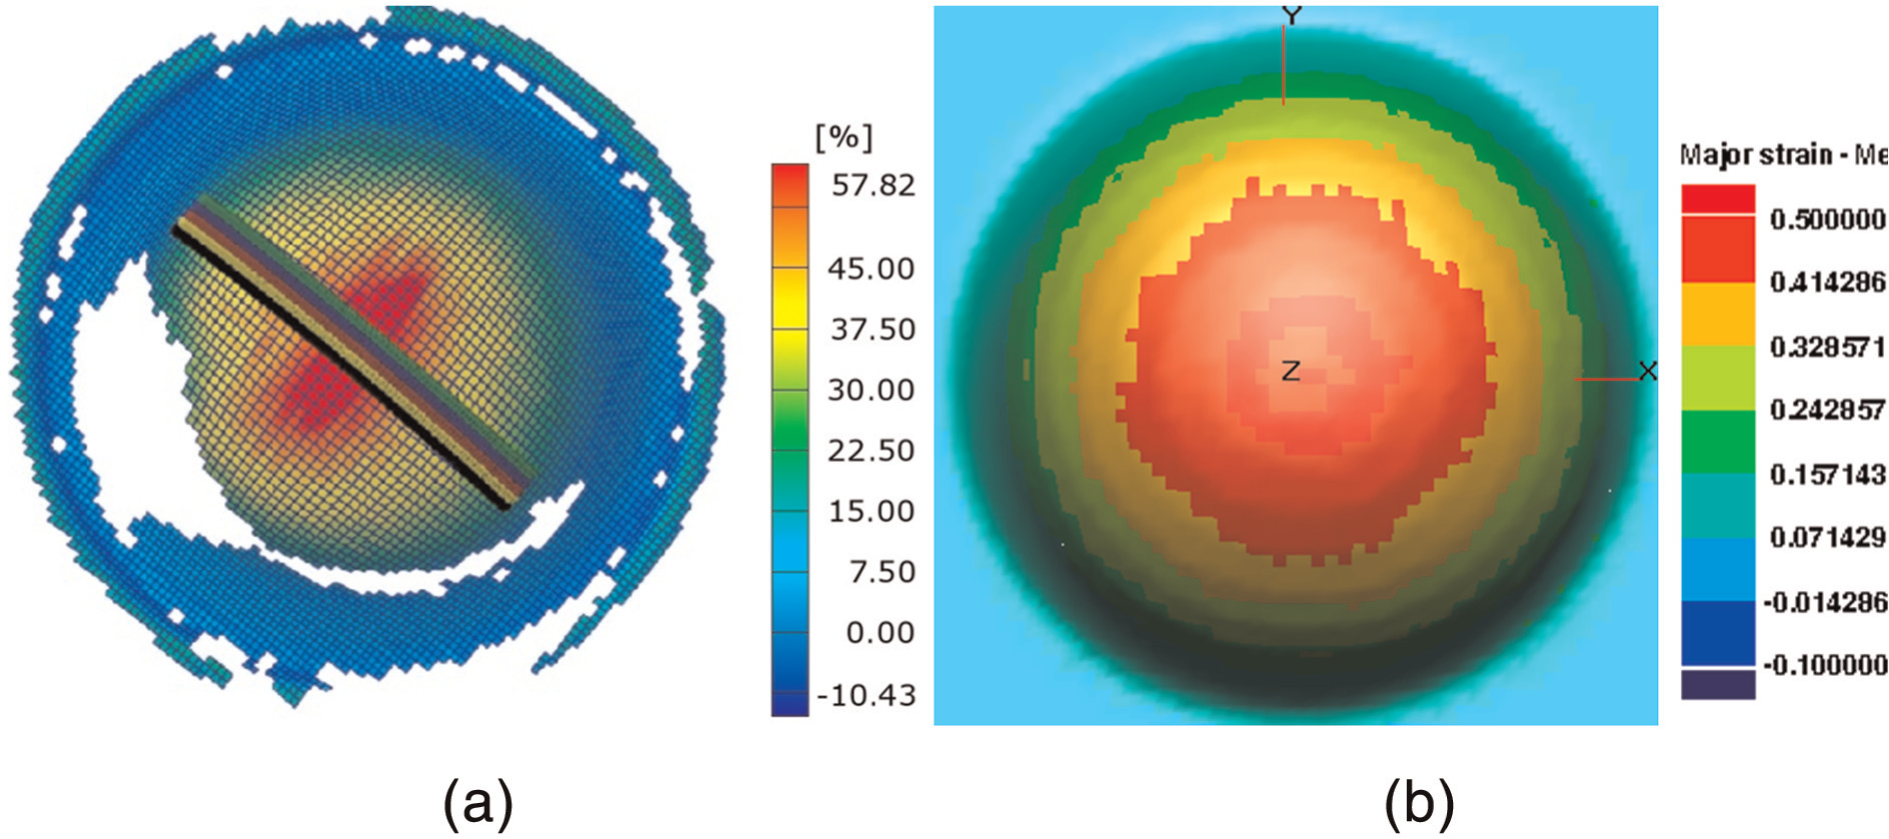
Critical location in stretch forming with PE pad with Teflon: (a) experiment and (b) FE result.
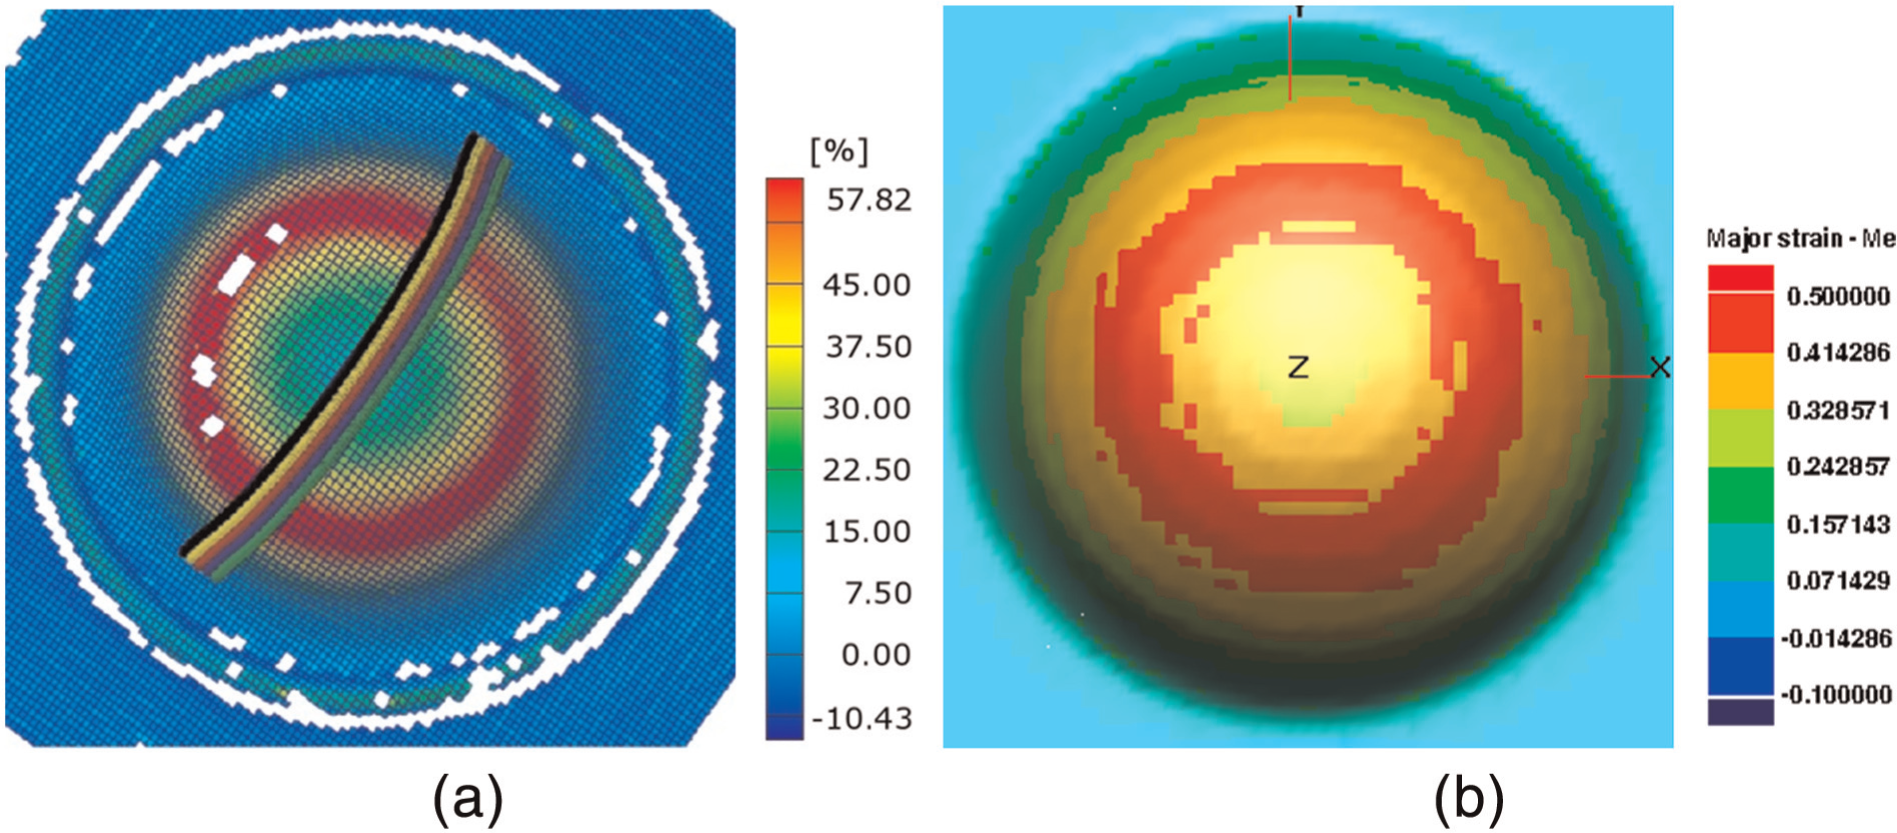
Critical location in stretch forming with Teflon foil: (a) experiment and (b) FE result.
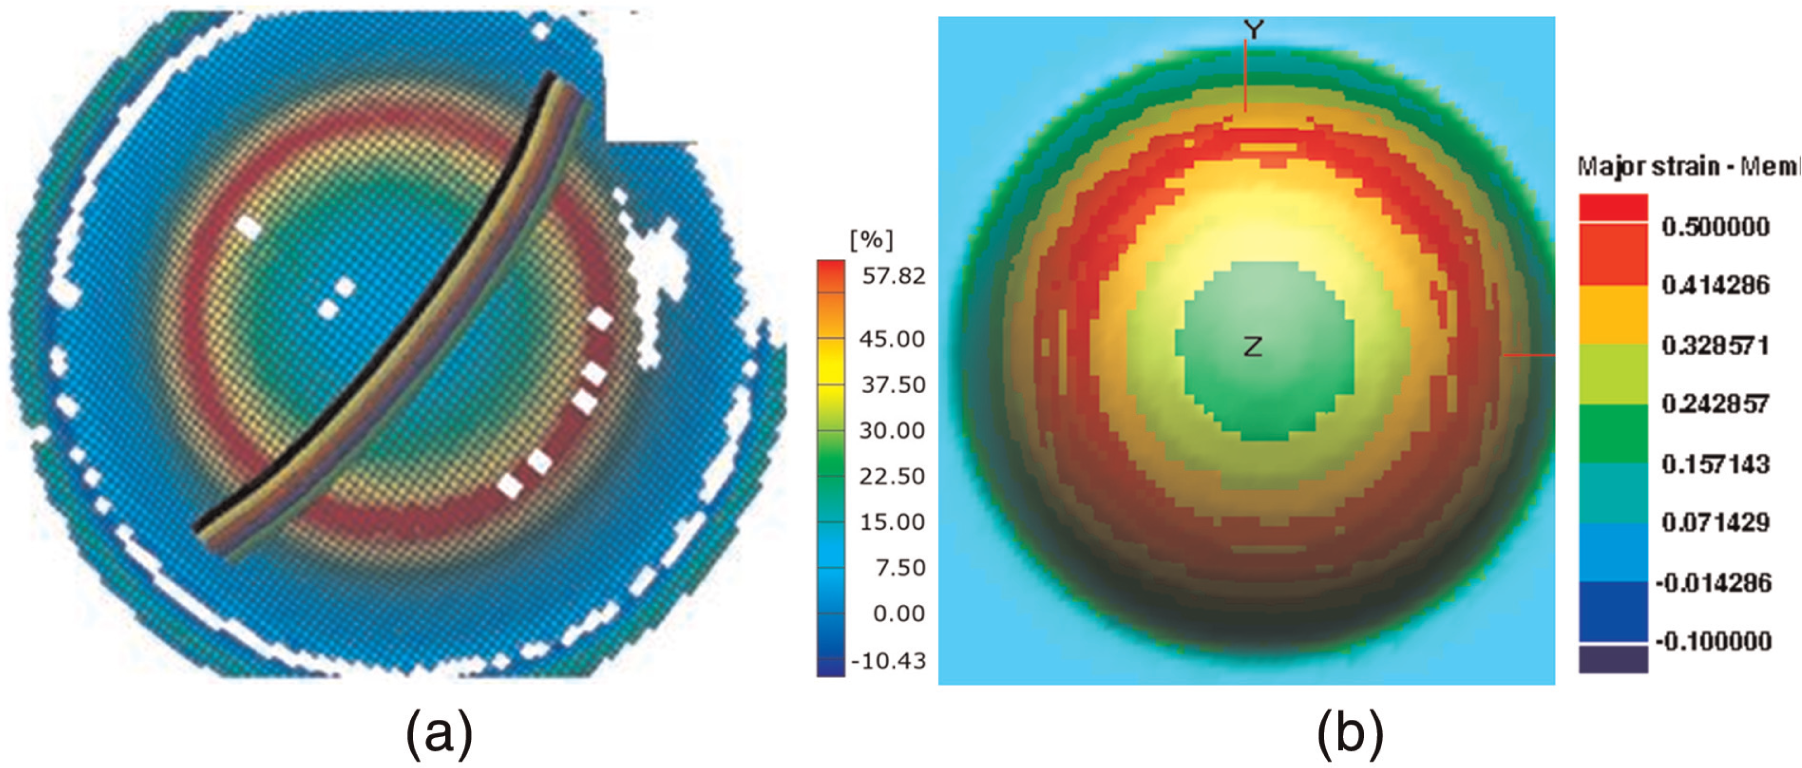
Critical location in stretch forming with RP oil: (a) experiment and (b) FE result.
In order to investigate the strain path experienced by the critical regions for different friction coefficients, FE simulations of stretch forming process were also performed. The contours of major strain components obtained from these analyses are shown in Figures 9(b), 10(b) and 11(b).
During stretch forming experiment, it was found that when PE pad combined with Teflon foil is used, failure always occurs at the apex of the dome (Figure 9(a)). In case of Teflon foil alone, failure occurs near the pole (Figure 10(a)), whereas when RP oil is used, fracture region shifts to the pole of the dome (Figure 11(a)). The same trend was observed in FE simulation. For the chosen friction coefficient values of 0, 0.06 and 0.12, the critical region in dome test becomes apex (Figure 9(b)), near pole (Figure 10(b)) and on the pole (Figure 11(b)), respectively.
In order to bring one-to-one correspondence between the experiments and simulations, the experimental and simulated major and minor strain distributions along the azimuthal direction are shown in Figures 12–14. It can be seen from these figures that the different lubrication systems are well represented by varying the frictional coefficient in the FE analysis. Thus, it is evident that friction plays a key role to decide the location of the crack and strain path of the critical location.
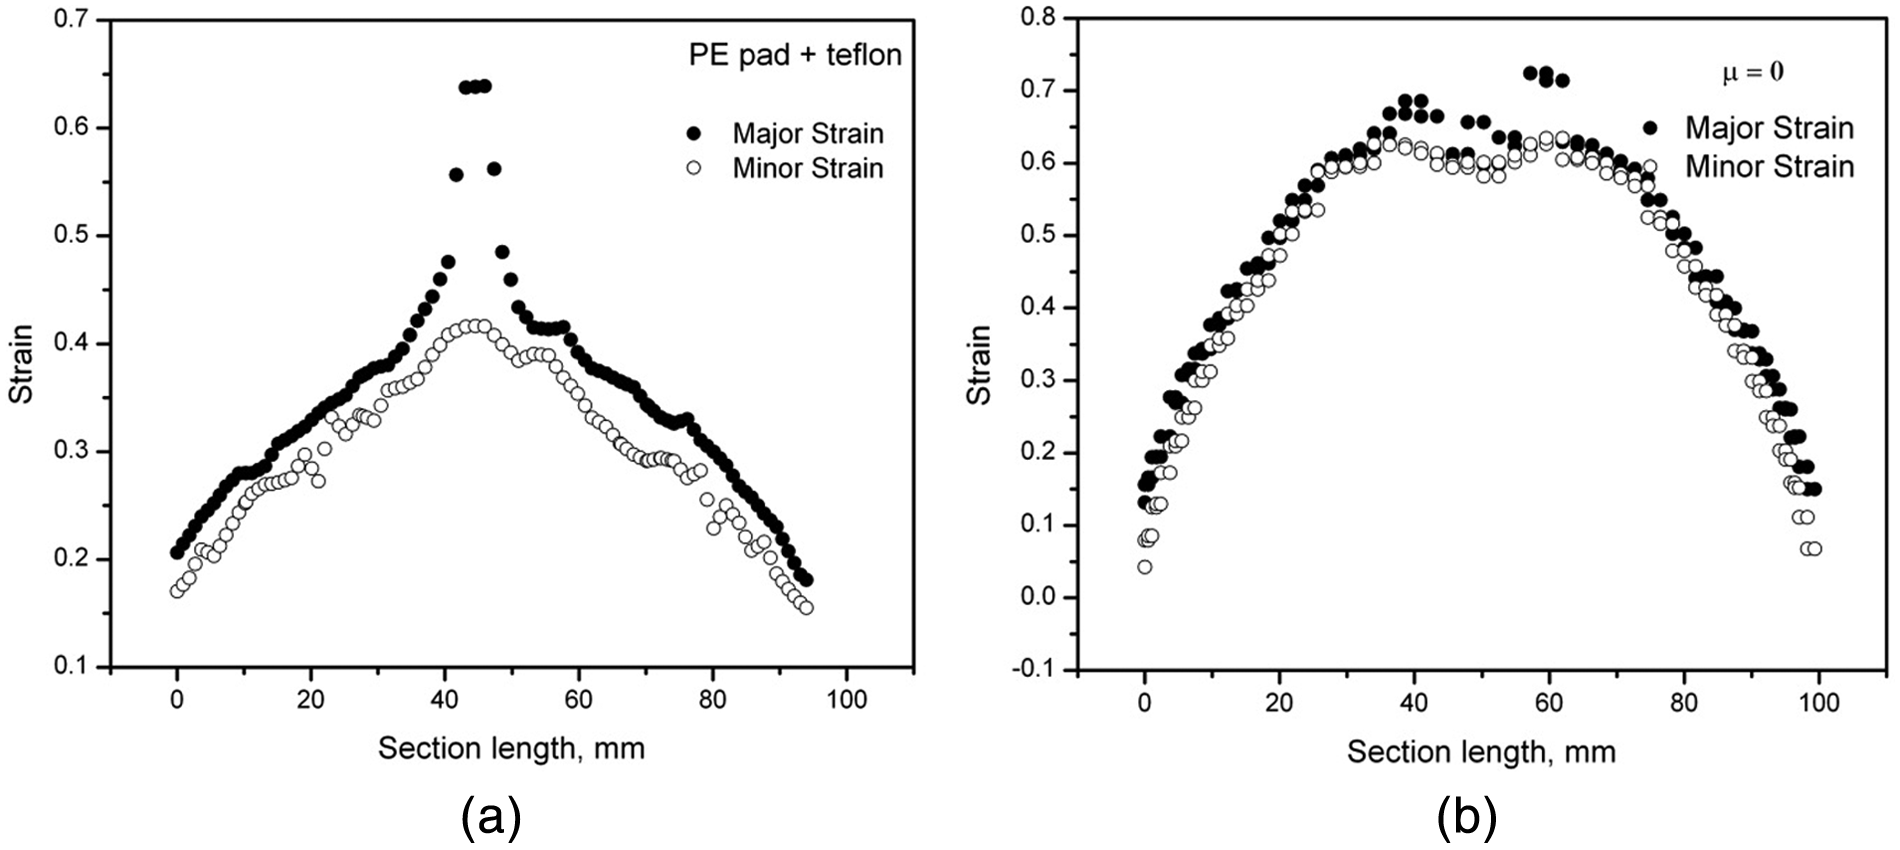
Major and minor strain distribution with PE pad with Teflon: (a) experiment and (b) FE result.
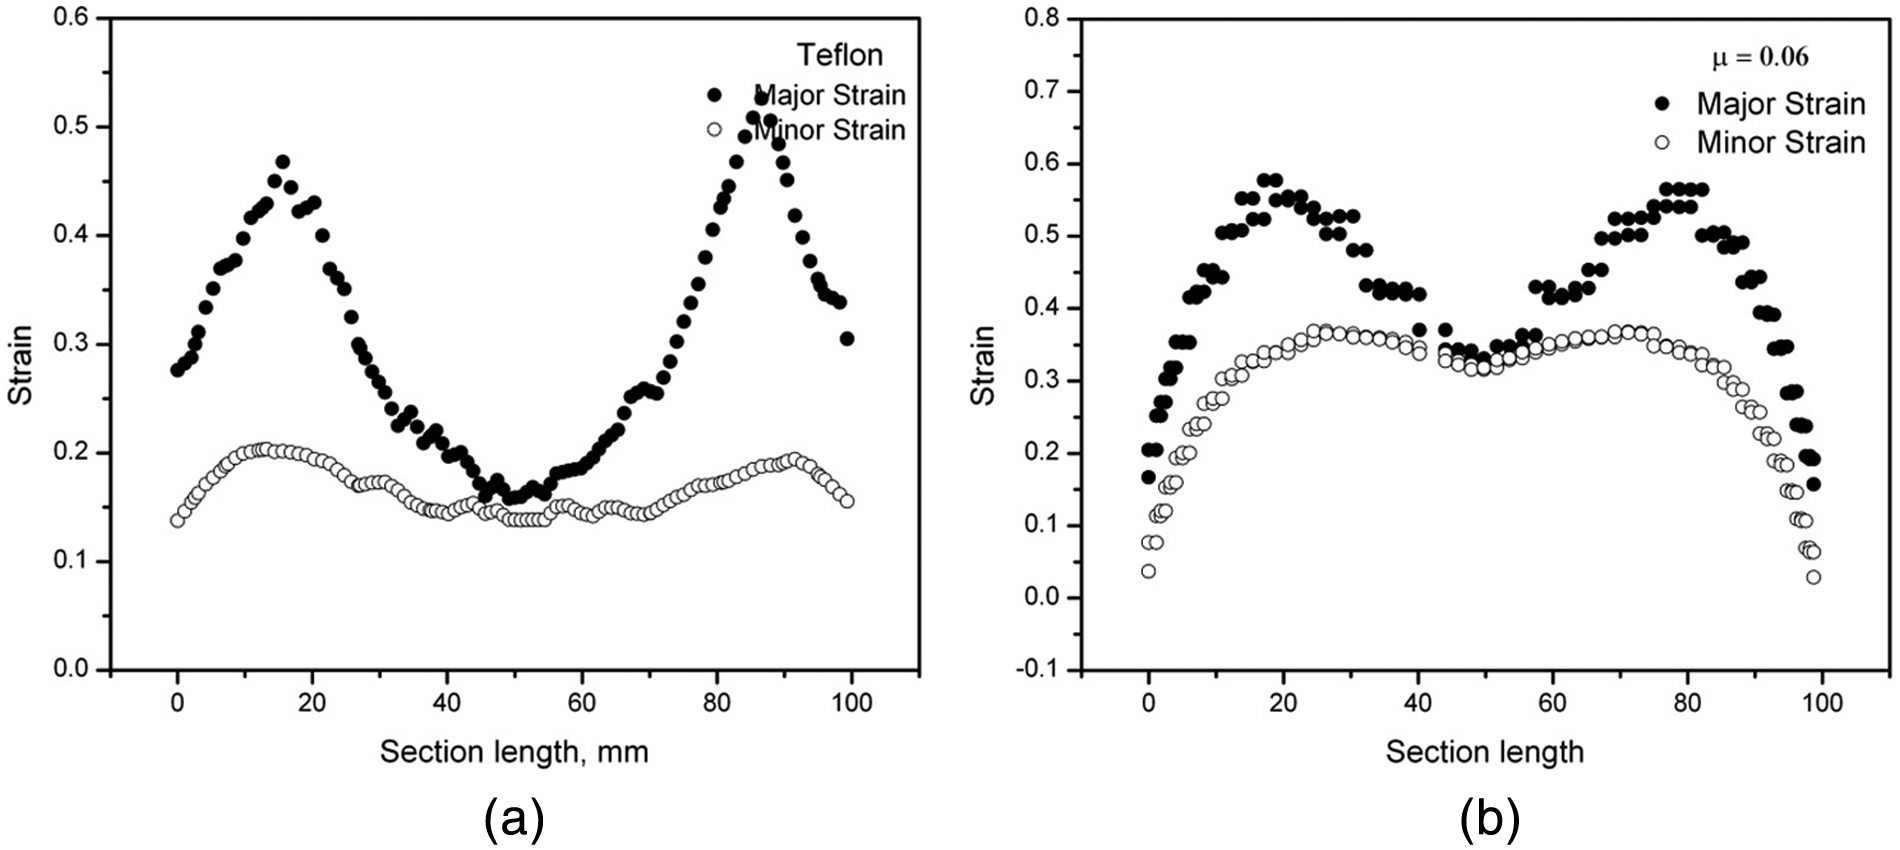
Major and minor strain distribution with Teflon: (a) experiment and (b) FE result.
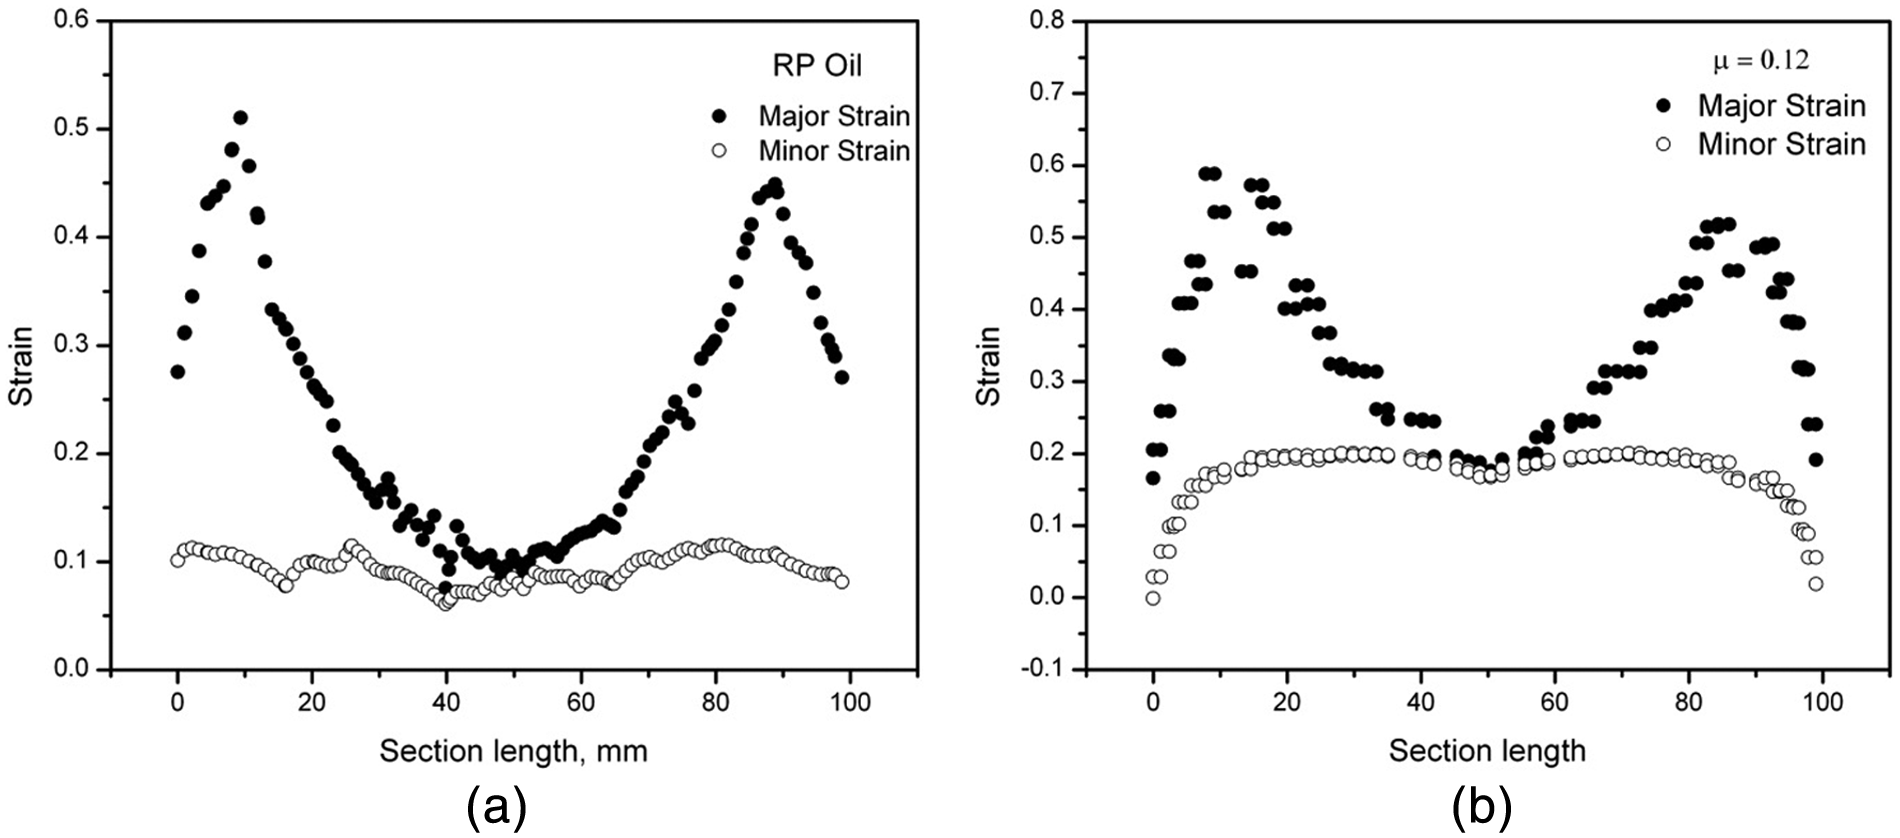
Major and minor strain distribution with RP oil: (a) experiment and (b) FE result.
From the results of simulated strain profile as shown in Figure 1, it is clear that for the friction-free condition, major and minor strains reach their peaks at the apex and are equal, which is nothing but balanced biaxial strain state. With increase in friction coefficient corresponding to Teflon (0.06) and RP oil (0.12), the location of peak major strain moves further away from the apex toward the pole. Also, at this location, the major strain is greater than minor strain.
The calculated strain paths at the critical regions obtained from the simulations for different friction conditions are superimposed on Keeler FLC in Figures 15 and 16. It is clear from this Figure 15(a) that in stretch forming (for the same sample size), an increase in friction coefficient from 0 to 0.06 and 0.12 changes the strain path at critical region from balanced biaxial state to near-plane strain condition. Similar observation was made also in Moshksar and Mansorzadeh. 29 It is to be noted that, however, the location of the limiting strain shifts from apex to near pole or vice versa with respect to friction condition, but the strain path on the apex always follows balanced biaxial mode of deformation. This observation explains why balanced biaxial limit strains were not obtained in our experiment presented in Figure 8 where the lubrication system does not represent an ideal friction-free condition.
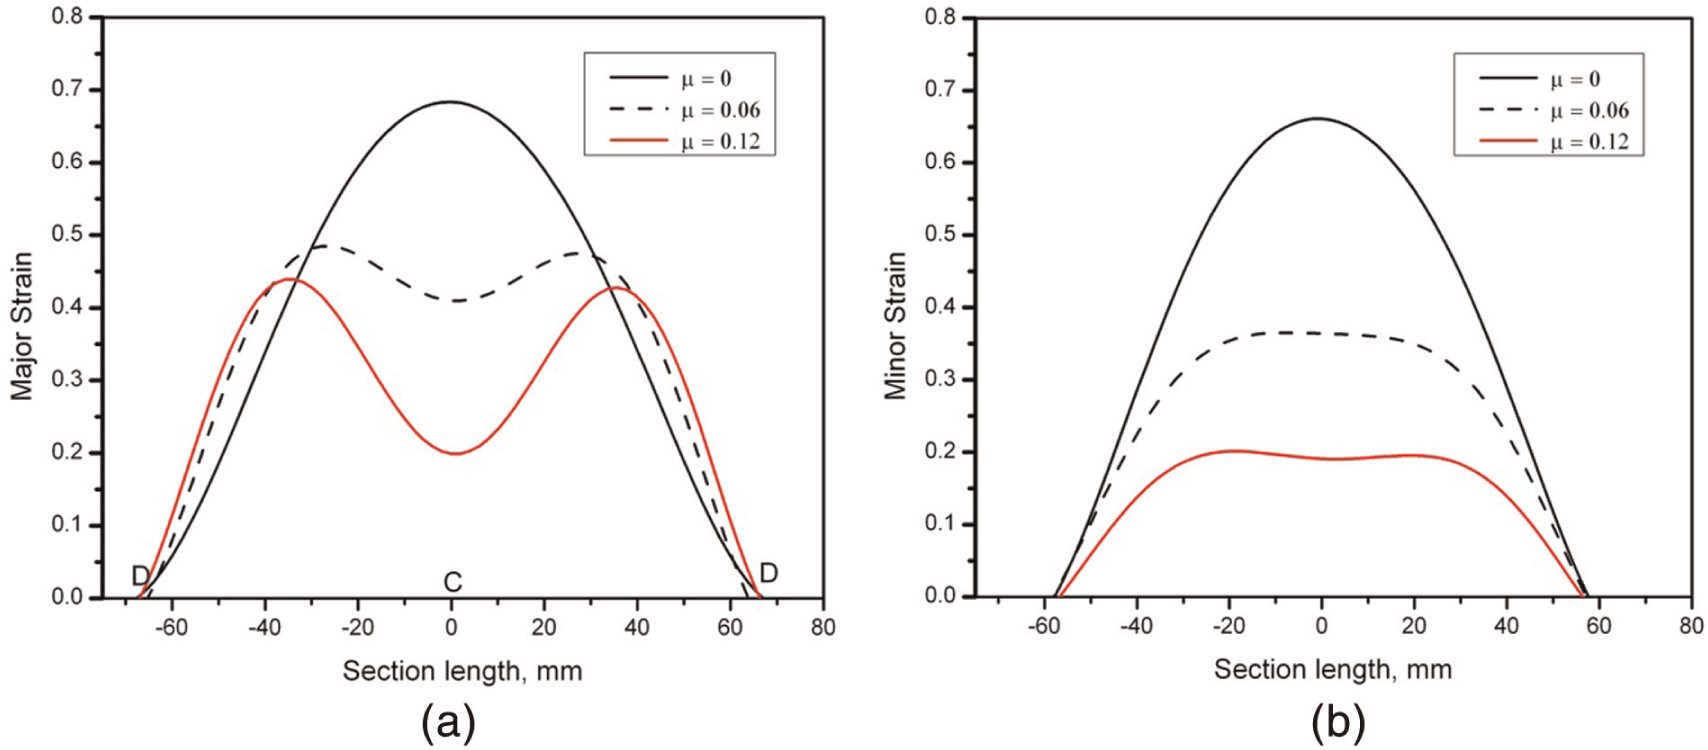
Strain profile in stretch forming: (a) major strain and (b) minor strain.
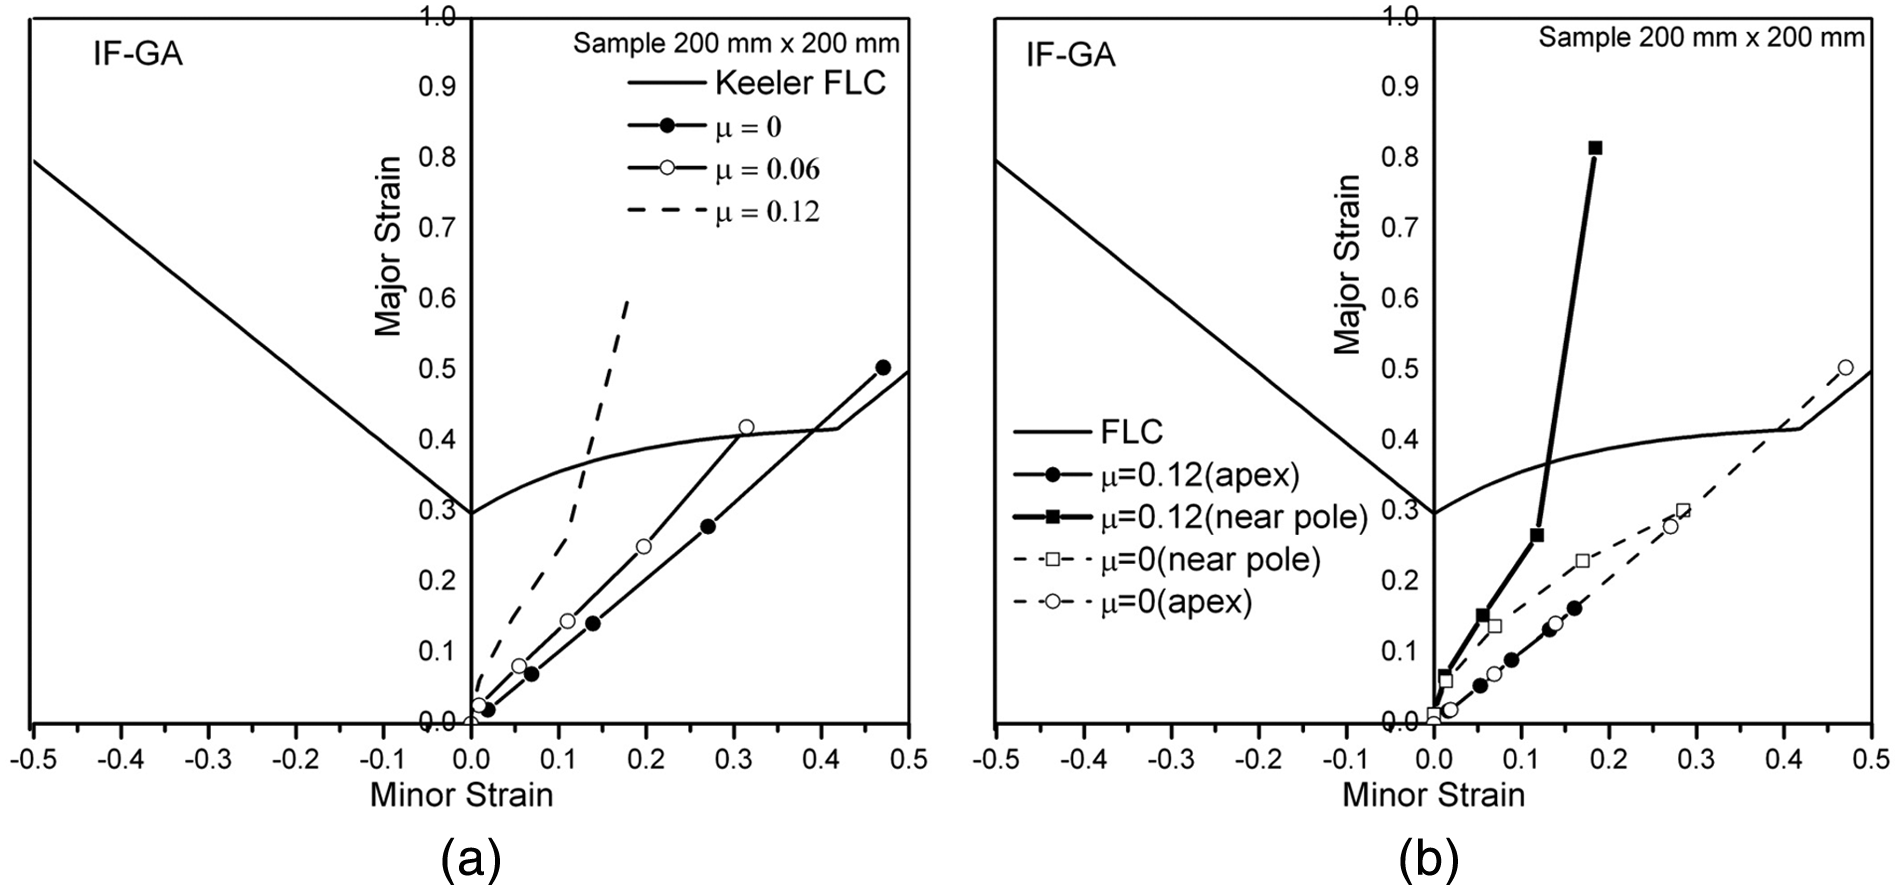
(a) Critical strain path in stretch forming with different friction levels and (b) strain paths in stretch forming in apex and near pole with different friction levels.
Conclusion
In this study, FLCs are generated for HIF and IF galvannealed steel grades with three different lubrication conditions. Also, FE analysis was performed for stretch forming process with three different friction conditions and compared with experiment. The effect of friction on the left side of FLC is found to be minimal, but on the right-hand side it has a pronounced influence. It is evident from experimental measurement and simulation study that strain path changes from balanced biaxial strain path to near-plane strain condition at the critical region with increase in friction. So the incomplete FLC in right-hand side is due to nonavailability of balanced biaxial failure strain point when friction is high. To generate a complete FLD, one needs to use proper lubrication system so that the friction is negligible and thus balanced biaxial strain path can be achieved at the critical region.
Footnotes
Declaration of conflicting interests
The authors declare that there is no conflict of interest.
Funding
This research received no specific grant from any funding agency in the public, commercial or not-for-profit sectors.