
Abstract
The transfer of elements C, Si, Mn, P and S from slag into the weld metal or from weld metal into the slag and microhardness has been studied using formulated fluxes. The fluxes have been formulated using extreme vertices design with an aim to develop mathematical models for change in element content and mechanical properties versus flux constituents for submerged arc welding of high-strength low-alloy steel. It is found that CaO is the most significant flux constituent and Al2O3 is the second most significant constituent among individual mixtures. CaO·MgO and CaO·Al2O3 among binary mixtures have significant effect on element transfer and microhardness. Developed mathematical models have been checked for adequacy using t-test and analysis of variance (F-test). Flux mixtures’ composition has been provided for optimum chemical composition and mechanical properties. One of the optimum flux mixture with composition, CaO 11.61, Al2O3 12.33, CaF2 15.00 and MgO 39.06, would be providing desirable chemical composition and mechanical properties.
Keywords
Introduction
Submerged arc welding (SAW) is one of the major welding processes due to its inherent attractive features such as high quality, deep penetration, smooth finish, capability to weld thicker sections and prevention of atmospheric contamination of weld pool.1–3 Mechanical properties4,5 of weld metal depend on element transfer in weld metal and microstructure, which further depends on flux composition for same welding parameters, electrode wire, base metal, weld joint design and weld thermal history. It was observed that in the earlier work6–8 that increase in acicular ferrite (AF) microstructure improves mechanical properties. Kanjilal et al. 9 in their work tried to develop mathematical model to find AF in terms of flux constituents for SAW of C–Mn steel. It was found that MgO is the most effective as an individual and CaO in interaction with other elements in controlling the amount of AF content in the weld metal.
A number of researchers have tried to study the element transfer between the weld metal and the slag on various aspects. Some researchers tried to find absolute element content of the weld metal10,11 due to slag–metal reactions, whereas others investigated the change in element transfer due to flux.4,12,13
Pandey et al. 12 studied the effect of welding parameters and flux basicity index (BI) on the weld chemistry and element transfer. It was concluded that both composition of the flux and BI value completely characterize a flux for studying its effect on weld chemistry. The authors also suggested elaborate optimization of the flux ingredients to be carried out in future work.
The study of Chai and Eagar 10 indicates that weld metal chemistry is dependent on weld metal flux composition but insignificantly dependent on operating parameters. The study also indicated that weld bead geometry is dependent on weld parameters only, namely, welding current, voltage, travel speed, electrode diameter and electrode polarity but independent on flux composition.
The slag–metal reactions have been studied by Mitra and Eagar 11 to predict the transfer of elements Cr, Si, Mn, P, S, C, Ni and Mo between the slag and the weld pool for weld bead. It was concluded from the study that the transfer of chromium is strongly dependent on the type of flux used; lower BI of the flux and high chromium content of the electrode enhance the chromium content of weld metal. It was also observed that the manganese content of the weld metal depends mainly on the amount of MnO in the flux and manganese content of the electrode. Lime-based fluxes produced weld metal with a lower phosphorous content than fluxes containing MnO as flux constituent.
Kanjilal et al. 4 in their work concluded that interaction between flux ingredient and welding parameters is more important than the individual effect of flux ingredients on weld metal chemistry and weld metal properties. Among the welding parameters, polarity was found to be most important for all responses, namely, weld metal chemical composition and mechanical properties.
Kanjilal et al. 13 studied the change in element transfer (Δ) for the elements O2, Mn, Si, S and C in terms of flux ingredients. It was suggested that element transfer was primarily due to chemical reactions associated with fluxes with fixed welding parameters. From the work, it was concluded that gain of Mn in the weld metal resulted due to electrochemical reaction in the weld pool, whereas gain of silicon in the weld metal was due to thermochemical dissociation and electrochemical reaction in the weld pool.
Burck et al. 14 evaluated the effects of CaF2, CaO and FeO additions on weld metal chemistry on steel plates. Carbon, oxygen, nitrogen, manganese, silicon, chromium, nickel and molybdenum contents were found in chemical analysis of the welds. The study indicated that the element transfer between the slag and the weld metal cannot be consistently explained using thermodynamic data only. Du Plessis et al. 15 suggested that the diffusible hydrogen content of weld metal can be greatly reduced by flux chemistry modifications, that is, by increasing the BI of flux and increasing the fluoride-containing compounds (CaF2, NaF, K2TiF6 or K2AlF6) in SAW electrodes.
In this study, individual flux constituents and their binary mixtures have been studied with an aim to obtain mathematical models for element transfer due to flux by varying flux composition in CaO–MgO–CaF2–Al2O3 flux system using statistical mixture design for SAW of high-strength low-alloy (HSLA) steel. Mathematical models for change in element content with respect to base metal and electrode wire have been formed in terms of individual constituents and their binary interactions.
Plan of experimentation
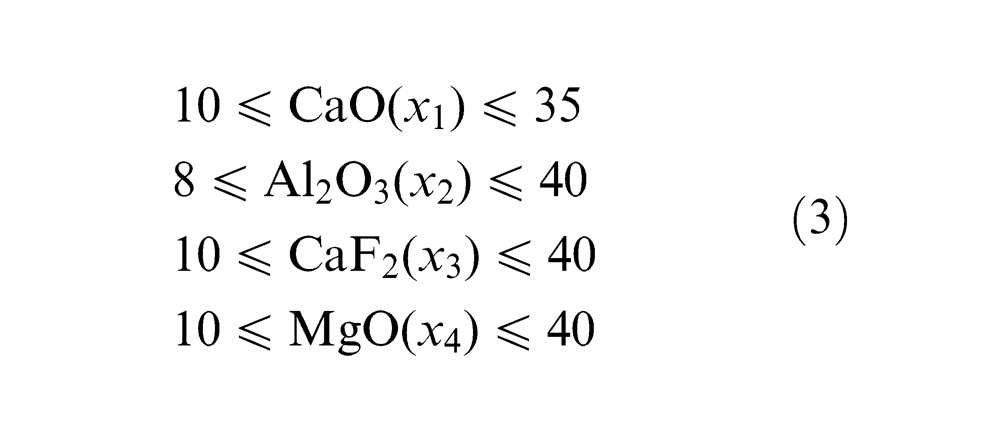
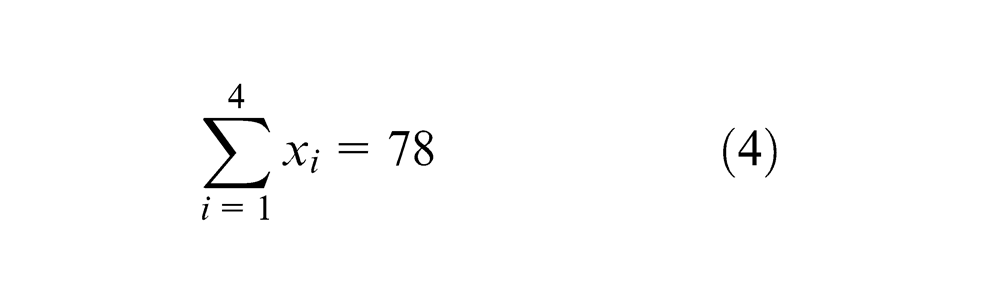
For plan of experiments, 21 agglomerated fluxes were used to predict the effect of flux constituents on the element transfer due to flux. These fluxes were prepared by varying the composition of four flux constituents CaO, Al2O3, CaF2 and MgO and keeping SiO2, TiO2, MnO and bentonite as constant (Table 1). The most suitable method for constrained mixtures design, extreme vertices design first suggested by Anderson and McLean, 16 Cornell 17 and Adeyeye and Oyawale 18 was used for flux formulation. Design of experiment (DOE) technique mentioned here was also used previously by Jindal et al. 19 with same limits of flux constituents and same design table 17 to determine mechanical properties and H2 content. The method suggests constrained mixture design for a mixture of q components having lower and upper limits on some or all the components may be represented mathematically as16,17
where
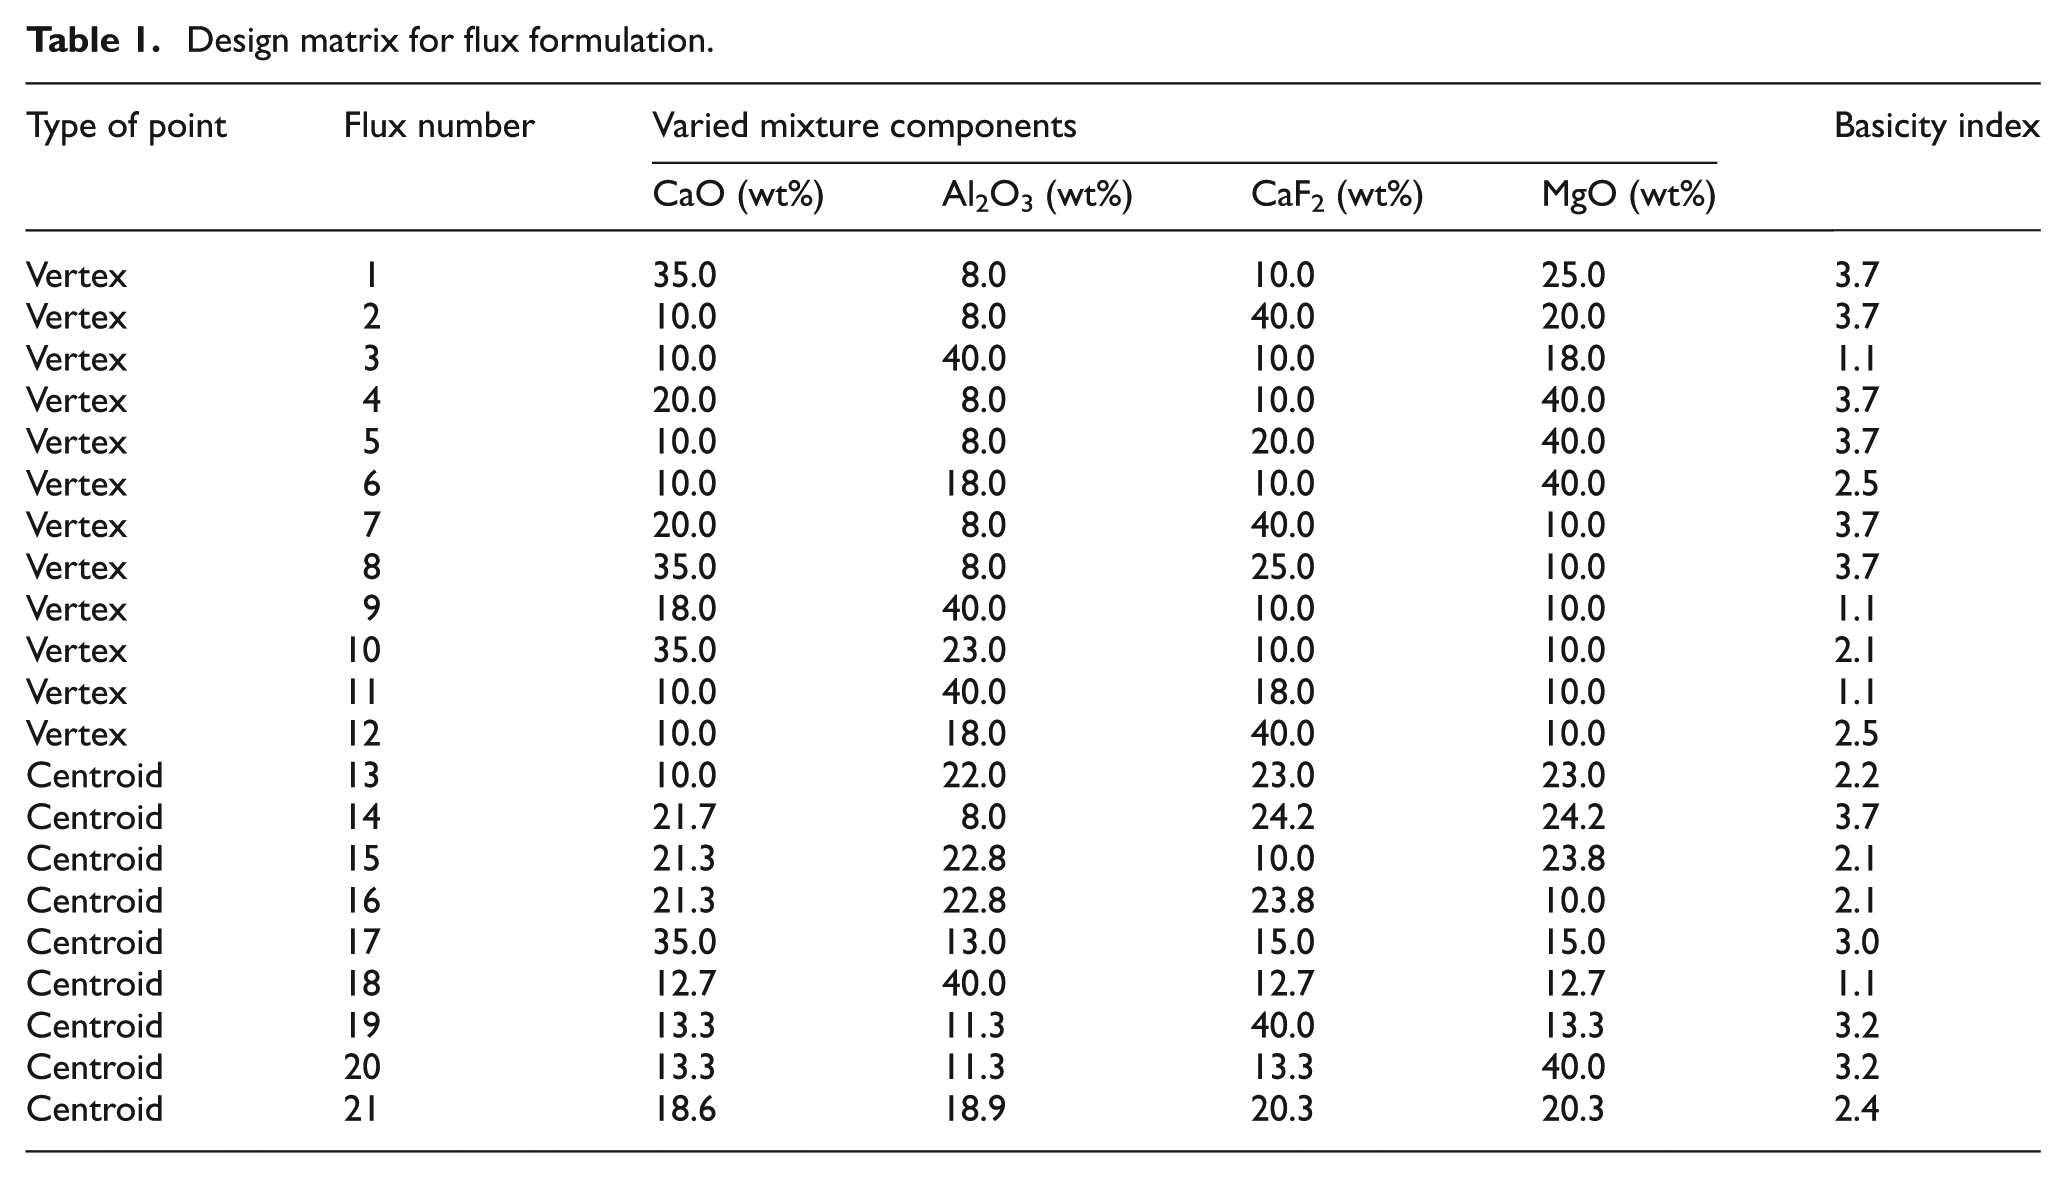
Design matrix for flux formulation.
Upper and lower limits of the various flux constituents were decided on the basis of the phase diagrams of CaO–Al2O3–MgO system and performing trial experiments. The phase diagram for CaO–Al2O3–MgO ternary system is shown in Figure 1. 20 The primary requirement while deciding the percentage composition of various flux ingredients is that their melting temperature should be lower than that of base metals as the flux should melt first before the base metals to be melted and should remain in the molten state even after the solidification of weld so as to avoid the atmospheric contamination. 21 Slag detachment, weld bead continuity and arc stability were observed during the trial experiments.
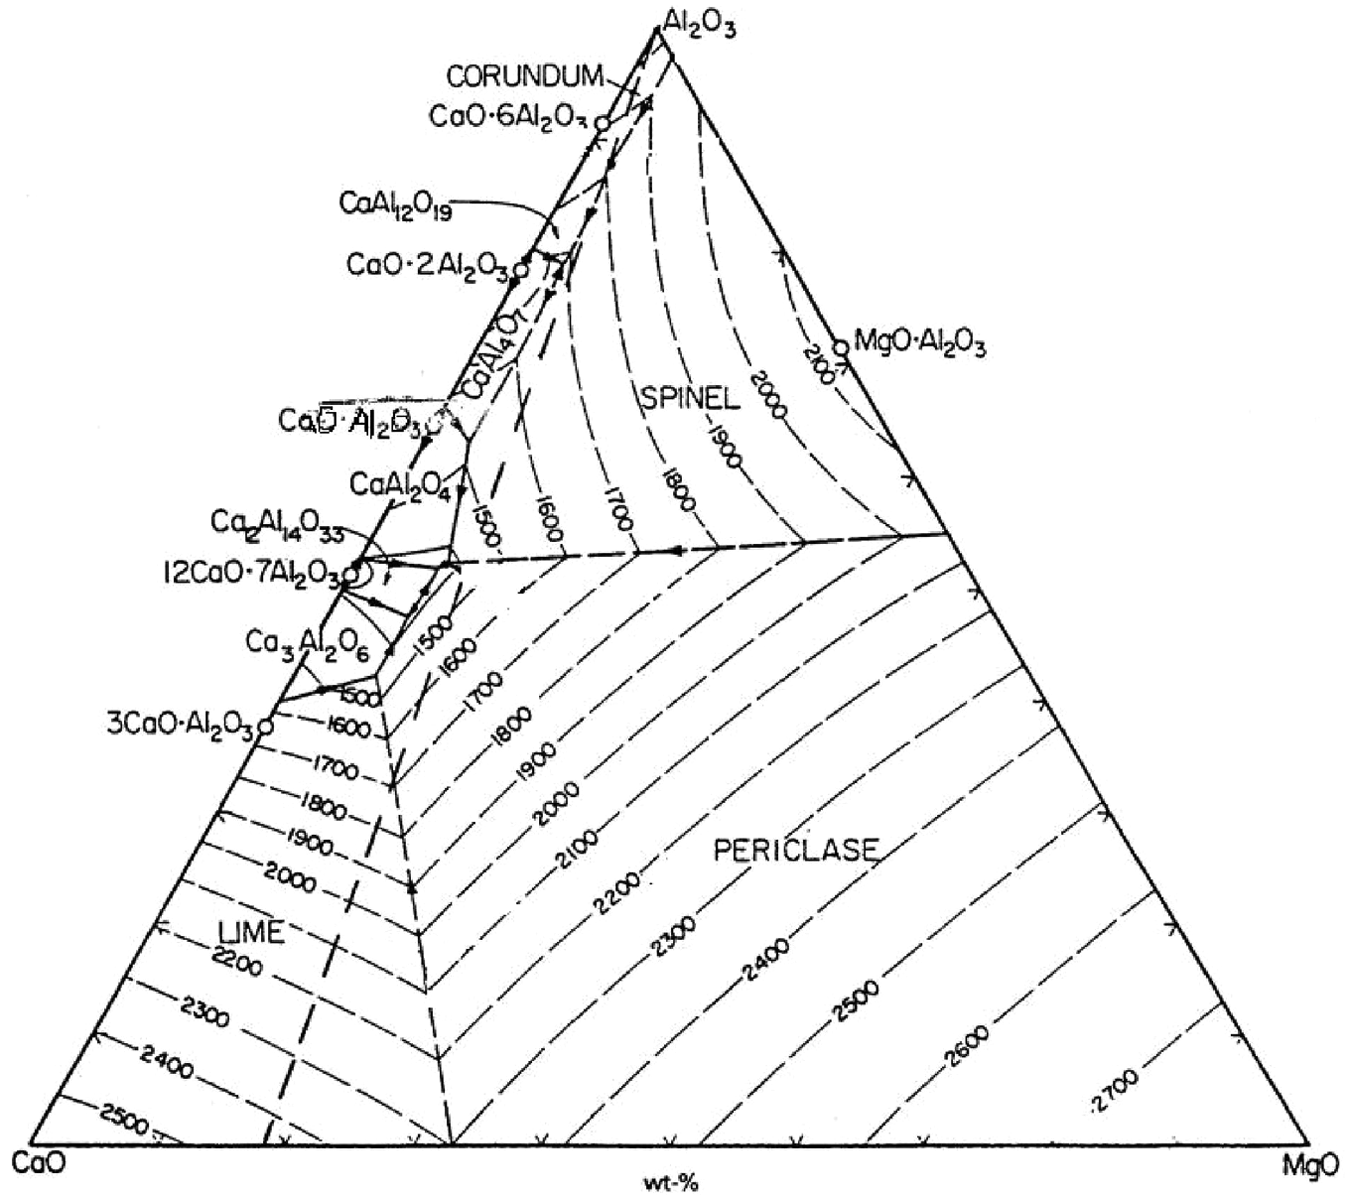
Phase diagram for CaO–Al2O3–MgO ternary system showing different equilibrium temperatures. 20
Upper and lower limits of the various flux constituents are given as follows
The whole mixture design may be represented graphically by truncated tetrahedron in three-dimensional (3D) space (Figure 2) consisting of 12 vertices of tetrahedron, 4 centroids of hexagonal faces and 4 centroids of triangular faces and 1 overall body centroid. In the first step, 12 vertices of polyhedron were selected out of 32 combinations (q.2q−1 = 4.24−1) satisfying lower and upper bounds and total proportion of the mixture. Then, of the 12 vertices, combinations were grouped into three or more having either of the vertices with the same proportion
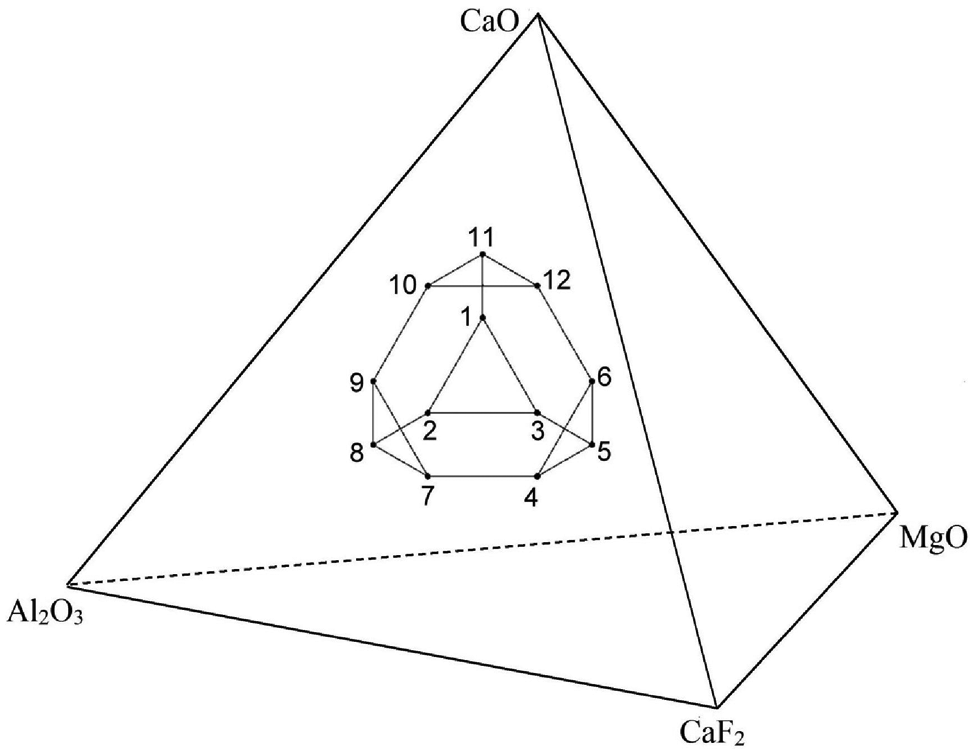
Graphical demonstration of flux mixture design in 3D space.
The output response characteristics are given in the form of second-order regression model as per the following equation (5)16,17
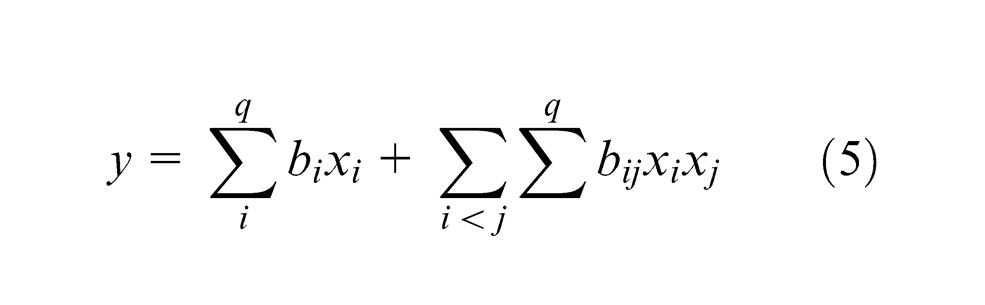
where y is the output response variable and
Experimentation
Preparation of fluxes
For preparation of fluxes, constituting elements were weighed separately on digital weighing balance (accuracy 1 mg) according to weight percentage as per Table 1 and then mixed thoroughly in a container with sodium silicate binder (20% weight) for about 30 min to get homogenous semi-solid mass. Sodium silicate was added for better arc stability and binding the individual ingredients together.22,23 Then solid mass was dried in air for 24 h and then baked in a muffle furnace at 700 °C for nearly 1 h. After cooling, these fluxes were crushed, sieved and kept in air-tight bags.
Welding of plates
For welding, the edges of HSLA plates were prepared by making a V-groove of 60°. Twenty-one weld samples were made taking two HSLA steel (API 5L X65) plates, each of size 250 × 150 mm and thickness 18 mm. Fixtures were made to get butt weld on the base plates on SAW setup (Ador Tornado SAW M-800) at MMU, Mullana (Ambala, India). All the experiments were conducted using 3.2-mm-diameter wire electrode (EH-14) by taking optimum welding parameters: welding current of 410 A, voltage of 30.4 V and weld speed of 21.2 m/h with direct current reverse polarity (DCRP) using multi-pass welds. The optimum welding parameters were selected on the basis of trial runs and performing optimization experiments using response surface methodology (RSM) technique by varying the following parameters: welding current range of 349–651 A, arc voltage range of 24–32 V and weld speed range of 17–33 m/h keeping nozzle-to-tip distance constant at 25 mm with formulated flux number 11 (BI = 1.1) in separate work by Jindal et al. 24 Compositions of the flux have significant effect on chemical and mechanical properties of the welds, but the effect of flux constituents on weld bead geometry has not been reported in the earlier literature. Since weld metal chemistry is primarily dependent on weld metal flux composition and independent of operating parameters. 10 Weld parameters were optimized on the basis of weld bead geometry parameters, area of penetration, weld form factor and dilution.
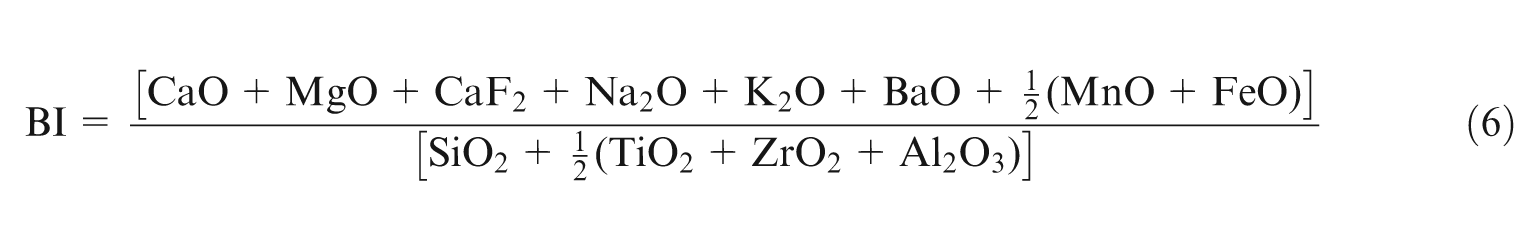
BI is defined as the ratio of basic oxides to acidic oxides given by equation (6)15,25 as follows
Analysis of weld samples
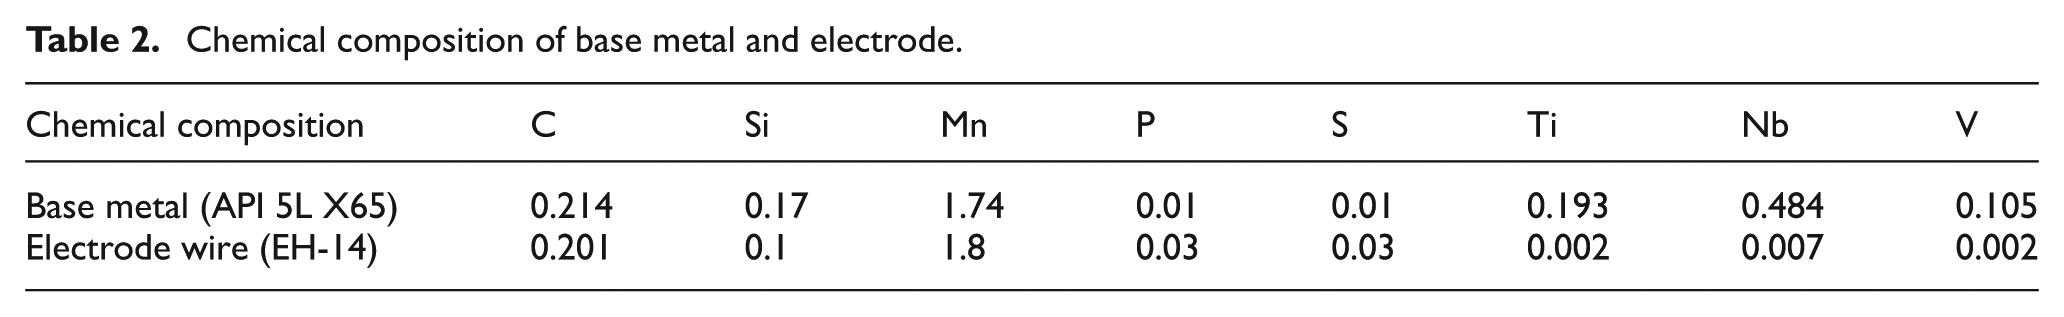
Chemical composition of base metal, filler metal (electrode wire) (Table 2) and fusion zone (Figure 3) of weld samples (Tables 3 and 4) was determined by electron probe micro analysis (EPMA). Chemical analysis of all weld samples was carried out on JEOL Electron Probe Microanalyzer (JXA-8230) at NML, Jamshedpur, India, at an accelerating voltage of 15 kV at a resolution of 1000×. Compositional and secondary images of two weld samples (samples 5 and 21) are shown in Figure 4. Weld element content was determined by taking average of three randomly selected points (Figure 4). X-ray diffraction (XRD) analysis of all the slag samples was carried out to analyze the elemental pickup by slag during welding. Microhardness of weld zone (at the center of fusion zone) of all welds (Figure 3) had been taken at a load of 0.5 kg.
Chemical composition of base metal and electrode.
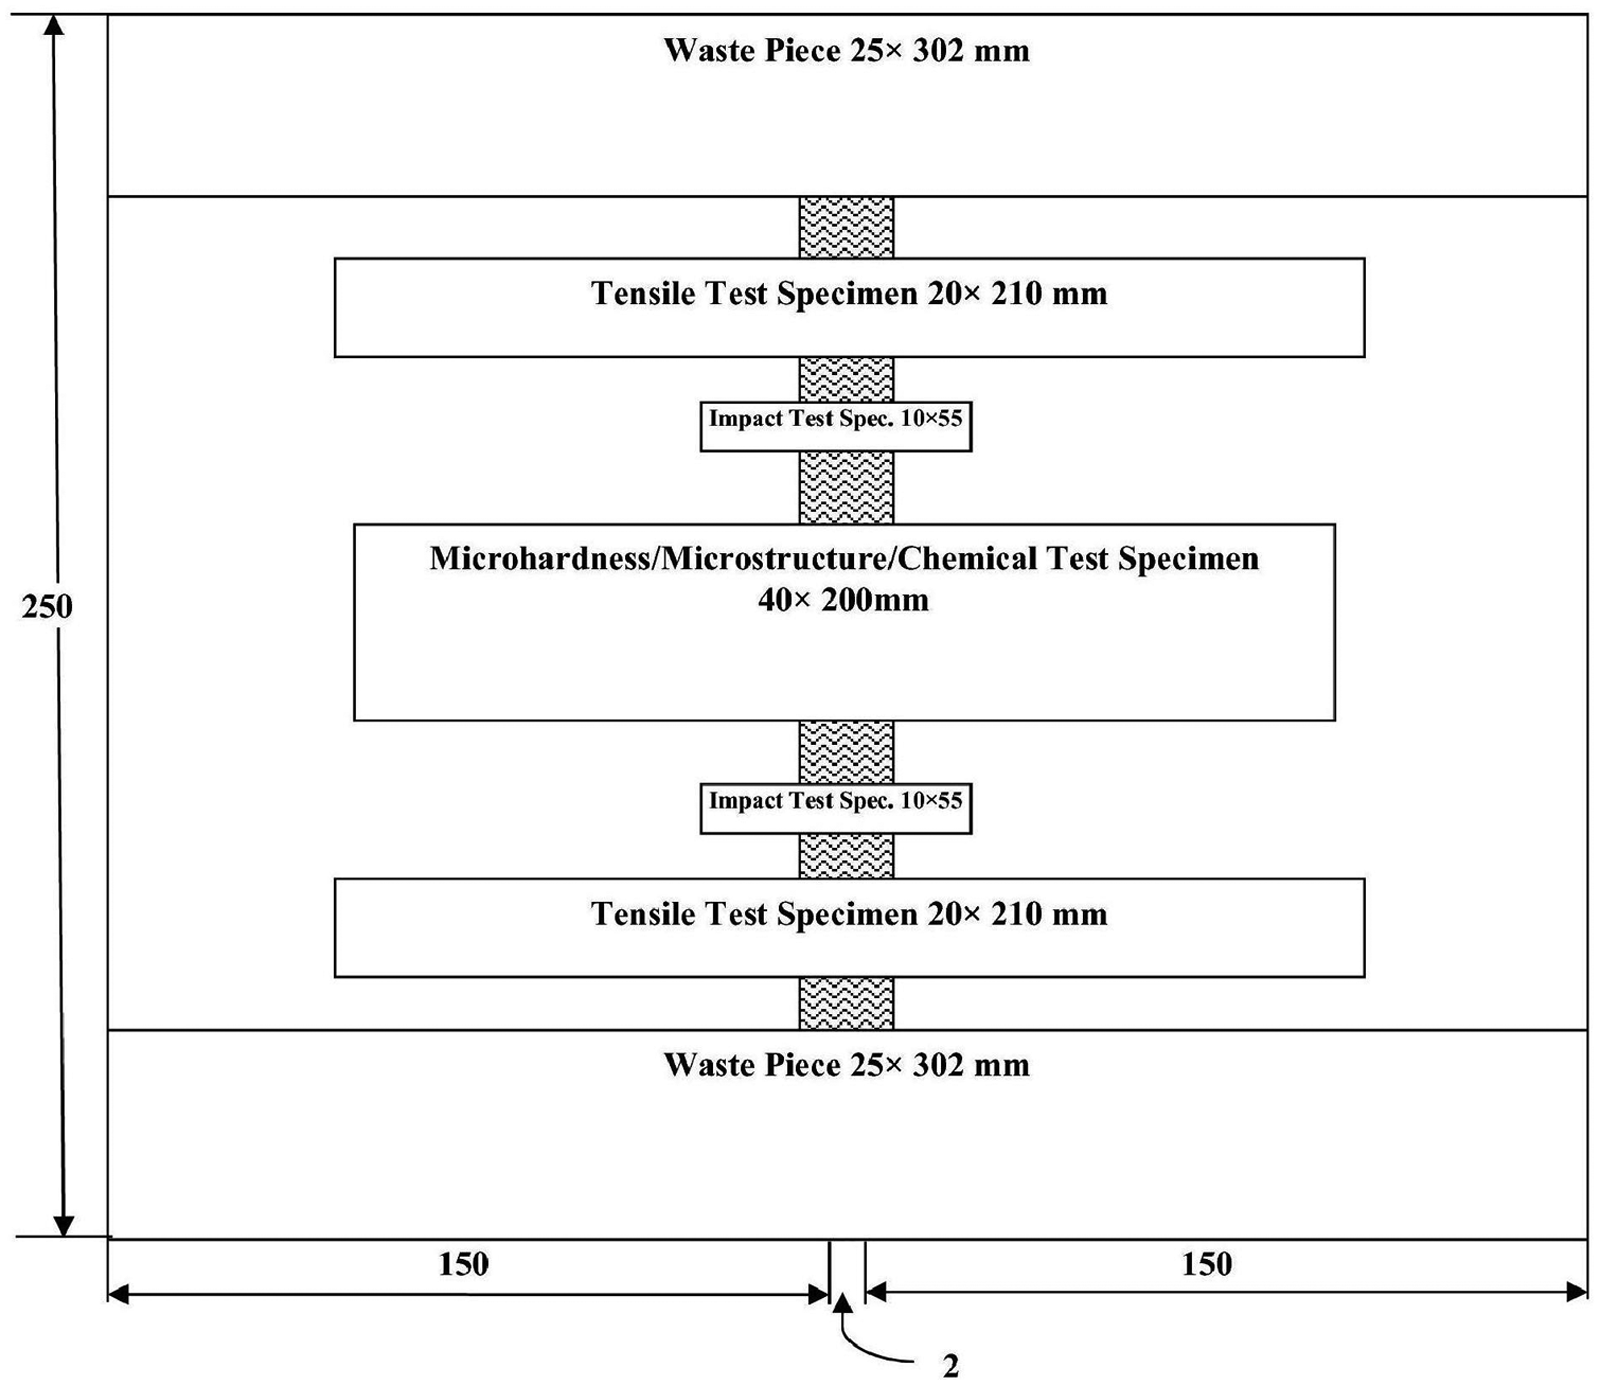
Arrangement of cutting specimens for various testing.
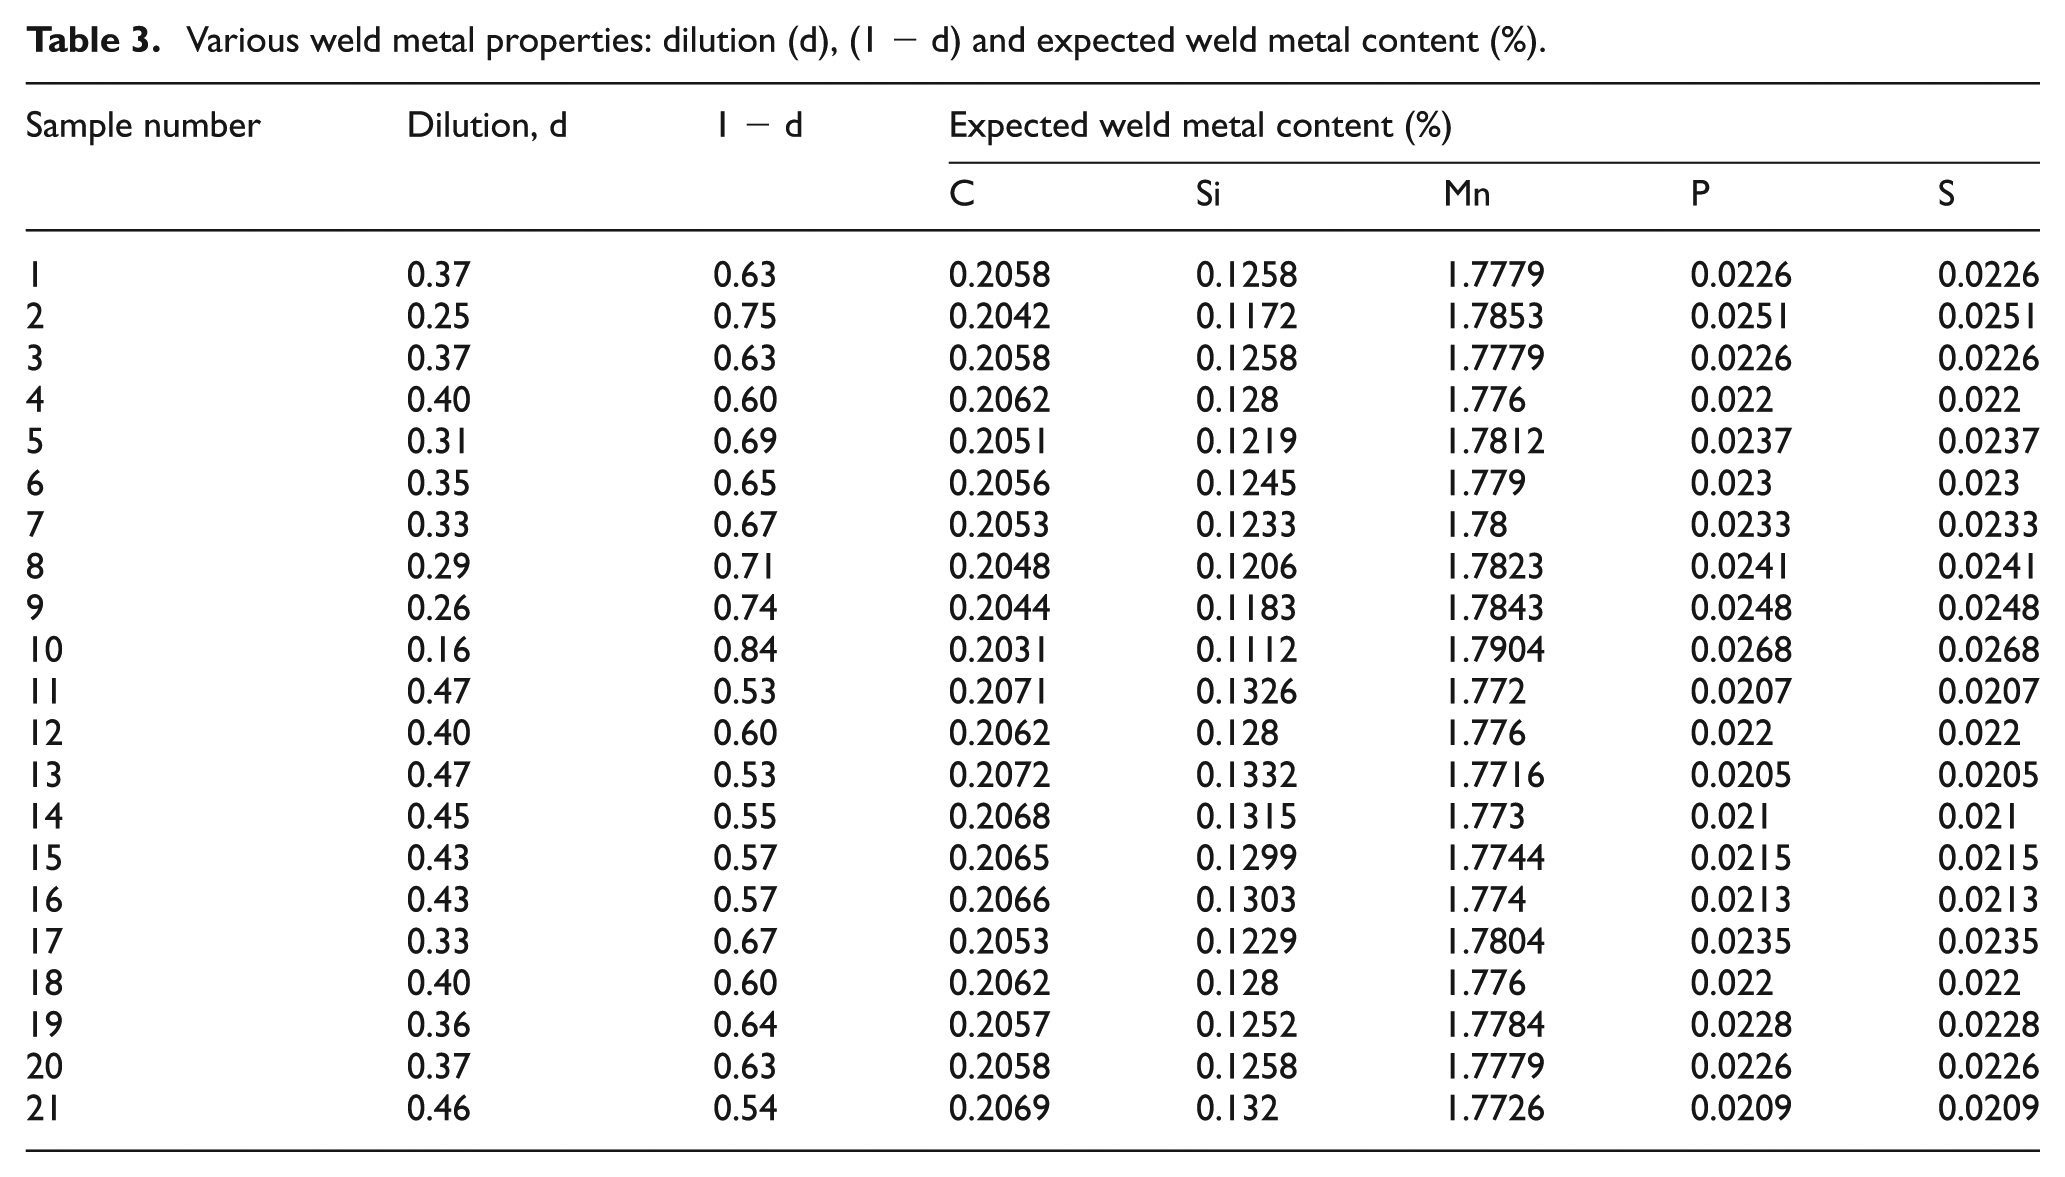
Various weld metal properties: dilution (d), (1 − d) and expected weld metal content (%).
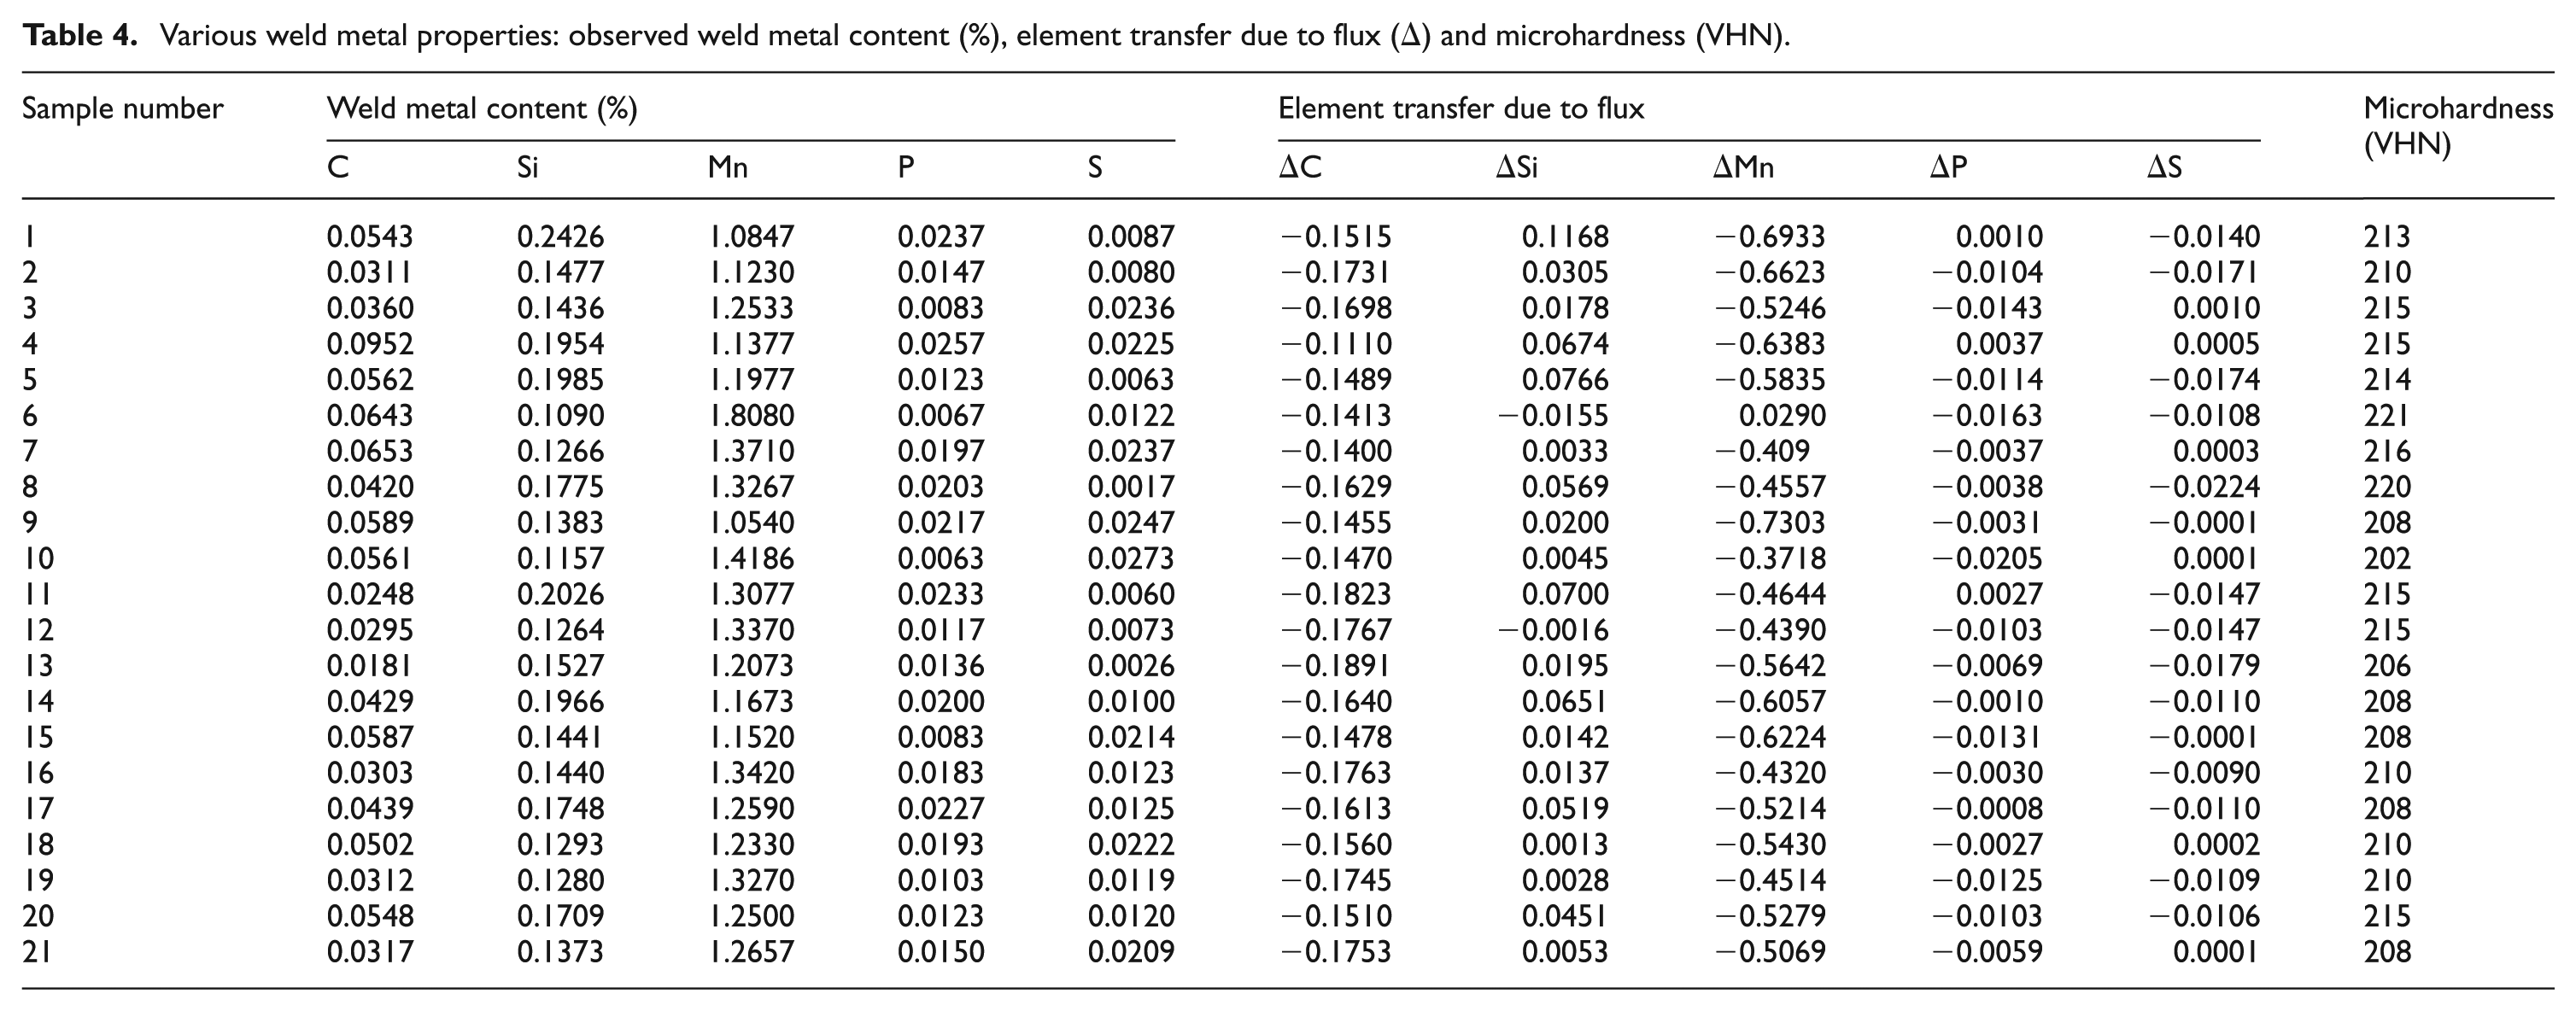
Various weld metal properties: observed weld metal content (%), element transfer due to flux (Δ) and microhardness (VHN).
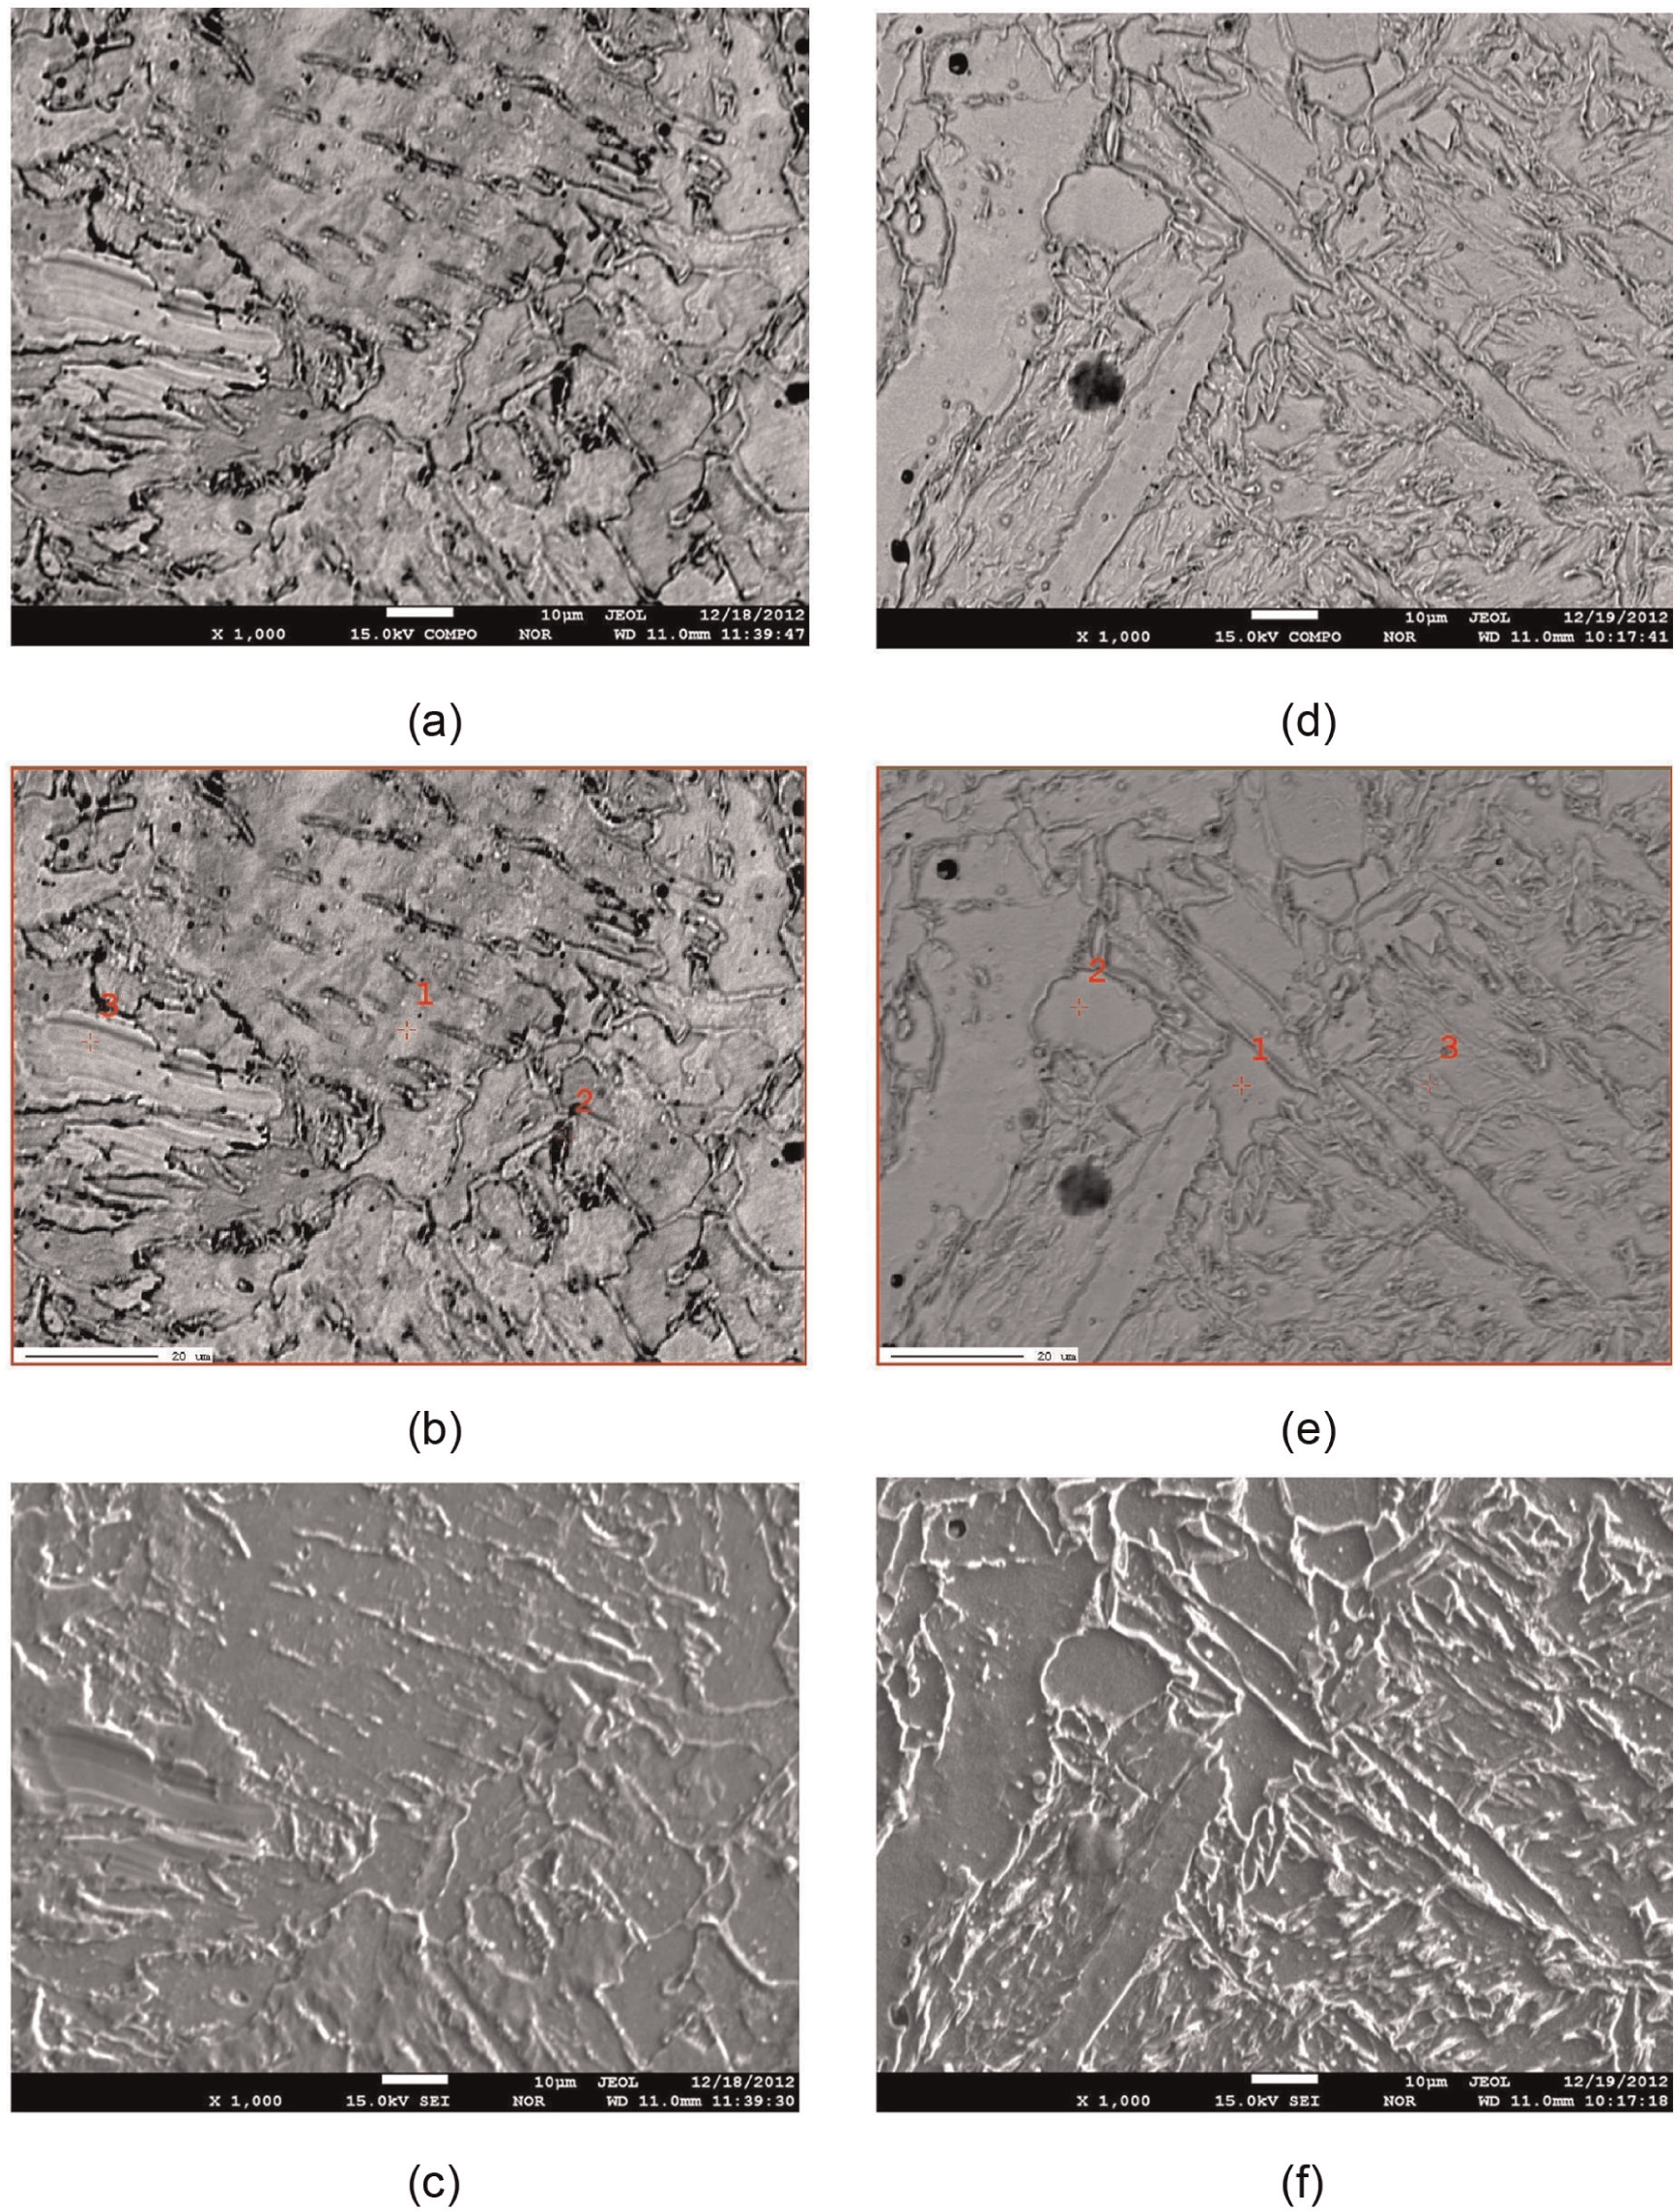
EPMA analysis images: (a) compositional, (b) point selection and (c) secondary images for sample 5; (d) compositional, (e) point selection and (f) secondary images for sample 21.
Estimation of element transfer in weld metal
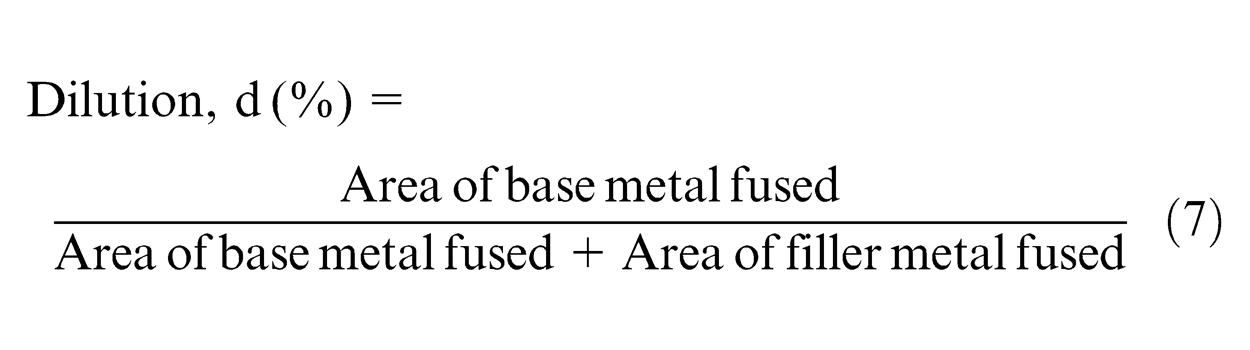
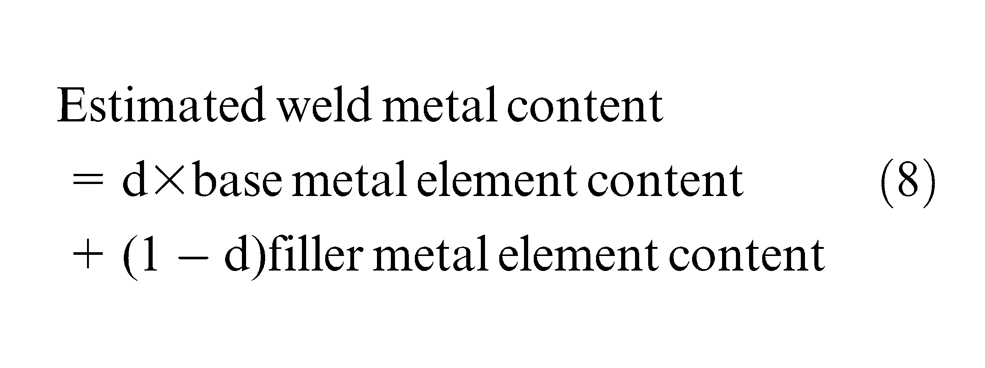
Dilution (d) due to the base plate and dilution (1 − d) due to the electrode wire in SAW were determined (equation (7)) by cutting the welded joint transversely to observe the weld profile by performing the common metallurgical polishing operations and then etching with 5% nital solution (Figure 5). Area of fused base metal and filler metal were measured using a profile projector and digital planimeter. Expected weld metal content was calculated using dilution (d) due to the base plate, dilution (1 − d) due to the electrode wire, base metal and electrode wire element contents as per equation (8). A quantity delta (Δ) was introduced to find the element transfer due to flux, which is calculated by subtracting expected weld metal content from observed weld metal content. Positive and negative values of delta (Δ) indicate gain of element due to transfer of element from slag to weld metal and loss of element due to transfer from weld metal to slag, respectively. The results of the dilution (d), (1 − d), expected weld metal content (%), observed weld metal content (%) and element transfer due to flux (Δ) quantities have been presented in Tables 3 and 4.
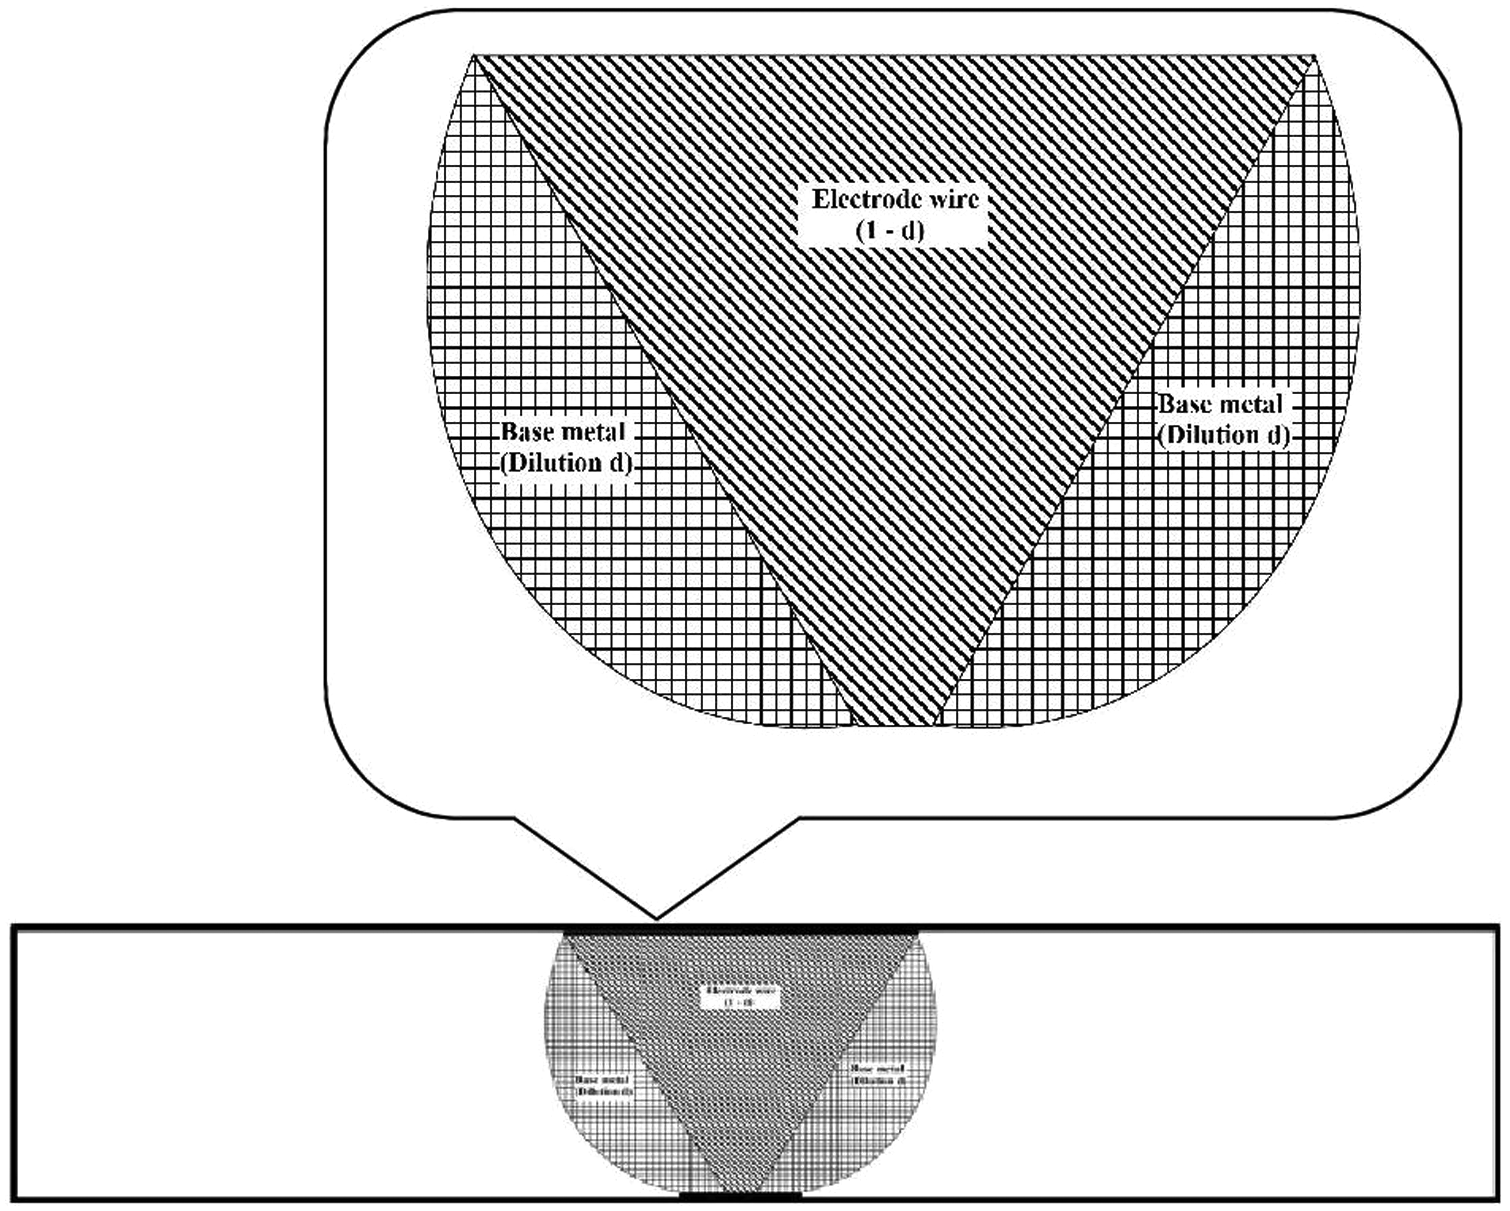
Typical weldment and exploded weld zone.
Development of regression models for change in element transfer and microhardness
Using the observed values of chemical composition from experimentation, least square regression equations were developed in terms of percentage composition of individual flux constituents (CaO, Al2O3, CaF2 and MgO). Second-order quadratic regression models are formed in terms of predictors of individual effect of mixture components (CaO, Al2O3, CaF2 and MgO) and interaction effect of binary mixtures (CaO·Al2O3, CaO·CaF2, CaO·MgO, Al2O3·CaF2, Al2O3·MgO and CaF2·MgO)
Analysis of mathematical models
Prediction equations (9)–(14) have been checked for adequacy using t-test and analysis of variance (ANOVA) (F-test). Individual regression coefficients (
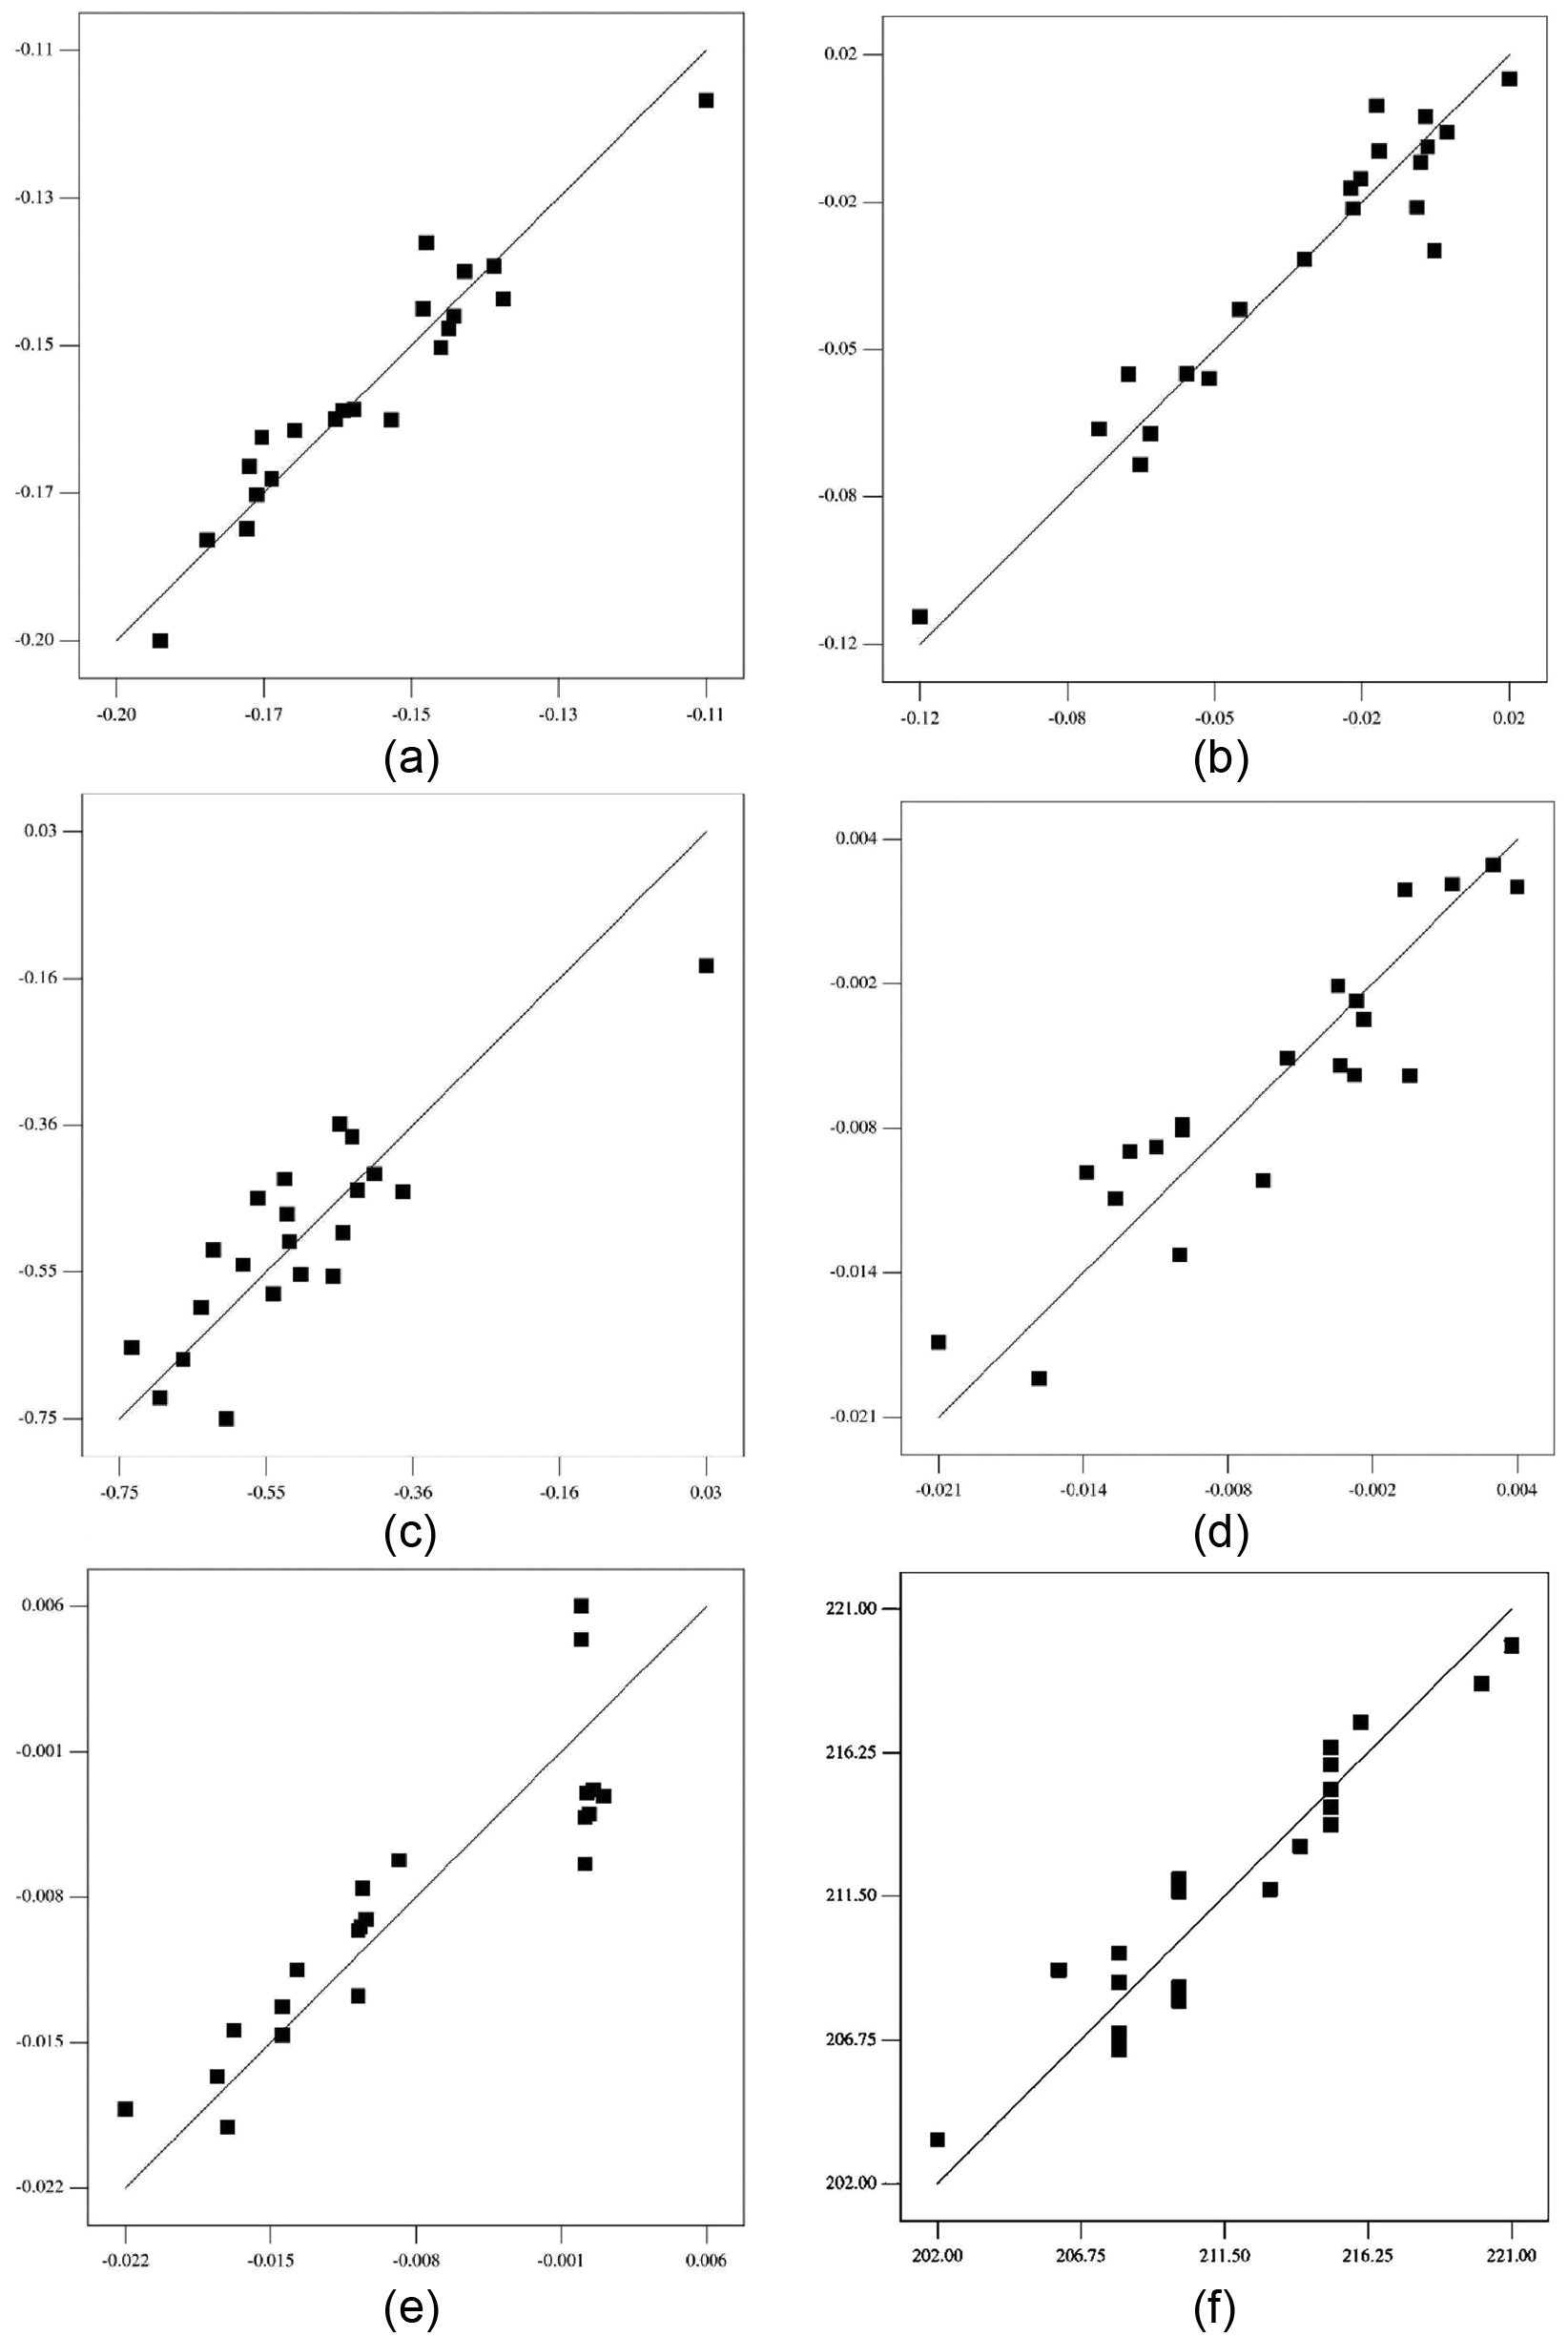
Predicted values versus actual/observed values of chemical composition for weld metal: (a) ΔC, (b) ΔSi, (c) ΔMn, (d) ΔP, (e) ΔS and (f) VHN.
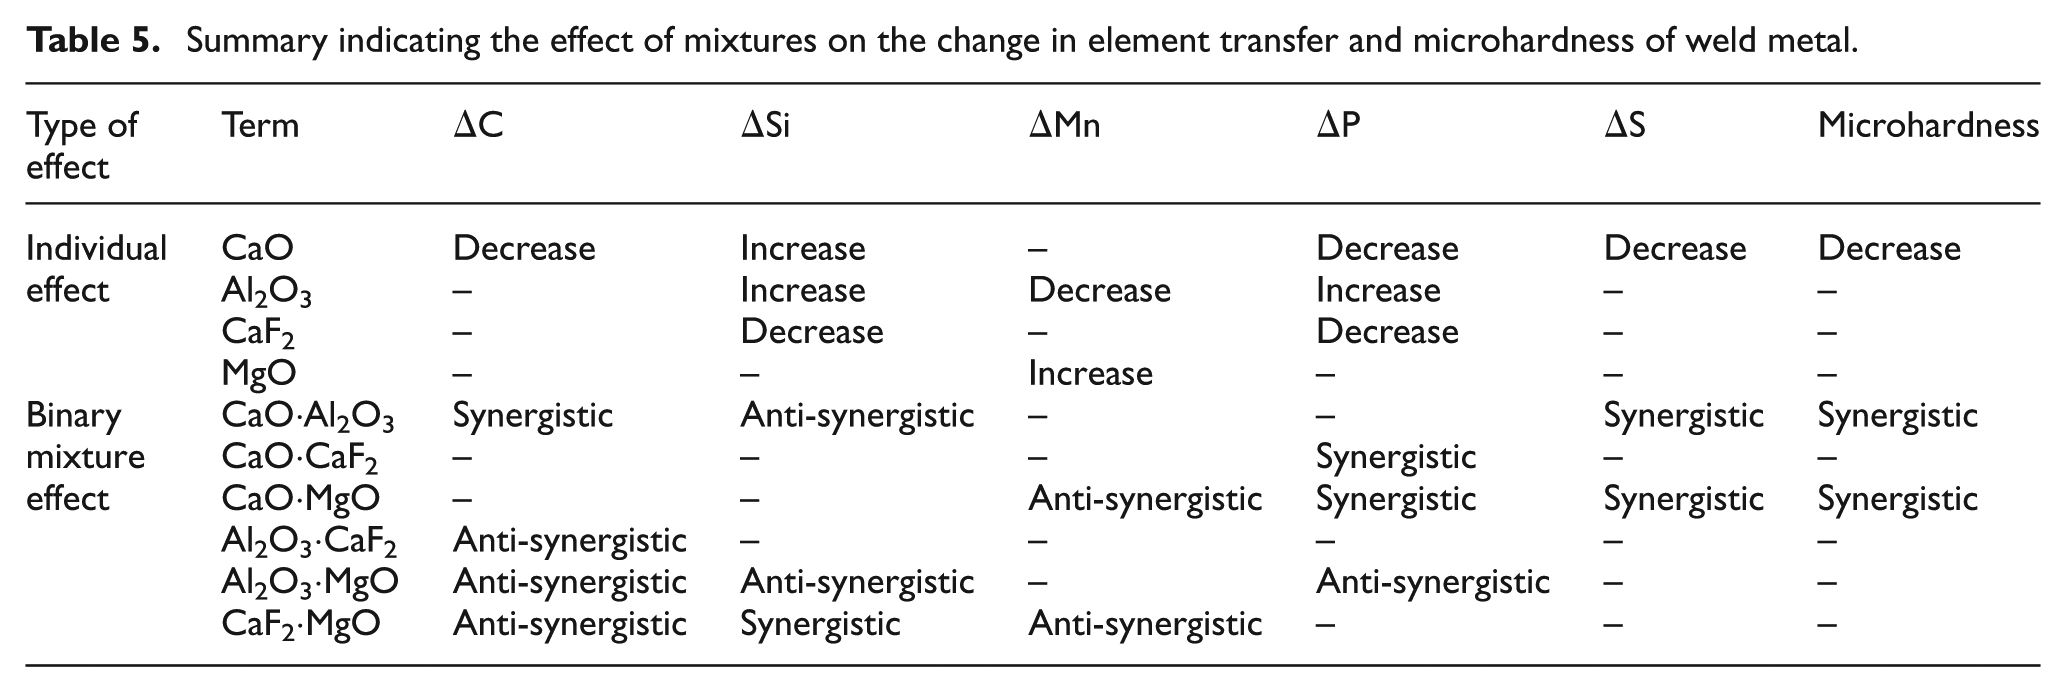
Summary indicating the effect of mixtures on the change in element transfer and microhardness of weld metal.
Discussion
The effect of different mixtures on the element transfer of weld metal is indicated in Table 5 and Appendix 1. Table 5 indicates the type of effect (synergistic/anti-synergistic) of different mixtures on the change in element transfer of weld metal, and t-table (Appendix 1) shows the significance of various flux mixtures according to t-value of the corresponding term (flux mixture).
Effect of flux constituents on chemical composition of weld metal
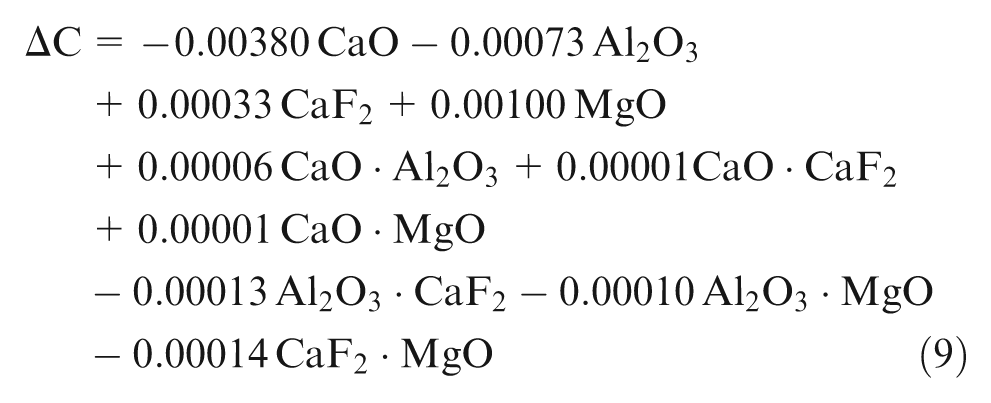
Weld metal has lower carbon content than expected from base metal and filler metal as shown by results, which is in accordance with the previous literature, 11 which may be due to oxidation of carbon to its oxides during slag–metal reactions. Among the individual flux mixtures, CaO, MgO and Al2O3 affect ΔC. CaO has significant decreasing effect and Al2O3 has insignificant decreasing effect, whereas MgO has insignificant increasing effect on ΔC.
Binary mixture of CaO with Al2O3 has synergistic effect, whereas binary mixtures of Al2O3 with CaF2 and MgO have anti-synergistic effect on ΔC. In the high-temperature environment near the welding plasma, CaO decomposes to release oxygen. The oxygen released from flux reacts with carbon of base metal and filler metal to form its oxides, thereby reducing weld metal carbon.
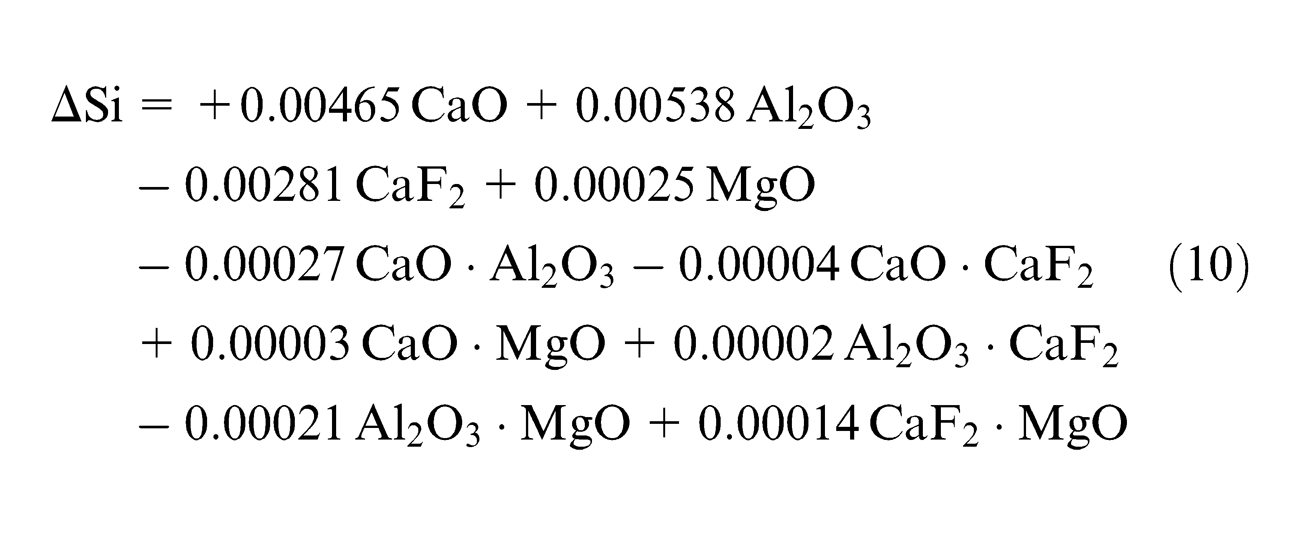
From the results, it seems that weld metal silicon content does not have any relationship with initial Si content of flux (SiO2 content is constant) but dependent on Si content of base metal and filler metal up to some extent 26 but mainly dependent on slag–metal reactions. Increase in ΔSi content occurs in all the experiments except experiments 6 and 12 where it decreases, as shown in Table 4.
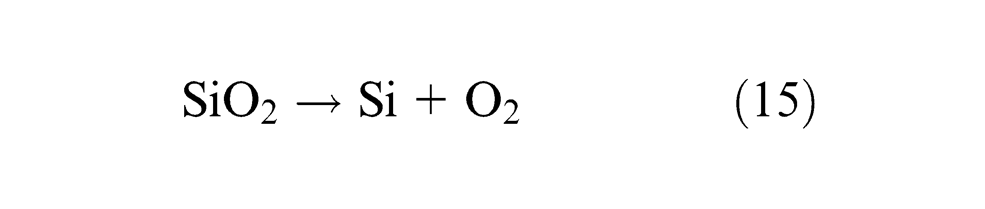
Gain of Si in all samples is due to dissociation of SiO2 present in the flux to Si and O2 as per equation (15)
Individual flux ingredients CaO and Al2O3 tend to increase weld metal silicon content, whereas CaF2 tends to decrease Si content; binary mixtures CaO·Al2O3 and Al2O3·MgO have anti-synergistic (decreasing) effect whereas CaF2·MgO has synergistic (increasing) effect on ΔSi, which is in agreement with the previous literature 13 (Table 5).
MgO has insignificant increasing effect on Si content, which may be due to dissociation of MgO to Mg, in turn Si will form SiO2, which will again react with Mg in the weld pool to form MgO again. So Si content is expected to increase due to flux.
Binary mixture CaO·MgO has insignificant anti-synergistic effect on ΔSi, which may be due to reduction of SiO2 to complex silicates also verified in XRD analysis of slags in section “XRD analysis of slag.” Binary mixture CaF2·MgO increases density of the molten metal, which hinders the transfer of Si across the slag–metal interface.
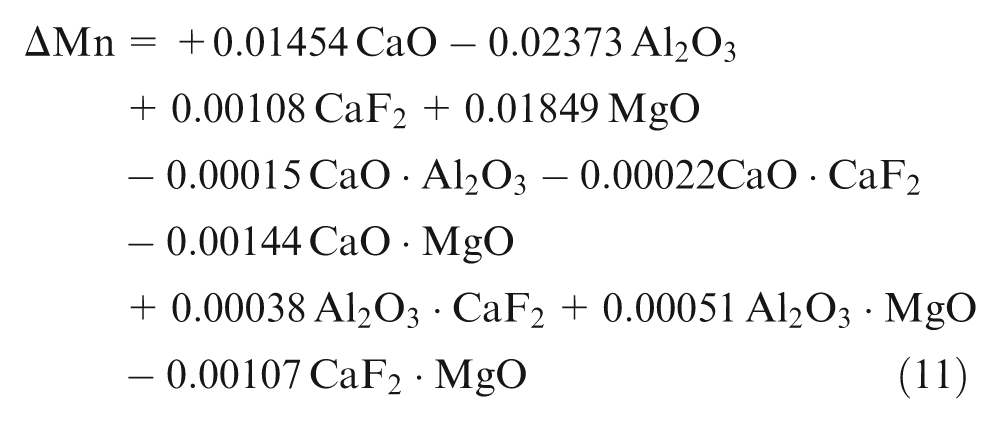
In general, manganese transfer depends on manganese content of electrode and flux composition. 11 Mn content in all samples is decreased except sample 6, which shows gain of Mn content. Individual flux ingredient Al2O3 tends to decrease whereas MgO tends to increase Mn content and binary mixtures; CaO·MgO and CaF2·MgO have anti-synergistic effect on ΔMn.
Increase in Mn in weld metal may be due to the electrochemical reaction occurring at the base metal (cathode in DCRP). During this reduction reaction, Mg dissociates from MgO. Manganese will form MnO with oxygen in the molten metal and Mg will react with this MnO to form MgO again, which increases Mn content of weld metal. Addition of MgO to CaO and CaF2 increases density and decreases conductivity of the molten metal, which increases the resistance to Mn movement at the slag–metal interface, thereby decreasing Mn content of weld metal and also lost by the vaporization of Mn from electrode/base metal.
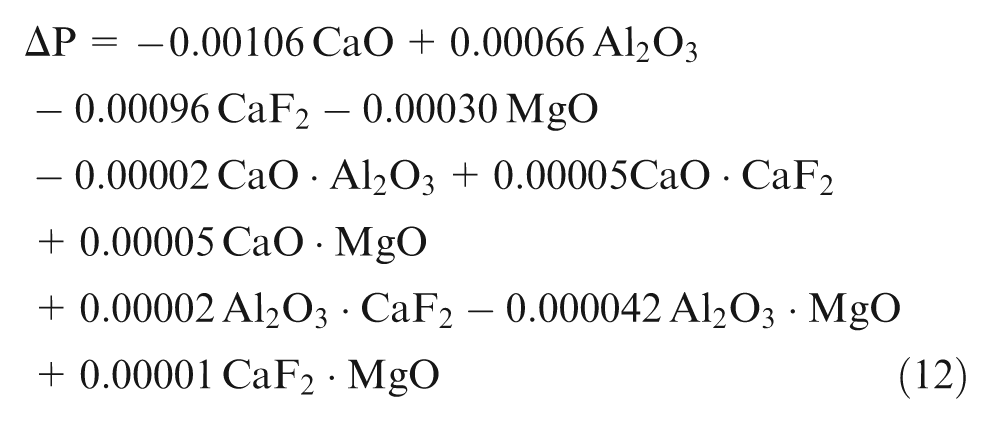
Phosphorus is assumed to be an impurity, which increases strength of low-alloy steels and increases crack tendency during welding at the same time so should be kept minimum. Samples 1, 4 and 11 show gain of P content in weld metal and all the rest show loss of P. Individual flux ingredients CaO and CaF2 tend to decrease, whereas Al2O3 tends to increase P content and binary mixtures; CaO·CaF2 and CaO·MgO have synergistic effect on ΔP and Al2O3·MgO has anti-synergistic effect on phosphorus.
CaO and CaF2 oxidize phosphorus to its oxides, thereby decreasing its content. Substitution of flux ingredient by CaO and CaF2 lowers activity coefficient of phosphorous pentoxide,

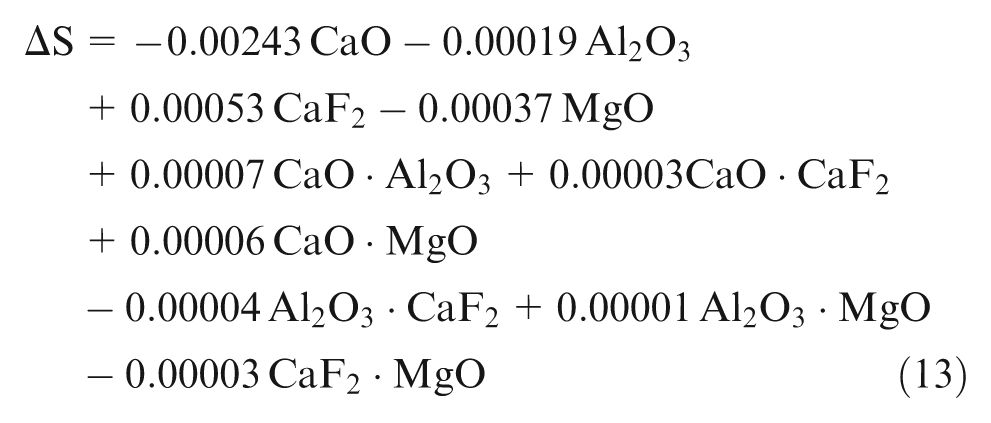
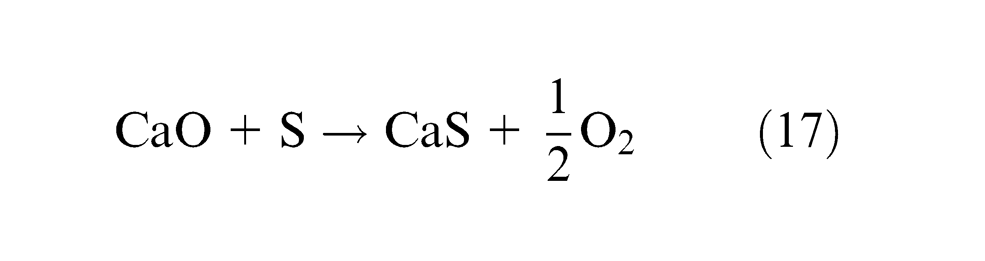
Samples 3, 4, 7, 10, 18 and 21 show gain of S content in weld metal and all the rest show loss of sulfur. Only CaO among individual flux ingredients has significant decreasing effect on ΔS as seen from equation (12) and table (t coefficients in Appendix 1), and binary mixtures CaO·Al2O3 and CaO·MgO have synergistic effect on ΔS. Lime fluxes are well known to remove impurities during welding processes. CaO combines with sulfur of weld metal forming CaS and releasing O2 as per reaction mentioned in equation (17), thereby lowering sulfur content from weld metal contrary to previous results by Kanjilal et al. 13 and in agreement with the results by Chai and Eager 10
MnO from flux also reacts with weld metal S to form MnS and releasing O2, thereby decreasing S content in all other samples having lesser CaO.
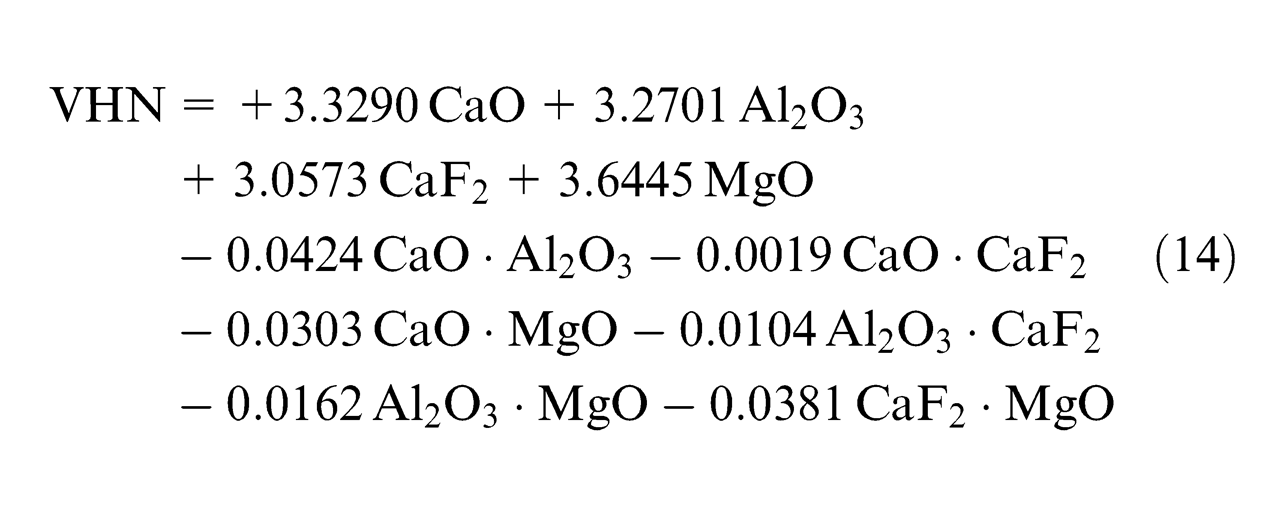
Effect of flux constituents on microhardness (VHN)
The effect of flux constituents on mechanical properties has been studied and mathematical models have been developed in the earlier work done by the authors using same DOE and same design table. 19 The prediction equations for these mechanical properties are given in Appendix 2. Only CaO among individual flux ingredients has significant decreasing effect and binary mixtures; CaO·Al2O3 and CaO·MgO have synergistic effect on microhardness as seen from equation (14) and table t coefficients (Appendix 1). CaO has decreasing effect on phosphorus and sulfur, which is also justified in same section, thus improving the microhardness. CaO·Al2O3 and CaO·MgO tend to increase impurities, as CaO·Al2O3 also has synergistic effect on S content and CaO·MgO has synergistic effect on S and P, thereby increasing microhardness.
XRD analysis of slag
XRD analysis of all slag samples was carried out after welding. For the XRD measurements, the slag specimens were analyzed using 2θ diffraction mode ranging from 10° to 120°. The XRD patterns of slags 1, 10, 16 and 19 are shown in Figure 7. The different crystalline compounds are formed in the slags, which are in agreement with the previous literature27–29 such as gehlenite (calcium magnesium aluminum silicate, Ca2(Mg0.25Al0.75)(Si1.25Al0.75O7)), melilite (calcium magnesium aluminum silicate, Ca2(Mg0.5Al0.5)(Si1.5Al0.5O7)), merwinite (calcium magnesium silicate, Ca3Mg(SiO4)2), joesmithite (calcium lead aluminum iron magnesium beryllium silicate hydroxide, Ca5.2Pb.8Al.3Fe4.8Mg4.9Be4Si12O44(OH)4), gismondine (calcium aluminum silicate hydrate, CaAl2Si2O8·4H2O), garronite (sodium calcium aluminum silicate hydrate, Na.8Ca2.82(Al6Si10O32)(H2O)12.08), ungarettiite (sodium potassium calcium magnesium manganese silicate, (Na0.80K0.15)(Na1.97Ca0.03)(Mn0.93Mg0.07)(Mn1.78Mg0.22). Mn2(Si8O22)O2) and margarosanite (lead calcium manganese silicate, Pb(Ca Mn)2(SiO3)3).
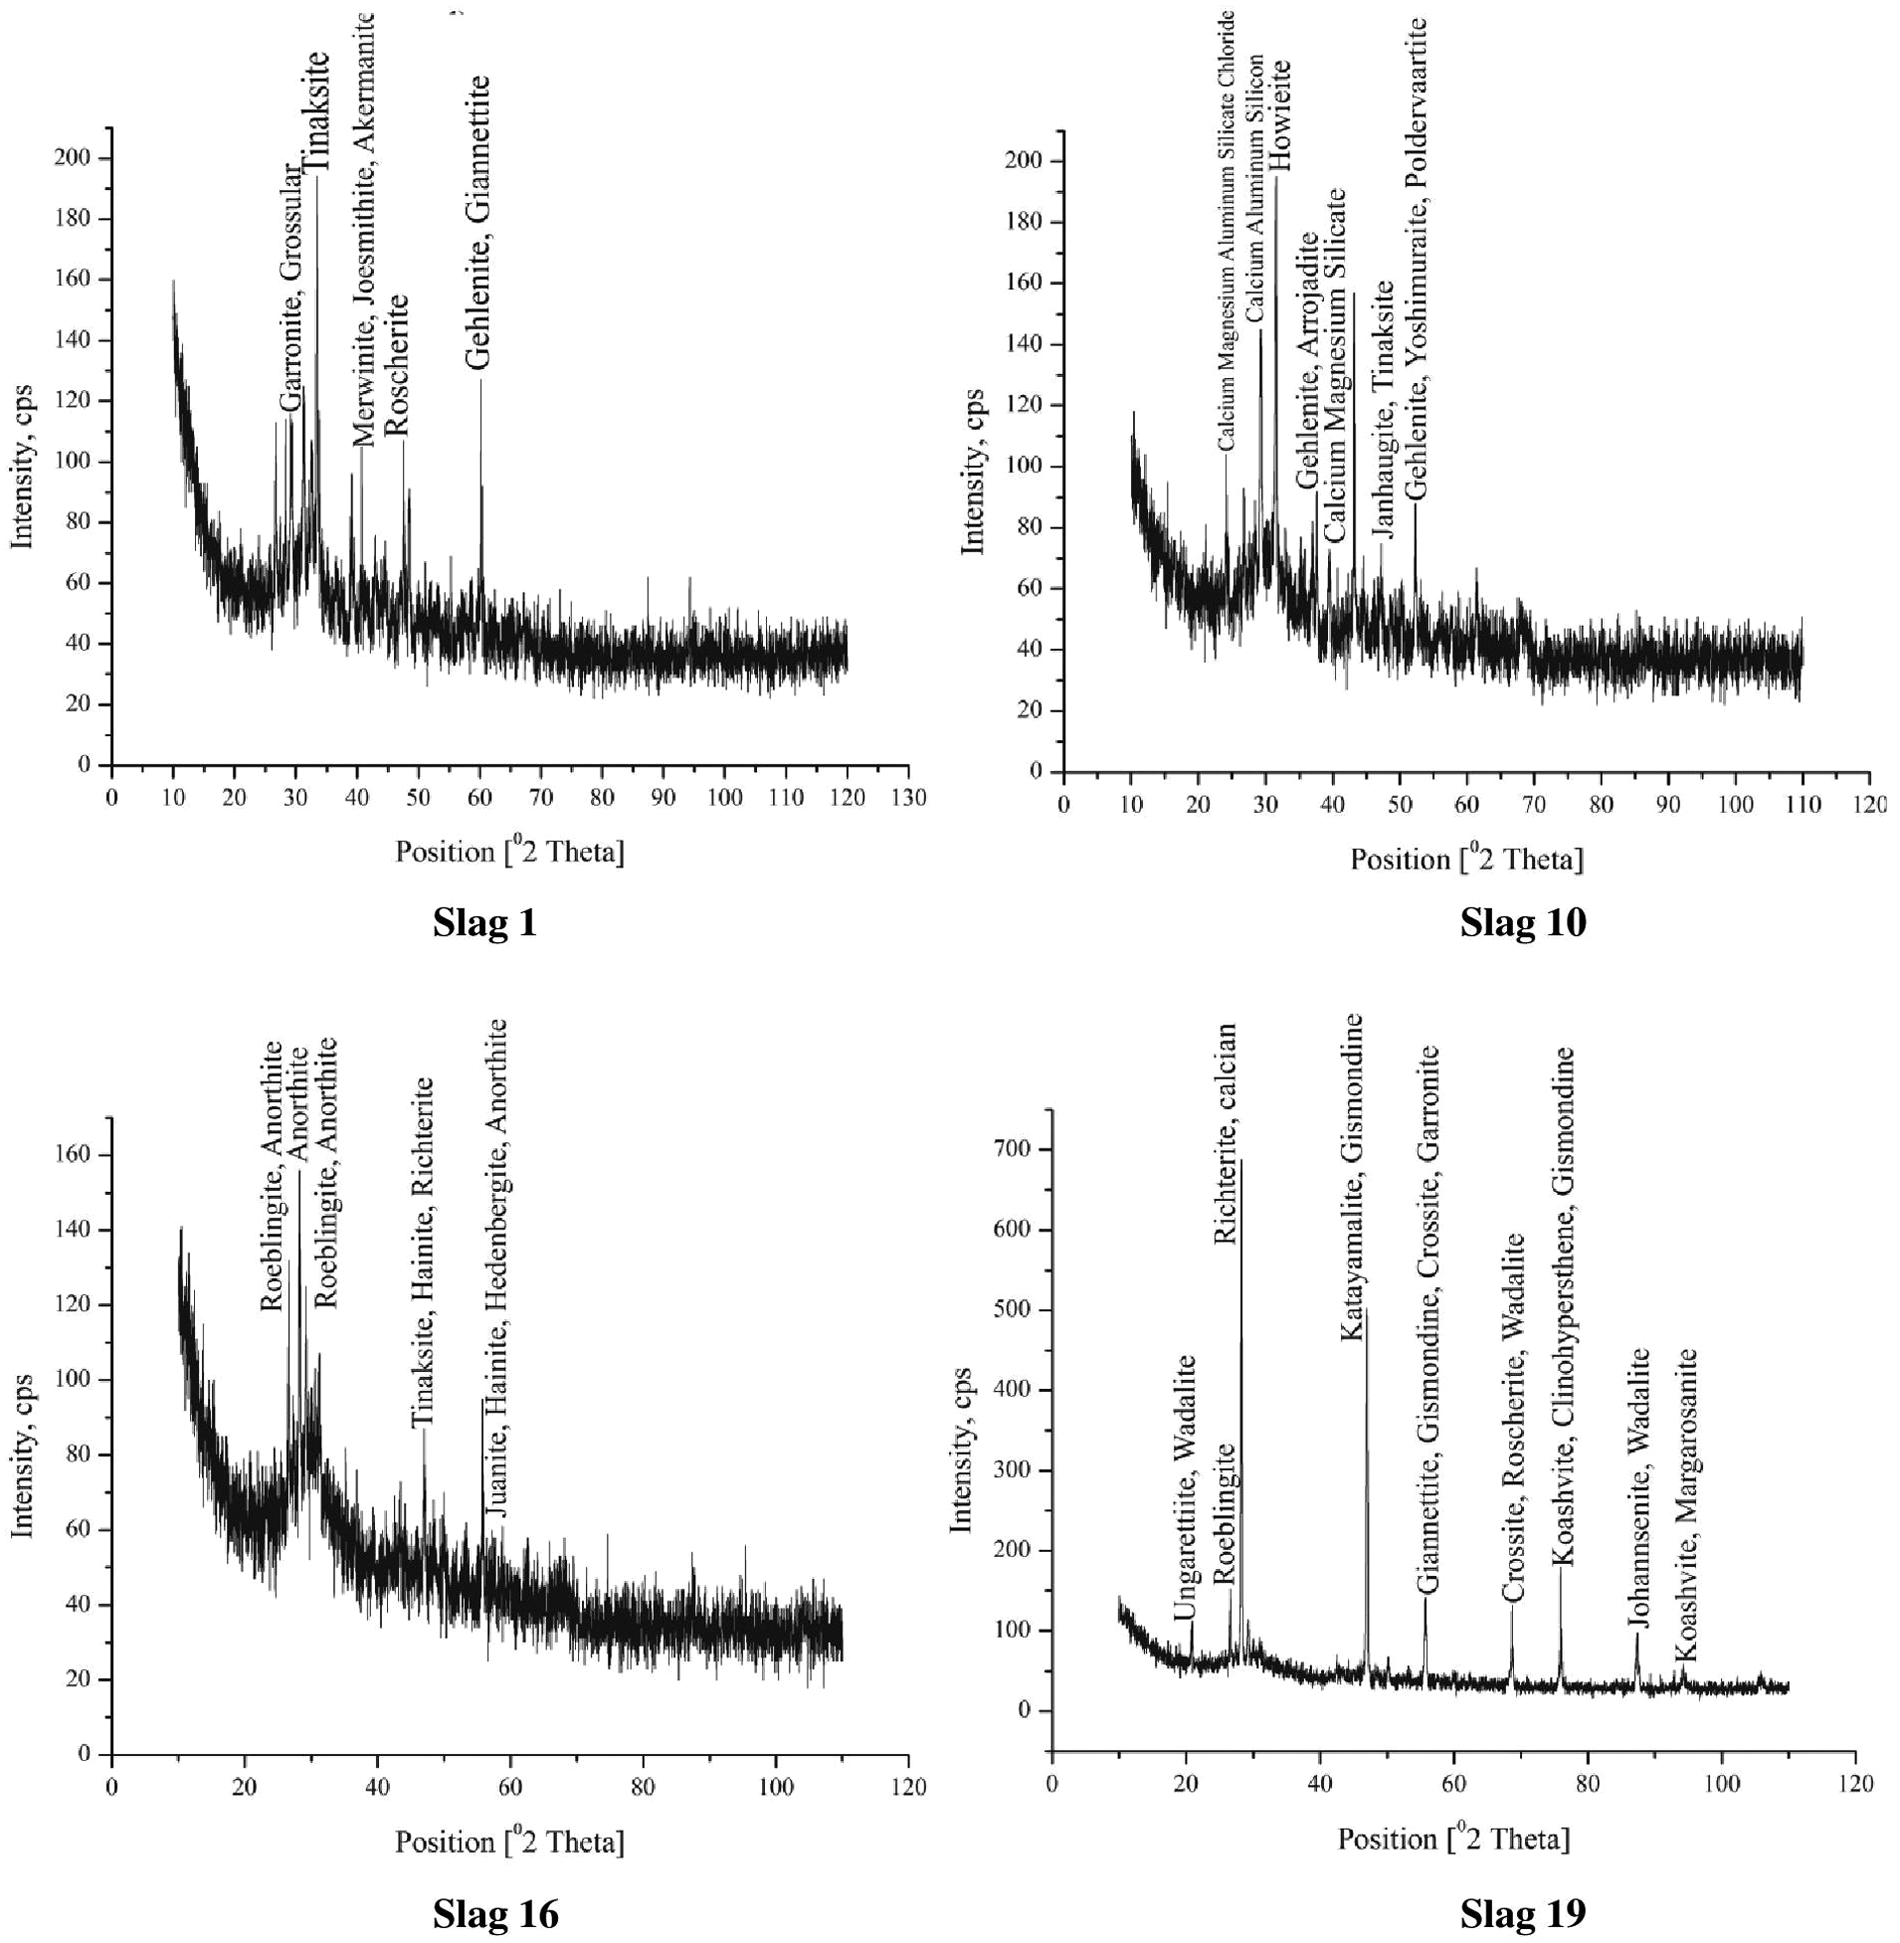
XRD analysis of some slag samples.
It may be seen from the phase identification database (PDF) index names and chemical formula of the above compounds that silicates and silicate hydroxide have been observed in most of the high basicity slags and lesser in low basicity slags. Silicates are formed due to oxidation of different elements such as Mn, Al and Mg in the presence of Si, whereas silicate hydroxides have been formed due to oxidation of elements and moisture pickup from atmosphere. Sodium element is being observed in about all the slag compounds, which may be due to sodium silicate binder added during the agglomeration process in the formulation of fluxes.
Contour surface plots for various properties
Contour plots indicating predicted values of various properties are shown in Figure 8. Different regions on contour surface 30 show variation in change in element transfer (Δ) so every contour curve marked on the surface gives constant value of change in element transfer and each dotted point on plot indicates one of the flux mixture combination. Figure 8 shows contour plots for ΔC, ΔSi, ΔMn, ΔP, ΔS and microhardness for different proportions of flux components CaO, CaF2 and Al2O3 with constant MgO = 20% content.
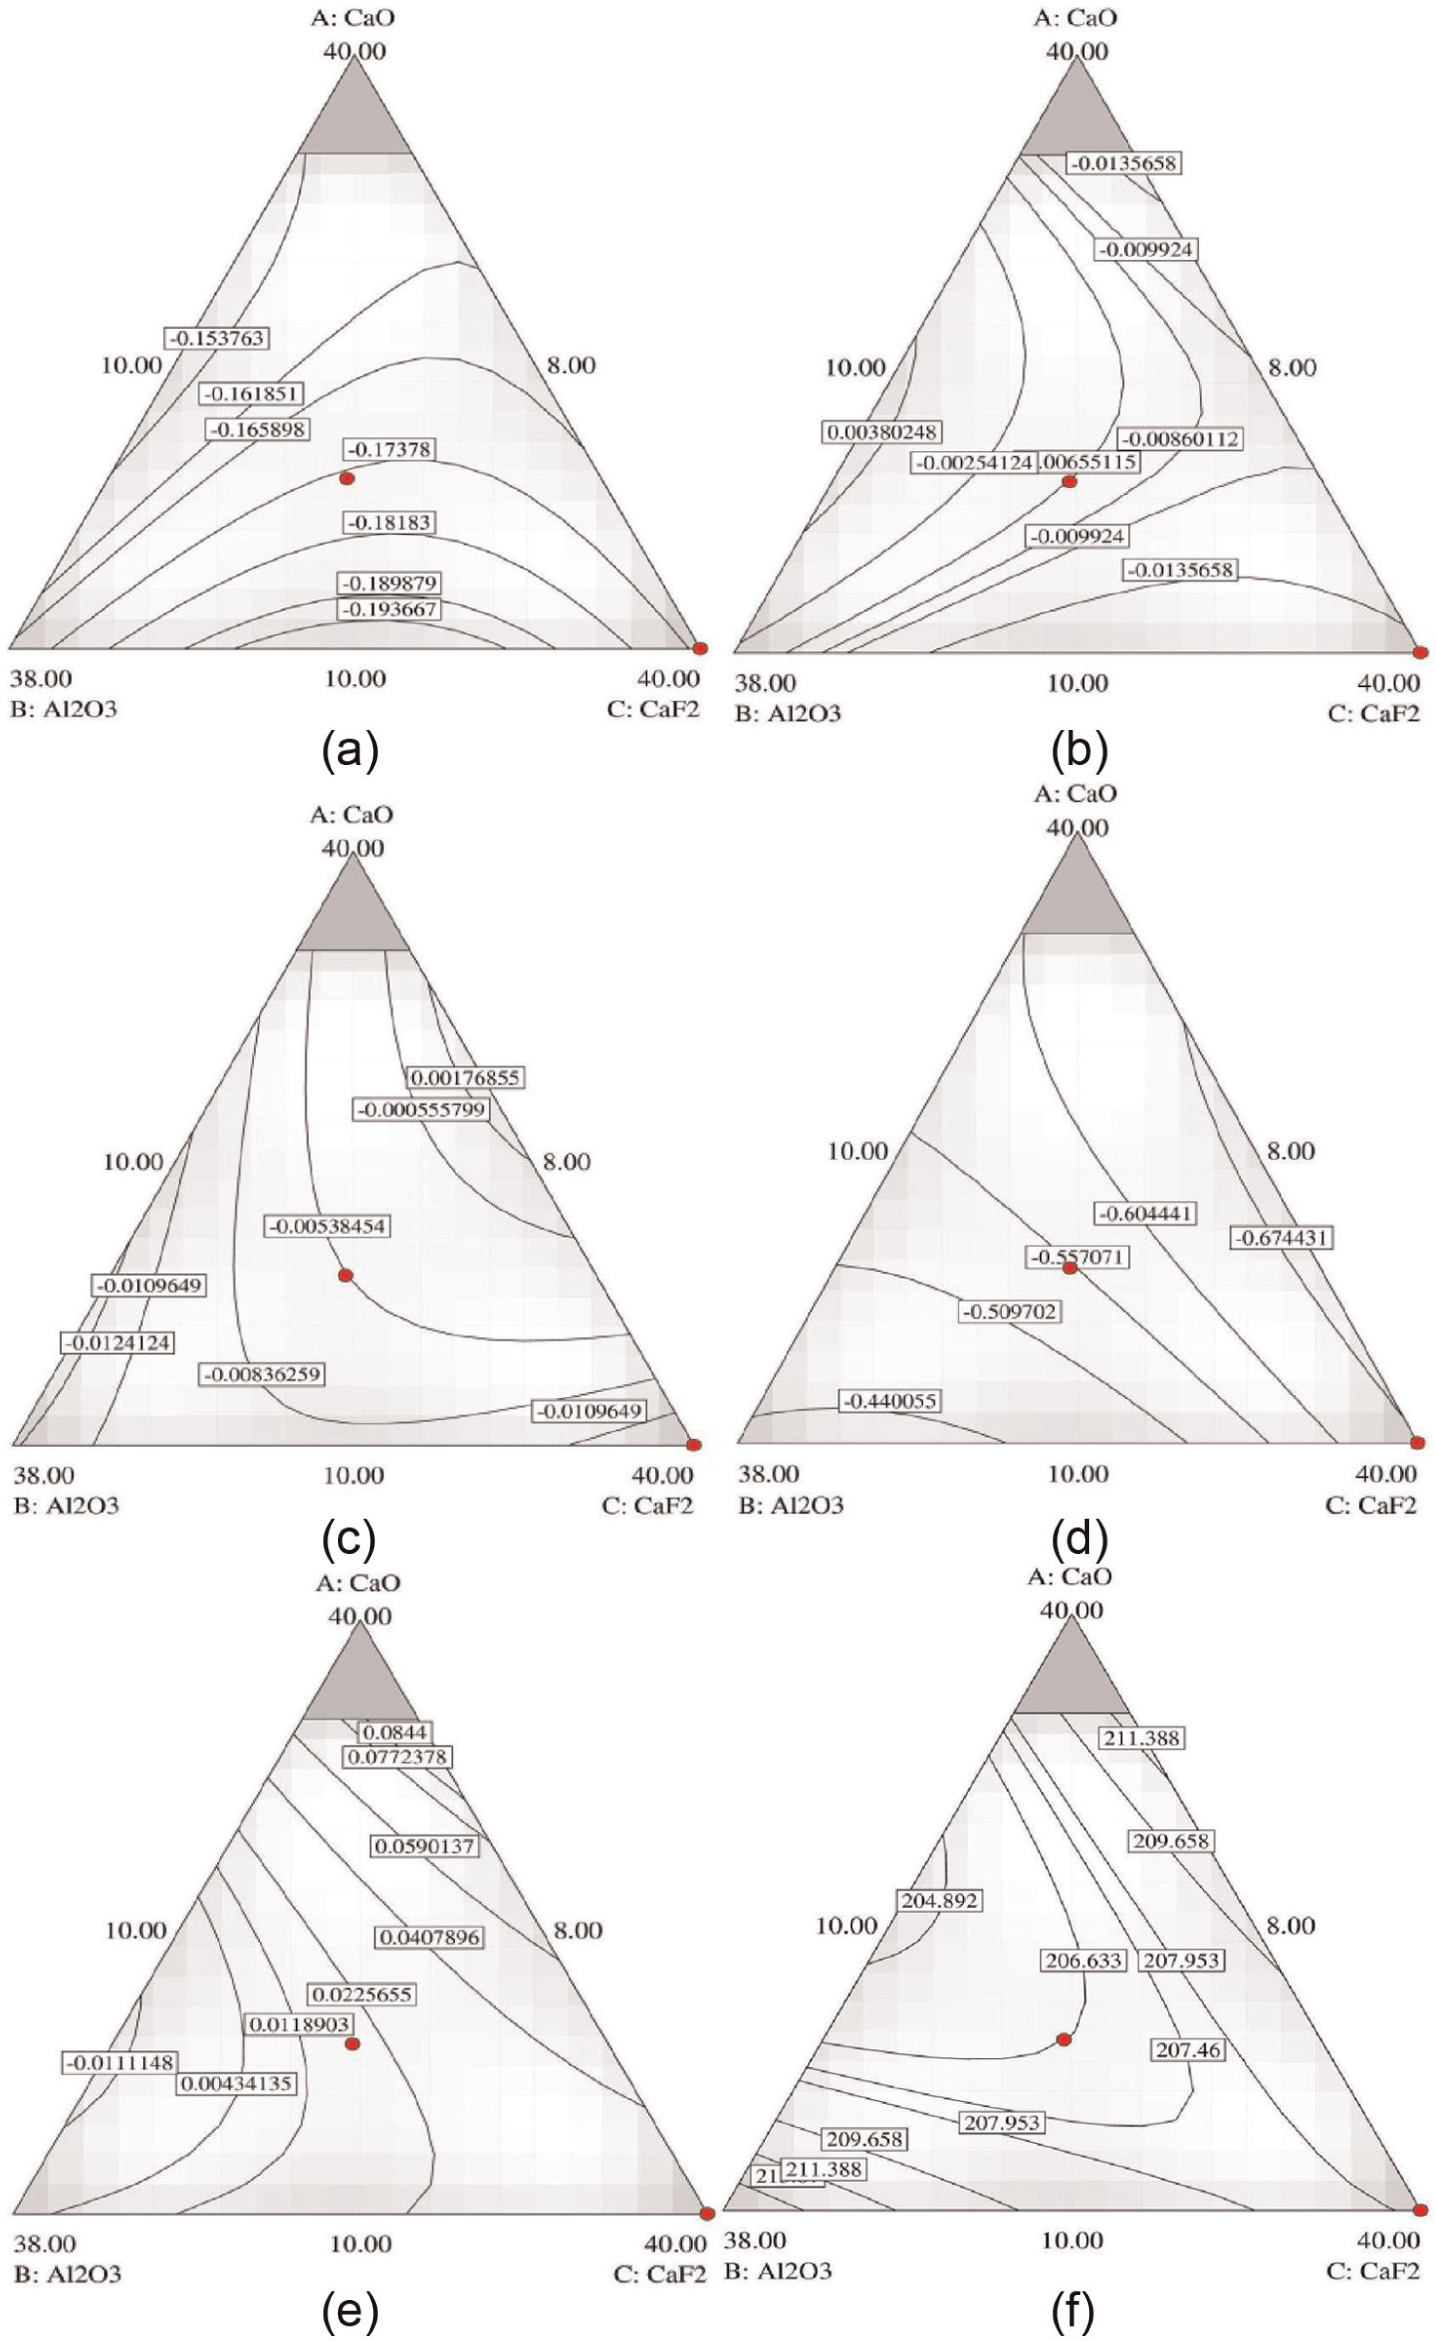
Contour plots for (a) ΔC, (b) ΔSi, (c) ΔMn, (d) ΔP, (e) ΔS and (f) microhardness at different proportions of flux components CaO, CaF2 and Al2O3 with constant MgO = 20% content.
Optimization of chemical composition and mechanical properties
In the multi-response optimization; attempt has been made to optimize the chemical composition of the weld metal equivalent to that of base, 31 and mechanical properties are maximized with microhardness to a target value of VHN = 215 (base metal). Mechanical properties, ultimate tensile strength and impact strength values have been used from the previous work done by Jindal et al. 19 given in Appendix 2. Simultaneous optimization of these output responses has been done using composite desirability optimization method suggested by Derringer and Suich. 32 This method makes use of an objective function D(x), called desirability function, which transforms an estimated response into a value called composite desirability. Composite desirability is the weighted geometric mean of individual desirability for the responses. The factor settings with maximum total desirability are considered to be the optimal parameter combinations. 33
The composite desirability is given by the following equations 34
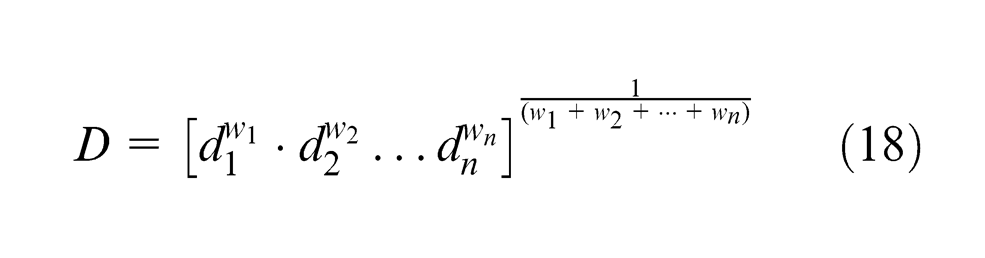
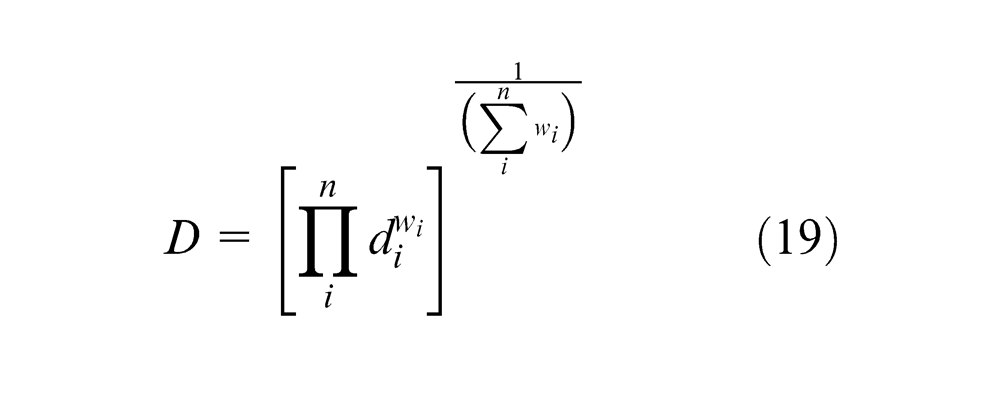
where n is the number of responses,
Three optimum solutions with equal weights for all responses were determined at different levels of desirability as presented in Table 6.
Optimum flux mixtures for chemical composition and mechanical properties.
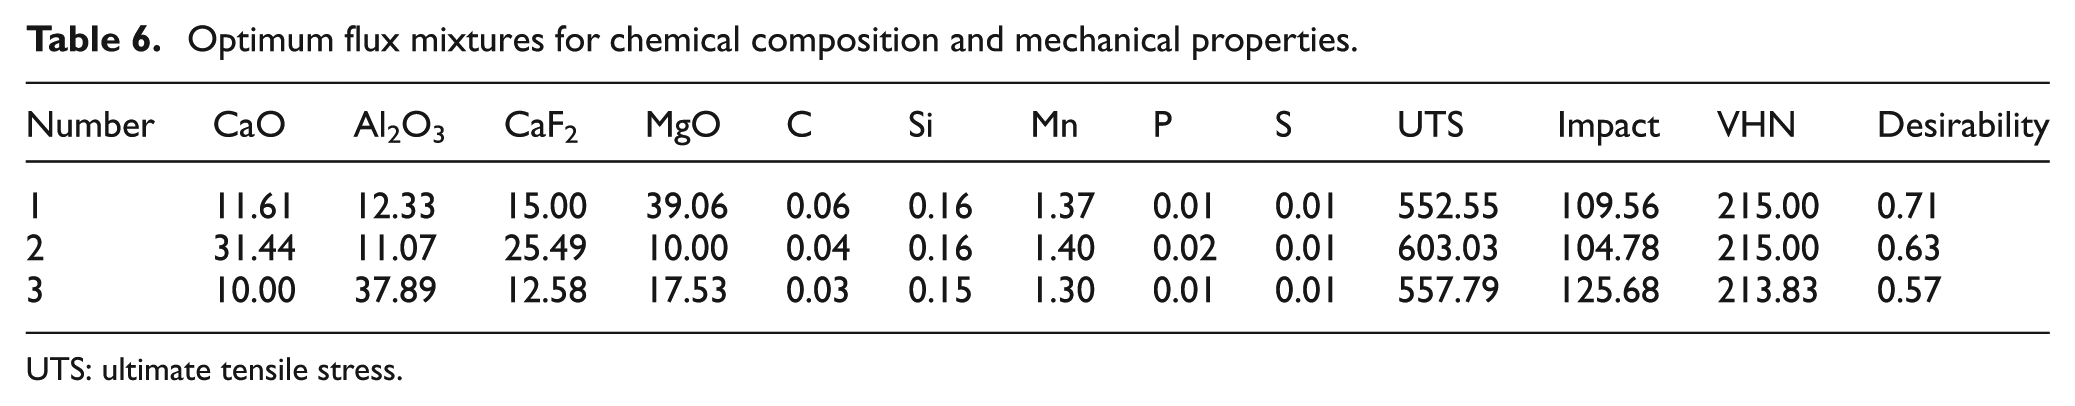
UTS: ultimate tensile stress.
Model validation
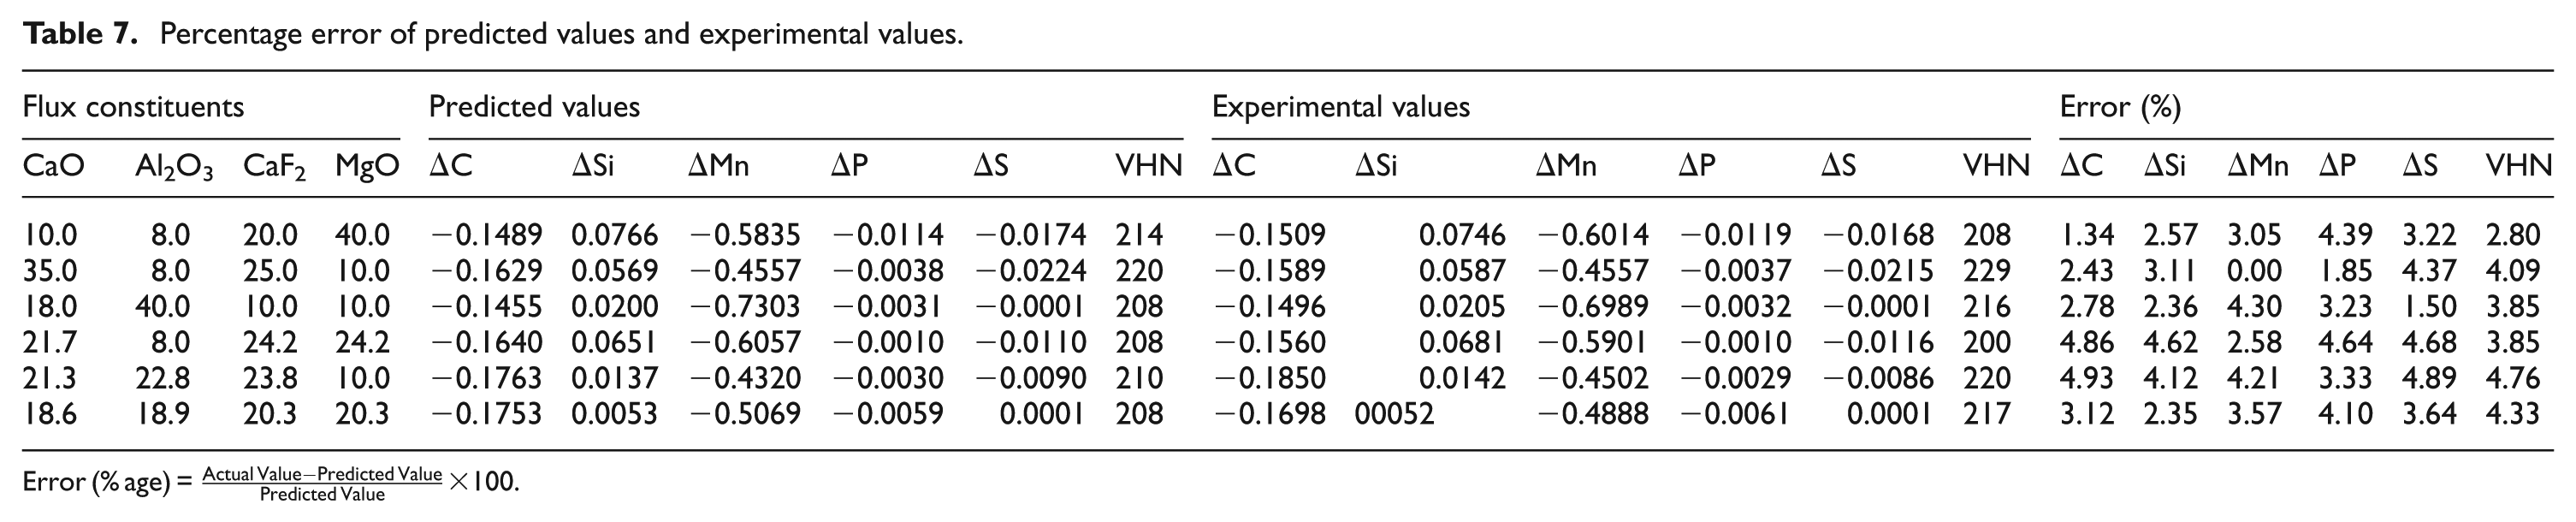
Confirmatory experiments were conducted using randomly selected flux mixtures to validate the regression model and to ensure the repeatability and reliability of the predicted values (Table 7). Six random flux mixtures were selected; weld samples were chemically and mechanically analyzed. From the experimental values, it has been observed that error (%) for each response is nearly 5% in almost all the samples.
Percentage error of predicted values and experimental values.
Conclusion
The following conclusions are drawn:
Statistically designed flux mixtures have been formulated by mixing eight flux components, varying four components CaO, Al2O3, CaF2 and MgO and keeping SiO2, TiO2 and MnO constant using the extreme vertices design method.
The mathematical models have been developed for the element transfer and microhardness, in terms of individual and binary flux mixtures for welding of HSLA steel. These models may be readily used to determine element transfer in weld metal for the same set of welding variables.
CaO is the most significant flux constituent and Al2O3 is the second most significant constituent among individual mixtures.
CaO·MgO and CaO·Al2O3 among binary mixtures have significant effect on element transfer and microhardness.
CaO is the important flux constituent, which tends to decrease ΔC, ΔP, ΔS and microhardness, but tends to increase ΔSi content.
Only MgO flux mixture has increasing effect on ΔMn, whereas no effect on any element transfer or microhardness.
Individual effect of Al2O3 in the flux has unfavorable effect on weld metal properties, whereas its binary mixtures have favorable effect on weld metal properties.
Optimum flux mixtures provided here may be used practically in the industry providing weld metal composition equivalent to base metal (HSLA steel).
The methodology adopted in this work may be applied to other base metal materials and electrode wire combinations to get optimum mixtures.
Footnotes
Appendix 1
t-Value and significance testing of regression coefficients for element transfer and microhardness.
| Predictor | ΔP |
ΔS |
VHN |
|||
|---|---|---|---|---|---|---|
| t0 | Whether significant or not * | t0 | Whether significant or not * | t0 | Whether significant or not * | |
| CaO | −1.90 | Significant | −2.60 | Significant | 12.95 | Significant |
| Al2O3 | 2.01 | Significant | −0.34 | Not significant | 21.67 | Significant |
| CaF2 | −2.67 | Significant | 0.87 | Not significant | 18.45 | Significant |
| MgO | −0.83 | Not significant | −0.61 | Not significant | 21.99 | Significant |
| CaO·Al2O3 | −0.88 | Not significant | 2.51 | Significant | −5.26 | Significant |
| CaO·CaF2 | 2.57 | Significant | 1.16 | Not significant | −0.23 | Not significant |
| CaO·MgO | 2.69 | Significant | 2.08 | Significant | −3.68 | Significant |
| Al2O3·CaF2 | 1.29 | Not significant | −1.58 | Not significant | −1.55 | Not significant |
| Al2O3·MgO | −2.65 | Significant | 0.37 | Not significant | −2.42 | Significant |
| CaF2·MgO | 0.79 | Not significant | −1.20 | Not significant | −5.51 | Significant |
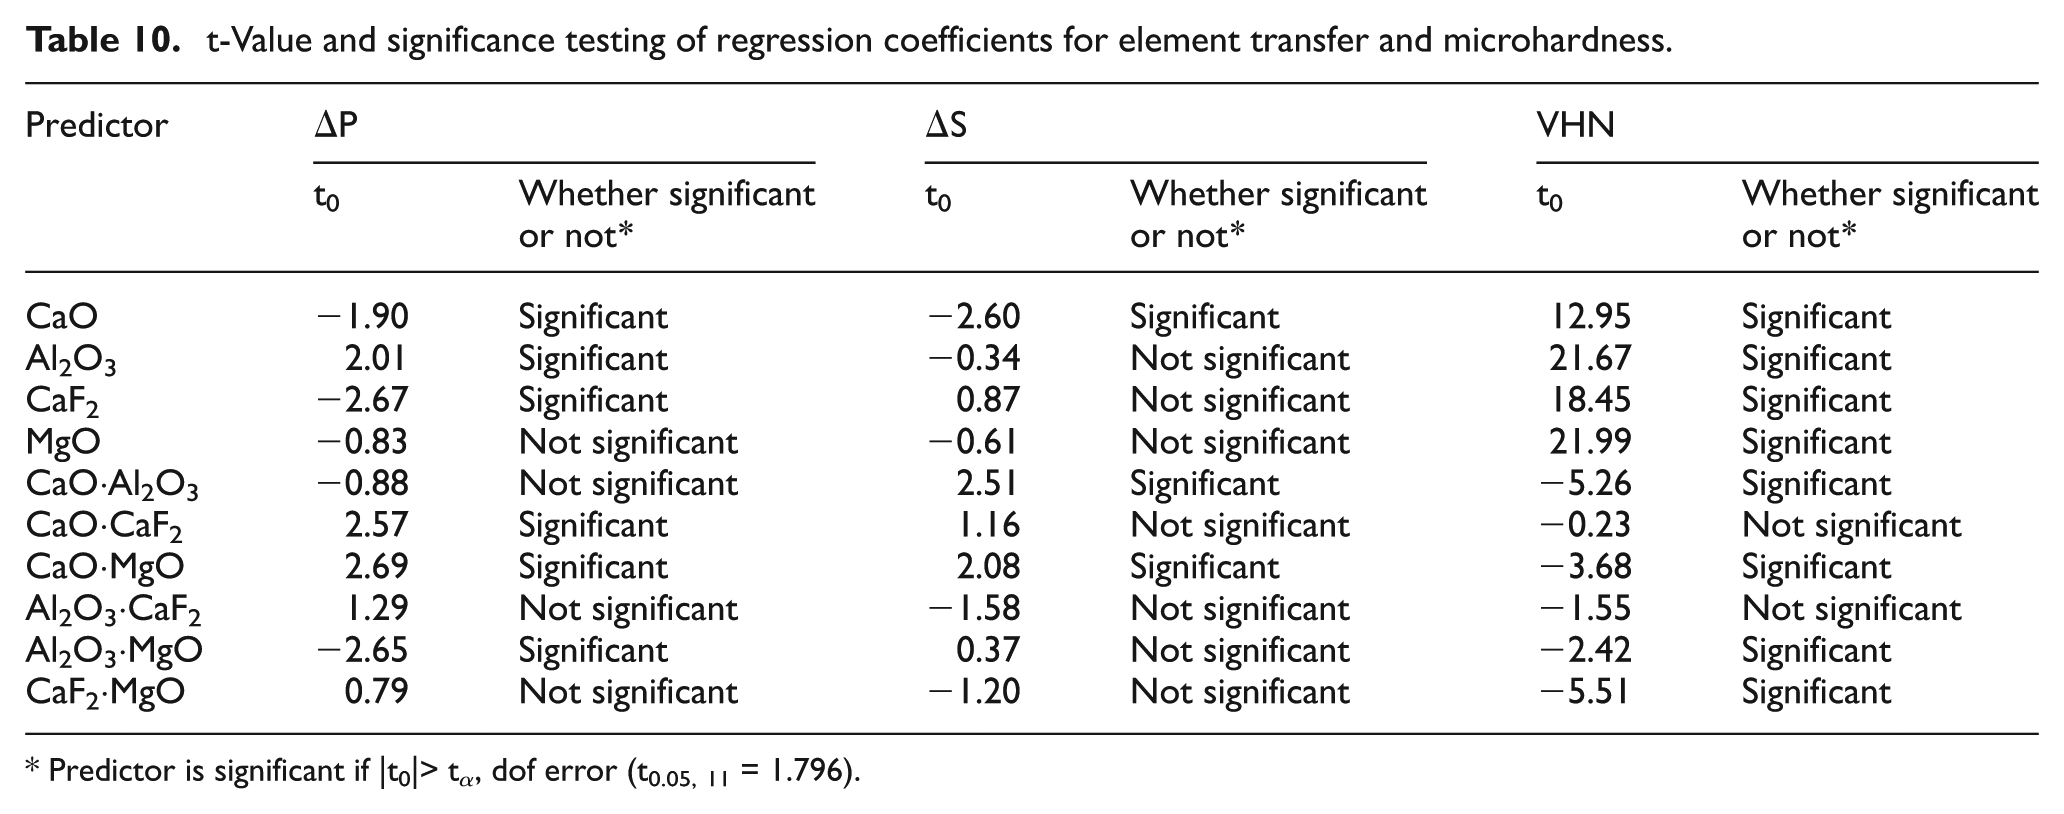
Predictor is significant if |t0|> tα, dof error (t0.05, 11 = 1.796).
Appendix 2
Mechanical properties of weld metal samples.
| Experiment number | Ultimate tensile stress (MPa) |
Impact strength (N m) |
||||
|---|---|---|---|---|---|---|
| Sample 1 | Sample 2 | Mean | Sample 1 | Sample 2 | Mean | |
| 1 | 565.7 | 510.4 | 538.1 | 63.8 | 157.0 | 110.4 |
| 2 | 535.6 | 511.5 | 523.6 | 49.1 | 98.1 | 73.6 |
| 3 | 528.4 | 591.84 | 560.1 | 107.9 | 112.8 | 110.4 |
| 4 | 582.7 | 571.55 | 577.1 | 127.5 | 112.8 | 120.2 |
| 5 | 520.2 | 572.04 | 546.1 | 98.1 | 89.8 | 94.0 |
| 6 | 527.1 | 527.1 | 527.1 | 100.0 | 110.0 | 105.0 |
| 7 | 647 | 630 | 638.5 | 101.9 | 98.1 | 100.0 |
| 8 | 614.8 | 583.5 | 599.2 | 88.3 | 88.3 | 88.3 |
| 9 | 422.2 | 600 | 511.1 | 39.2 | 117.7 | 78.5 |
| 10 | 460 | 416 | 438.0 | 39.2 | 56.4 | 47.8 |
| 11 | 600.1 | 589.64 | 594.9 | 132.4 | 147.2 | 139.8 |
| 12 | 573.4 | 584.6 | 579.0 | 107.9 | 132.4 | 120.2 |
| 13 | 540.1 | 567.9 | 554.0 | 98.1 | 186.4 | 142.2 |
| 14 | 635.3 | 574.7 | 605.0 | 132.4 | 137.3 | 134.9 |
| 15 | 520.6 | 579.5 | 550.1 | 148.1 | 107.9 | 128.0 |
| 16 | 610.3 | 581 | 595.7 | 157.0 | 103.0 | 130.0 |
| 17 | 496.4 | 507.3 | 501.9 | 93.2 | 103.0 | 98.1 |
| 18 | 545.9 | 544.1 | 545.0 | 122.3 | 117.7 | 120.0 |
| 19 | 625.7 | 559.9 | 592.8 | 93.2 | 122.6 | 107.9 |
| 20 | 575.4 | 573.5 | 574.5 | 98.1 | 122.6 | 110.4 |
| 21 | 600.5 | 585.9 | 593.2 | 132.4 | 141.8 | 137.1 |
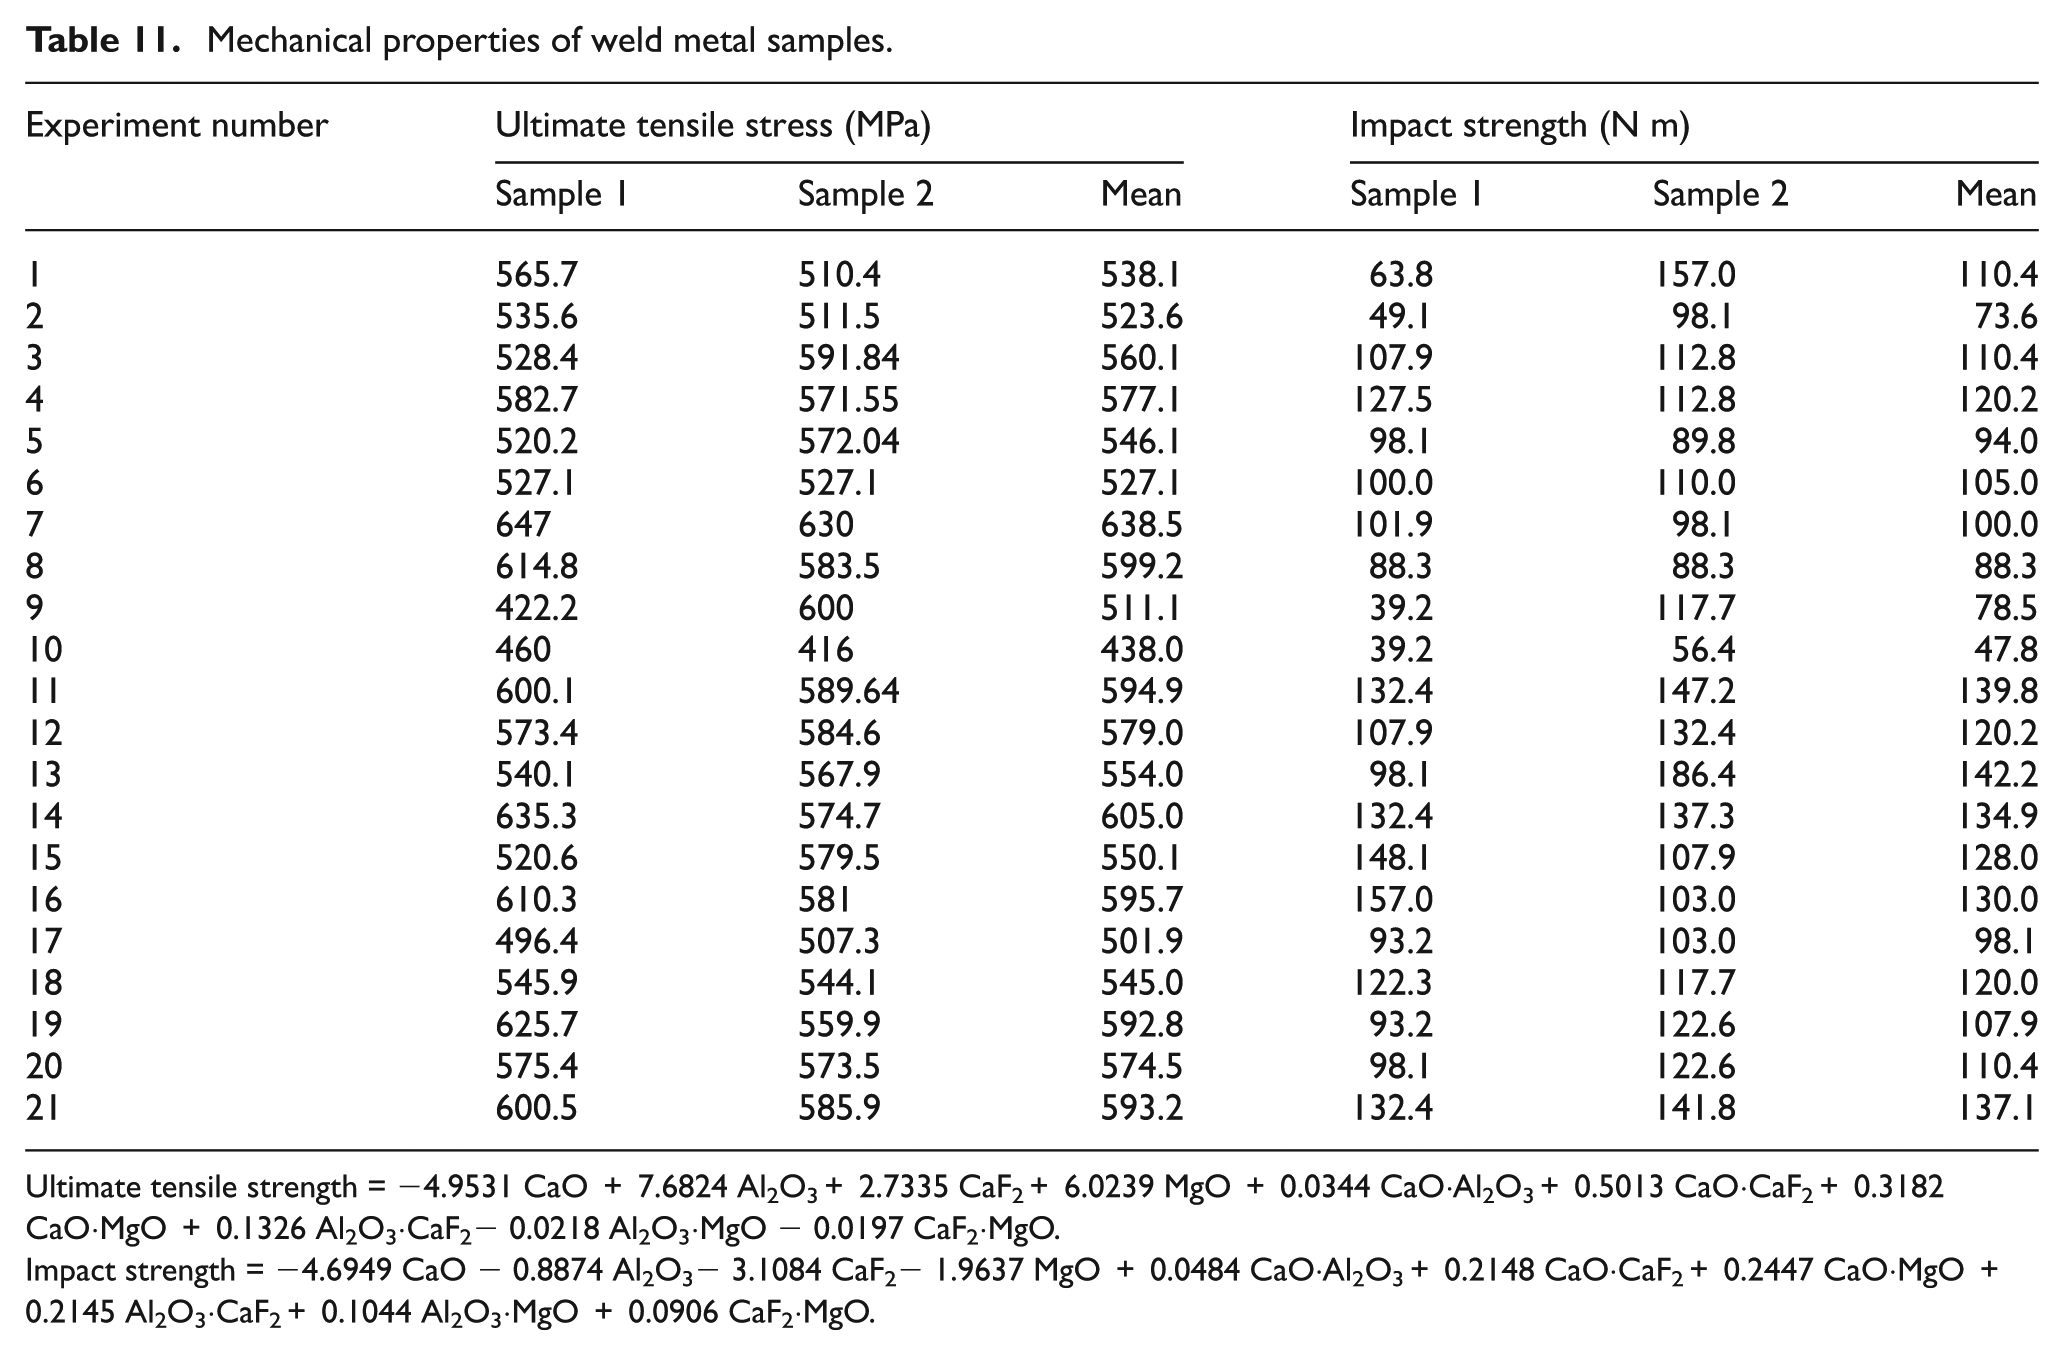
Ultimate tensile strength = −4.9531 CaO + 7.6824 Al2O3+ 2.7335 CaF2+ 6.0239 MgO + 0.0344 CaO·Al2O3+ 0.5013 CaO·CaF2+ 0.3182 CaO·MgO + 0.1326 Al2O3·CaF2− 0.0218 Al2O3·MgO − 0.0197 CaF2·MgO.
Impact strength = −4.6949 CaO − 0.8874 Al2O3− 3.1084 CaF2− 1.9637 MgO + 0.0484 CaO·Al2O3+ 0.2148 CaO·CaF2+ 0.2447 CaO·MgO + 0.2145 Al2O3·CaF2+ 0.1044 Al2O3·MgO + 0.0906 CaF2·MgO.
Declaration of conflicting interests
The authors declare that there is no conflict of interest.
Funding
This research received no specific grant from any funding agency in the public, commercial or not-for-profit sectors.