
Abstract
A complex system, be it a manufacturing system or otherwise, is prone to abnormal functioning, as its units or elements experience unpredictable functional variation. Determining the likely root causes of its undesirable functional events is required to carry out cause analysis of the system from functional point of view. Although the manufacturers provide some information in the manual in this regard, yet these are not conclusive and fall much short in guiding the users in functional cause analysis. Structure plays an important role in this objective. In this article, a procedure for functional cause analysis of a complex manufacturing system through structure is presented using digraph models. ‘Function event digraph’ is defined for a complex manufacturing system at its various hierarchical levels by considering its input and output functions and their interrelations. A top or undesired functional event for the system is identified from its digraph model, and its root causes are obtained by developing ‘functional cause analysis tree’. The suggested approach helps designers and practicing engineers in functional cause analysis of manufacturing systems and thus leading to reliability enhancement and sustenance. An example of a complex CNC (computer numerical control) grinding machine is illustrated to demonstrate the methodology.
Keywords
Introduction
Manufacturing systems are designed for accuracy, safety and economic manufacturing, which are achieved through high level of controls and structural integrations. 1 However, this increases the complexity in terms of system functions, 2 which increases unpredictable functional variations of their elements. These are unacceptable beyond a certain value and may cause abnormality in their behaviour. 3 A reliable system means that it is able to perform its desired functions. Therefore, a key objective in designing reliable complex systems is to understand the system functions and determine the causes of their variations that lead to abnormal functional behaviour. Although the manufacturers do provide some information in the manual in this regard, yet these are not conclusive and fall much short in guiding the users in functional cause analysis of complex manufacturing systems.
System structure is a key in reliability evaluation, 4 failure assessment 5 and fault diagnosis.6,7 This is also desirable for understanding system functions,3,8 which helps to examine the abnormal functional behaviour of the system by identifying the causes of functional variations of its elements. This article aims at developing a methodology for cause analysis of functions of complex manufacturing systems through the system structure.
Most of the research work in the related areas has been directed towards significant system failures. A commonly used technique, fault tree analysis (FTA), has been applied extensively in power plants, chemical process plants, aerospace systems and so on to identify causes of the faults. Some attempts of this technique have been made in the context of manufacturing systems.9,10 The fault tree diagram identifies root causes of the failure through combinations of intermediate events. The manual construction of diagram is done by logically connecting the top event with the basic events by logic operators AND, OR and so on. Although it is widely used, this has certain deficiencies that include not considering the system structure explicitly, inefficient handling of complex systems and possibility of inconsistency among failure events. Lapp and Powers 11 took care of these concerns and developed computer-aided fault tree synthesis using digraph models that used a well-established system approach of graph theory. This takes care of structure explicitly and has been extensively applied in chemical and processing systems to develop fault trees. This is also convenient in handling through computer. The researchers considered correlation of input and output variables such as temperature, pressure and flow rate for modelling system components, including their failures that helped to develop the digraph models of components and the system. This approach is extended to complex manufacturing systems in this article. The functions and their relations are of great interest to such systems, but this has not been part of Lapp and Powers 11 methodology. In view of this, this aspect will be included in the proposed methodology.
The proposed methodology does require understanding of functions and their interrelations through the system structure to develop digraph model for functional cause analysis. Such component function event digraphs (FEDs) need to be developed and these combined to obtain assembly function event digraph (AFED) to help in cause analysis of functions at assembly level. In the similar way, the assembly digraphs are combined to obtain subsystem digraphs and finally leading to the system digraph model, which is then used for developing tree structure for functional cause analysis for a defined top or undesired functional event. By developing digraphs at various hierarchical levels of the complex manufacturing system, the functional cause analysis can be carried out.
This article is organized, with next section on ‘Understanding system structure and functions’ that helps to identify structure and functions of a complex manufacturing system. Subsequently, FED is defined and system function event digraph (SFED) is developed. This is followed by defining a top or undesired functional event. The subsequent section enumerates the steps of functional cause analysis, which is followed by an example. Finally, utility of the approach and conclusions are included.
Understanding system structure and functions
This section outlines structure and functions at hierarchical levels of the system.
Structure
Structure of a complex manufacturing system means its units or elements and their interconnection. The system structure is, therefore, understood by identifying and designating its units or elements at its hierarchical levels. Let a system (S) consists of subsystems, assemblies and components. Depending on the system complexity, additional nomenclature of elements can be defined. A subsystem is designated as Si, with i = 1, 2, …, N, and its mth assembly be
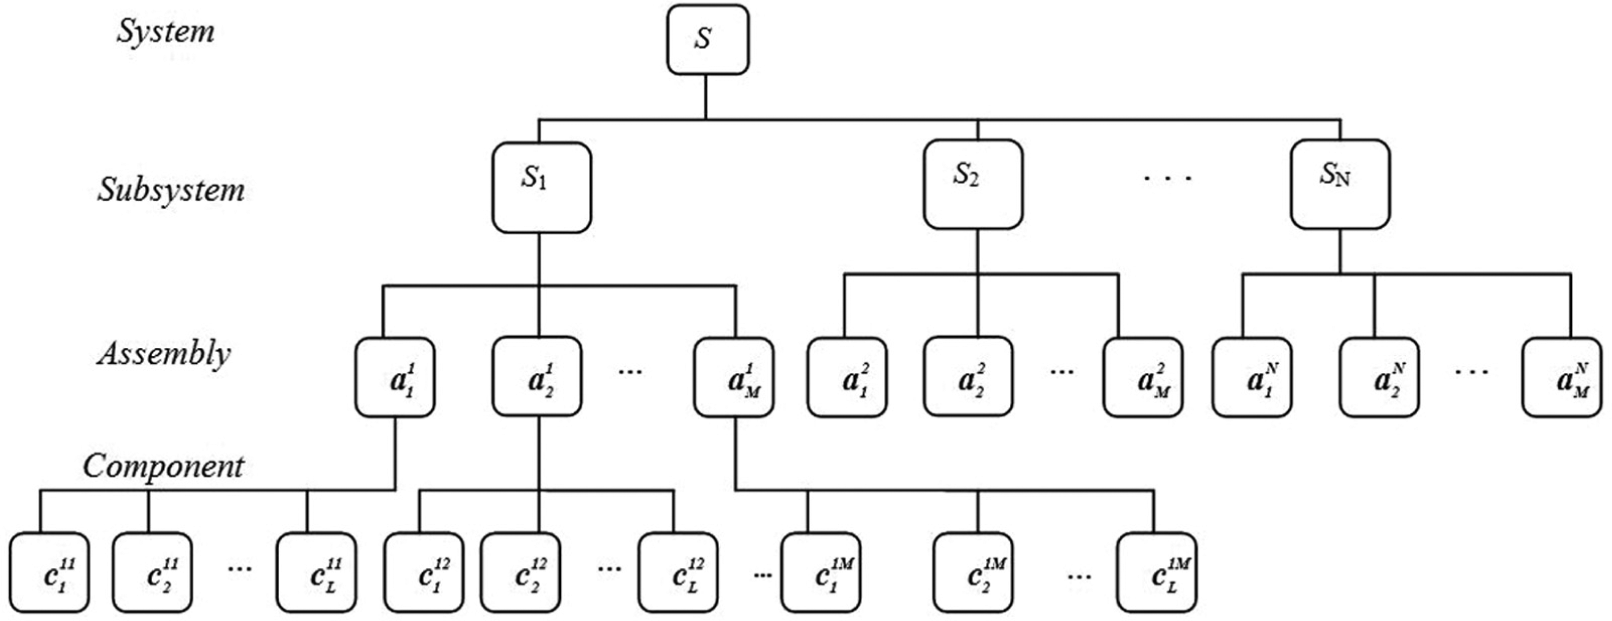
Structure of a complex manufacturing system.
Functions
Functions of a system are classified into three groups: overall, primary and secondary. An overall function means the desired output of the system or subsystem (e.g. ‘Grind shaft to specified size’ is the overall function of a cylindrical grinding machine), while a primary function is defined as the function, which is the main purpose of existence of a system element, be it a component, assembly or subsystem (e.g. ‘Guide table on machine bed’ is the primary function of a guideway assembly of a computer numerical control (CNC) machine). For execution of the primary function, support of a secondary function is needed (e.g. ‘Dampen shocks and vibrations’ is the secondary function of the guideway assembly). System functions are designated on the lines of system structure, which is discussed below.
Let ‘F’ be the overall function of the system, with
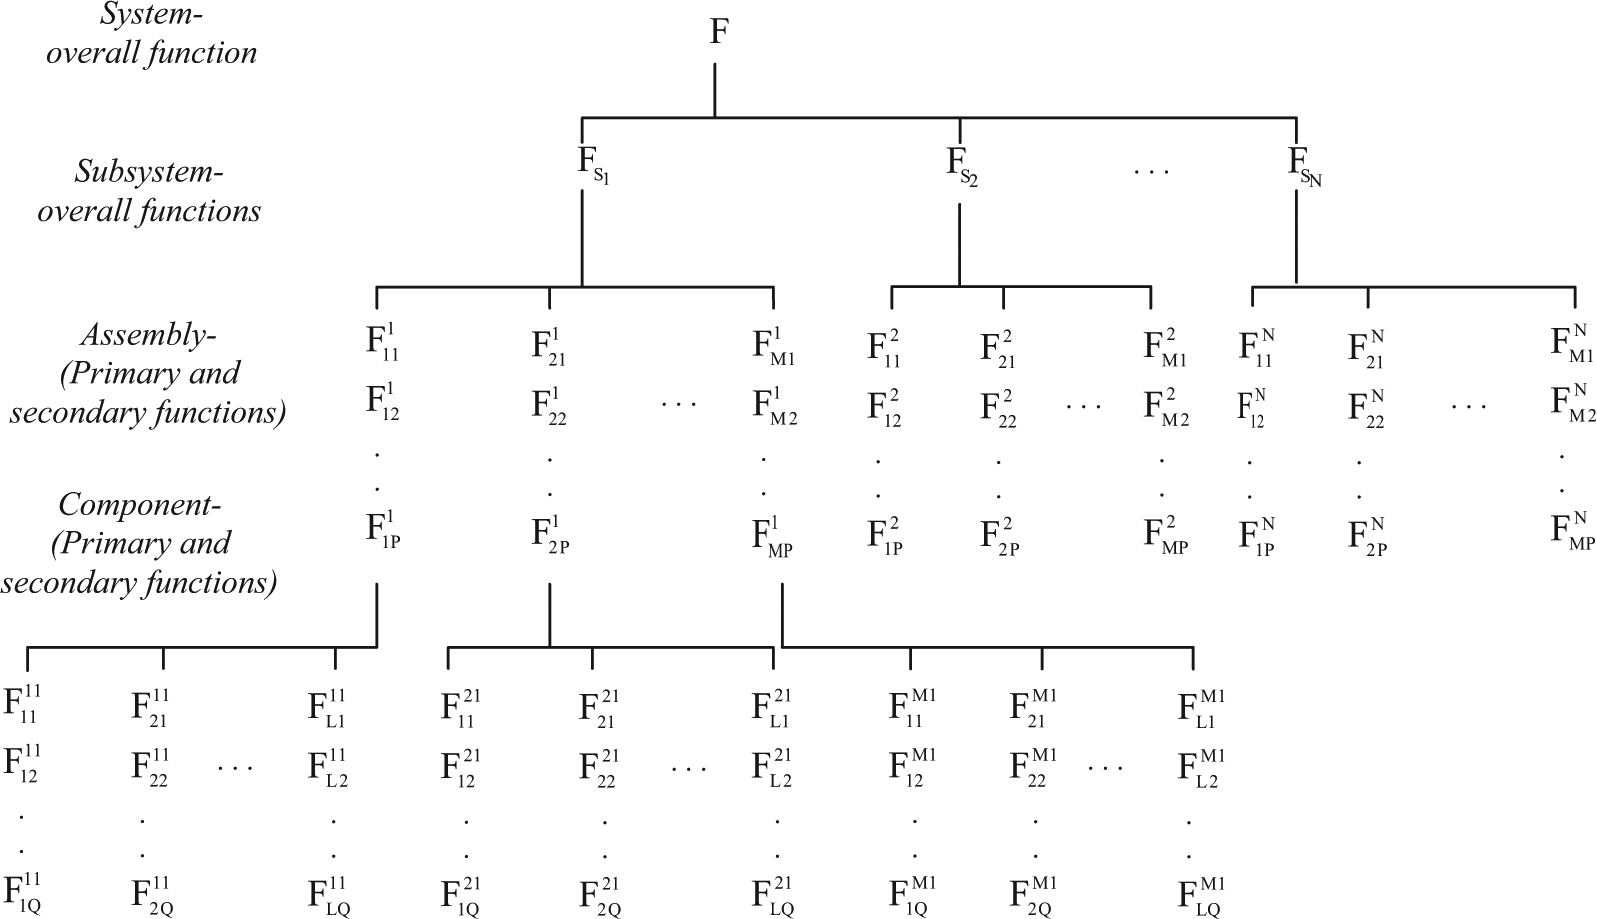
Hierarchy of functions of a complex manufacturing system.
It may be mentioned that the functional descriptions are on the lines as per the standard functional taxonomies developed by Pahl and Beitz, 12 Kirschman and Fadel, 13 Stone and Wood, 14 Kitamura and Mizoguchi, 15 Xu et al., 16 Hirtz et al. 17 and Van Eck. 18 However, these are appropriately modified in the context of functional cause analysis.
FEDs
An event is a condition, while a function event implies a condition related to the function. FED is defined in this section. For this, it is necessary to identify functions, including function loss events, and their interrelations for all elements (i.e. subsystems, assemblies, etc). The discussion on functions in the above section will be helpful. The interrelations will be assessed through input and output functions. An activity that is the purpose of an element is its output function, and the one that contributes to the output function is the input function. An element can have more than one input and output functions. If an element is unable to perform its intended function, the event contributing to it will be termed as its function failure or function loss event, which may be partial or complete and may be due to structural failure or even hardware or software failure.
The objective of this article is to carry out functional cause analysis of complex manufacturing systems. The methodology applied for this is extension of Lapp and Powers 11 approach, which uses concept of fault trees. This is a well-established procedure in reliability and safety engineering. It starts with a top or undesired event and ends with root causes. Conventional and manually constructed fault trees incorporate the system structure implicitly, while Lapp and Powers did so in an explicit way. Moreover, their procedure is convenient in computer-aided construction of the fault trees. The researchers applied digraph models, which considered the system or process structure. The digraphs are developed for each element or unit of the process through interrelations of their input–output parameters (e.g. temperature, pressure, flow rate) in terms of deviations. The nodes in the digraph represent process variables and certain types of failures, while the directed edges represent the relations among the process parameters or failures that are represented by numbers, that is, 0 (no deviation), 1 (moderate deviation) and 10 (large deviation). In addition, the sign of deviation or gain, that is, increase or decrease (+, −), is also assigned, that is, depending on the direction of the deviation of the second parameter relative to the first. For example, if there is a moderate and opposite deviation in the second parameter or node relative to first one, gain ‘−1’ is assigned to the edge connecting these two nodes. In this way, digraph models are developed to represent relations between process variables. These digraph models are combined to obtain digraph for the system or process. The developed digraph of the system helps to construct the fault tree by identifying a node that is a top event and considering the nodes or events that are connected or input to it. The obtained fault tree is exhaustive.
Lapp and Powers approach is extended for complex manufacturing systems, including refining it. For manufacturing systems, fulfilling of their functions is important in the context of system reliability and hence its availability. Therefore, it is necessary to identify functional interrelations, that is, input–output function, and function failure or function loss event–output function relationships. In view of this, a FED that reflects the functional behaviour of the system is defined. For complex manufacturing systems consisting of several elements at its various hierarchical levels, it is desirable to identify and designate each element and their functions, which will help to develop FEDs.
Mathematically, SFED, DSFED, for a complex manufacturing system is expressed as DSFED = {V, E}; where V is a set of nodes that represent input functions, output functions or function loss events, while E is a set of edges, which represent the interrelations among the functions and function loss events (i.e. function failures) that are represented by nodes through gain 0, ±1 or ±10. The SFED is obtained by combining its digraphs at lower hierarchical levels. This will aid in construction of a functional cause analysis tree for a system top or undesired functional event, which will help in functional cause analysis.
On the lines of SFED, digraphs at subsystem and assembly levels, that is, subsystem function event digraph (SSFED) and AFED, are defined.
Top or undesired functional event
A fault tree diagram starts with a top or undesired event and terminates with root causes. In the same way, a functional cause analysis tree starts with a top or undesired functional event and will end with the root or contributing functional causes. Top or undesired functional events for complex manufacturing systems represent functional performance or its variation, for example, low mechanical (ME) power, loss of electrical energy, low lube oil flow, oil pressure signal weak and lack of spindle power. There can be more than one top or undesired functional events of a manufacturing system.
For development of the functional cause analysis tree, select a node in the SFED that represents the top or undesired functional event. Identify the local causes of this event by noting the inputs to the node in the SFED. One needs to select an appropriate operator (AND, OR), depending on whether feedback or feedforward loop passes through the current node. 11 Use this operator to connect logically remaining local causes. Check for consistency to ensure that two mutually exclusive events cannot occur at the same time. The tree is completed, if primal or basic events remain.
Steps for development of functional cause analysis tree
Select a manufacturing system and understand its structure by identifying its various subsystems, assemblies and components. Refer to section ‘Understanding system structure and functions’ for details.
Identify functions at its various system levels on the lines of structure, that is, Step 1. Refer to section ‘Understanding system structure and functions’ for details.
Identify functional interrelations, that is, input–output function, and function failure or function loss event–output function relationships for each assembly and assign appropriate value of gains. Refer to section ‘FEDs’. Develop digraphs for each assembly and subsystems. Obtain SFED by combining the subsystems and assembly digraphs. Refer to section ‘FEDs’ for details.
Select a node in the SFED that represents the top or undesired functional event.
Determine functional failure causes of this functional event by identifying the inputs to the node of the digraph, which represents the top or undesired functional event.
Select the appropriate operator (AND, OR), including considering of any loop (feedback and feedforward) that passes through the current node. Use this operator to connect logically remaining local causes.
Check for the consistency, if feedback and feedforward loops are involved. It means non-occurrence of two mutually exclusive functional events.
Stop, if only primal functional failure event remains. Return to Step 4 for any undeveloped functional failure event. This is the functional cause analysis tree for the top functional event.
Example
A CNC grinding machine (Figure 3) for grinding of automotive crankshafts is selected to demonstrate the proposed methodology. Step-by-step of the methodology is illustrated below.
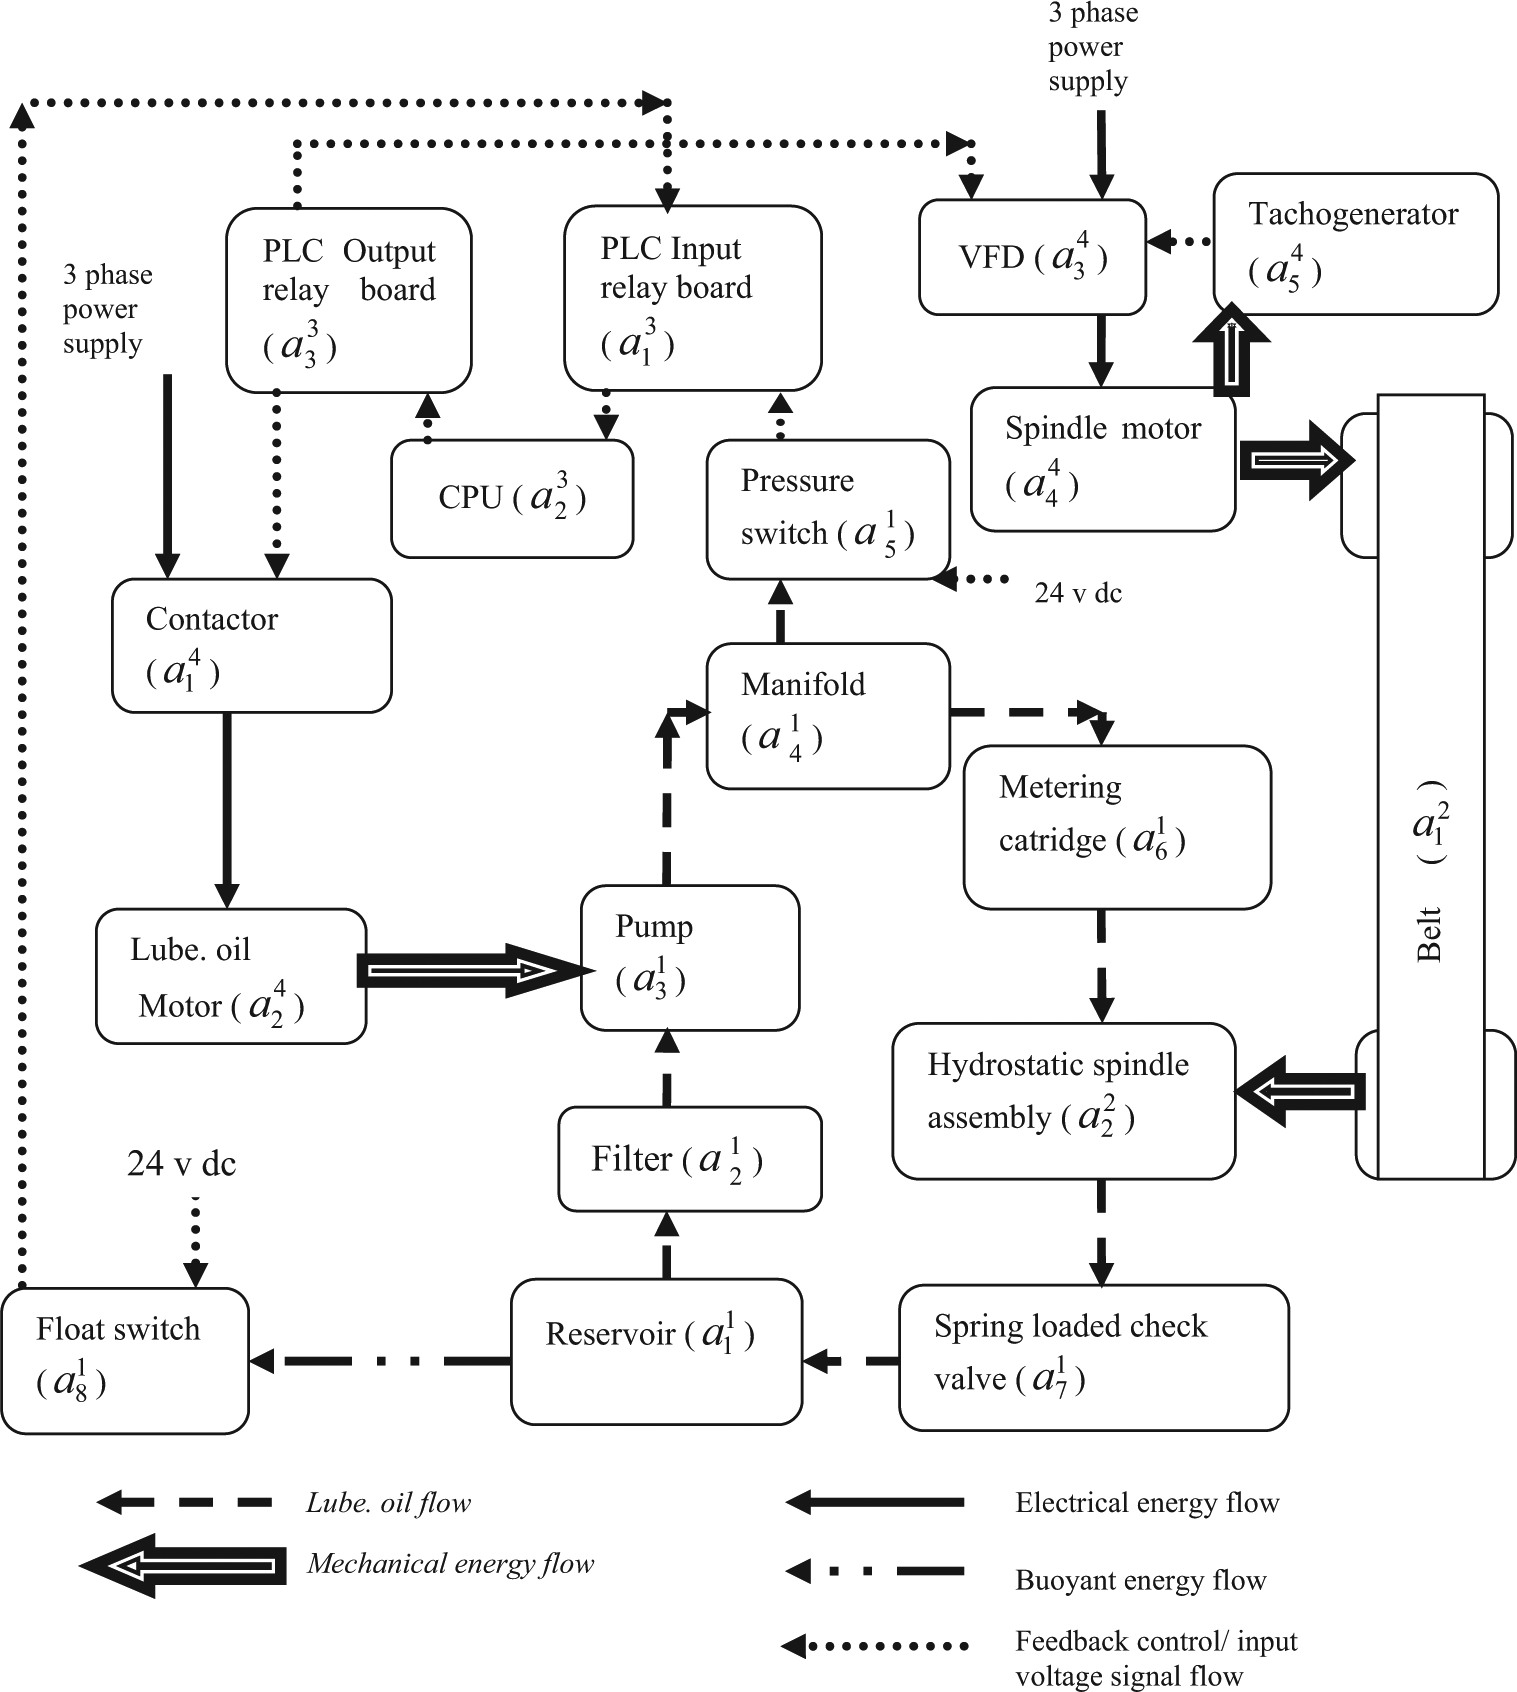
CNC grinding machine.
Step 1. CNC grinding machine, a complex manufacturing system, is selected that is shown in Figure 3.
Its four subsystems are as follows: S1, spindle lubrication (SPLUB) subsystem; S2, ME subsystem; S3, CNC control (CNCC) subsystem and S4, power supply (PS) subsystem. These subsystems and their connections are helpful to identify system functions at its hierarchical levels and also their interrelations for developing the SFED (DSFED) for the CNC grinding machine, called CNC FED (CNCDSFED). The elements and their functions of CNC grinding machine are identified and designated on the lines of discussion in section ‘Understanding system structure and functions’. Figure 3 of the CNC grinding machine shows closed-cycle SPLUB, lubrication pressure-controlled spindle on/off feedforward, oil level feedback and spindle speed feedback control loops. Various flows such as lube oil flow, ME energy flow, electrical energy flow, buoyant energy flow and feedback control/input voltage signal flow are represented in single dashed bold line, compounded line, thick bold line, dashed double-dotted line and round dotted line, respectively, in Figure 3. SPLUB subsystem helps to lubricate spindle hydrostatic bearing assembly of ME subsystem. The SPLUB subsystem operates at a pressure of 70 bar to maintain the fluid lubricant film at the spindle-support bearing interface.
Lubrication pump (
Step 2. Based on the structural and functional understanding, the input and output functions and function loss events are identified for all assemblies of the CNC grinding machine and are given in Appendix 1 (Table 1). This helps to identify functional relations of assemblies.
Step 3. Let us consider the input function ‘Allow oil at specified system pressure (
Based on the above, the effect of variation in input function and function loss event on the output function for the assembly reservoir is represented by a digraph and is shown in Figure 4, which is the AFED for reservoir. Figure 4 also shows the AFEDs of assemblies, filter and pump. Similarly, the AFEDs for other assemblies are also developed and combined to obtain SFED for the CNC grinding machine, (CNCDSFED), which is shown in Figure 5. It is also possible to carry out functional cause analysis of any particular subsystem or assembly by developing its FED.
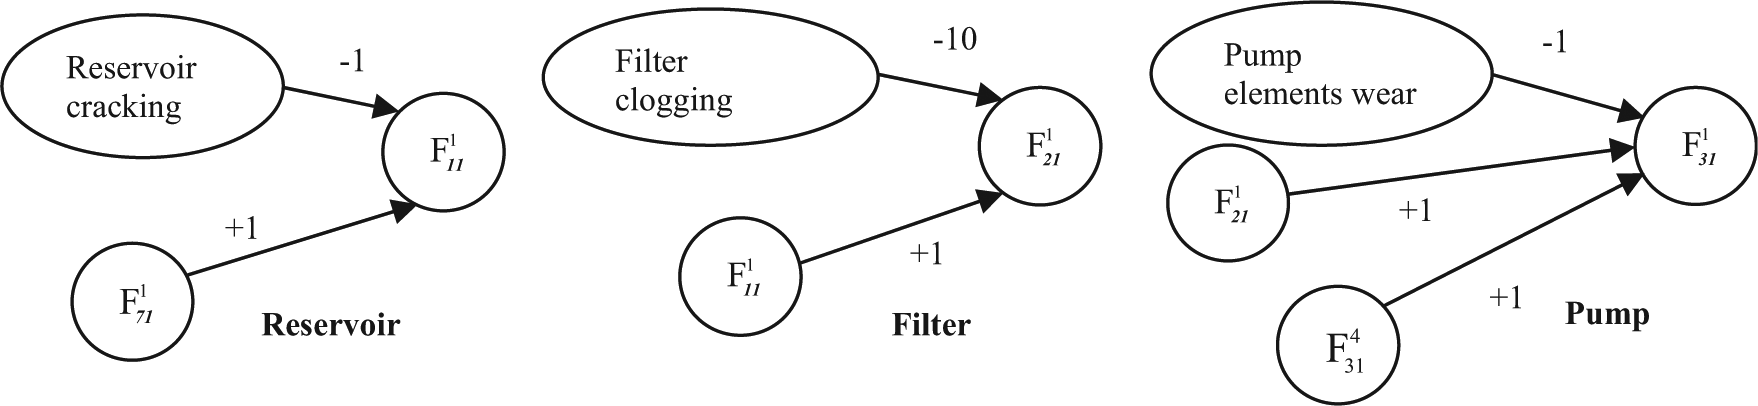
Assembly function event digraph (AFED) models of various assemblies of the CNC grinding machine.
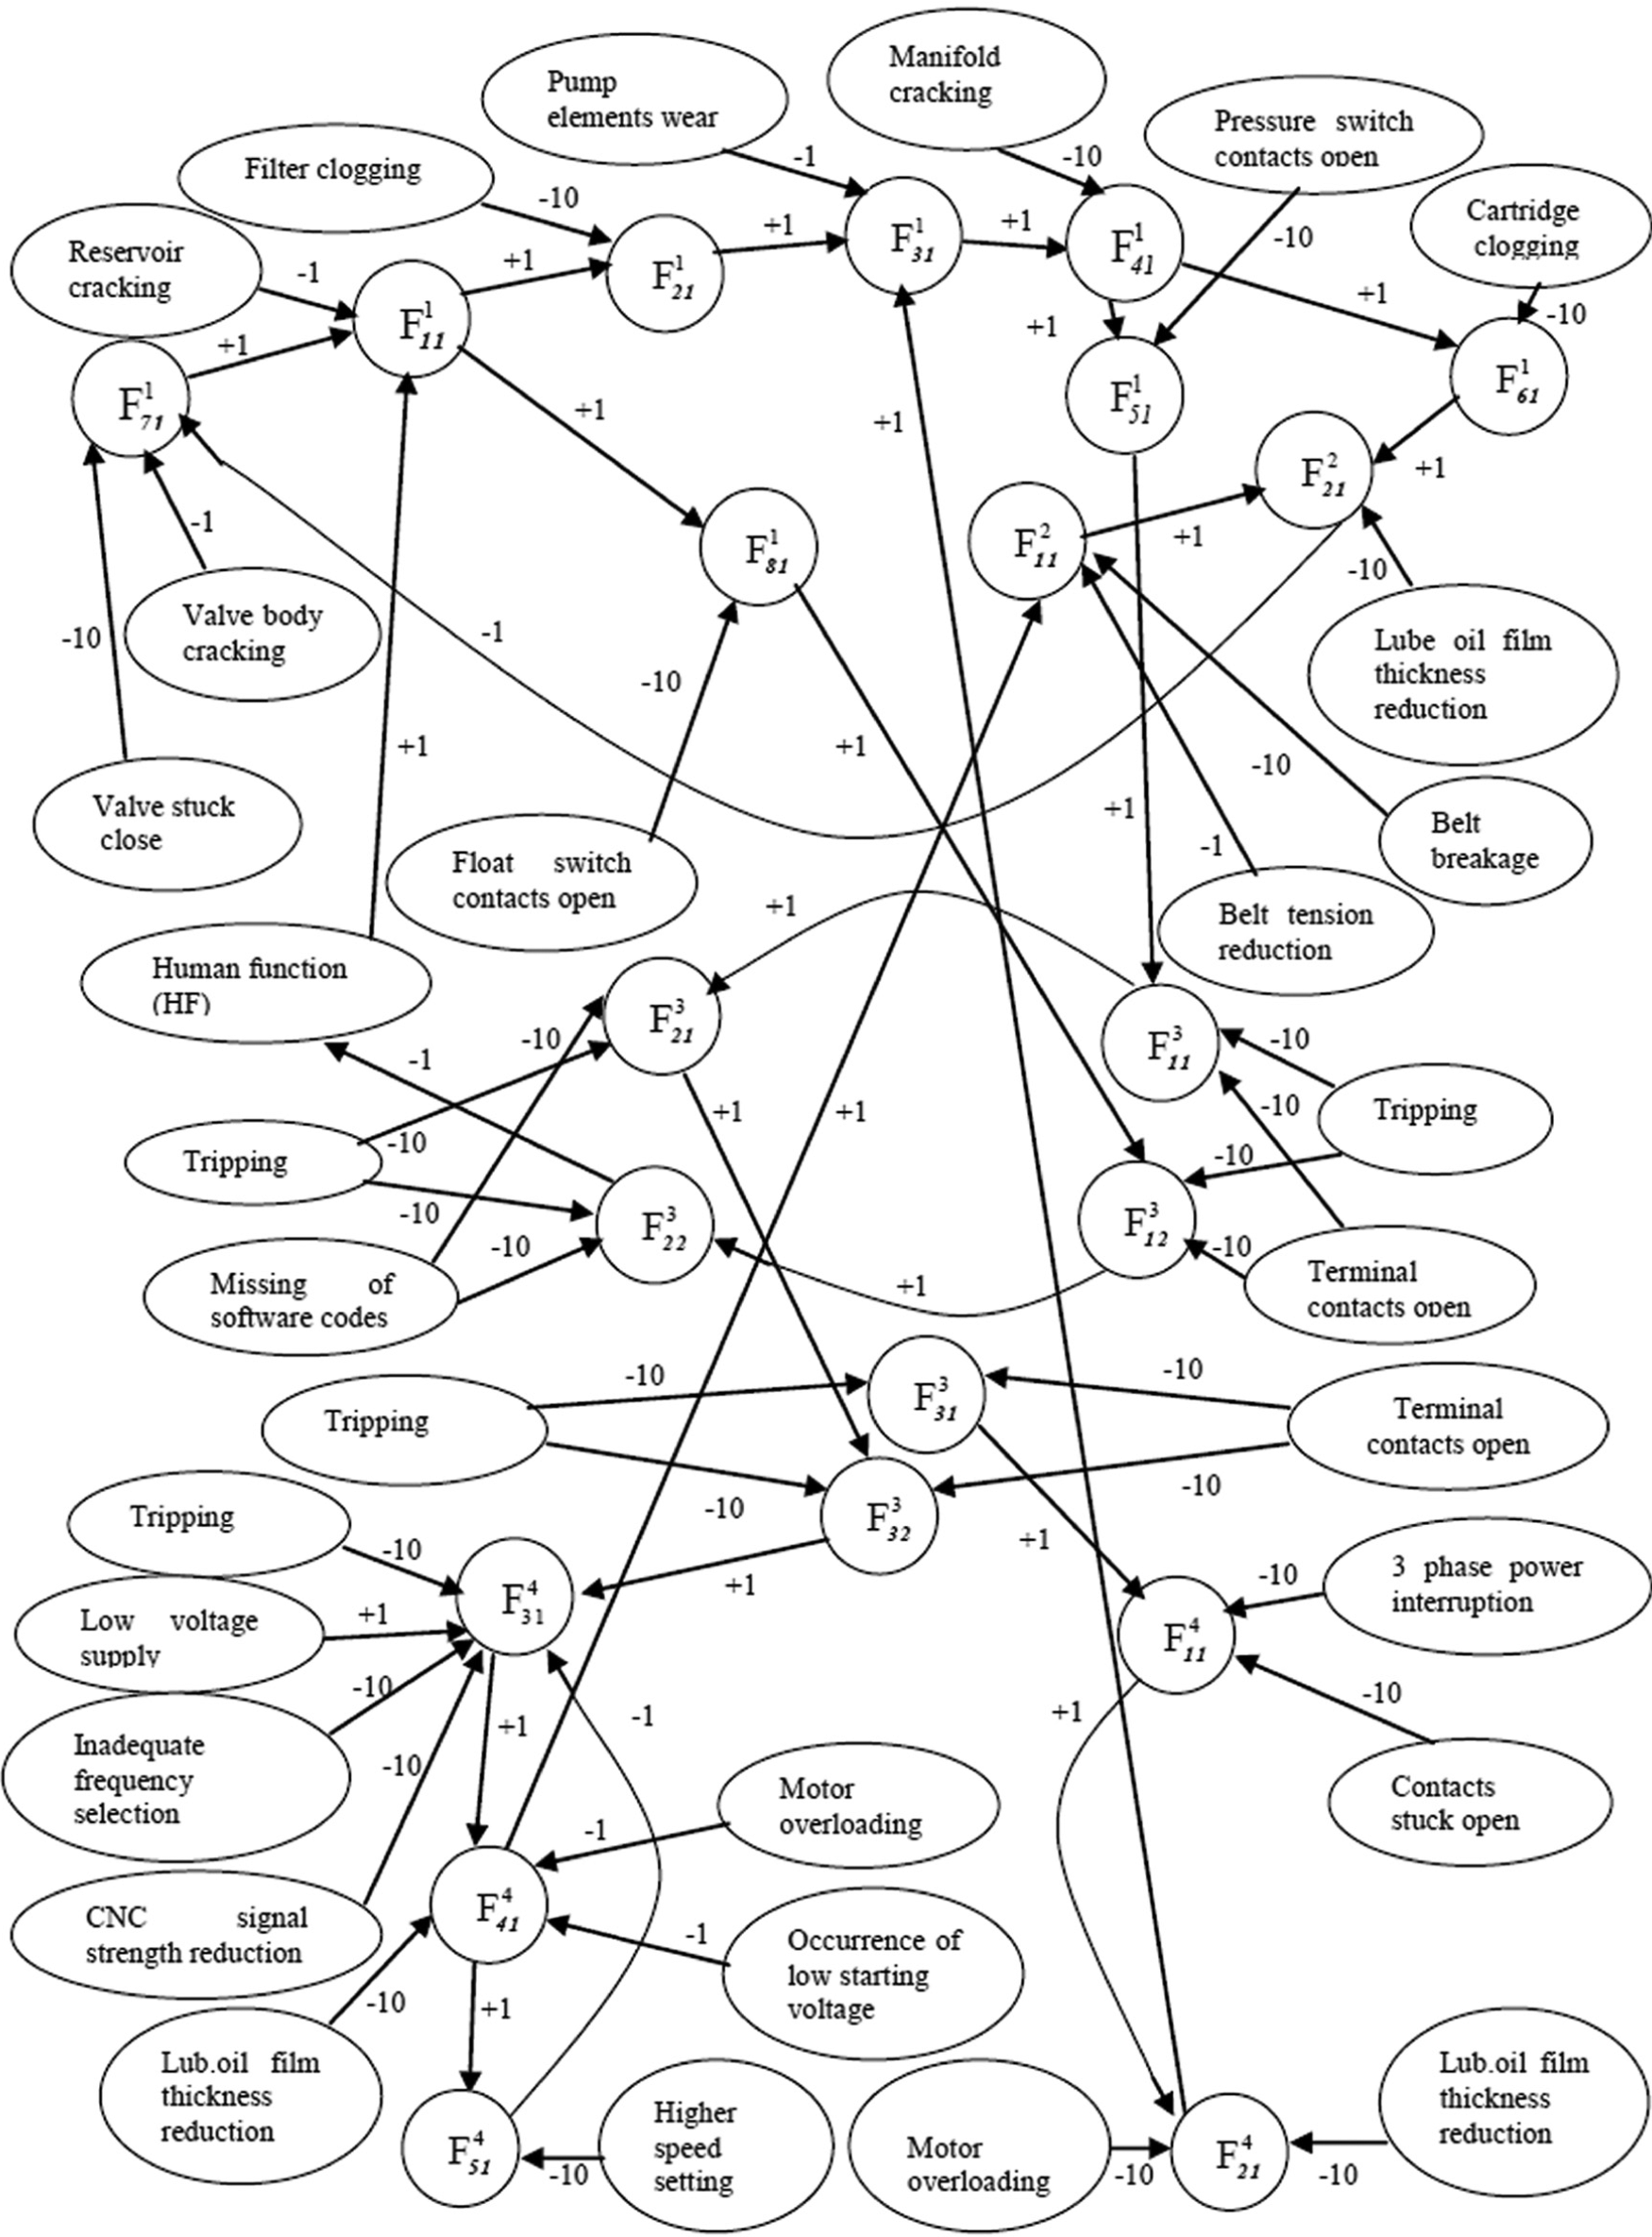
CNC function event digraph (CNCDSFED).
It may be mentioned here that the selected system (Figure 3) contains loops such as feedback and feedforward loops. A feedback loop is formed, when it starts and ends at the same node (e.g. temperature feedback in an air conditioning system). This can be negative feedback or positive feedback depending upon the product of its normal gains.19,20 If the product of normal gains is negative, the loop will be of a negative feedback control, whereas if the product is positive, this will be a positive feedback control loop. In the feedforward loop, one node affects another node with same gain (i.e. positive feedforward) or opposite gain (i.e. negative feedforward) on different paths. The systems with these loops are extensively used for controlling various elements in manufacturing systems such as CNC machines. 21 These are of great importance for reliability consideration of the system as the functional variation of an element, which lies in the control loop, can easily propagate through the loop. This will affect significantly the function of the other elements in the system.
The CNCDSFED maps variation among its all functions and function loss events.
Step 4. Selecting a node; ‘Lack of spindle power (
Step 5. It is evident from Figure 5 that there are two input functional event nodes, which cause top or undesired functional node,
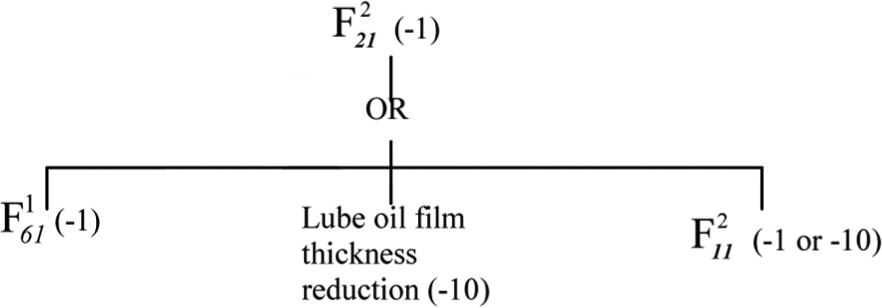
Step 6. It is obvious that the use of an OR gate represents only a partial answer to what the causative events, that is, functional events and function loss events, are. Therefore, appropriate logic operators must be chosen for extending the tree, which is explained as follows. The tree suggests that
The function loss event ‘Lube oil film thickness reduction’ is primal and hence not extended further.
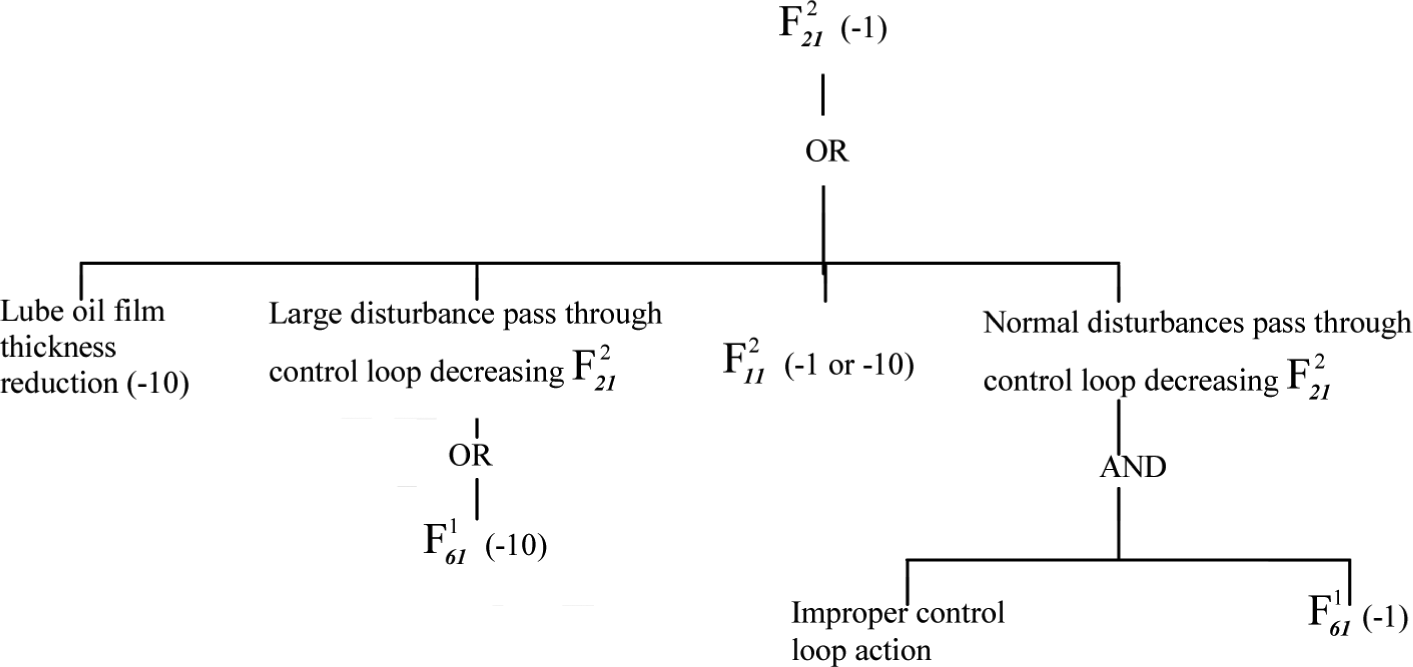
Focusing on
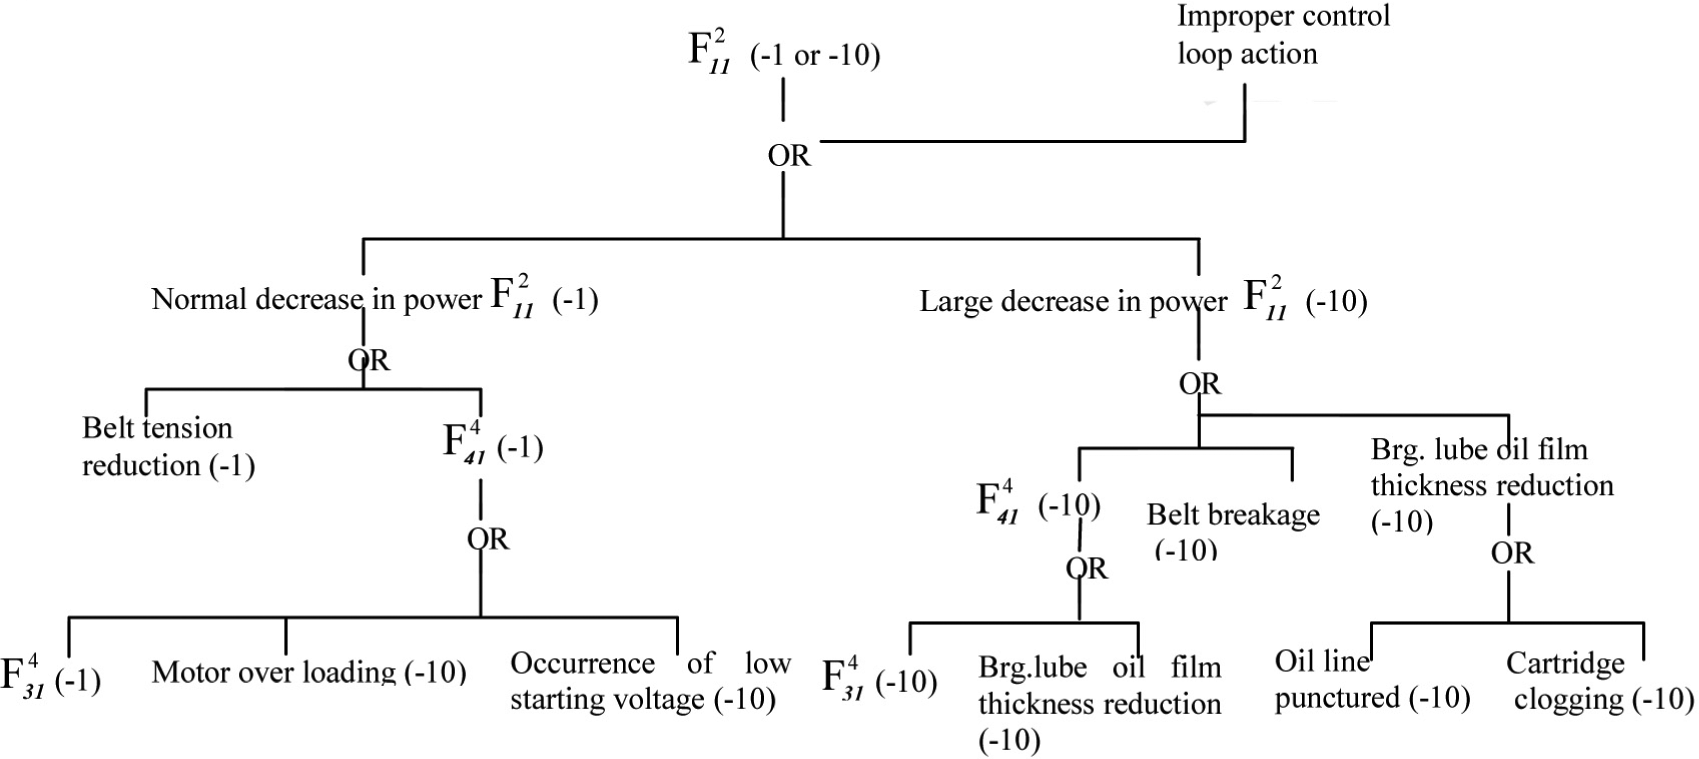
In the above tree, there are two functional events for the function ‘Regulate power with required frequency (
Step 7. This step takes care of events, which do violate consistency. Let us consider the functional event
In the above tree, the other causes for the functional event
Step 8. It is evident from the above developed functional cause analysis tree that there is not any undeveloped functional event/function loss event in the tree, that is, only primal functional event/function loss event remain, and hence, the functional cause analysis tree is complete and is, therefore, stopped. It is mentioned here that the events appearing as primal in the tree are the results of the variation in input and output functions and their interrelations at the lowest level. It is, therefore, desired to identify appropriate input and output functions if one wishes to extend the functional cause analysis tree down to the lowest level.
The developed functional cause analysis tree for the top or undesired functional event ‘Lack of spindle power (
Functional cause analysis tree for the top or undesired functional event
Utility of the approach
The suggested methodology is effective in identifying functional failure root causes of manufacturing systems through structure. The method can conveniently handle the system complexity by identifying each element at its various hierarchical levels and its function, including their relations. As reliability is directly linked with functioning of the manufacturing systems, the proposed method of functional cause analysis tree is, therefore, effective in handling reliability issues, including operational reliability. This will also allow designers to quantify system reliability, as probability of functional and function loss events will be known from plant data. The approach aids not only the design engineers in designing reliable system but also for improving its operational reliability by helping the plant engineers in taking appropriate corrective action against malfunctioning of the system elements.
Moreover, it will help the designers to select the best design among various design alternatives based on system functionality. There are also a few areas where the proposed method can be improved upon. It is observed that several functional failures occur in a system due to human errors. For example, monitoring, setting or adjustment of certain functional parameters such as speed, current, voltage and pressure require human interventions. Therefore, including human function will certainly improve the effectiveness of functional cause analysis of the system.
Conclusion
A methodology of functional cause analysis for complex manufacturing systems through structure has been proposed using a system approach of digraph modelling. By identifying functions and their relations, FEDs are defined for the system at its hierarchical levels. FEDs at its lower level are combined to obtain SFED that is used to develop functional cause analysis tree for a defined top or undesired functional event of the system. The proposed methodology is illustrated for a CNC grinding machine. Application of the suggested methodology to CNC machine demonstrates its unique capabilities in functional cause analysis of a complex manufacturing system. The proposed approach guides designers and practicing engineers in functional cause analysis of manufacturing systems and aids in reliability enhancement and sustenance.
Footnotes
Appendix 1
CNC grinding machine functions and function loss events.
| Assembly | Input functions | Output functions | Function loss event |
|---|---|---|---|
| SPLUB subsystem | |||
| Reservoir ( ) | Allow oil at specified system pressure ( ) | Store oil ( ) | Reservoir cracking |
| Filter ( ) | Store oil ( ) | Condition oil ( ) | Filter clogging |
| Pump ( ) | Condition oil ( ) | Develop flow ( ) | Pump elements wear |
| Produce ME power ( |
|||
| Manifold ( |
Develop flow ( |
Distribute pressurized oil ( |
Manifold cracking |
| Pressure switch ( |
Distribute pressurized oil ( |
Produce pressure signal ( |
Pressure switch contacts open |
| Metering cartridge ( |
Distribute pressurized oil ( |
Control the oil quantity ( |
Cartridge clogging |
| Spring loaded check valve ( |
Transmit power ( |
Allow oil at specified system pressure ( |
Valve stuck close |
| Valve body cracking | |||
| Float switch ( |
Store oil ( |
Produce oil level signal ( |
Float switch contacts open |
| ME subsystem | |||
| Belt ( |
Produce ME power ( |
Transmit power ( |
Belt tension reduction |
| Belt breakage | |||
| Hydrostatic spindle assembly ( |
Transmit power ( |
Transmit power ( |
Bearing lube oil film thickness reduction |
| Control the oil quantity ( |
|||
| CNCC subsystem | |||
| PLC input relay board ( |
Produce pressure signal ( |
Transfer pressure signal ( |
Tripping |
| Produce oil level signal ( |
Transfer oil level signal ( |
Terminal contact opens | |
| CPU ( |
Transfer pressure signal ( |
Process pressure signals ( |
Tripping |
| Transfer oil level signal ( |
Process oil level signals ( |
Missing of software codes | |
| PLC output relay board ( |
Process pressure signals ( |
Transfer output signal to contactor ( |
Tripping |
| Process oil level signals ( |
– | ||
| – | Transfer output signal to VFD ( |
||
| PS subsystem | |||
| Contactor ( |
Transfer output signal to contactor ( |
Actuate electricity flow ( |
Contacts stuck open |
| Low-volt three-phase PS/interruption | |||
| Lube oil motor ( |
Actuate electricity flow ( |
Produce ME power ( |
Bearing lube oil film thickness reduction |
| Motor overloading | |||
| VFD ( |
Produce speed signal ( |
Regulate power with required frequency ( |
Tripping |
| Low-voltage supply | |||
| Transfer output signal to VFD ( |
Inadequate frequency selection | ||
| Three-phase PS | CNCC signal strength reduction | ||
| Spindle motor ( |
Regulate power with required frequency ( |
Produce ME power ( |
Bearing lube oil film thickness reduction |
| Motor overloading | |||
| Occurrence of low starting voltage | |||
| Tachogenerator ( |
Produce ME power ( |
Produce speed signal ( |
Higher speed setting |
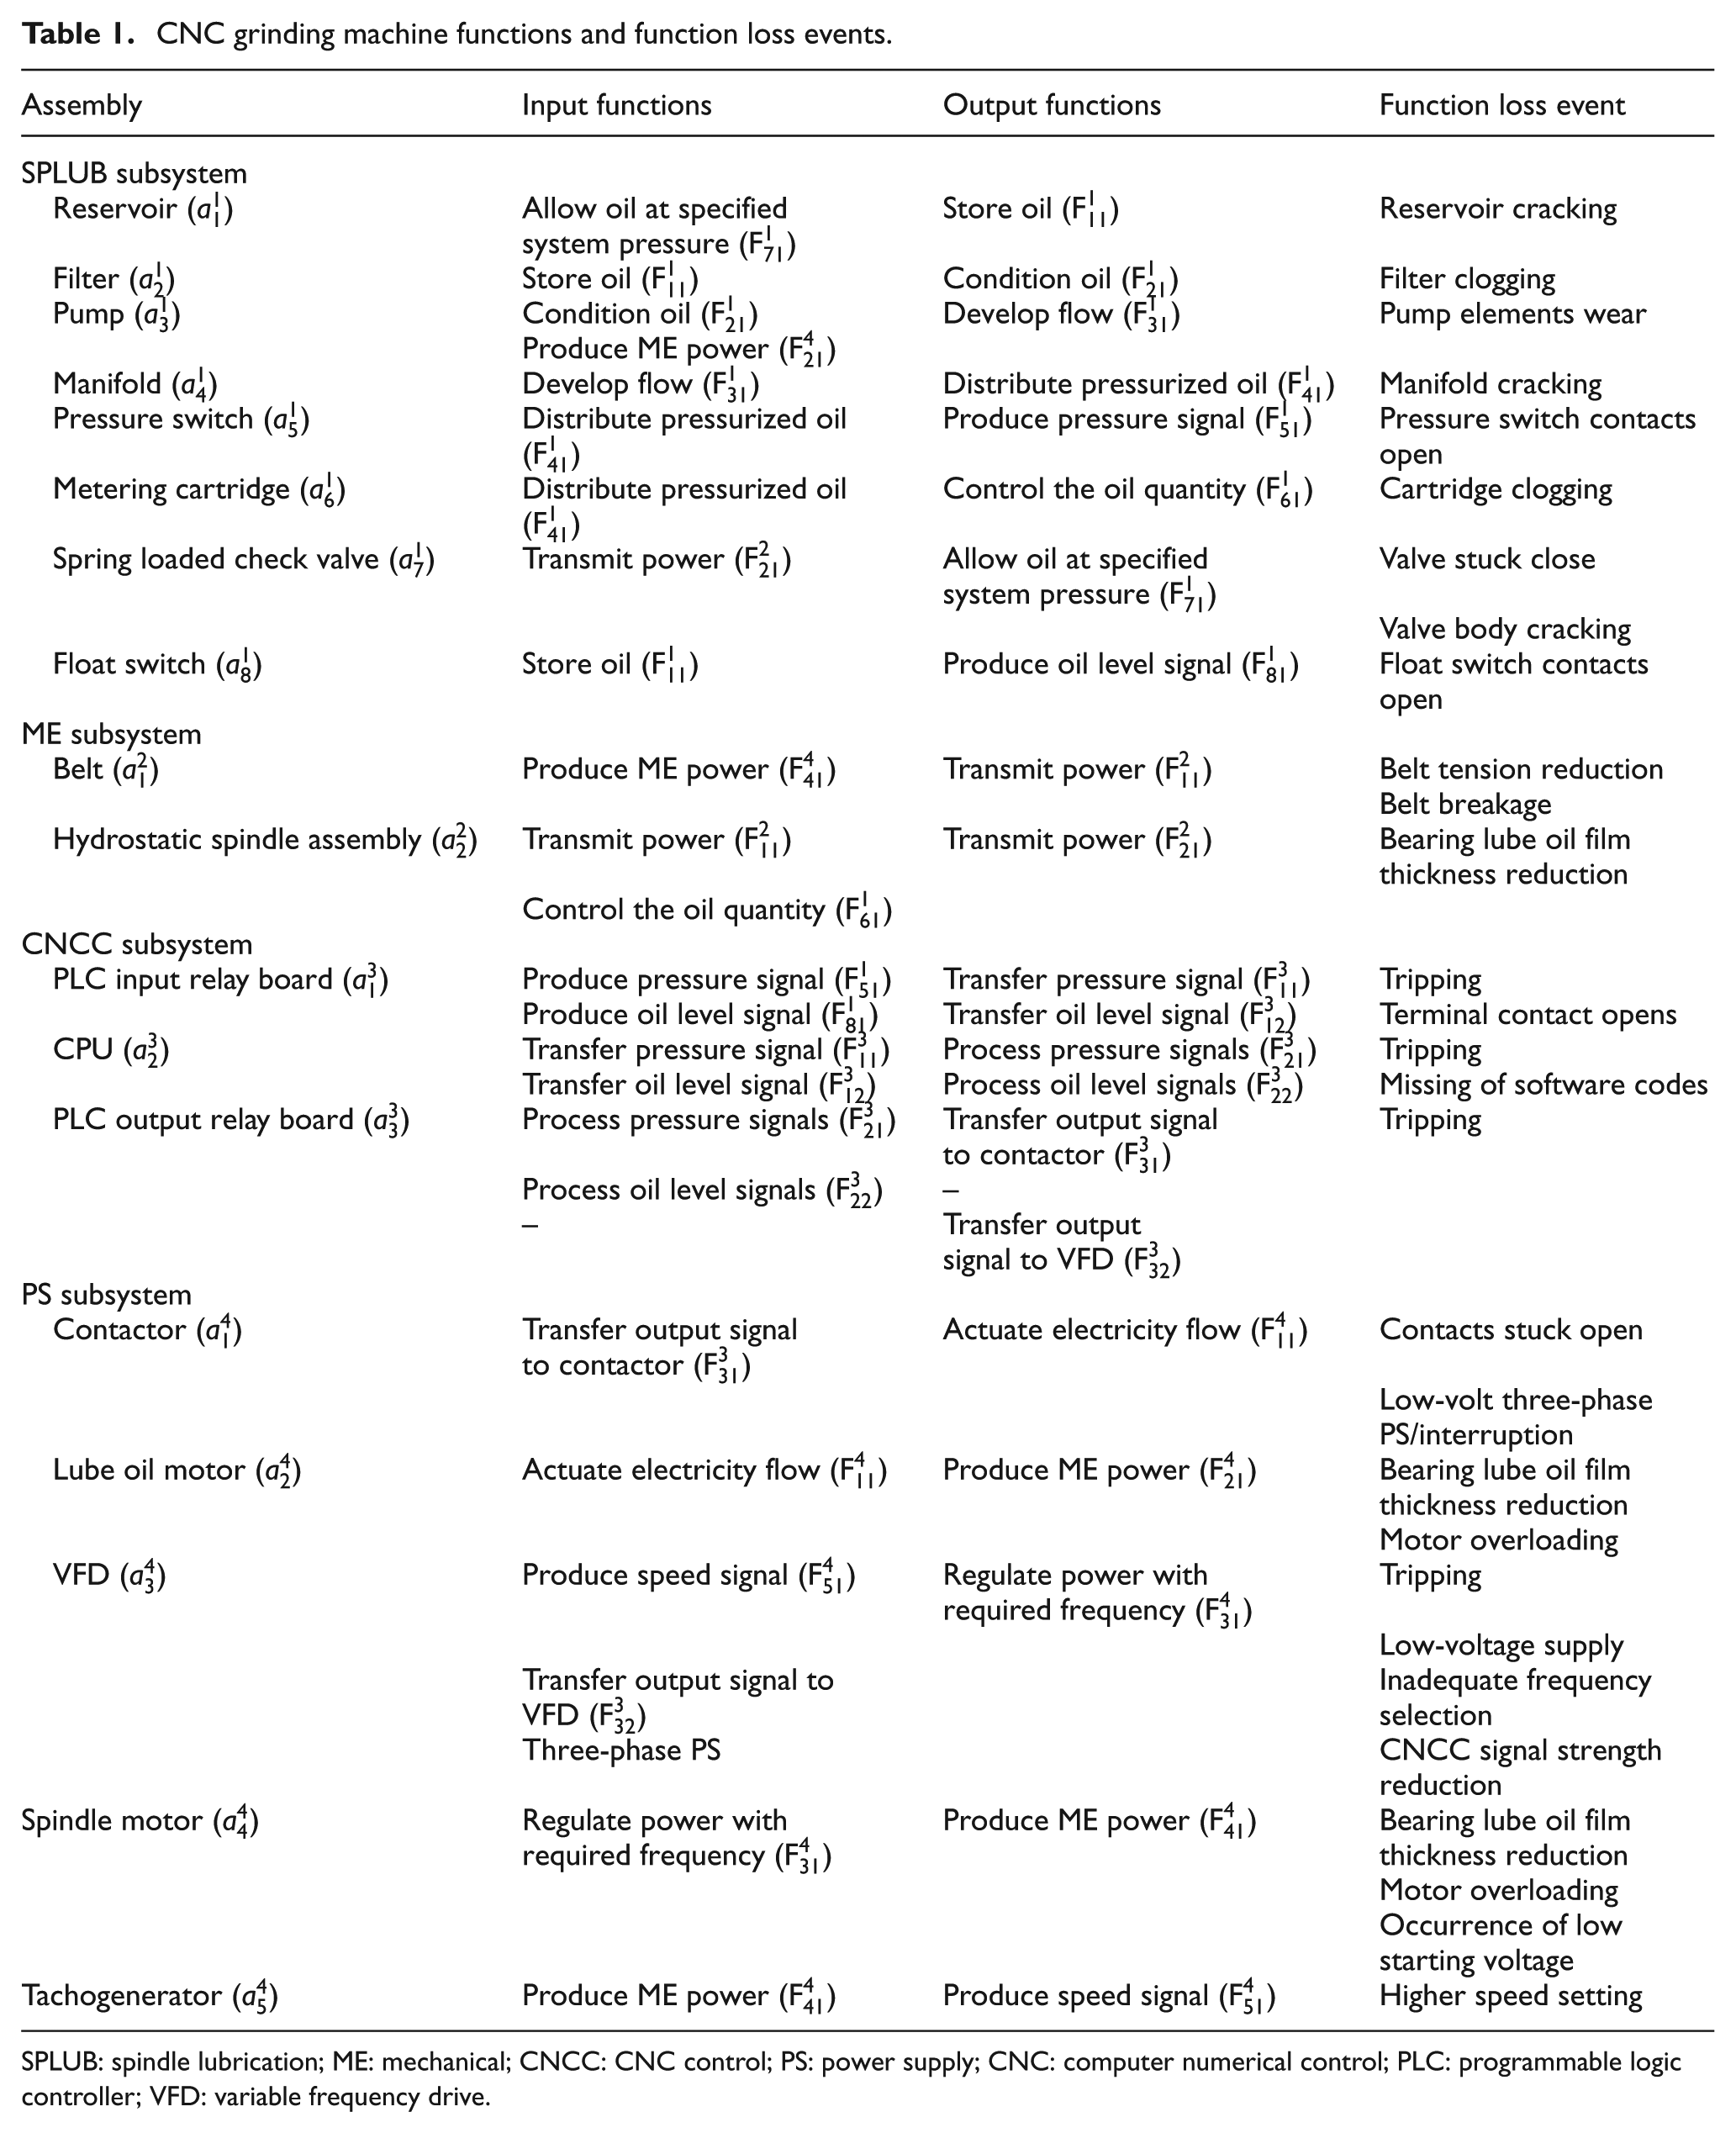
SPLUB: spindle lubrication; ME: mechanical; CNCC: CNC control; PS: power supply; CNC: computer numerical control; PLC: programmable logic controller; VFD: variable frequency drive.
Declaration of conflicting interests
The authors declared no potential conflicts of interests with respect to the authorship and/or publication of this article.
Funding
This research received no specific grant from any funding agency in the public, commercial or not-for-profit sectors.