
Abstract
There are no standard constructs or pillars of SCM excellence in literature, based on review of 57 SCM framework articles identified from 21 peer reviewed journals, which revealed that none of the constructs exhibited frequent repetition. This meant that none of the construct can be considered as a standard pillar of SCM. Thus in order to establish pillars of SCM excellence, an empirical investigation is carried out in the Indian manufacturing industry. A survey questionnaire was used to collect responses from the Indian manufacturing industry. The observed variables were subjected to principal component analysis (PCA) to find out underlying pillars of SCM excellence. The SCM excellence framework was found to be consisting of nine pillars. The framework of SCM excellence was then subjected to evaluation of reliability of pillars, followed by examining their construct, convergent and discriminant validity. The nine pillars of SCM excellence obtained after PCA, exhibited 204 constructs. Later when the reliability of each pillar was maximized, the number of constructs reduced to 133. The final cronbach's alpha values for these nine pillars ranged from 0.71 to 0.94, which is considered to be a good indicator of reliability of the scale. The examination of convergent and discriminant validity established the SCM excellence framework in Indian manufacturing industry. The study presented in the paper is unique, since such an attempt to derive pillars of SCM excellence, and empirical investigation of SCM excellence framework in Indian manufacturing industry has never been attempted in extant literature.
Keywords
Introduction
The modern business landscape is an ever-changing battleground for free-market economies. Post-strategic positioning global supply chains strive for best in class. 1 Thus, a lasting requirement may be that the search for best industrial practices is a continuing process. 2 Best industrial practices are synonymous to excellence practices. The concept of excellence in relation to management and organizational performance was introduced 25 years ago by Peters and Waterman when they published their best seller book “In Search of Excellence—Lessons from America’s Best-run Companies.” 3 The purpose of industrial excellence is to identify what it is that an industrial firm needs to do well, in order to perform at an excellent level in a sustainable manner. 4 Bilalis et al. 2 also proposed industrial excellence model (EM) that had four main business processes as the fundamental pillars. The pillars were supply chain, product development, process development and operations strategy formulation and deployment. There have been several attempts to prescribe excellence practices for each of these pillars. In particular, Stewart 5 identified four areas as the key to unlocking supply chain excellence: delivery performance, flexibility and responsiveness, logistics cost and asset management. Later, Kanji and Wong 6 proposed a new supply chain management (SCM) model so that organizations can make use of it to achieve business excellence. These authors also highlighted the inadequacies of existing SCM models indicating that they lack focus on creation of cooperative and quality culture, the way to develop a close relationship, managing processes other than logistical processes, leadership’s role in the supply chain relationship, quality and cost requirements of customers and initiatives to improve continuously. Wong 7 established the content validity of the same SCM EM in Hong Kong. However, the constructs of these supply chain excellence frameworks are based only on author’s perception and not derived from existing literature. It can be argued over here that with the burgeoning literature in SCM, it is absolutely essential to have some standard constructs to be called as pillars of SCM excellence. The same issue has been brought up by Stank et al.; 8 it was highlighted that although volume of material on SCM is rising, the proposed solutions in the literature have not been subjected to scholarly scrutiny that would determine their validity. The authors emphasized on conducting an academic research so that supply chain professionals can fully understand the elements of SCM. It clearly indicates that the size of literature on SCM is growing but still there is lack of meaningful academic research on SCM. By meaningful research, it means that the elements required for understanding and bringing about radical changes in SCM practice are lacking. The discipline requires standardization of pillars of SCM excellence which will benefit researchers and practitioners in several ways. First, the terminology or jargon used by researchers and practitioners in SCM varies widely depending on applications, domain, industry and so on. Hence, when an individual refers such literature or a company document, certain SCM issue or practice altogether may give totally different conception. Thus, if a standard terminology is used, then probably such misconceptions may be averted. Second, every consultant or SCM practitioner conceives SCM from different point of views and thus may suggest his or her own set of SCM excellence practices. Now, if an SCM personnel changes or moves to another organization, a new set of practices may creep in and may distort the ongoing program. Thus, one needs some standard set of practices which can be considered to be the basic components for achieving SCM excellence. Although the need and issue to be addressed varies from situation to situation, still some basic practices leading to SCM excellence are ineludible. Third, Chen and Paulraj 9 stated regarding SCM literature that the existence of clear definitional constructs and conceptual frameworks on which to base our research has been lacking, leaving a fragmented field open to the danger of a lack of generalization. Later, Cousins et al. 10 added that wide and diverse body of knowledge in SCM encourages a rich and lively debate, but it may also lead to a fragmented literature, with overlapping constructs and a failure to produce consistent findings. A similar concern is shown by Sila and Ebrahimpour 11 in area of total quality management (TQM), by emphasizing the absence of a universally accepted framework for implementation of TQM. They emphasized on more research devising universally applicable elements of TQM. They also expressed that despite similarities between factors or elements found in different studies, the list of critical elements varies from study to study. As pointed out by Ponis et al., 12 the increasing importance of business processes inevitably puts process models in the epicenter of the majority of the efforts for achieving the required interoperability and agility in dynamic supply chains. As a consequence, it is necessary to design new or adjusted business process models rapidly and at low cost. This can be achieved by reusing knowledge captured in reference process models.
Soni and Kodali, 13 after reviewing a set of 57 frameworks, concluded that only 28.67% of elements (or constructs) were repeated more than two times and barely 3% of elements (or constructs) were repeated more than five times. They also noted that there is difference in the point of view of researchers toward the elements comprising SCM, by stating the elements in SCM literature to be incoherent and present in large variety.
Thus, this problem area needs attention of the researchers so that a unified theory of SCM can emerge and give a platform for developing coherent frameworks. 13 This purpose can be achieved by business EMs. EMs are expected to provide a direction to obtain sustainable profits, people and planet development. They need to bring business organizations closer to their truly final objective of long-run satisfaction of the needs and desires of all stakeholders and the global community. With the short-term focus, a company may achieve individual well-being, but to attain sustainable success, a company has to focus on universal well-being. 14 In a recent work by Soni and Kodali, 13 a conceptual framework of SCM excellence has been proposed which is basically aimed at overcoming aforementioned deficiency in SCM literature. However, this proposed framework is totally based on frequency analysis performed on existing literature only and lacks empirical evidence of industry. The proposed pillars of SCM excellence are based on author’s conception only and hold no statistical support. Hence, this study focuses on finding the empirical evidence for these pillars of SCM excellence 13 in Indian manufacturing industry. In the manufacturing sector, a greater proportion of manufacturing cost is associated with the products and materials supplied from the supplier network, which instigates this research to focus on SCM excellence practices in this sector alone. 15 Thus, keeping these deficiencies into perspective, this article makes an attempt to use SCM constructs from literature extracted by Soni and Kodali 13 to statistically establish the underlying pillars of excellence by checking their reliability and validity. The goal of evaluating reliability and validity of SCM excellence framework in Indian manufacturing industry will be achieved by fulfilling the following objectives:
Identification of SCM constructs from various SCM frameworks;
Construction and administration of a survey instrument;
Principal component analysis (PCA) of constructs to find out underlying main constructs or pillars of excellence;
Evaluating the reliability of established principal components or pillars of SCM excellence framework;
Evaluating the validity of established principal components or pillars of SCM excellence framework.
This article is organized as follows: a literature review, followed by discussion on research methodology for empirical investigation of SCM excellence framework in Indian manufacturing industry. Later, data analysis and results of survey responses are presented. Discussion and implications on results are given in the last section.
Literature review
In business, conventional management practices are not enough to ensure the long-term success. 14 A business organization needs to constantly upgrade its business practices to strive for excellence. Literature on business excellence can be found in the areas of TQM, manufacturing excellence, sustainability, organizational behavior, innovation, health care and so on. According to Gilgeous and Gilgeous, 16 companies having practices of manufacturing excellence have the processes of excellence in common within all industries. In this seminal work, the authors proposed a manufacturing excellence framework with an aim to provide the means by which manufacturing managers could identify what operations they should be emphasizing and competing, so as to achieve high performance in business strategy from the customer’s point of view. Literature also supports that these processes of excellence are generic across all industries. This generic nature of framework gives it a standard and wide acceptability. Now, as far as field of SCM is concerned, the pillars of SCM excellence proposed by Stewart, 5 Kanji and Wong 6 and Wong 7 are dominantly prescriptive in nature and do not hold much empirical relevance. Literature on SCM is almost 30 years old, and because of high variation in opinions of various authors on important or critical elements of SCM, a framework proposed by Randall and Farris 17 is desirable.
Recently published work of Slone et al., 18 “The New Supply Chain Agenda,” proposed five pillars of effective supply chain strategy as talent, technology, internal collaboration, external collaboration and managing supply chain change. These pillars are dominantly strategic in nature and have lesser operational characteristics. For example, pillars like talent are human resource management initiatives, but when it is the context is of supply chain excellence, it is assumed that a good human resource component is by default top-notch. Thus, in order to generalize, one can say that for supply chain excellence, resources to be considered should be the best in class. What is required is a set of practices that raise a resourceful supply chain to an excellent supply chain. This argument again emphasizes requirement of an SCM excellence framework which is based on already proposed critical set of activities proposed by authors in extant literature.
In an attempt to develop an organizational framework, Ringrose 19 built upon already existing leading frameworks to develop a consolidated and enhanced version of the organizational framework. The objective of carrying such exercise was to cover critical elements of organizational excellence over a period of 1980s–1990s. This kind of endeavor incorporates dynamism of market and growth of discipline in the existing practices so as to lead evolution of discipline. In the current decade, SCM discipline is definitely at a stage which requires evolution by giving more attention to state-of-art techniques and less to those practices that have become inherent in the SCM discipline. This gives additional impetus to the requirement for developing empirically established framework of SCM excellence.
Talwar 20 performed a comparative study of 20 EMs of National Quality Awards (NQA) to identify their common features and contradictions and to propose suggestions for development and review of EMs/NQA. It was highlighted in this study that contemporary EM/NQA lacks universally acceptable model. The major issue raised was that the high degree of variance between different models exhibits that the particular discipline is still passing through as evolutionary process. A similar observation for SCM domain is made by Soni and Kodali 13 while reviewing 57 SCM frameworks. While reviewing these frameworks, a high degree of incoherency was found regarding use of elements constituting SCM frameworks. In this review, a major deficiency in standardization of elements (or constructs) used for making SCM frameworks became evident by frequency analysis, with only 28.67% of elements (or constructs) were repeated more than two times and barely 3% of elements (or constructs) were repeated more than five times. Using expert opinions and domain knowledge, the authors proposed an SCM excellence framework with nine pillars. These proposed pillars of SCM excellence were collaboration management, demand management, information technology (IT), integration, logistics management, manufacturing management, marketing management, strategic management and supplier management. The authors listed 85 constructs under these pillars. These constructs were based solely on repetition of more than two times in the selected literature. Thus, this proposed framework of SCM excellence has no empirical evidence and is dominantly based on expert judgment. Hence, a study dedicated to empirically establish framework of SCM excellence is need of the hour. Same shortcoming is highlighted by the authors of this article as well, stating that further research can be carried out by using exploratory techniques such as PCA on the data set presented and also toward evaluating the reliability and validity of proposed conceptual framework of SCM. Hence, the objective of research in this article is to carry out empirical investigation of SCM excellence framework in Indian manufacturing industry.
Research methodology for empirical investigation of SCM excellence framework
From the discussion carried out in the “Literature review” section, framework of SCM excellence proposed by Soni and Kodali 13 is subjected to empirical investigation in this article. The sample of frameworks used for building SCM excellence framework is taken from Soni and Kodali. 13 The sample contains 57 frameworks and 301 constructs extracted from these frameworks (reader may refer Soni and Kodali 13 for selection of articles on SCM frameworks). At this point, it is important to clarify a terminology that is used interchangeably regarding elements, constructs and pillars. Typically, a “construct” is defined as “An idea or theory containing various conceptual elements, typically one considered to be subjective and not based on empirical evidence” (Merriam-Webster dictionary). The conceptual elements are often termed as subelements as well. Thus, elements or constructs mean the same thing. However, if “pillar” is used in the literature, it refers to the top most or a generic element and it brings down construct to the second level. At second level, the construct is less generic as compared to a pillar. In this case, pillar is considered to be at higher level than construct. Furthermore, several constructs together define a pillar. In subsequent part of this article, pillars will be considered at higher level than constructs. Table 1 represents a sample of list of constructs.
Sample of list of constructs.
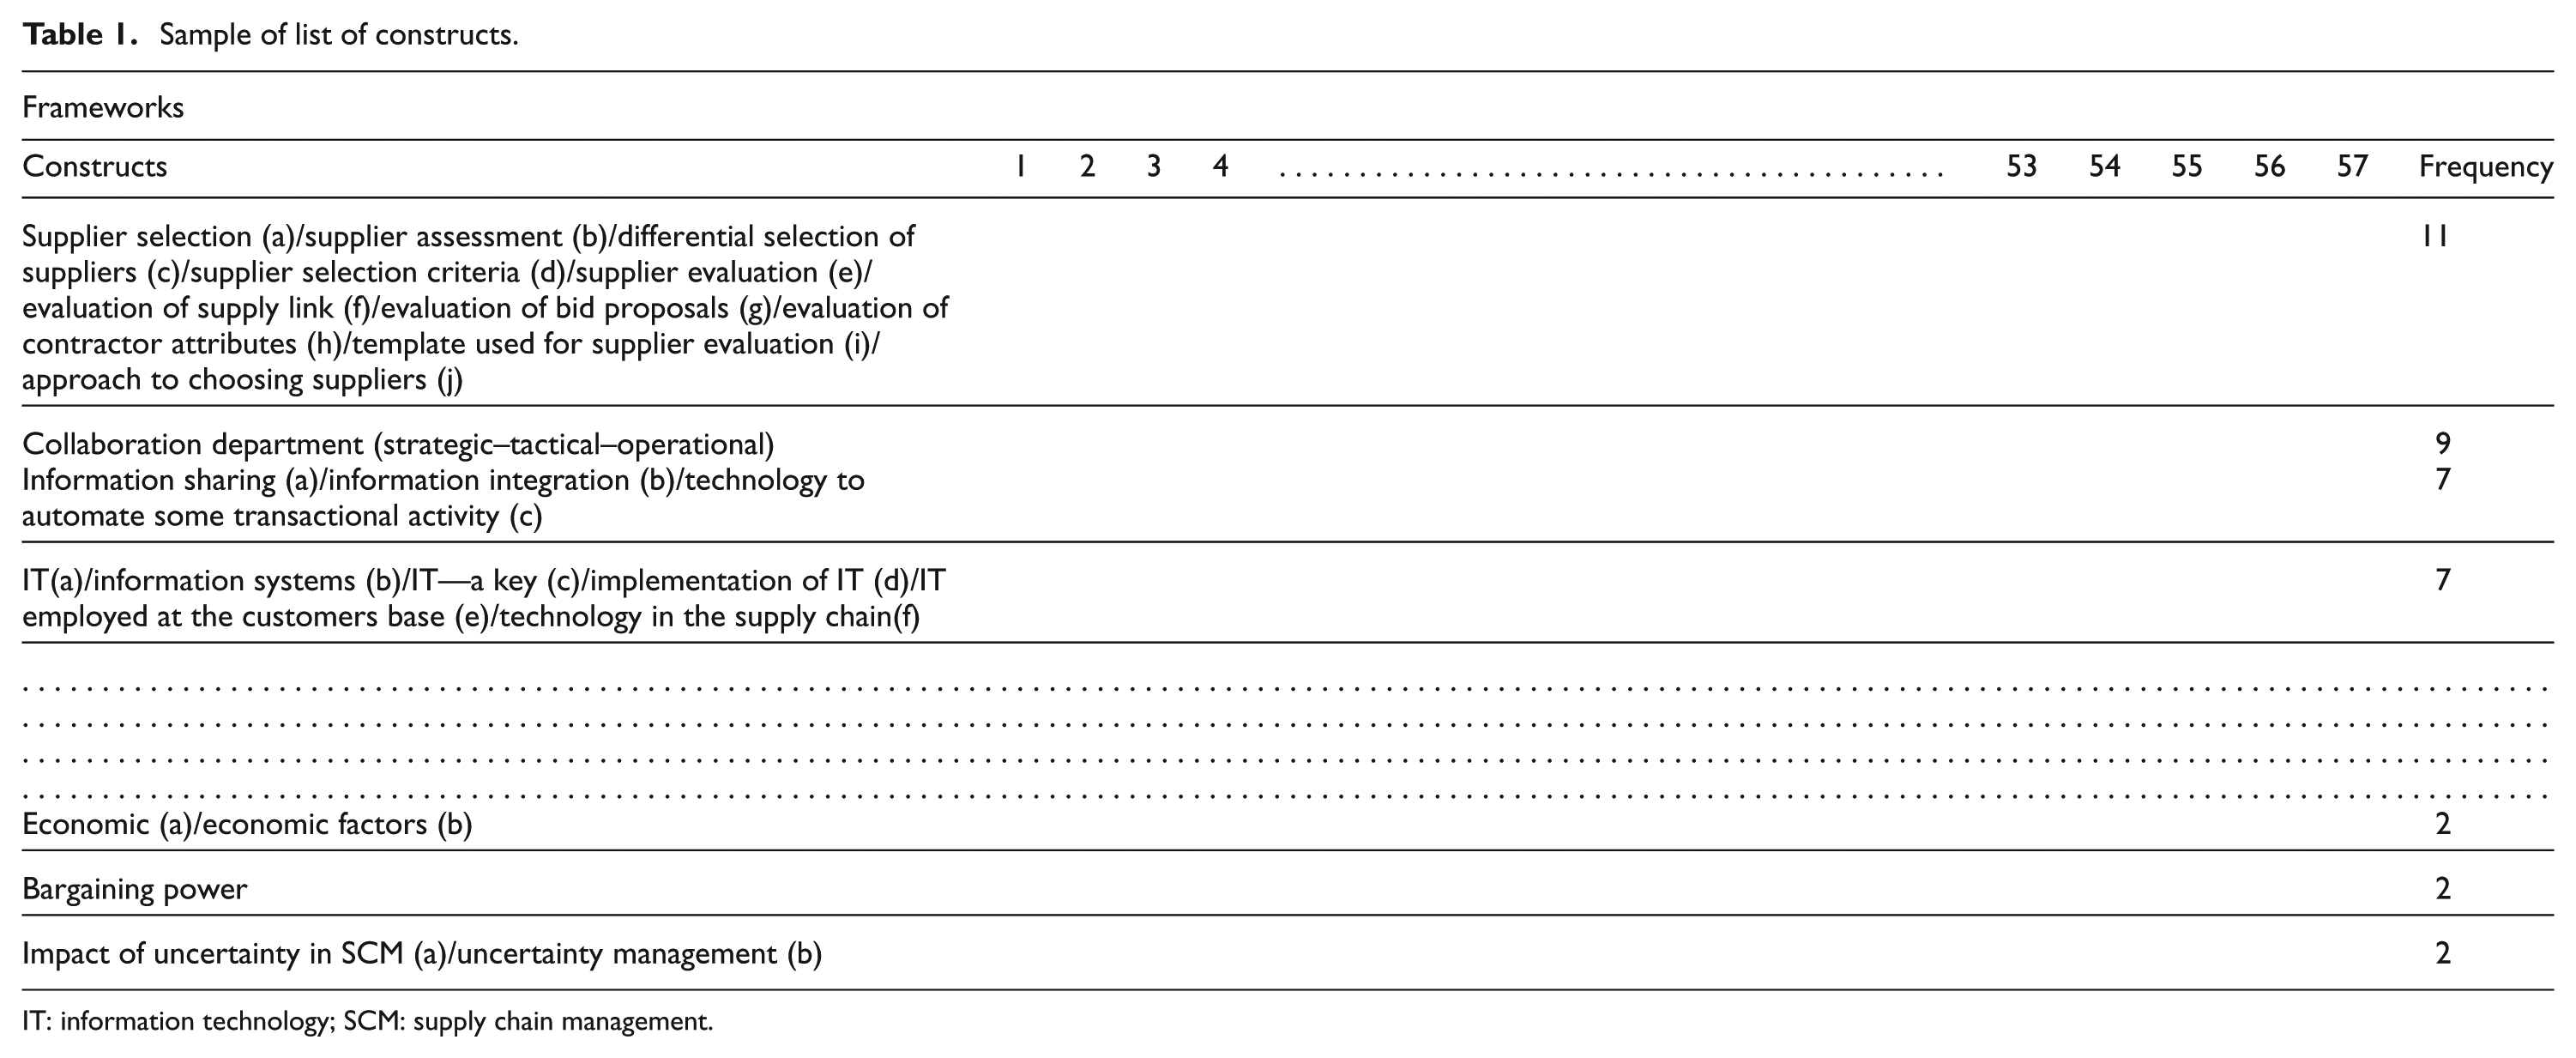
IT: information technology; SCM: supply chain management.
In Table 1, 301 constructs are identified (only few constructs are shown to demonstrate the construction of table; however, in order to get the complete table, readers may contact authors). Based on frequency analysis, Soni and Kodali 13 listed only 85 constructs in SCM excellence framework. But in order to empirically establish the pillars and the respective constructs, one needs to consider all the constructs, irrespective of its repetition. For example, a construct like “Collaborative performance system” although appears only once in the literature, its importance in the present context cannot be underestimated and cannot be ruled out from being included in SCM excellence framework. After carrying out empirical investigation, this particular construct may turn out to be a construct of certain pillar, while it is not necessary that a construct appearing several times in the literature will be a construct of empirically established pillar. In order to preserve the meaning of each element, the phrase or word was taken as it is from the text and used in Table 1. Only those constructs were clubbed together which either used the same word(s) or had the same meaning. For example, supplier selection/differential selection of suppliers/supplier selection criteria/supplier evaluation/evaluation of supply link/evaluation of bid proposals/evaluation of contractor attributes/template used for supplier evaluation/approach to choosing suppliers imply same meaning of “supplier selection process,” and thus, we get plethora of constructs. It does not imply that all these 301 constructs are independent of each other. The majority of constructs can be found to be belonging to a particular domain, and if a suitable PCA is carried out, all the constructs can be observed to be falling under few independent constructs. 13
Performing survey
The systematic approach of empirical research proposed by Flynn et al. 21 was followed to conduct the empirical study/investigation. Accordingly, this article is focused on an empirical investigation of SCM excellence framework in Indian manufacturing industry. A schematic representation of empirical study of SCM excellence framework in Indian manufacturing industry is given in Figure 1.
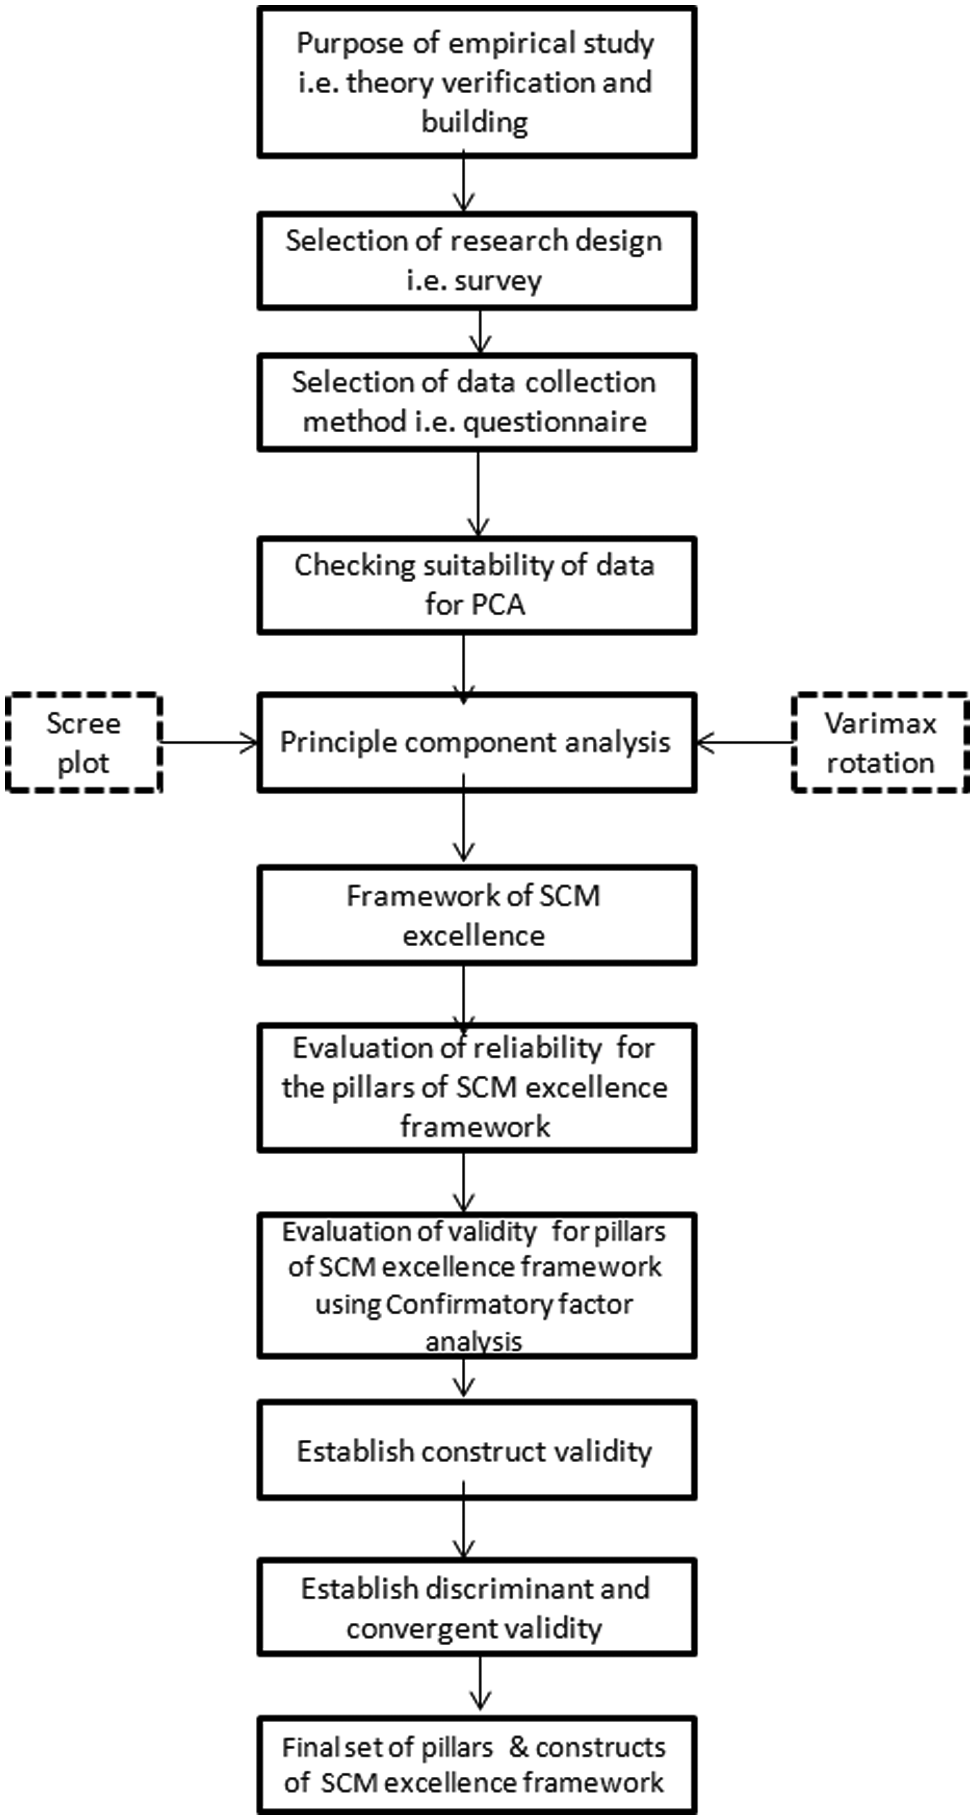
A schematic representation of empirical study of SCM excellence framework in Indian manufacturing industry.
Sample industry
The target population for collecting the data was manufacturing industries. A cross-sectional study using survey research is performed on selected sectors of manufacturing industry. The database of Confederation of Indian Industries (CII) was used for sampling. Only those companies were selected for survey which gave emphasis on SCM. A prior investigation was done by visiting websites of relevant manufacturing companies and giving a phone call to find out whether a particular company adopts SCM practices and its management gives importance to achieving excellence in SCM. A database of 1049 companies is extracted from the list of CII.
Design of questionnaire and data collection
Survey using questionnaire was used as the data collection method. One part of that questionnaire was meant for evaluation of reliability and validity of SCM constructs to achieve SCM excellence in Indian manufacturing industry. While making the questionnaire, it was ensured that all the questions pertain to manufacturing industry only and not addressing any other domain like service industry. A thorough examination of questionnaire items revealed that deletion of constructs was not required, as constructs of those frameworks which addressed non-manufacturing industry used generic constructs. These generic constructs were equally applicable to manufacturing industry as well. Now, in order to check the content validity of the questionnaire items, it was sent to four practitioners in industry, one consultant and two academicians. The feedback given by them was incorporated in the questionnaire and the final version of the questionnaire was sent to relevant respondents in 1049 companies.
The questionnaire was posted online in such a way that the respondent can answer to the questionnaire in breaks and responses on already answered questions will be stored. The link of the questionnaire webpage along with respective password was again sent to 753 companies via e-mail (removing 296 invalid e-mail IDs). The response rate was 24.6% (with 185 responses). An excerpt of the questionnaire is given in Appendix 1.
According to Saxena and Sahay (2000), 22 a response rate of 9% is considered to be adequate in Indian conditions. 22 Although this response rate may seem to be lower but considering the fact that the respondents were mainly supply chain managers, logistic managers and purchasing managers work under time constraint environment and the questionnaire takes 15–20 min on an average, perhaps in that respect, this response rate may be considered good and adequate response rate. Several studies by Ngai and Cheng, 23 Juttner et al., 24 Matopoulos et al. 25 and Gunasekaran and Ngai 26 also considered respondents at similar level of management and reported similar response rates.
Data analysis and results
First, the data collected with the help of questionnaire are checked for its suitability in PCA. In order to find out the main pillars of SCM excellence in Indian industry, PCA is carried out on the items of administered questionnaire. Since the pillars are not known prior, PCA method is used to find out underlying latent factors (or variables). The specific goals of PCA are to summarize patterns of correlations among observed variables, to reduce a large number of observed variables to a smaller number of factors, to provide an operational definition (a regression equation) for an underlying process by using observed variables or to test a theory about the nature of underlying processes. 27
Once underlying latent factors (or variables) are established, then a framework of SCM framework is proposed. Later, the reliability of the scales is checked for internal consistency. In this process, authors make an attempt to maximize the reliability of the scales by removing some of the observed variables.
Now if the interpretability of the pillars of SCM excellence is found to be adequate, the next step is to verify the factor structure by establishing the construct validity of the factors. The researcher seeks to demonstrate that scores on the latent variables (factors) covary with scores on other variables or that score on latent variables changes with experimental conditions as predicted by theory. 27 Finally, the discriminant and convergent validity is established for the factor structure for which construct validity is found to be appropriate.
This brief discussion on data analysis has given an outline of the work that will be carried out henceforth. Detailed description of each data analysis technique is given in subsequent subsections.
PCA
The very first step to be considered before starting PCA is to check the suitability of data for analysis. In this case, it very important to find out whether sample size of 185 is suitable for carrying out factor analysis with PCA method. There are many views regarding the suitability of sample size. Hutcheson and Sofroniou 28 recommended at least 150–300 cases. While according to Comrey and Lee, 29 a sample of 200 is considered fair. By reviewing several studies, Costello and Osborne 30 reported that 14.7% of the studies they reviewed had subject-to-variable (STV) ratio < 2:1. In our case, it is 0.6:1, thus cannot be said to be exceptionally small sample size. Thus, on the basis of these arguments presented in the favor of the present sample size of 185, PCA was performed in SPSS 17.0 using varimax rotation that generated 17 components on the basis of eigenvalues (>1, Kaiser’s criteria) (given in Table 6) and 9 factors on the basis of scree plot (given in Figure 3). According to Hair et al., 31 Kaiser’s criterion is considered to be good for the number of variables between 20 and 50, but in this study, the case number of variables is 301. Scree plot is chosen to extract number of components. It can be seen from Figure 2 that only nine distinct components up to “elbow” can be obtained and from Table 2 nine components explain 91.166% of variance. Thus, it will not be very conservative to consider nine factors only. The mean value of communalities was 0.959, which is considered to be a good indicator of the adequacy of the sample. If communalities are high, recovery of population factors in sample data is normally very good, almost regardless of sample size, level of overdetermination or the presence of model error. 32 MacCallum et al. 33 also suggested that communalities should all be greater than 0.6 or the mean level of communality to be at least 0.7. In our case, all communalities are greater than 0.6 and the mean is also higher than 0.7.
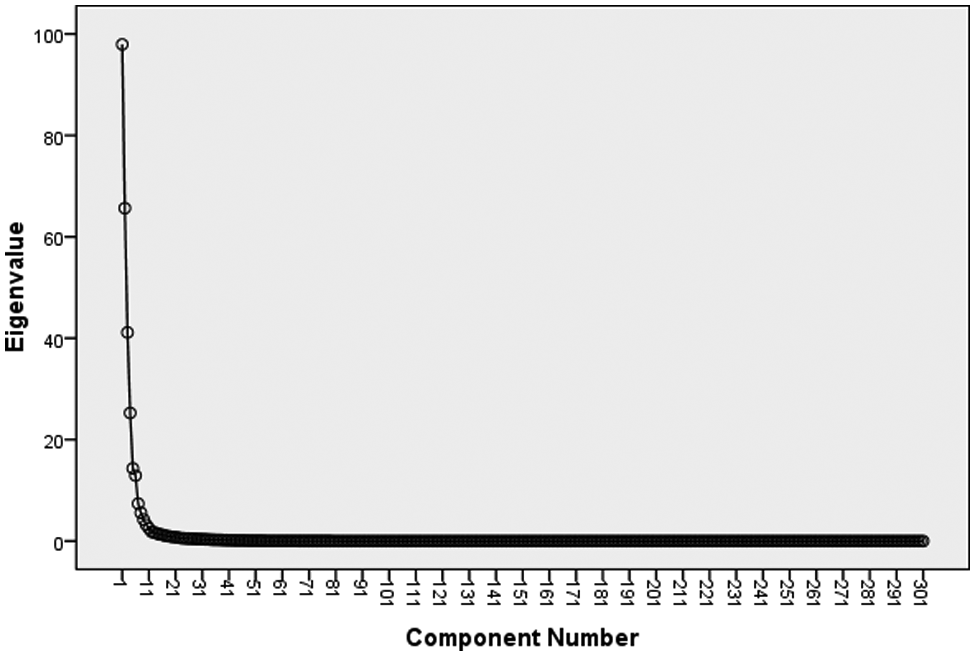
Scree plot.
Results of PCA.
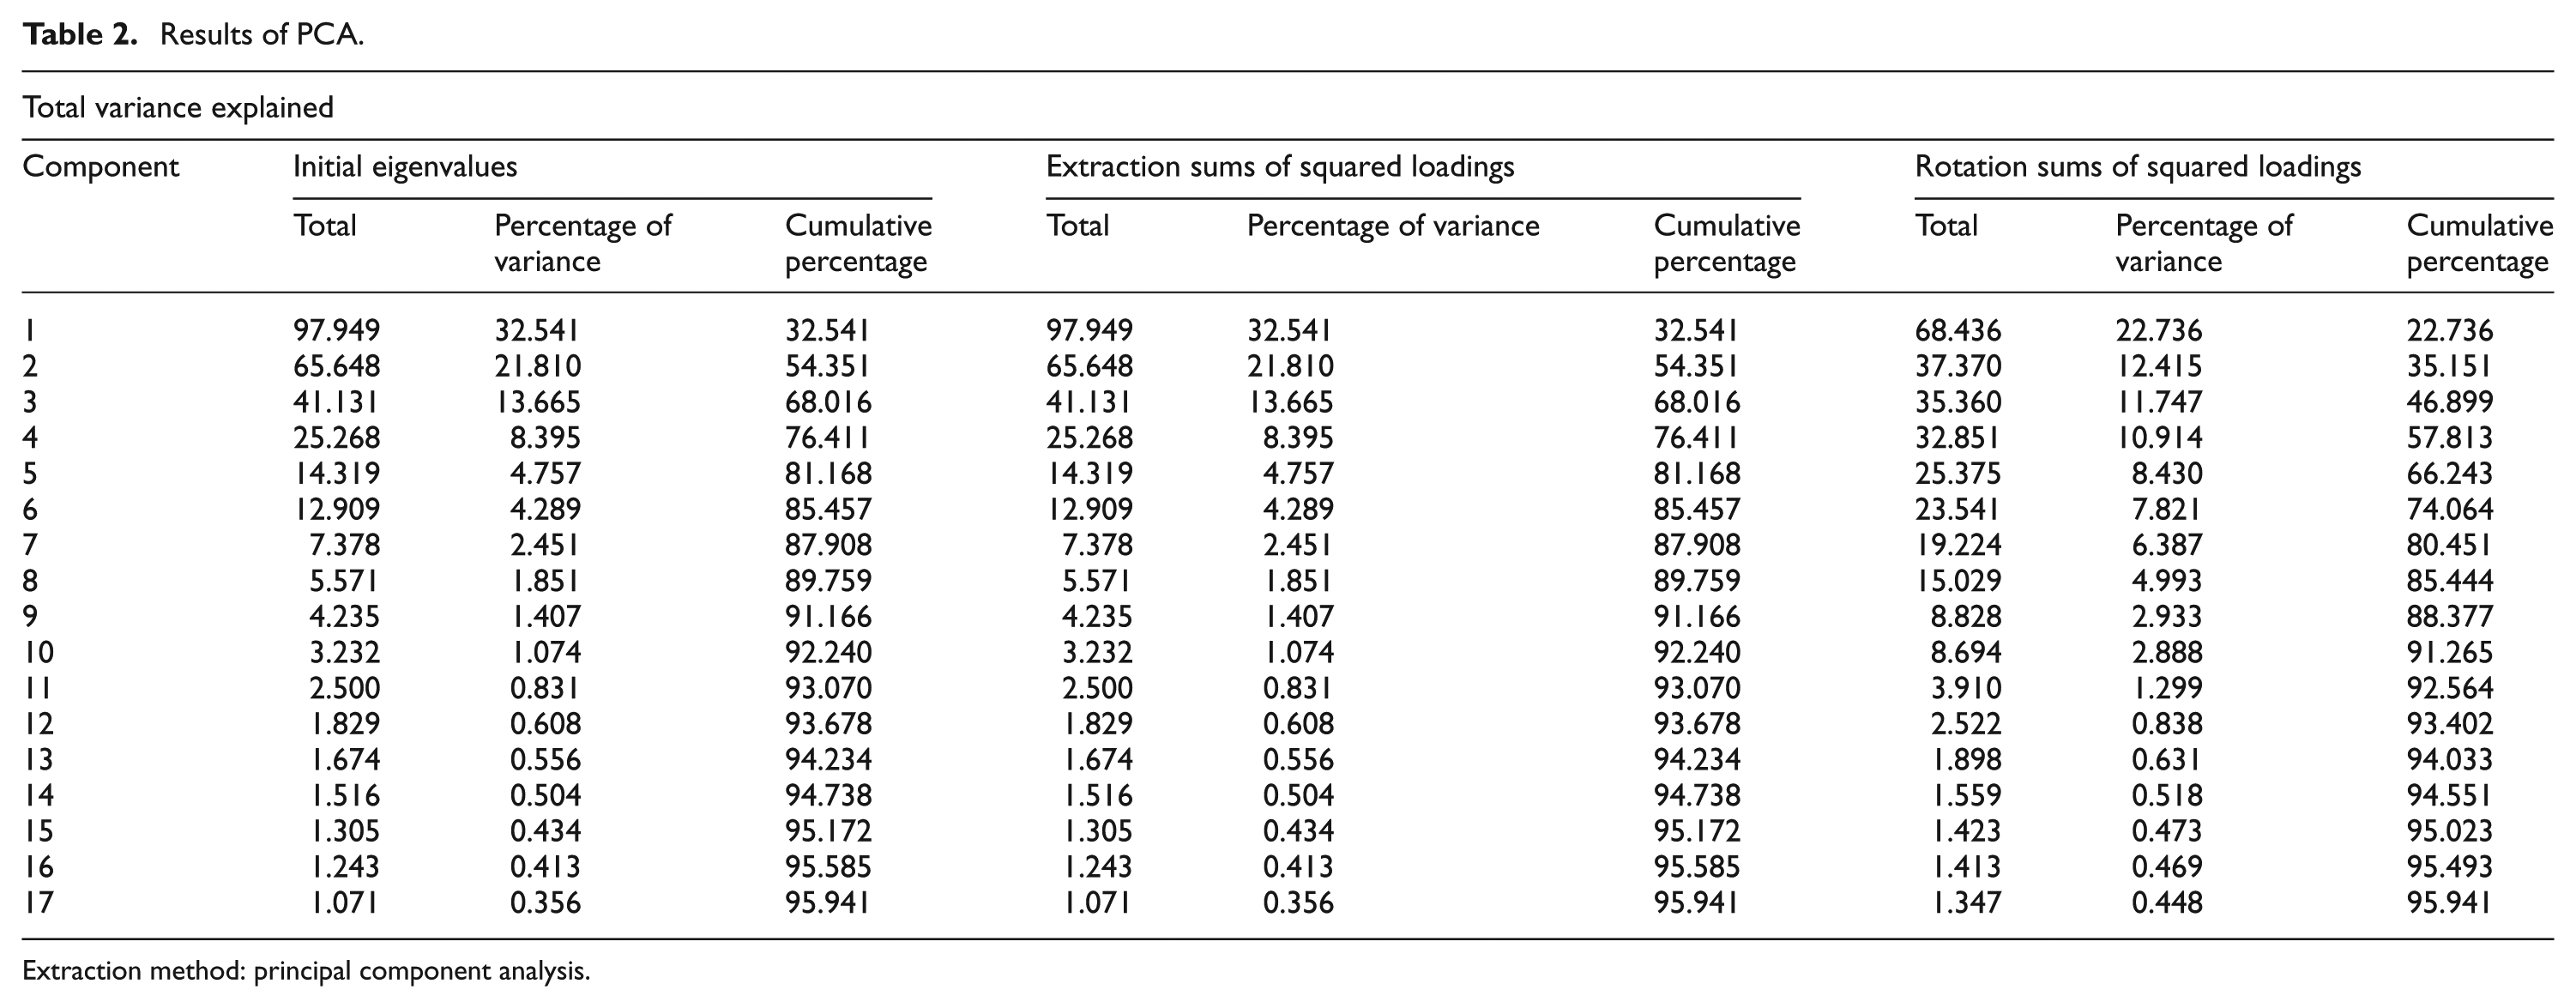
Extraction method: principal component analysis.
From Figure 2, these nine factors (or main constructs or pillars of excellence) were identified as strategic management, manufacturing management, marketing management, integration, IT, logistics management, supplier management, demand management and collaboration. Coincidently, these pillars turn out to be the same as that given in Soni and Kodali. 13 Now, in order to find out underlying variables (or constructs) under each factor, the variables were arranged as per their loading with respect to each dimension (or factor). The factor loadings provided an indication of correlation of different original items (variables) with each factor and also the extent of correlation. 35 Variables with loadings above 0.4 were considered. Comrey and Lee 29 suggest that loadings in excess of 0.71 are considered excellent, 0.63 very good, 0.55 good, 0.45 fair and 0.32 poor. 27 Hence, by going through all the variables for a particular factor and by considering factor loading (from rotated component matrix) of items above 0.4, all the variables were assigned under one factor. It is important to specify here that all the cross loadings got removed by considering factor loadings above 0.4.
Hence, after performing PCA, nine pillars of SCM excellence emerged, together they constitute a framework of SCM excellence in Indian manufacturing industry. However, one needs to check reliability and validity before establishing the final set of pillars and their constructs.
Evaluation of reliability of the pillars for internal consistency
Now, the internal consistency method 14 was used to evaluate the reliability of each factor. 34 Cronbach’s alpha values were estimated for each pillar using the SPSS 17.0. Cronbach’s alpha is based on “internal consistency” of a test: the degree to which variables in the measurement set are homogeneous. Specifically, it is based on the average correlation of variables within a test. 23 In exploratory research, items with Cronbach’s alpha value higher than 0.6 are considered to exhibit internal consistency. However, in the present case, the lowest alpha value detected was 0.68, which is anyway acceptable, but since there is large number of constructs present in the exploratory factor model, it was decided to follow the approach of Nunally 34 and internal consistency of each pillar was maximized which required dropping some items. Table 3 gives internal consistency analysis for nine pillars.
Internal consistency analysis for nine factors.
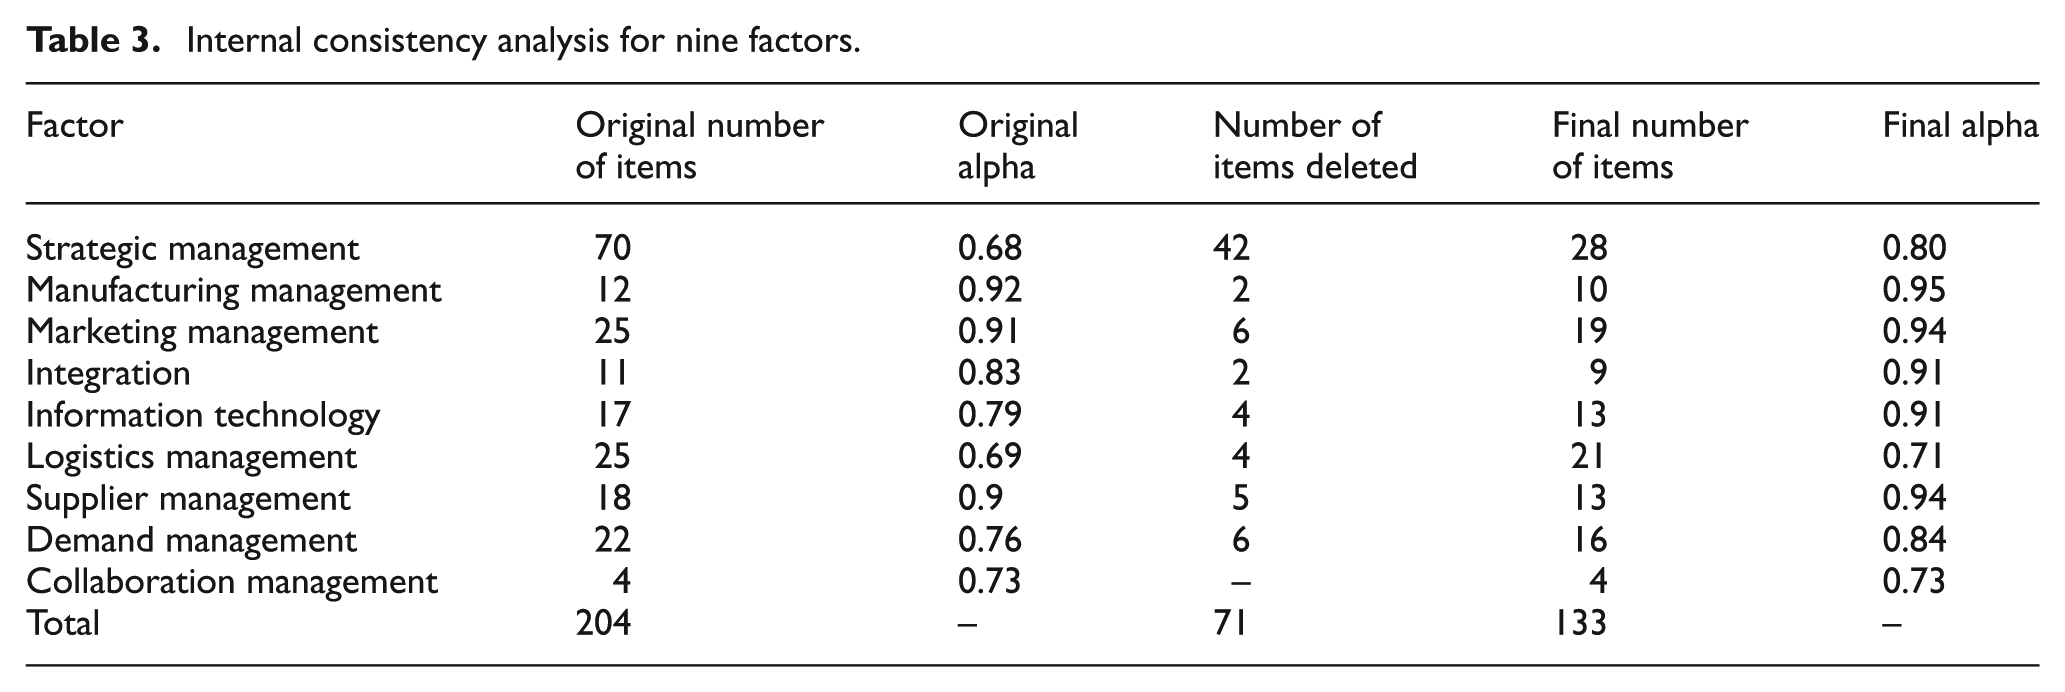
Table 3 reports the original sets of measurement items associated with the nine pillars, the items deleted from the original sets to achieve maximum alpha and the reliability coefficients associated with the resulting scales. It shows, for example, that of the original 12 items for the manufacturing management, the elimination of 2 items was necessary to achieve. It also shows a maximum alpha value of 0.95, and the final alpha value ranges between 0.73 and 0.95, which indicates that the instrument can be considered reliable and internally consistent.
Deleted item analysis
After eliminating the items indicated in Table 7, the remaining items were evaluated by considering the correlation of each item with each scale. 34 A correlation matrix was formed between the nine pillars and the constructs (measured variables). The correlation matrix was examined whether high correlations exist between each pillar and its respective constructs or not. It was found that all the preserved constructs in Table 7 exhibited high correlation with their respective pillars, hence it was concluded that all constructs (items) have been appropriately assigned to their scales.
Evaluation of validity of pillars using confirmatory factor analysis
After carrying out exploratory factor analysis (EFA), the next step is to confirm and examine the details of an assumed factor structure obtained from EFA using confirmatory factor analysis (CFA). CFA is reckoned as a best-known statistical procedure for testing a hypothesized factor structure.36,37 It is performed to establish construct validity. 35 In order to perform CFA, software package for structural equation modeling (SEM), AMOS 16.0, was used. The maximum likelihood (ML) estimation method was employed. A few assumptions need to be fulfilled in order to use the ML method: 39
Reasonable sample size;
The scales of the observed variables should be continuous;
The hypothesized model should be valid;
The distribution of the observed variables should be multivariate normal.
The data for this research meet the first requirement as the sample size is 185. According to Velicer and Fava, 39 in EFA, the size of the factor loadings, the number of variables and the size of the sample were important elements in obtaining a good factor model. This can be generalized to SEM models as well. Since the sample size of 185 is found to be suitable for EFA, it is sufficient enough for SEM as well. The scale of the observed variables is continuous and the hypothesized model is developed from the literature, thus it is valid. Finally, for the normality of the observed variables, the rules of thumb given by West et al. 40 are followed, that is, for a sample size of 200 or less, moderately non-normal data (univariate skewness <2, univariate kurtosis <7) are acceptable. Recent research also shows that ML estimation method can be used for data with minor deviations from normality.38,41 In the present data, the univariate skewness of each variable is 0.836 in absolute value. The univariate kurtosis of each variable is 1.056 in absolute value. Thus, the fourth assumption of ML method is also satisfied.
Construct validity
One of the main advantages of CFA is its ability to assess the construct validity of proposed measurement theory. Construct validity is the extent to which a set of measured items actually reflects the theoretical latent construct (pillar in this case) those items are designed to measure. 31 Hence, in order to establish construct validity, the analysis of proposed confirmatory factor model was carried out in multiple stages. Initially, all 133 observed variables were considered. For nine-factor model, the model fit indices were χ2 = 11423, degree of freedom (df) = 8218, χ2/df = 1.389, goodness of fit index (GFI) = 0.586, adjusted goodness of fit index (AGFI) = 0.579, root mean square error of approximation (RMSEA) = 0.046, confirmatory fit index (CFI) = 0.233 and root mean square residual (RMSR) = 0.146. These values clearly indicate that the original model needed to be respecified to fit with sample data. The model respecification was done using the following guidelines: 38
Items with poor square multiple correlations and low regression weights were deleted.
Items with high error variance and which does not degrade the goodness of fit were deleted.
Items with high factor loading were not deleted.
For example, consider a construct “database management,” which had 0.065 as value of square multiple correlation and had regression weight as low as 0.4, hence it was considered as a candidate for deletion. After deleting this construct, the goodness of fit, that is, χ2 value, improved. Thus, this item was deleted from the pillar of IT. Similarly, “collaborative relationships” had factor loading 0.54 (not very high) and squared multiple correlation as 0.12 (low value), but it was still not deleted as the goodness of fit got degraded after removing it from the pillar. Using the above guidelines, a series of model respecifications were carried out. A summary of the model respecifications is given in Table 4.
Summary of the model respecifications.
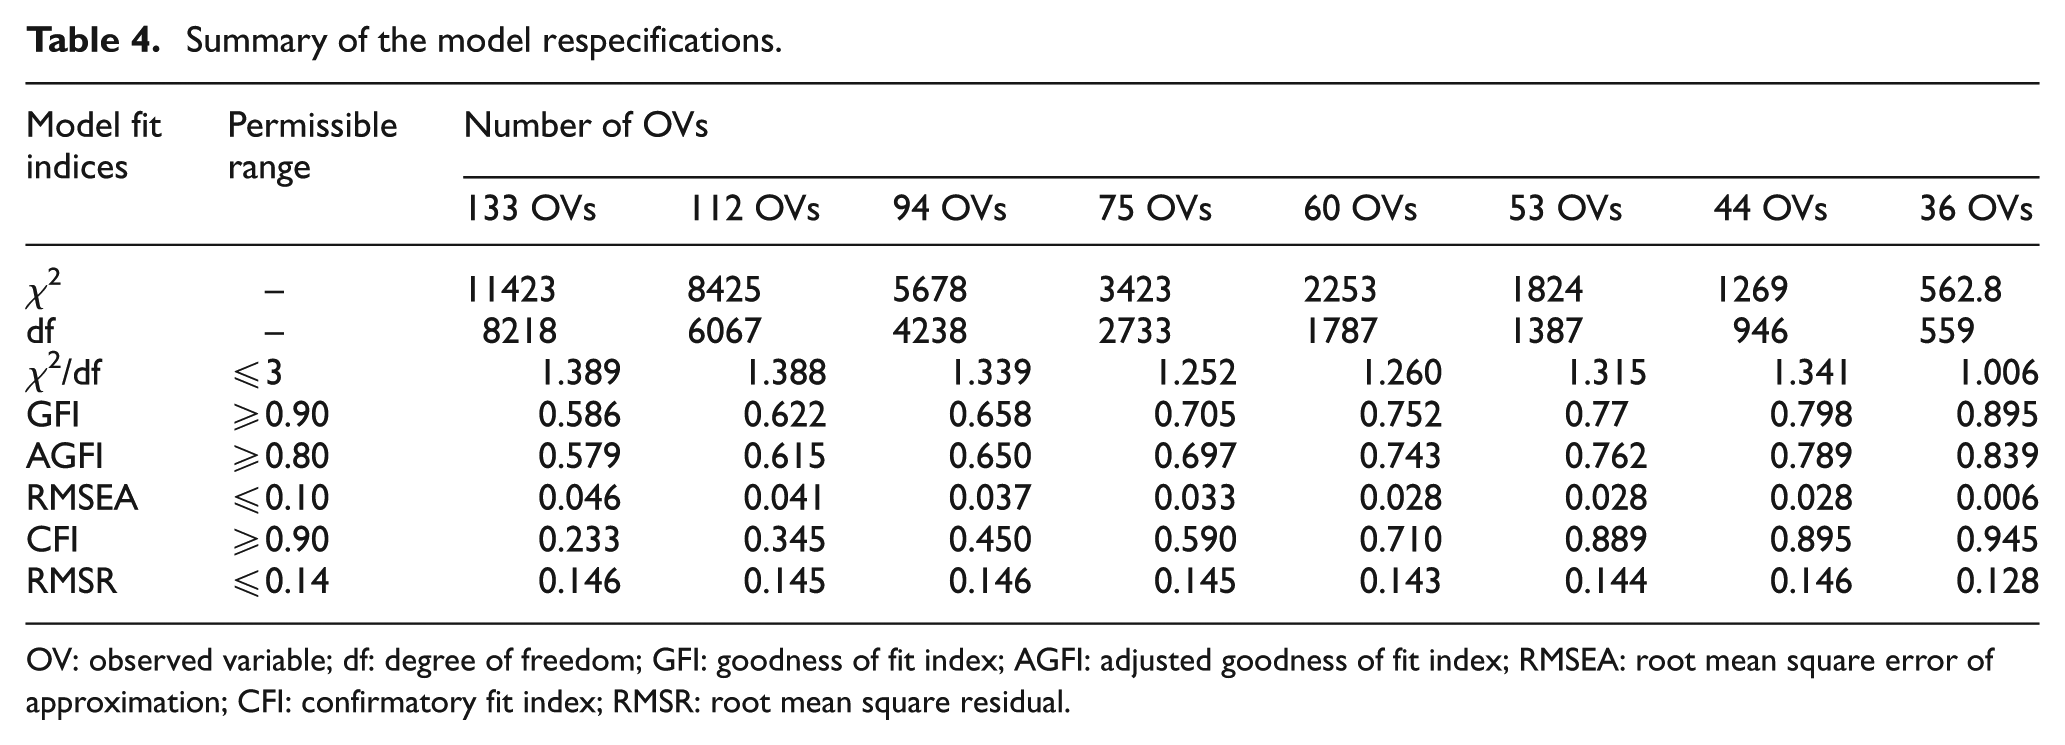
OV: observed variable; df: degree of freedom; GFI: goodness of fit index; AGFI: adjusted goodness of fit index; RMSEA: root mean square error of approximation; CFI: confirmatory fit index; RMSR: root mean square residual.
It is evident from Table 4 that the best model fit is obtained with 36 observed variables, hence establishing the construct validity. The list of observed variables (constructs) with their respective latent variables (pillars) for 36 observed variables is given in Table 5.
List of observed variables (constructs) with their respective latent variables (pillars).
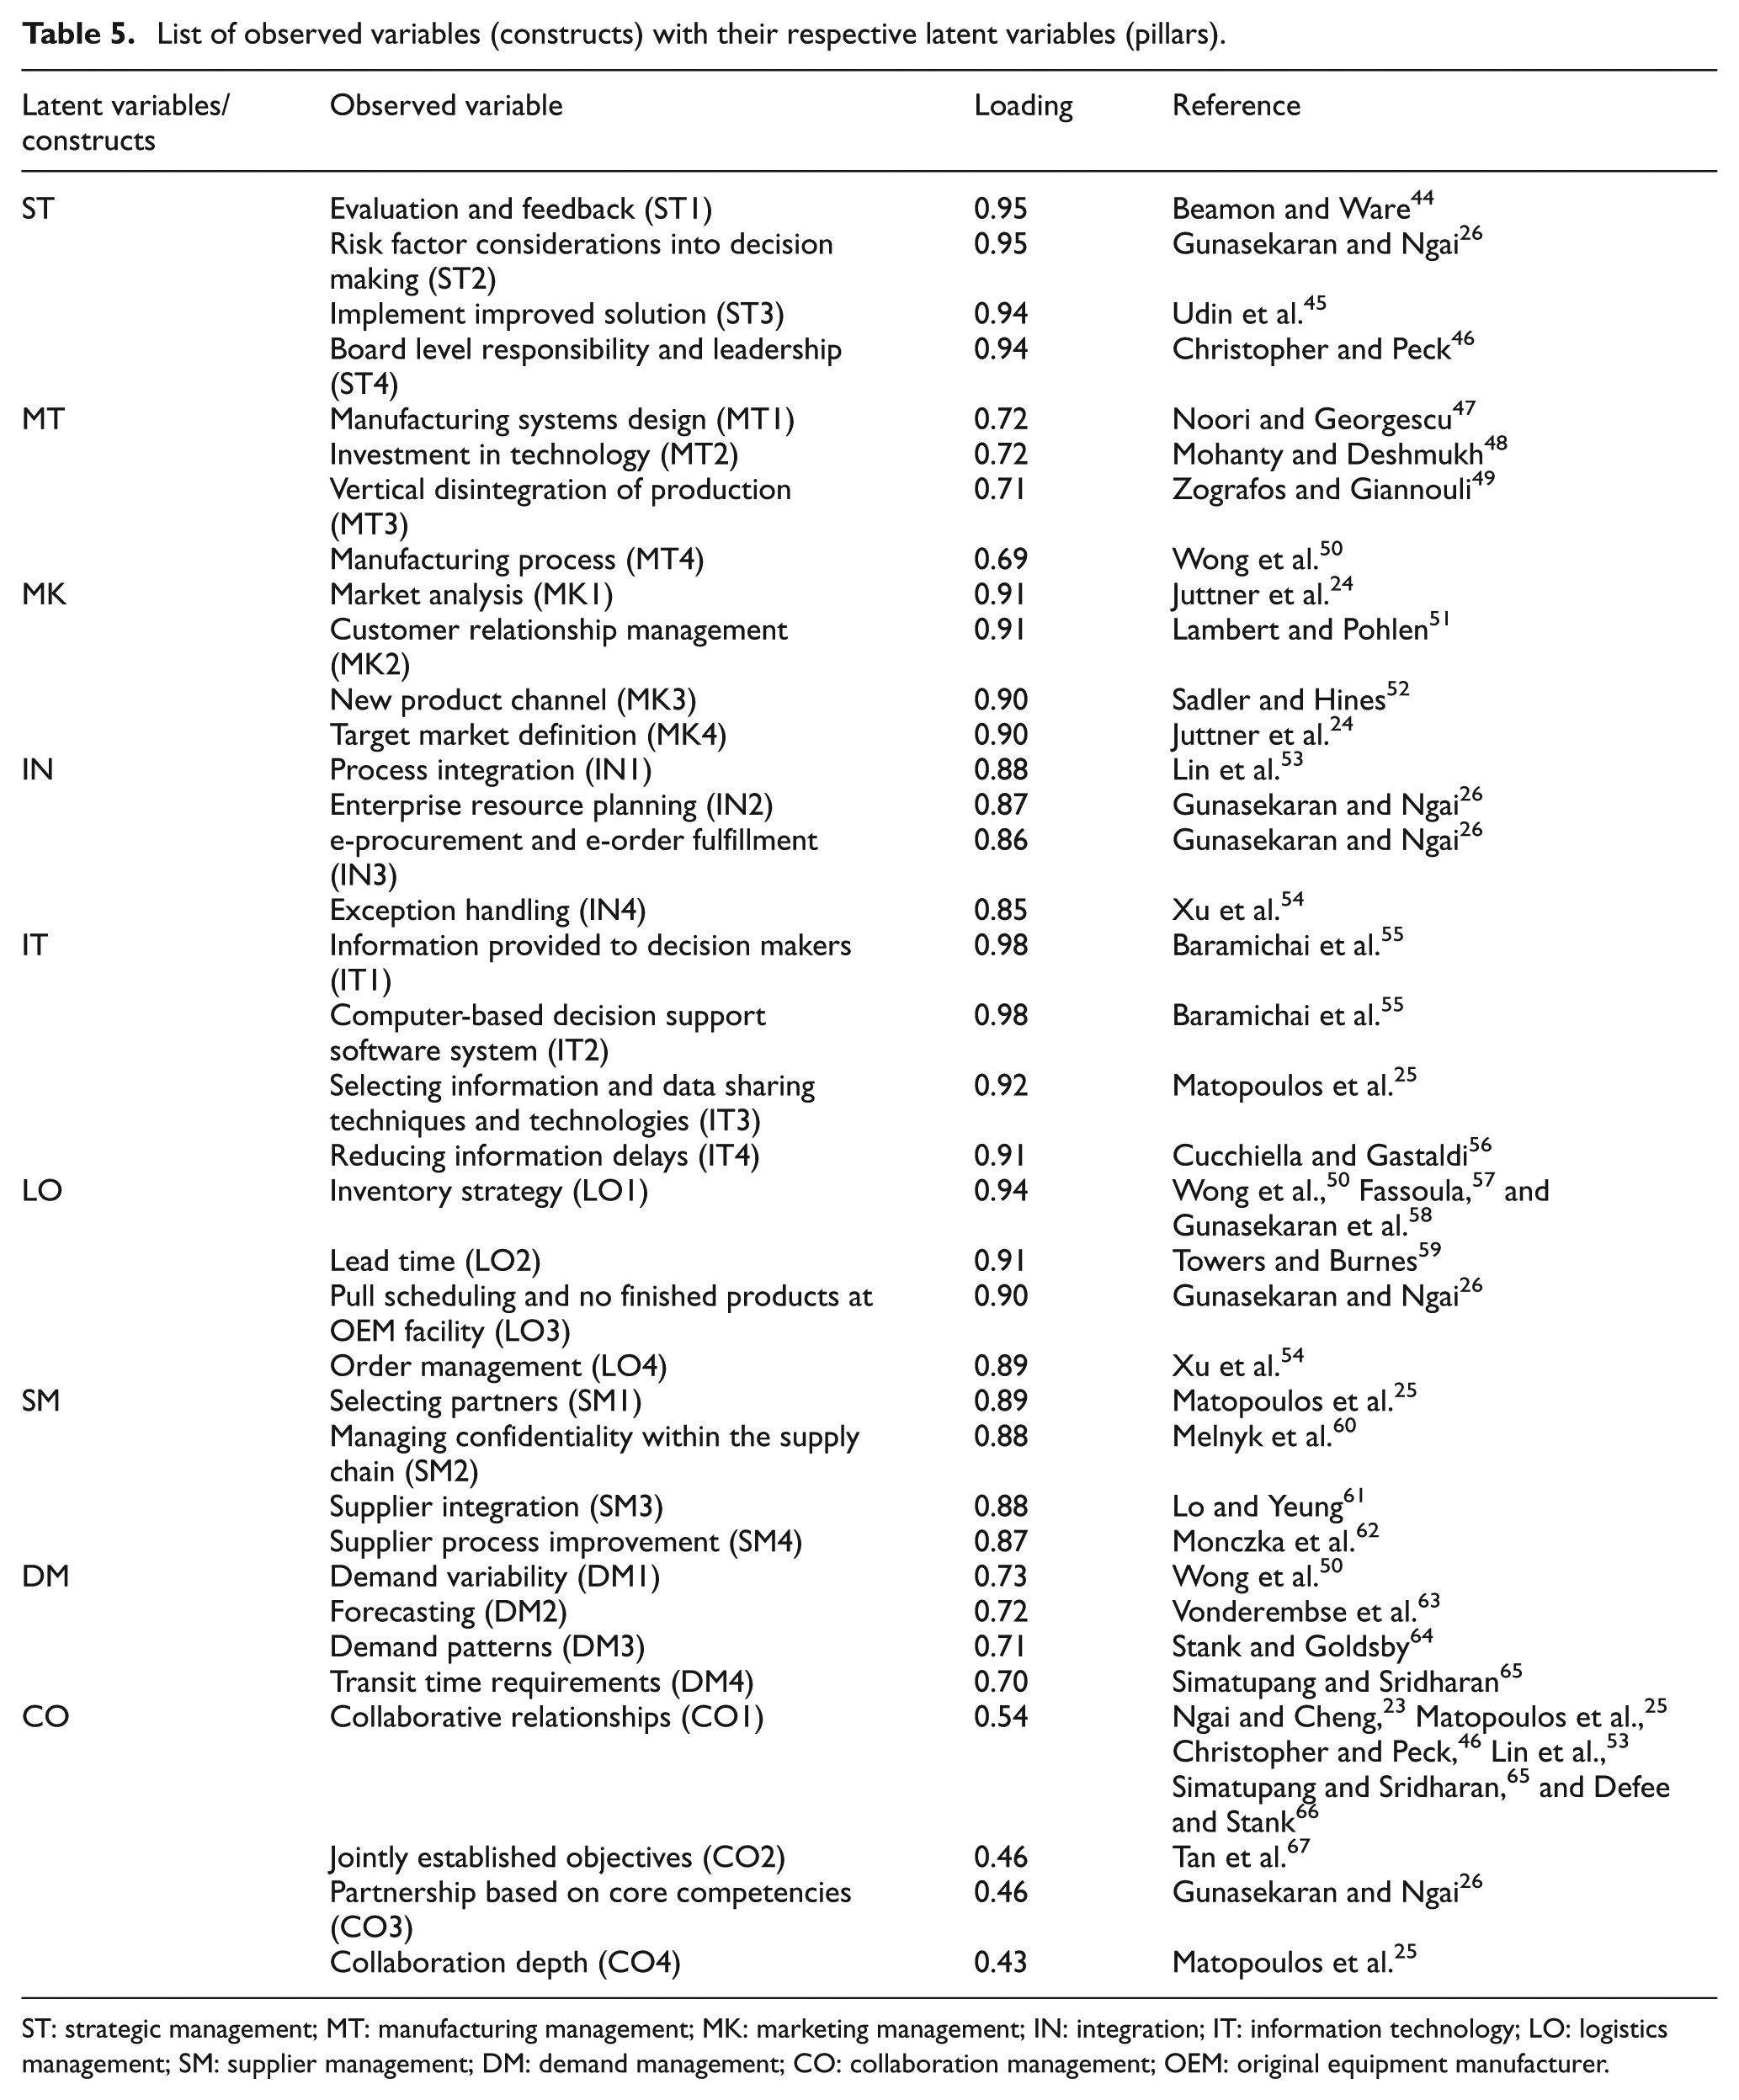
ST: strategic management; MT: manufacturing management; MK: marketing management; IN: integration; IT: information technology; LO: logistics management; SM: supplier management; DM: demand management; CO: collaboration management; OEM: original equipment manufacturer.
Convergent validity
It is the extent to which indicators of a specific construct converge or share a high proportion of variance in common. 31 Anderson and Gerbing 42 stated that convergent validity of a model is assessable by determining the path estimates between the measurement items and the significance of their respective latent variables. Using AMOS output, the standardized estimates of all the measured variables were found to be significant. The standardized estimates of all the measured variables are given in Table 6. Each variable exhibited significant loadings that supported the convergent validity.
Standardized estimates of all the measured variables.
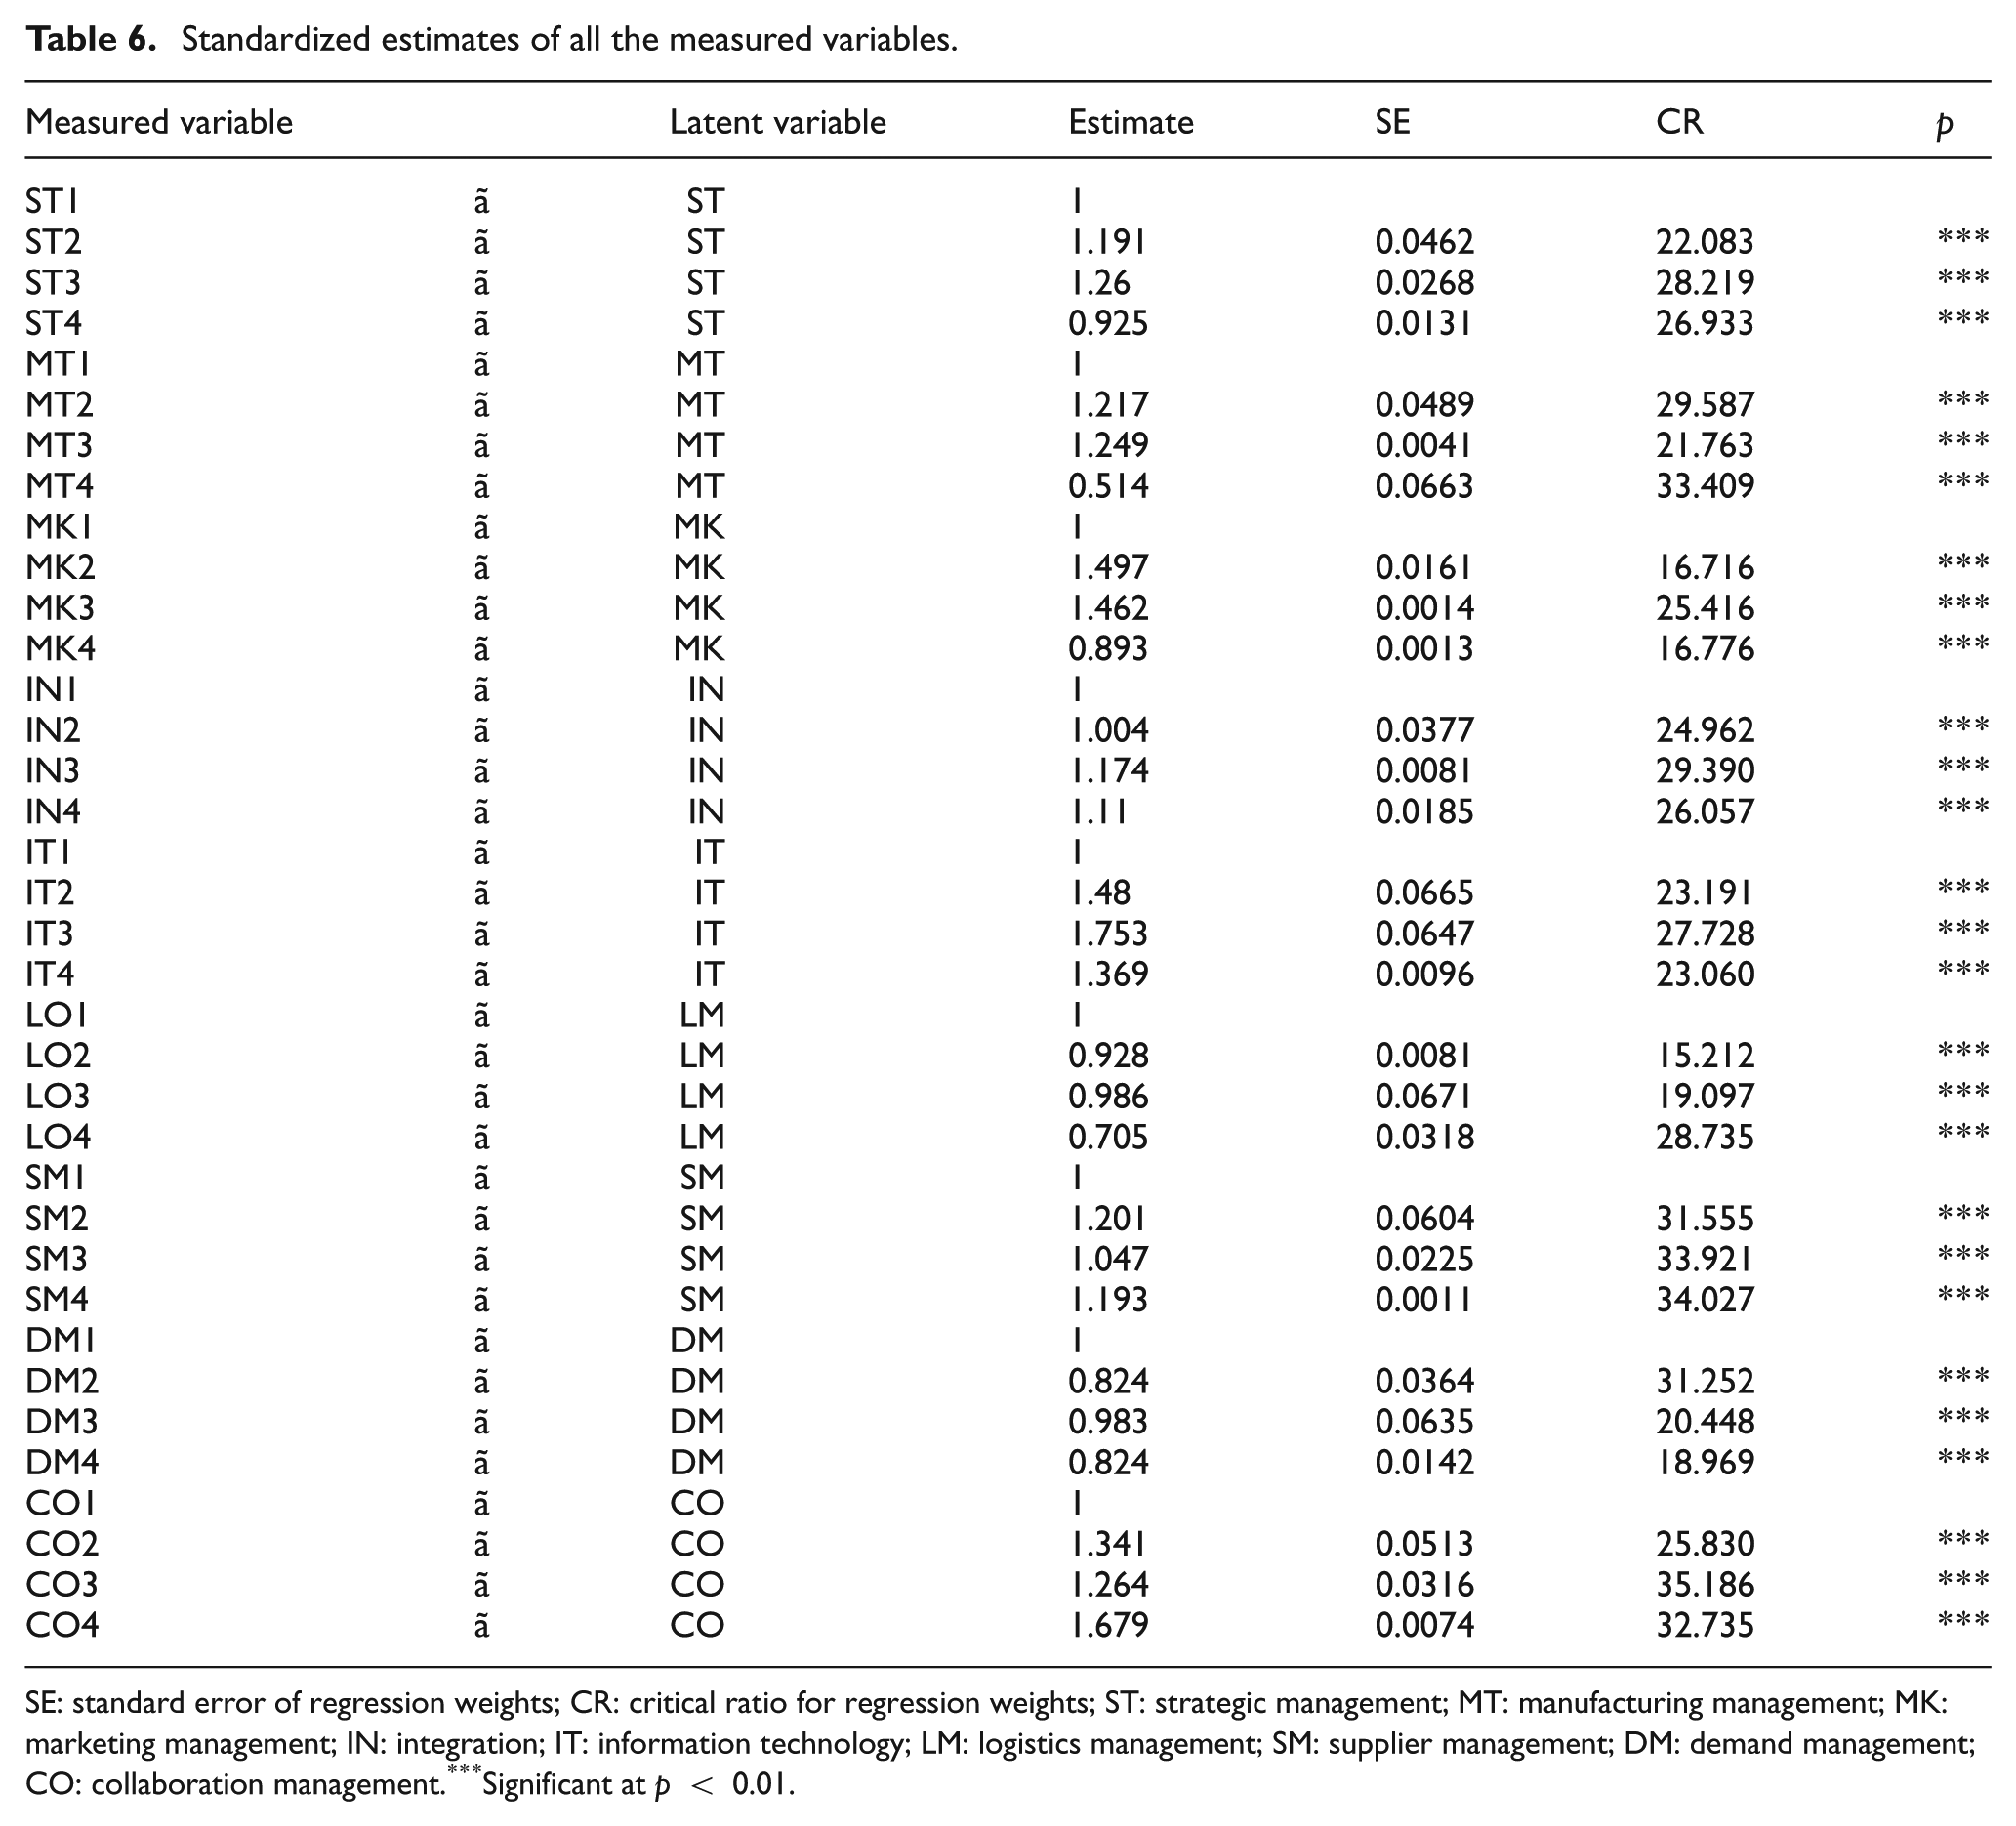
SE: standard error of regression weights; CR: critical ratio for regression weights; ST: strategic management; MT: manufacturing management; MK: marketing management; IN: integration; IT: information technology; LM: logistics management; SM: supplier management; DM: demand management; CO: collaboration management.
Significant at p < 0.01.
Discriminant validity
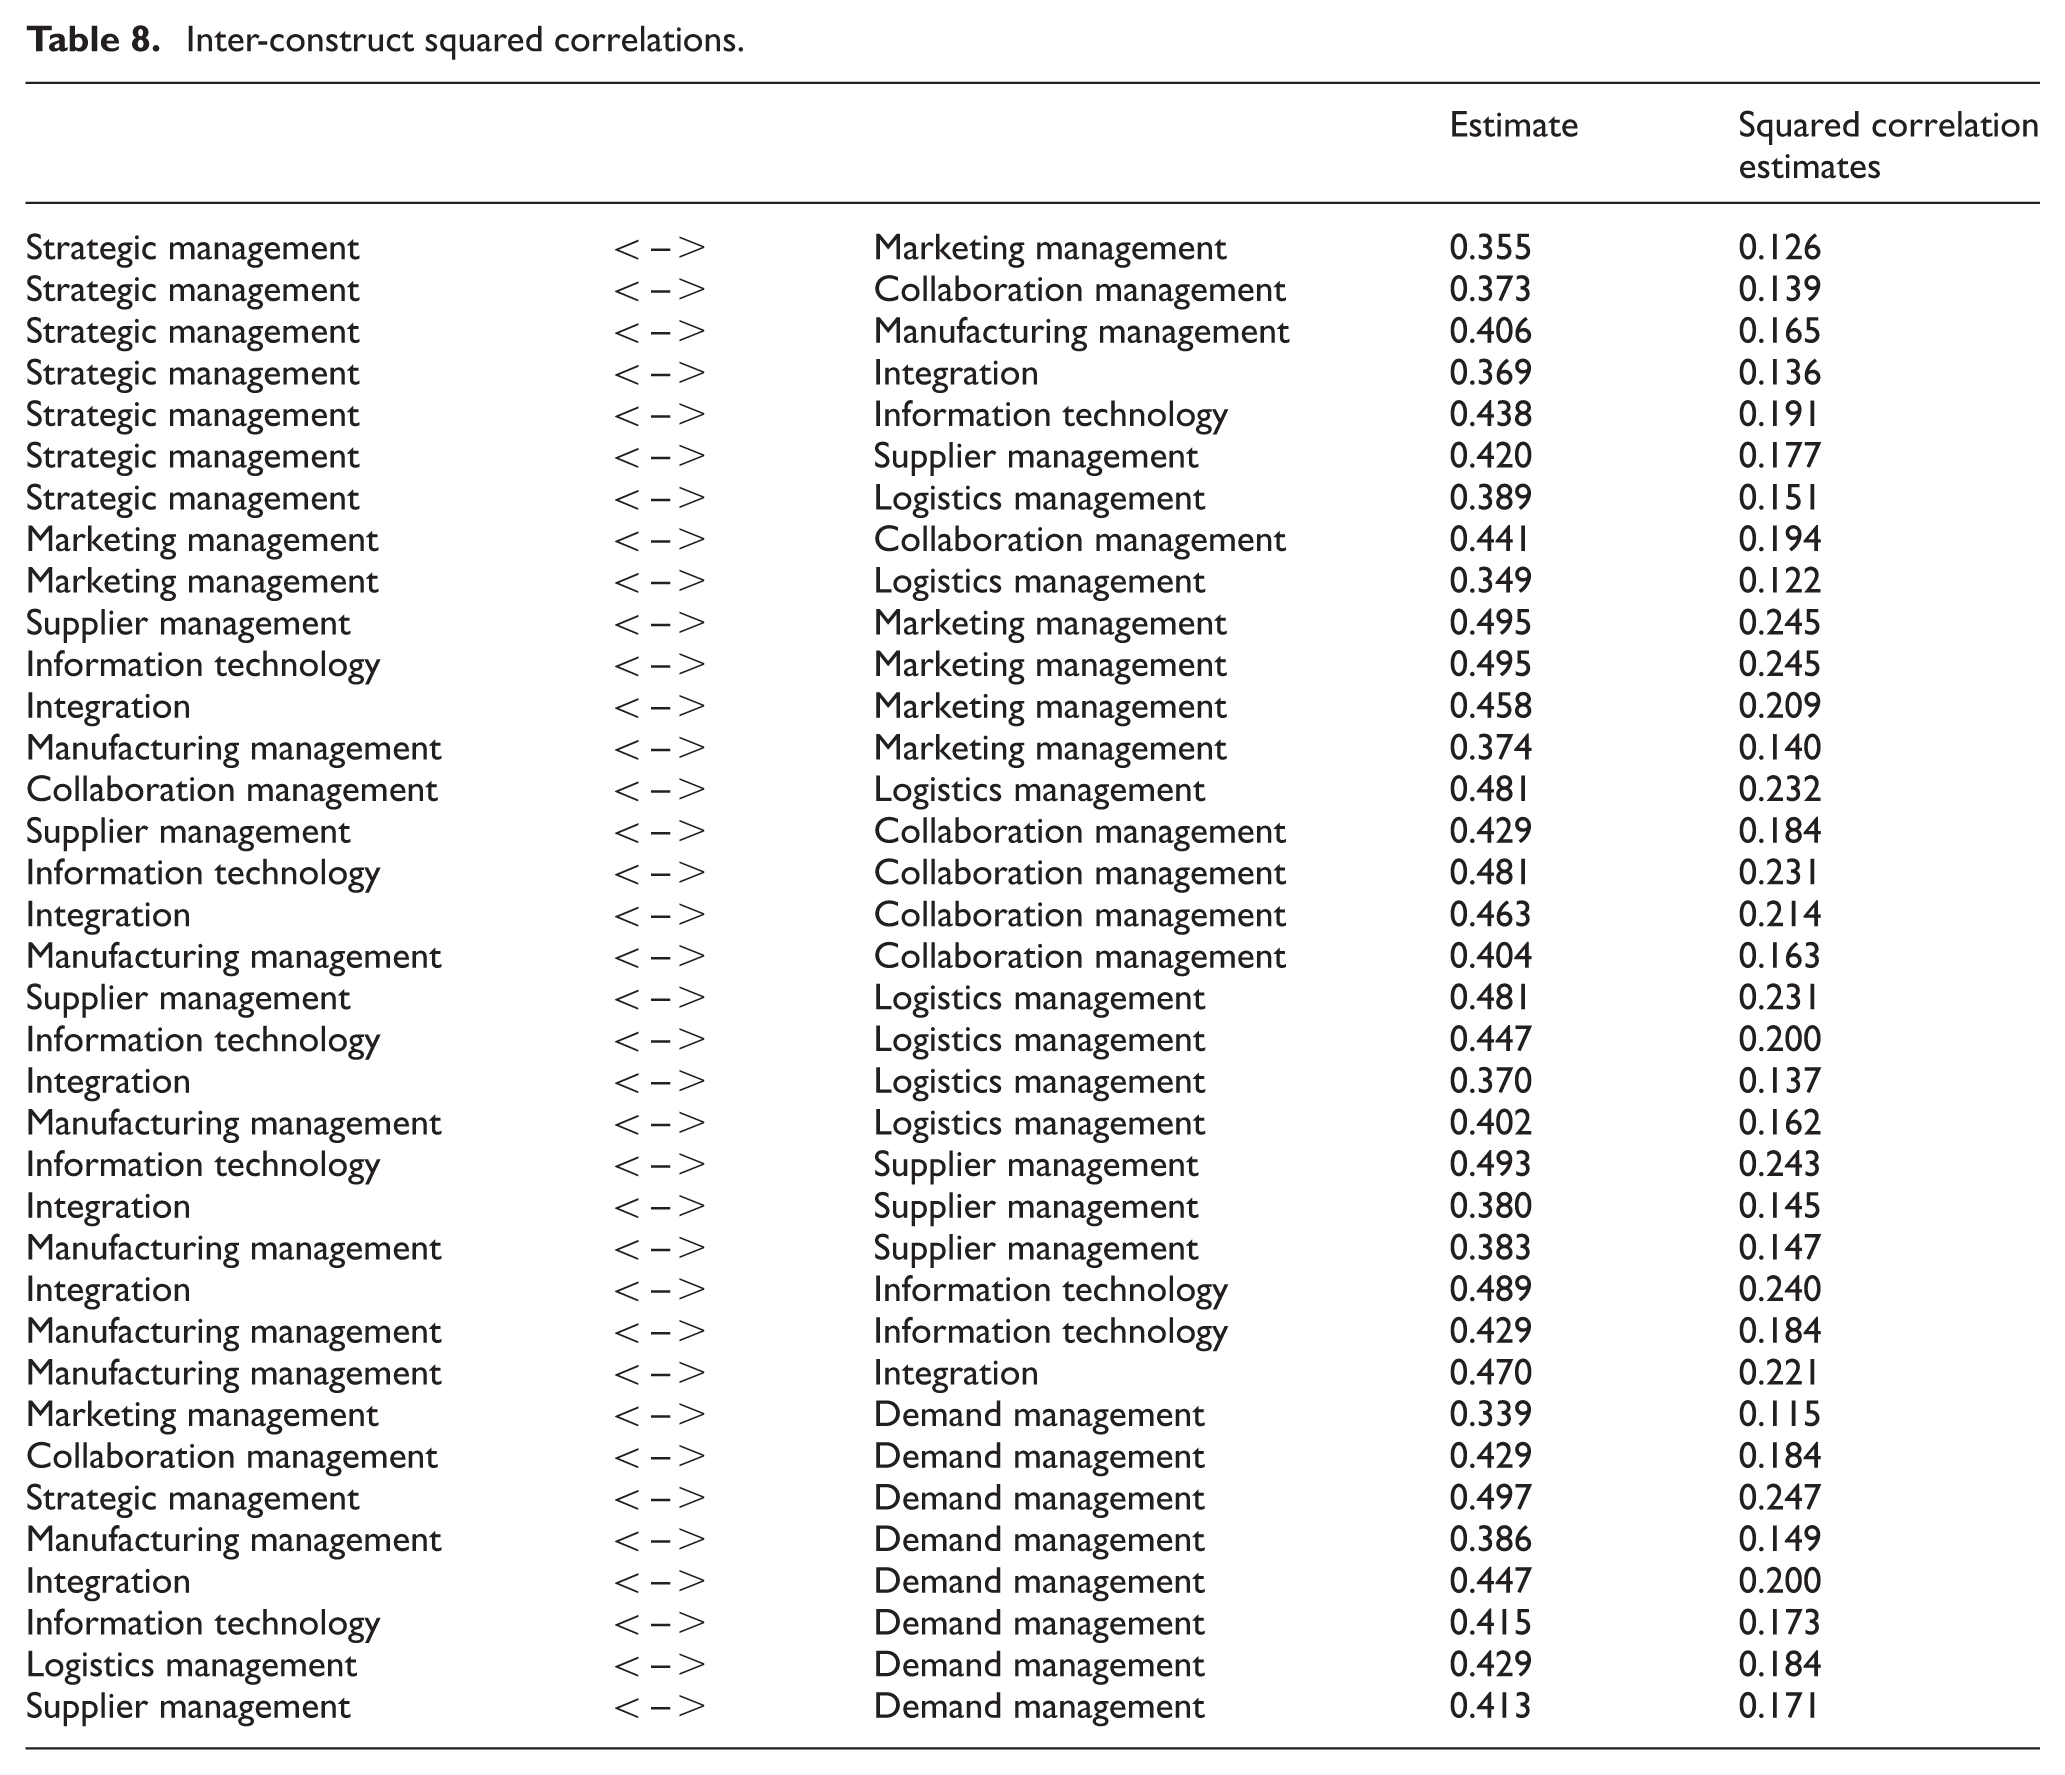
It is the extent to which a construct is truly distinct from other constructs. 31 According to Fornell and Larcker, 43 average variance explained (AVE) must be greater than the inter-construct squared correlation estimates so as to establish discriminant validity of constructs. AVE is given in Table 7 and inter-construct squared correlations are given in Table 8. It can be seen from both the tables that AVEs are greater than inter-construct squared correlations which support the discriminant validity.
Average variance explained.
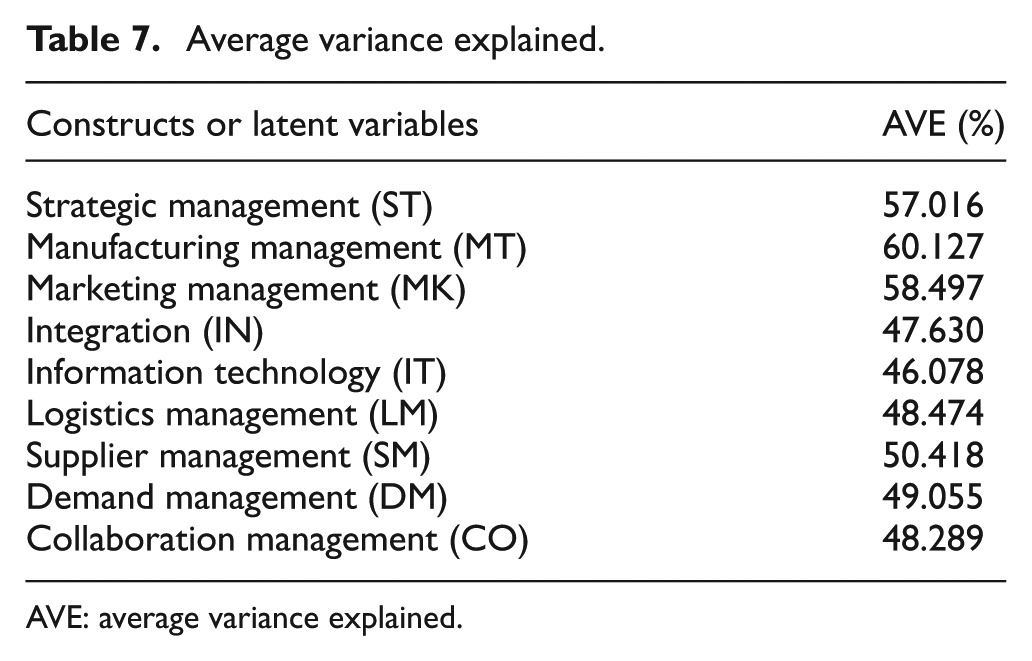
AVE: average variance explained.
Inter-construct squared correlations.
The final CFA model with established construct validity is given in Figure 3.
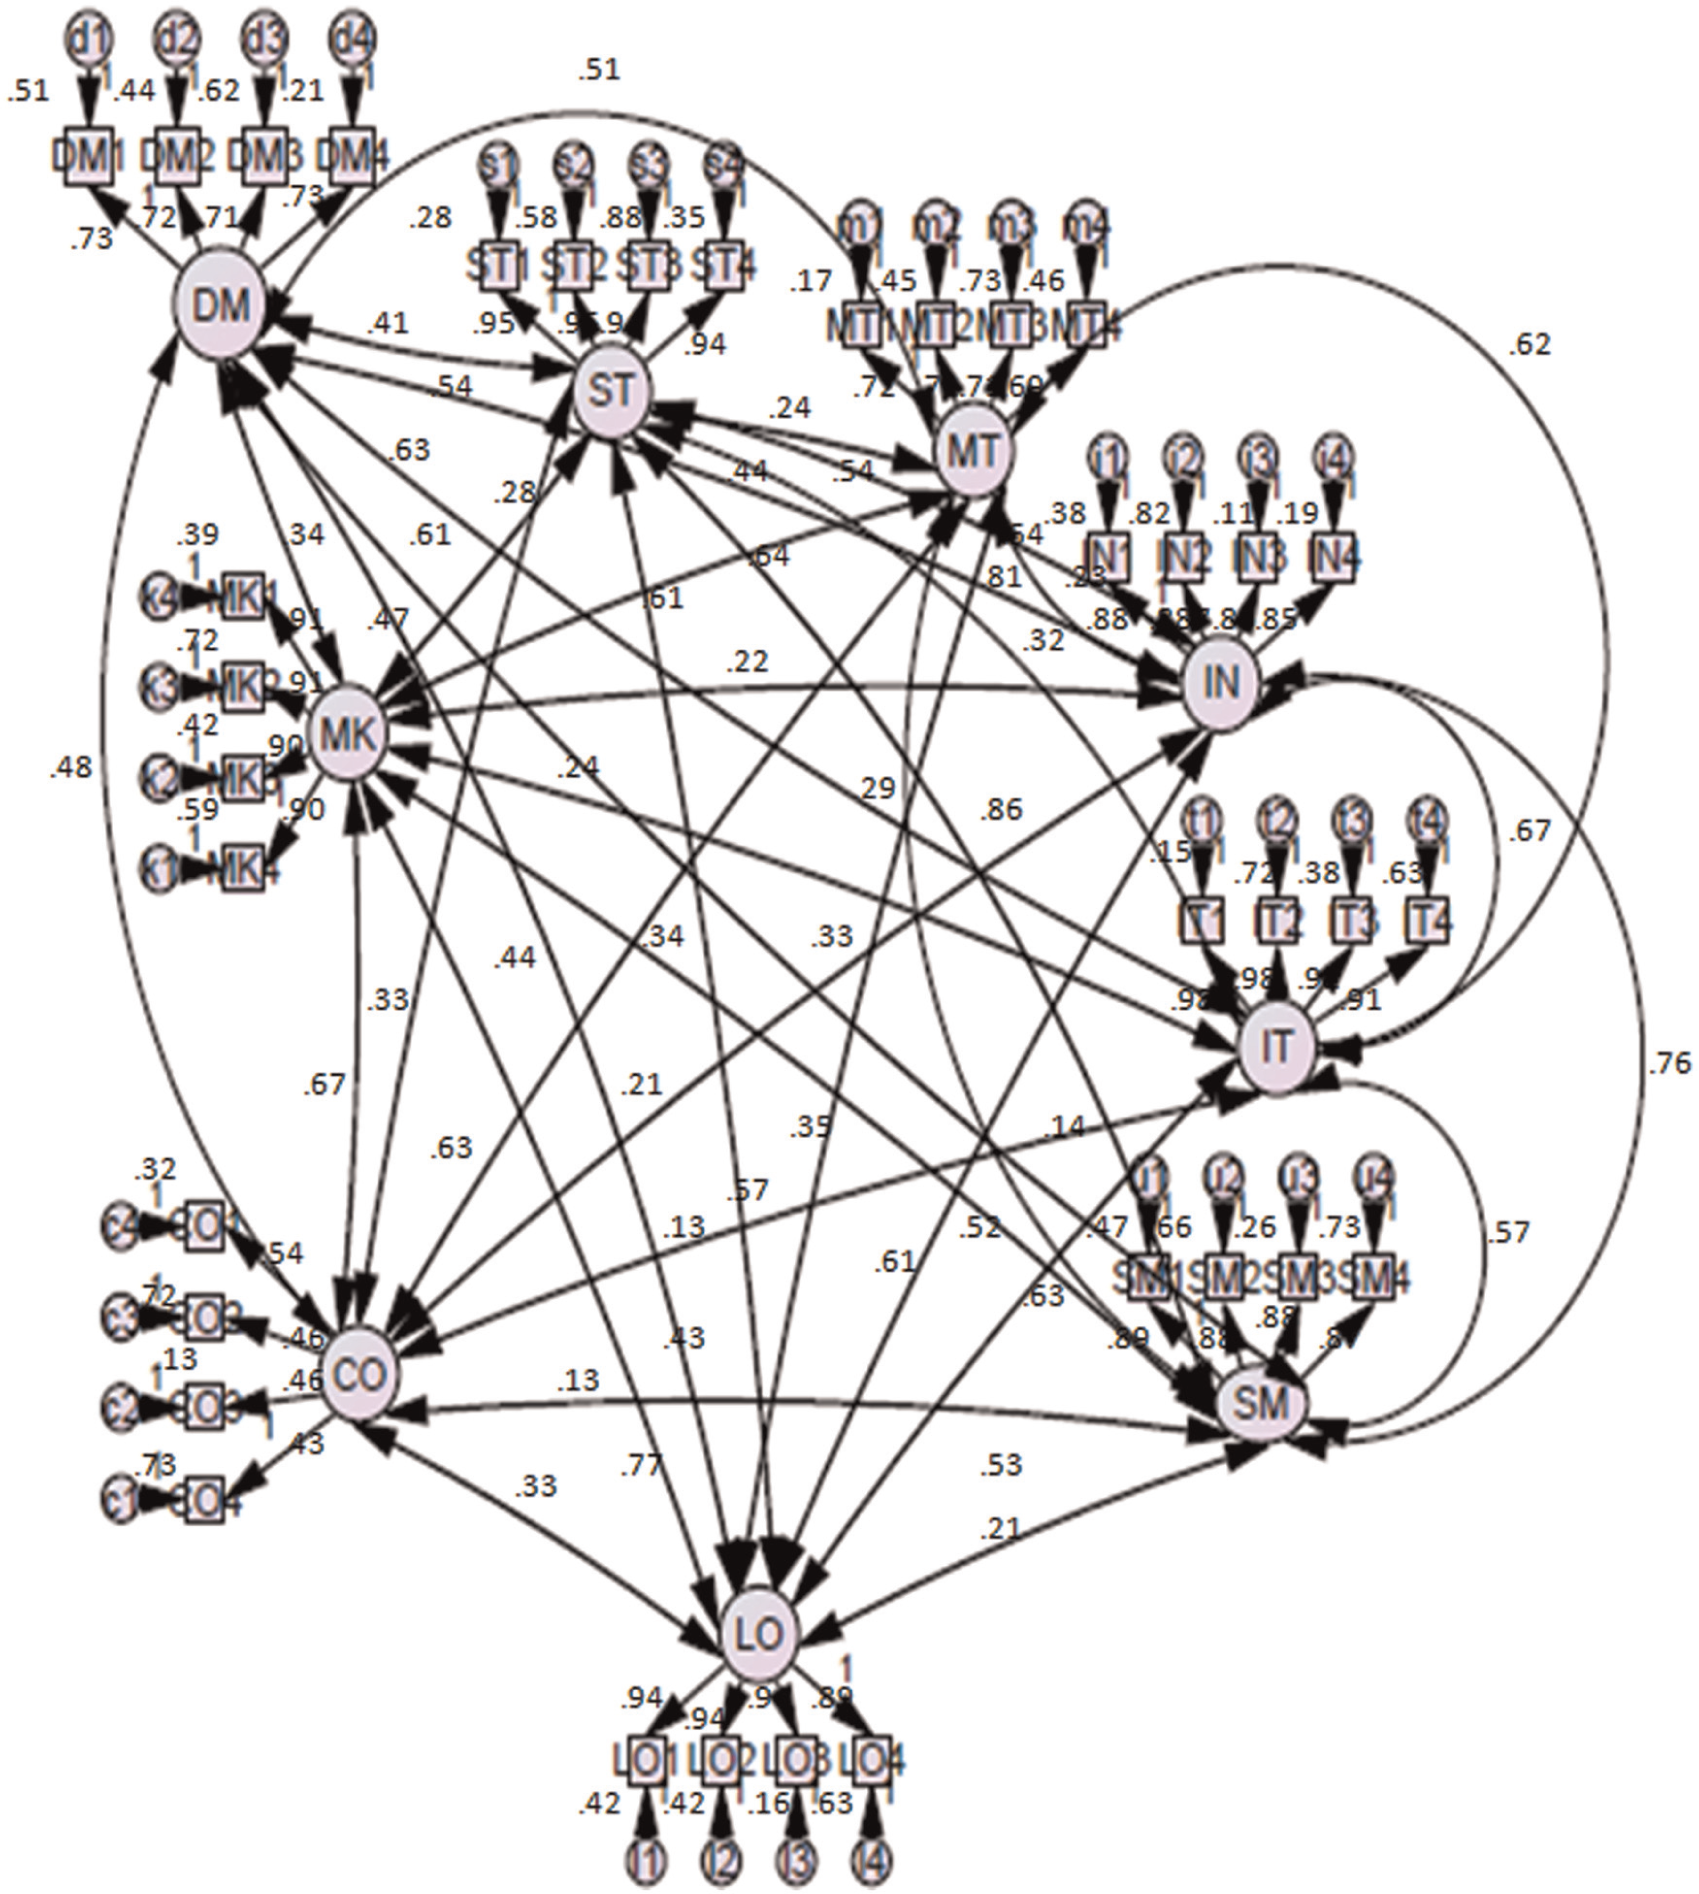
Confirmatory factor analysis.
Pillars of SCM excellence
The pillars of SCM excellence established in the previous section have 36 observed variables in all, hence there is need for further reflection on the final set of variables regarding whether these variables in a good way describe the pillars or not. Comparison of set of constructs proposed by Soni and Kodali 13 corresponding to each pillar is distinct from the constructs exhibited by this empirical study. According to Soni and Kodali, 13 a framework has the following characteristics:
A framework must depict the complete structure of relationships between elements of system under study and not just suggest elements comprising the system.
A framework must describe steps/stages/sequence of activities that are required to be used for the designated purpose.
A framework must describe the activities involved, which connects various elements of framework.
Further discussion is focused on elaborating framework for satisfying these conditions so as to establish SCM excellence framework. It is worthwhile to mention here that the interrelationships and directional interdependence between pillars and between constructs of each pillar can only be established by carrying out path analysis, which is out of scope of this study. However, certain relationships can certainly be hypothesized.
Strategic management
Strategic management is an integral part of any management process. Beamon and Ware 40 have emphasized that evaluating and monitoring of the current process in the supply chain is very important. This construct scored a factor loading of 0.95 in the analysis. Another construct, “risk consideration in decision making,” also had 0.95 loading on strategic management. Its importance is very well highlighted by Gunasekaran and Ngai 26 and included as a construct in their framework of build to order supply chain (BOSC). Implementing improved solution is something taken for granted in many situations. While for achieving excellence in SCM processes, it has emerged as another construct. Udin et al. 45 have given special attention to this construct in their collaborative SCM framework. The board level responsibility and leadership is the last construct of strategic management with 0.94 loading. It is considered by Christopher and Peck 46 as it is essential for top management to be responsible and take leadership in supply chain initiatives so as to create a culture in an organization.
Manufacturing management
The emergence of “manufacturing management” as a pillar of excellence is obvious when the context is manufacturing industry. The constructs are manufacturing system design (0.72), investment in technology (0.72), vertical integration of production (0.71) and manufacturing process (0.69). Noori and Georgescu 47 emphasized that in manufacturing environment of original equipment manufacturers (OEMs), while designing supply chains one must consider “manufacturing system design” compatibility with the existing technology. Similarly, Mohanty and Deshmukh 48 considered “investment in technology” as an important aspect of reengineering the supply chain. It is a matter of utter importance too for the investors in supply chain also because with rapidly changing technology and more emphasis on reducing the flow time in manufacturing, the growing need of investment in technology is also inevitable. The “vertical disintegration of production” is advocated by Zografos and Giannouli, 49 where they examined the implementation of vertical disintegration instead of integration due to the reorganization of the corporate management structure (i.e. strategic alliances, outsourcing). Wong et al. 50 considered “manufacturing processes” as an operational construct for assessing responsiveness in a supply chain. Manufacturing process can be of several types such as made to stock (MTS), made to order (MTO) or assemble to order (ATO). It is thus imperative to select a manufacturing process and then design its supply chain accordingly.
Marketing management
The pillar “marketing management” is made up of “market analysis” (0.91), “customer relationship management (CRM) (0.91),”“new product channel (0.90)” and “target market definition (0.90).” Juttner et al. 24 included “market analysis” as a construct in framework for demand and supply process integration in supply chain. It plays a pivotal role in creating awareness in an organization and in the supply chain about the requirements of the customers to synchronize the supply and demand process. Another important aspect of marketing management is CRM. Lambert and Pohlen 51 and Croxton et al. 68 established CRM as an important construct in their basic framework of SCM. The importance of customer is already very well recognized in area of SCM and all the elements related to customer are considered in CRM. Thus, inclusion of CRM in achieving excellence in SCM is inevitable. The “new product channel” as a construct is also quiet relevant, especially in the present environment of shorter product life cycles. The frequency with which new products emerges and demerges is high, and this rate is especially higher in consumable, fast-moving consumer goods (FMCG) and electronic and automobile goods. Sadler and Hines 52 considered “new product channel” as a construct in a framework for supply chain planning. Finally, “target market definition” is again given by Juttner et al., 24 which enables supply chain to target specific product to respective market segments.
Integration
Integration in supply chain is highly emphasized by practitioners and researchers. The constructs of integration are process integration (0.88), enterprise resource planning (ERP) (0.87), e-procurement and order fulfillment (0.86) and exception handling (0.85). Lin et al. 53 incorporated “process integration” in their conceptual model of agile supply chain as construct of agility enablers/pillars. Furthermore, as it is obvious, “ERP” turns out to be another construct of “integration.” 26 It is a technological enabler for integration in supply chain. The third construct is e-procurement and order fulfillment, again given by Gunasekaran and Ngai, 26 which they considered as a construct of design and procurement of BOSC. The last construct of integration is “exception handling,” which basically means the ability of integrating system to handle exceptions aside from normal standard procedures. This construct is given by Xu et al. 54
IT
IT has provided a great boost to various business processes. The constructs of IT that emerged out of this study are information provided to decision makers (0.98), computer-based decision support software system (0.98), selecting information and data sharing techniques and technologies (0.92) and reducing information delays (0.91). According to Baramichai et al., 55 information provided to decision makers is an important construct for creating an agile enterprise. Basically, the correctness of information flowing in supply chain is a must, then only the variation in demand along the supply chain can be reduced. Second, in order to enable quick decision making and data retrieval, good computer-based decision support software is essential. Matopoulos et al. 25 laid emphasis on selection of proper information and data sharing techniques and technologies and rightly so because if the technology is incompatible with system or if there is not enough expertise to handle the technology, the whole SCM initiatives can go waste. Reducing information delays as prescribed by Cucchiella and Gastaldi 56 is the last construct. They considered it as a source of internal uncertainty and advocated its reduction as a way to mitigate uncertainty in supply chain.
Logistics management
The constructs of logistics management are inventory strategy (0.94), lead time (0.91), pull scheduling and no finished products at OEM facility (0.90) and order management (0.89). Excess inventory is considered to be the biggest problem in supply chain. Many authors like Wong et al., 50 Fassoula 57 and Gunasekaran et al. 58 advocated its inclusion as a construct in their frameworks. Lead time reduction is another daunting task in front of supply chain managers around the world. Enterprises within a supply chain can cut their expected inventory costs, raise service level, reduce losses caused by shortages, gain quick-response capability and improve competitiveness by lead time reduction. 69 Towers and Burnes 59 included lead time as a construct in the composite framework for SCM and enterprise planning. Lead time reduction is often seen as an aid in reducing safety inventory and in transit inventory. Pull scheduling is a way to minimize buffer inventory which in turn leads to lesser holding costs in supply chain. This construct is present in BOSC framework given by Gunasekaran and Ngai. 26 Finally, order management is given as a construct in the framework of Xu et al., 54 which is a basic element of any logistic process and is thus inseparable from excellence pillars.
Supplier management
Supplier management is another important pillar of SCM excellence. The constructs of supplier management are selecting partners (0.89), managing confidentiality within the supply chain (0.88), supplier integration (0.88) and supplier process improvement (0.87). Matopoulos et al. 25 in their framework for supply chain collaboration advocated that selecting partners is important as selection is needed, based on the expectations, perceived benefits and drawbacks, and the “business fit” of companies. But in order to have good relationship with suppliers, one needs to maintain confidentiality within the supply chain. Melnyk et al. 60 also found out that managing confidentiality in supply chain is a matter of priority and must not be neglected. Lo and Yeung 61 explained the benefits of integrating internal operations with external operations (supplier operations). Also according to Monczka et al., 62 supplier integration improves quality through joint sharing of the supplier’s process capabilities and the buyer’s design specifications and shortens cycle time for new product development through the use of inter-organizational information system and actively participating in development activities. Finally, “supplier process improvement” is emphasized by Walton et al. 70 in the context of greening the supply chain. Presently, there is greater emphasis on environmental-friendly manufacturing practices, and thus, it is important that supplier should be made aware of the need of the hour and help them in improving their processes from the operational and environmental point of view.
Demand management
The constructs of demand management are demand variability (0.73), forecasting (0.72), demand patterns (0.71) and transit time requirements (0.70). It is notable that the first three constructs point toward enhancing predictability of demand in supply chain so as to synchronize demand and supply and hence reduce the inventory in supply chain. According to Wong et al., 50 demand variability refers to the day-to-day or week-to-week variability of demand faced by the manufacturers and the retailers. Levels of demand variability influence the choices of inventory policies and production strategies. Juttner et al. 24 later emphasized on forecasting to be an important construct in framework for demand chain management. Demand patterns are also very important aspect of demand management as without having an idea of the way demand is going to move along time horizon, supply chain planning is impaired. The demand management is strongly related to effective SCM, as this process can match supply with demand and execute the plan with minimal disruptions, increasing flexibility and reducing variability. 71 Vonderembse et al. 63 considered demand patterns to be necessarily taken into account while designing for a particular type of supply chain. Finally, “transit time requirements” stands as the fourth construct of this pillar of excellence. Stank and Goldsby 64 highlighted the significance of transit time requirements in demand management.
Collaboration management
This is the last pillar of SCM excellence that emerged from this study. The constructs of collaboration management are collaboration/alliances/collaborative network of firms/collaborative relationships (0.54), jointly established objectives (0.46), partnership based on core competencies (0.46) and collaboration depth (0.43). Several authors like Matopoulos et al., 25 Christopher and Peck, 46 Simatupang and Sridharan, 65 Defee and Stank, 66 Gunasekaran and Ngai 26 and Lin et al. 53 used collaboration as a construct in their respective frameworks. In collaboration supply chain, players join hands to achieve mutually agreed goals. The second construct is “jointly established objectives,” which is advocated by Tan et al. 67 They also emphasize on the equality of influencing power, between the customer and supplier, in making any decision that will affect the collaboration. This is to prevent forming a relationship of unequal power that could induce instrumental compliance instead of genuine cultural change based on shared believes/values. Gunasekaran and Ngai 26 emphasized on partnership based on core competencies to achieve flexibility and responsiveness in their supply chain. The last construct of collaboration management is “collaboration depth.” 25 They described it as a three-level approach, namely, strategic, tactical and operational, and is rather essential since companies rarely collaborate across all decision-taking levels. This distinction on strategic, tactical and operational, which has been very common in the supply chain literature, constitutes the “depth” of collaboration.72–74
Discussion and implications
This study focused on evaluating reliability and validity of SCM excellence framework in Indian manufacturing industry. The stage-wise analysis identifies a group of pillars for achieving SCM excellence in Indian manufacturing industry and highlights the important constructs in the process. A PCA of 301 constructs yielded nine major principal components. These nine principal components are referred as pillars (latent variables). The pillars were identified as strategic management, manufacturing management, marketing management, logistics management, integration, IT, supplier management, demand management and collaboration management. These pillars are the same as proposed by Soni and Kodali. 13
The empirical evidence suggests that firms do not regard financial factors such as coordination cost, activity-based costing, profit, stochastic cost, pricing and price fluctuations and cost reduction as the major part of SCM philosophy, or alternatively they are not considered as construct that lead to supply chain excellence. Although formulation of supply chain strategy is premised on efficiency and responsiveness frontier. Efficiency is an indicator of “low cost” in supply chain. Once the supply chain strategy is formulated, the essence of “low cost” gets imbibed in every decision taken in supply chain. Hence, when this framework is used, the basic essence of supply chain strategy is taken care of in every decision taken. It is reflected from the results as the factor loading for these items was lesser than 0.4. It basically demonstrates that managers may not view SCM excellence activities as providing strong economic advantages directly, but rather gives other intangible advantages which may finally bolster the financial indices. According to Randall and Farris, 17 supply chain collaboration leads to increased profit and improved competitive advantage. This also supports the view of supply chain managers that an excellence of collaboration which will elevate financial measures. Further Blackman et al. 75 have defined financial SCM as
The network of organizations and banks that coordinate the flow of money and financial transactions via financial processes and shared information systems in order to support and enable the flow of goods and services between trading partners in a product supply chain.
The above definition clarifies that finances in a supply chain are also driven by coordination and aided by information systems, which again establishes that the excellence in pillars of supply chain such as “Integration,”“IT” and “Collaboration” boost financial performance. Thus, it is not paradoxical for supply chain managers to not include financial measures in the constructs of SCM excellence.
Instead, managers focused on collaboration and related activities such as setting up a separate department for managing collaborations, establishing collaborative partnerships and building partnerships based on core competencies of members in supply chain. Although the factor loadings for the constructs of this pillar are not very high (lesser than 0.6), it does tell that collaboration is being taken seriously and is considered an enabler for achieving SCM excellence in Indian manufacturing industry. Furthermore, the reliability of collaboration management pillar could not be enhanced by deleting any of the items (maximum value of Cronbach’s alpha is 0.73), which in fact indicates the consensus of respondents on the constructs. Therefore, it depicts that manufacturing companies in India are aiming at long-term relationships and not just building business based on financial indices.
Another notable observation in internal consistency analysis for nine factors in Table 7 is that a large number of constructs were deleted from the strategic management pillar. The alpha value was not very high and it is believed that factors with lesser factor loadings are not as important for achieving SCM excellence as factors with higher factor loadings. After several iterations, Cronbach’s alpha value increased to 0.8. The average factor loading of 42 deleted items was 0.56, while that of 28 retained items was 0.76. These figures clearly support deletion of large number of items. However, some information is definitely lost in this practice but since the intention here is to establish pillars of SCM excellence, only vital constructs must be the part of final set of pillars.
In addition to collaboration management, manufacturing firms in Indian supply chains seem to have realized the importance of integration which definitely allows the firms to come out of their silos and start integrating their process with associated members in the supply chain. The use of ERP in the process seems to be picking up along with e-commerce activities such as e-procurement and order fulfillment. The final Cronbach’s alpha value for the pillar “integration” is very high as 0.91, and besides that the average factor loading for its constructs is 0.865, which is also pretty high.
IT and strategic management exhibited highest average factor loading of 0.945, which certainly indicates their importance in achieving SCM excellence. As far as reliability of these pillars is concerned, the alpha value of IT pillar is 0.91, which is very high in comparison to that of strategic management. It surely represents a consensus to a higher degree among respondents regarding constructs of IT, but on the flip side, the number of constructs is quiet higher in strategic management. Hence, very high reliability values are not expected either.
Another important observation is that none of the pillars have a construct which emphasizes on quality in supply chain. One of the possible reasons for the same could be that the firms have already realized the importance of quality for being competitive in the market, and hence, it is assumed over here that quality philosophy is inherent in the system. Also, evaluation and feedback and implementing improved solutions are the constructs of strategic management, which itself indicates the presence of quality management philosophy in this pillar of supply chain excellence and hence it need not be presented exclusively.
It is also imperative over here to question the absence of organizational management factors. If a deeper insight into the constructs of various pillar SCM excellence is given, then it is not very difficult to spot that several constructs such as board level responsibility and leadership, vertical disintegration of production, partner selection, managing confidentiality within the supply chain and emphasis on partnerships do represent key ingredients of organizational management as well.
Interrelationships between constructs of SCM excellence framework
In order to prescribe the proposed pillars and its constructs an SCM excellence framework, it is imperative that the interrelationships are hypothesized and later empirically validated.
Constructs of strategic management. The construct “manufacturing systems design (MF3)” is the major component of it as it governs the mechanism for conversion of raw material into finished product. The system then drives the “manufacturing process (MF1).” Now, as far as construct “vertical disintegration of production (MF2)” is concerned, it also seems to be dependent on the kind of manufacturing system design. If a system is to design a given process to be outsourced, it basically indicates dependency of MF2 on MF3. The construct “investment in technology (MF4)” is also a derivative of manufacturing system design, as the kind of technology to be used for production, which may be traditional or flexible, is decided on the basis of MF3. From preceding discussion, following statements can be hypothesized:
HMFI: “Manufacturing system design (MF3)” affects selection of “manufacturing process (MF1)” in a supply chain.
HMFII: “Manufacturing system design (MF1)” affects “investment in technology” in a supply chain.
HMFIII: “Manufacturing system design (MF3)” affects decision on “vertical disintegration of production (MF2)” in a supply chain.
HMFIV: “Manufacturing processes (MF1)” affects “vertical disintegration of production (MF2)” in a supply chain.
Constructs of marketing management. The construct “target market definition (MK1)” defines the conditions that prevail in the market where the manufactured product will be sold and can be perceived as a primary construct, which drives CRM (MK4), market analysis (MK2) and new product channel (MK3). CRM (MK4) decides the before sales and after sales services, thus affecting market analysis (MK2). These relationships can be summarized in the following hypotheses:
HMKI: “Target market definition (MK1)” affects “CRM (MK4).”
HMKII: “Target market definition (MK1)” affects “market analysis (MK2).”
HMKIII: “Target market definition (MK1)” affects “new product channel (MK3).”
HMKIV: “CRM (MK4)” affects “market analysis (MK2).”
Constructs of integration. In integration of supply chain members, “process integration (IN1)” using contracts, relationship agreements and protocols plays an important role. This role is highlighted as it may affect the role of “ERP (IN2)” by deciding on the degree of integration required and the modules of various functions required for integration. The IN1 construct also affects the degree of “e-procurement and e-order fulfillment (IN3)” to be deployed in financial transactions. Any changes in the integration process arising due to exceptions (IN4) are also affected by IN1. These relationships can be hypothesized as follows:
HINI: “Process integration (IN1)” affects “ERP (IN2).”
HIN2: “Process integration (IN2)” affects “e-procurement and e-order fulfillment (IN3).”
HIN3: “Process integration (IN2)” affects “exception handling (IN4).”
Constructs of IT. The construct “selecting information and data sharing techniques and technology (IT1)” is about the selection of a kind of data sharing technology that will enhance supply chain performance. The “information provided to decision makers (IT2)” will depend on IT1 for obvious reasons. While “reducing information delays” seems to be directly affected by IT1 and by accuracy of IT2. The selection of “computer-based decision support software system (IT4)” is dependent on the kind of technology being used for data transmission and availability of certain data sharing techniques. The eminent hypotheses from preceding discussion are as follows:
HITI: “Selecting information and data sharing techniques and technology (IT1)” affects “information provided to decision makers (IT2).”
HITII: “Selecting information and data sharing techniques and technology (IT1)” affects “reducing information delays (IT3).”
HITIII: “Selecting information and data sharing techniques and technology (IT1)” affects “computer-based decision support software system (IT4).”
HITIV: “Information provided to decision makers (IT2)” affects “reducing information delays (IT3).”
HITV: “Computer-based decision support software system (IT4)” affects “reducing information delays (IT3).”
Constructs of logistics management. The construct “inventory strategy (LM2)” basically indicates the inventory policy of manufacturing organization. It could be meant for lean, agile or any traditional system. The LM2 governs the “lead time (LM1)” depending on the buffer size and time to respond to purchase order. Based on LM2 only, the logistics manager decides upon the structuring of “order management (LM3)” process. The “pull scheduling and no finished products at the OEM facility (LM4)” is a result of special inventory strategy which basically advocates lean manufacturing and keeping just-in-time (JIT)-based inventory. It in fact also governs LM3. The order management process is also dependent on the size of lead time. The hypotheses emanating from this discussion are as follows:
HLMI: “Inventory strategy (LM2)” affects “lead time (LM1)” in supply chain.
HLMII: “Inventory strategy (LM2)” affects “order management (LM3)” in a supply chain.
HLMIII: “Inventory strategy (LM2)” affects “pull scheduling and no finished products at the OEM facility (LM4)” in a supply chain.
HLMIV: “Lead time (LM1)” affects “order management (LM3)” in a supply chain.
HLMV: “Pull scheduling and no finished products at the OEM facility (LM4)” affects “order management (LM3)” in a supply chain.
Constructs of supplier management. The primary activity of supplier management process is “selecting partners (SM1)” first, which basically implies selecting supplier that acts as a partner in SCM process. In order to carry out sourcing in a synchronized manner, one needs to perform “supplier integration (SM3).” The SM3 construct is dependent on selected suppliers and their ability, that is, SM1. The “supplier performance improvement (SM4)” may also be a dependent construct on the selected supplier and the philosophy (like contract) deriving the relationship. Together, SM3 and SM4 affect the “managing confidentiality within the supply chain (SM2).” Higher degree of integration with appropriate protocol procedures will ensure that the information being shared between the supplier and manufacturing firm remain confidential. From the discussion, the relationships among the constructs can be hypothesized in the following manner:
HSMI: “Selecting partners (SM1)” affects “supplier integration (SM3)” in a supply chain.
HSMII: “Selecting partners (SM1)” affects “supplier process improvement (SM4)” in a supply chain.
HSMIII: “Supplier integration (SM3)” affects “managing confidentiality within supply chain (SM2).”
Constructs of demand management. The construct of “demand pattern (DM2)” recognition is elementary to the demand management pillar. After tracing the demand pattern, the “demand variability (DM1)” needs to be incorporated in the forecasting data. The “transit time requirements (DM4)” are also influenced by the patterns that govern the demand since the requirements are a function of time-based quantity. The process of “forecasting (DM3)” is dependent on DM1 and DM2, as it derives the data for forecasting from these constructs only. The resulting hypotheses are as follows:
HDMI: “Demand patterns (DM2)” affects “demand variability (DM1)” in a supply chain.
HDMII: “Demand patterns (DM2)” affects “transit time requirements (DM4)” in a supply chain.
HDMIII: “Demand variability (DM1)” affects “forecasting (DM3)” process in a supply chain.
HDMIV: “Demand patterns (DM2)” affects “transit time requirements (DM4)” in a supply chain.
Constructs of collaboration management. It is imperative that collaboration management exists because of formation of “jointly established objectives (CM1)” between players in a supply at vertical and horizontal levels. The construct “collaborative relationships (CM2)” is directly affected by the objectives of collaboration, that is, CM1, because it is these objectives that define the role to be played by players involved in the collaborative alliance. The “partnerships based on core competencies (CM4)” may also have direct impact of CM1, as the objectives of collaboration only manifest itself into the creation of partnerships so as to utilize each other’s core competencies and gain advantage in market. The “depth of collaboration (CM3)” may get direct influence of “collaborative relationships (CM2)” and “partnerships based on core competencies (CM4),” as depth of collaboration indicates to what extent the collaborative relationships span across and inside the supply chain processes. While the core competencies may also exist in various functions of an organization, thus affecting the collaboration depth. These relationships can be hypothesized as follows:
HCMI: “Jointly established objectives (CM1)” affects “collaborative relationships (CM2).”
HCMII: “Jointly established objectives (CM1)” affects “partnerships based on core competencies (CM4).”
HCMIII: “Collaborative relationships (CM2)” affects “collaboration depth (CM3).”
HCMIV: “Partnerships based on core competencies (CM4)” affects “collaboration depth (CM3).”
Implications
The managerial implications of this study are mainly meant for strategic level. The majority of companies in India are new on supply chain initiatives. This article thus gives managers an insight into the pillars of SCM excellence and what constitutes these pillars of excellence. The nine pillars also span all the areas of business right from logistics to collaboration. Indian managers can use these pillars within a framework to achieve SCM excellence. The advantage of the study is that the nine pillars are empirically derived from Indian manufacturing sector. By using the factor loadings on each of the constructs of SCM excellence, a manufacturing firm in a supply chain could determine its score on each of the pillar, as well as its score for the overall supply chain excellence. The factor loadings are the mean responses for the items within each factor, and the overall score is the average of all the factor loadings/scores. In this manner, practitioners can have an evaluation criterion for assessing their supply chain.
On the other hand, the research implications of the study are far reaching as it has already been highlighted earlier that huge literature on SCM lacks standardization. These pillars of SCM excellence can be used as standard or as coherent set of constructs for future research purposes as these pillars are derived from extant literature.
In a nutshell, the proposed framework of SCM excellence gives the following benefits to practitioners and researchers:
It helps in educating an enterprise about the critical areas of improvement in a supply chain.
It gives a converged view on plethora of SCM frameworks in industry and academia.
It gives a directive toward organizing the collective efforts toward improvement projects in a supply chain.
It also aids in doing a competitive analysis to define new business opportunity by providing platform of performance measurement for supply chains.
It gives an opportunity to companies for aligning strategy, material flow, work flow and information flow to focus on bottlenecks in a supply chain.
By describing directional relationships between constructs of each pillar, it delivers a diagnostic tool for supply chain managers.
Conclusion
This article started with an aim to fill the research gap that existed as a result of deficiency in coherency of constructs in SCM and second to find out the pillars of SCM excellence in Indian manufacturing industry. A survey was conducted in Indian manufacturing sector that contained the constructs taken from the literature as observed variables. The output of the survey was subjected to PCA, and a set of nine main pillars of SCM excellence emerged. These nine pillars initially exhibited 204 constructs. Later, when the reliability of each pillar was maximized, the number of constructs reduced to 133. The final Cronbach’s alpha values for these nine pillars ranged from 0.71 to 0.94, which is considered to be a good indicator of reliability of the scales. Later, the construct validity of these pillars was examined by using CFA, and goodness of fit of the model was achieved in a 36-factor model after several model respecifications. Finally, the convergent and discriminant validity was also examined to establish the SCM excellence framework in Indian industry. In this examination, each variable exhibited statistically significant loadings that supported the convergent validity, and the AVEs were found to be greater than inter-construct squared correlations which confirmed the discriminant validity.
The outcome of this study gave rise to set of constructs that can be considered to be in consensus with academia and industry. These constructs have support of academia as they are derived from extant SCM frameworks in peer-reviewed academic journals, and on the other hand, the response on these constructs is taken from Indian manufacturing sector, which presents the opinion of industry.
There are, however, several limitations to the study as well. First, only 57 frameworks have been considered which are taken from specific publications. The number of publications on SCM is very high, but due to limitations of the time frame of the study, only four major management science publications were considered. The considered frameworks are up to year 2008 as the framework is based on the sample taken in Soni and Kodali, 13 thus this study can later be converted into a longitudinal study and the changes in manufacturing industry can be traced over a period of 5 years. Second, the size of the questionnaire was large, which gives boredom to the respondent. However, all the necessary precautions were taken and many respondents were guided through the questionnaire but still there can be a little bit of subjectivity in their responses. Third, while checking construct validity, the structural equation model used for fitting the data was of one level only. Finally, this study confined to manufacturing sector alone. Thus, in future, similar studies can be carried out, for example, in service sector. Furthermore, a more rigorous SEM modeling can be performed to find out multilevel models as well.
Further research
A longitudinal study will be conducted to examine the differences in constructs of SCM excellence pillars across several periods. Such study will facilitate evolution of causal linkages among various constructs with the passage of time. However, there are some issues in its implementation, such as maintaining response rate and getting responses from same respondents. These will be handled by contacting the prior respondents to make them aware about follow-up study. Second, a letter or email briefing about the objective of the successive study will be posted. The results of such cross-sectional survey could also yield discontinued practices for achieving SCM excellence, and probably, the reasons for their discontinuance can also be traced back. From statistical point of view, such study will maximize the scale reliability and validity over a longer term.
Footnotes
Appendix 1
Acknowledgements
An excerpt of the questionnaire is given in Appendix 1. However, complete questionnaire can be obtained on request by sending an e-mail to authors of this article.
Declaration of conflicting interest
The authors declare that there is no conflict of interest.
Funding
This research received no specific grant from any funding agency in the public, commercial, or not-for-profit sectors.