
Abstract
Elastic–plastic finite element analyses were carried out to sort out the influential factors on the dimensional precision of cold-drawn stainless steel seamless tube for energy industry. Good agreement was obtained between the predicted dimensions and the measured dimensions of tube after drawing experiment for validity check. Geometrical parameters of tools and geometry of parent tube have little influence on the geometrical precision of finished tube. Most influential factor on the geometrical precision of drawn tube is the temperature of tools. Observation and measurement on a production line showed that the temperature of tools increases according to the increase in the number of drawn tubes. Increase in the temperature of tool leads to the change in the geometry of drawn tube. A methodology for evaluating the thermal expansion of tools is shown to take it into consideration the designing procedure of cold-drawing process by using finite element analysis.
Introduction
Because of the high reliability in strength of seamless tubes in field operation for energy field, the level of requirements from the market to seamless tube manufacturers has been increasingly high in many aspects. High dimensional precision of cold-finished tubes is one of these requirements.
At present, the dimensional precisions of outside and inside diameters and wall thickness of cold-finished tubes are required to fall within a tolerance range of 0.10 mm or at largest 0.15 mm. The range of outside diameter of tubes lies between a few ten millimeters and a few hundred millimeters, and compared to the value of outside diameter of products, the range of tolerance of 0.10 mm is very narrow. There are two major cold manufacturing processes which ensure high dimensional precision: cold-drawing process using a die and a plug and cold-pilgering process. 1 The features of these two processes are totally different from each other, and manufacturers are required to select one depending upon their own purpose. It is often the case that the former is selected because of the lower investment cost, simplicity in operation, and high manufacturing speed.
Although cold-drawing process ensures high dimensional precision, one often faces the fact in field operation that the dimensions of some cold-drawn tubes are inevitably and largely different, but within the tolerance range, from the target values. Especially, if the dimensions are carefully observed in a long time span, one finds that the dimensions change even under the condition that the wear of tool is negligibly small. In order to clarify the cause of this deviation in dimensions, numerical analysis was carried out. One of the purposes of this work is to show that a very simple, and slightly old-fashioned, simulation can well explain the phenomena related to cold drawing of stainless tube, and it is very powerful, if we carefully select the parameters, in finding the operational conditions for minimizing the fluctuation of dimensions of drawn tube. The result gives evidence that this approach without high sophistication of modeling is useful for real operation.
The first purpose of numerical analysis in this work is to examine whether the inside and outside diameters of cold-drawn tube exactly meet the plug diameter and inside diameter of die and to evaluate quantitatively the difference if there is a possibility of difference. The second purpose of numerical analysis is to inspect whether there is a possibility of the changes in tool diameter, that is, the change in inside diameter of die and the change in plug diameter. Therefore, the first important point to clarify in the observation in field operation is whether the dimensions of cold-drawn tubes are different from the dimensions of tools. If there is a discrepancy between the drawn tube and tool dimensions, residual stress might be one of major causes. There are some articles on the effects of tool geometry or pass design on residual stress of drawn bar 2 or drawn tube; 3 however, the issue of slight change in final dimensions is not considered here. In other previous studies on tube sinking process by cold press, that is, outside diameter reduction by die without plug,4,5 slight deformation in the exit of die is discussed. However, elastic deformation of tools and difference between tool and tube dimension are not paid attention to in these research works. The second important point to clarify in the observation in field operation is whether the dimensions of cold-drawn tubes are different according to time.
The purpose of online observation on the production line is to sort out the phenomenon according to time to specify the cause of the deviation in dimensions, that is, investigating whether there is a deviation in dimensions of cold-drawn tube according to the increase in the number of cold-drawn tubes. After a considerable number of drawings, the tools are taken out of the production line to be subjected to measurement in dimensions.
If the amount of wear is negligibly small, it is highly suspected that the deviation in dimensions of drawn tubes may be caused by the increase in tool dimensions due to the increase in temperature. The causes of the increase in tool temperature are as follows: (1) the heat flow to the tool from the cold-drawn tube, in which heat is generated due to plastic metal working, and (2) the heat generated on the contact surfaces of tube and tools due to friction work.
In order to check the validity of this assumption on the cause of deviation in dimensions according to time, an additional experiment is carried out on the production line to measure the tool temperature. The result may clearly show that there is a good correlation between the increase in tool temperature and the change in tube dimensions. Finally, a method is proposed on the precise control of the dimensions of cold-drawn tubes.
Numerical analysis
The outline of cold-drawing process of tube is illustrated in Figure 1. The die consists of a tip and a case, and the inside surface of tip contacts the outside surface of tube directly, and the case holds the tip on the outside. Both the plug and the die tip for cold drawing are made of tungsten carbide (WC).
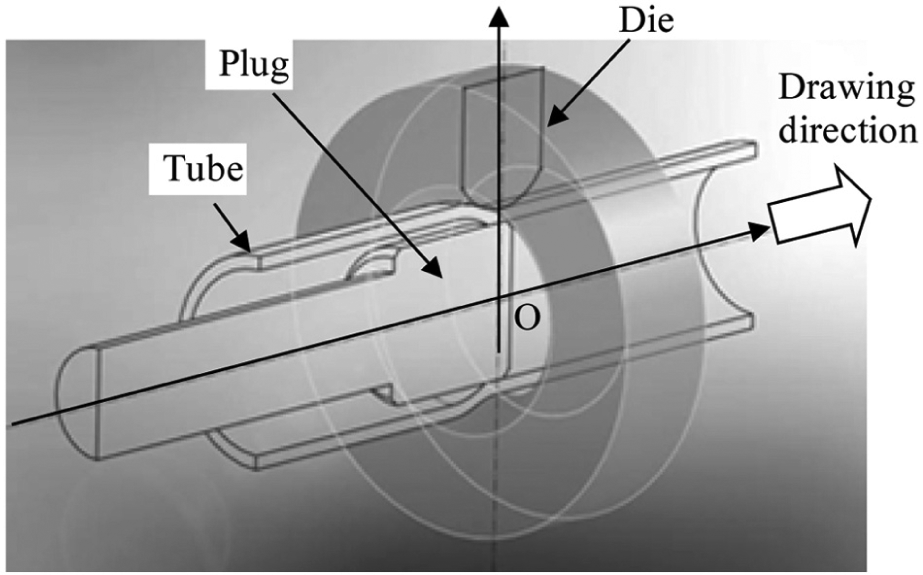
Schematic illustration of cold-drawing process in tube manufacturing line.
The code used for the analysis was ELFEN, which has been developed at University of Wales, Swansea. 6 Axisymmetric elastic–plastic analysis was carried out using four-noded isoparametric quadrilateral element. 7 The simulation is based upon the updated Lagrangian formulation, and the material was assumed to be elastic–plastic to follow the von Mises yield criterion and Prandtl–Reuss equation. The procedure of analysis is illustrated in Figure 2. Displacement was applied on the head end of tube to allow the mother tube move along the pass line and go through the gap lying between the die tip and the plug. On the final stage, the tail end of the tube comes out of tools.
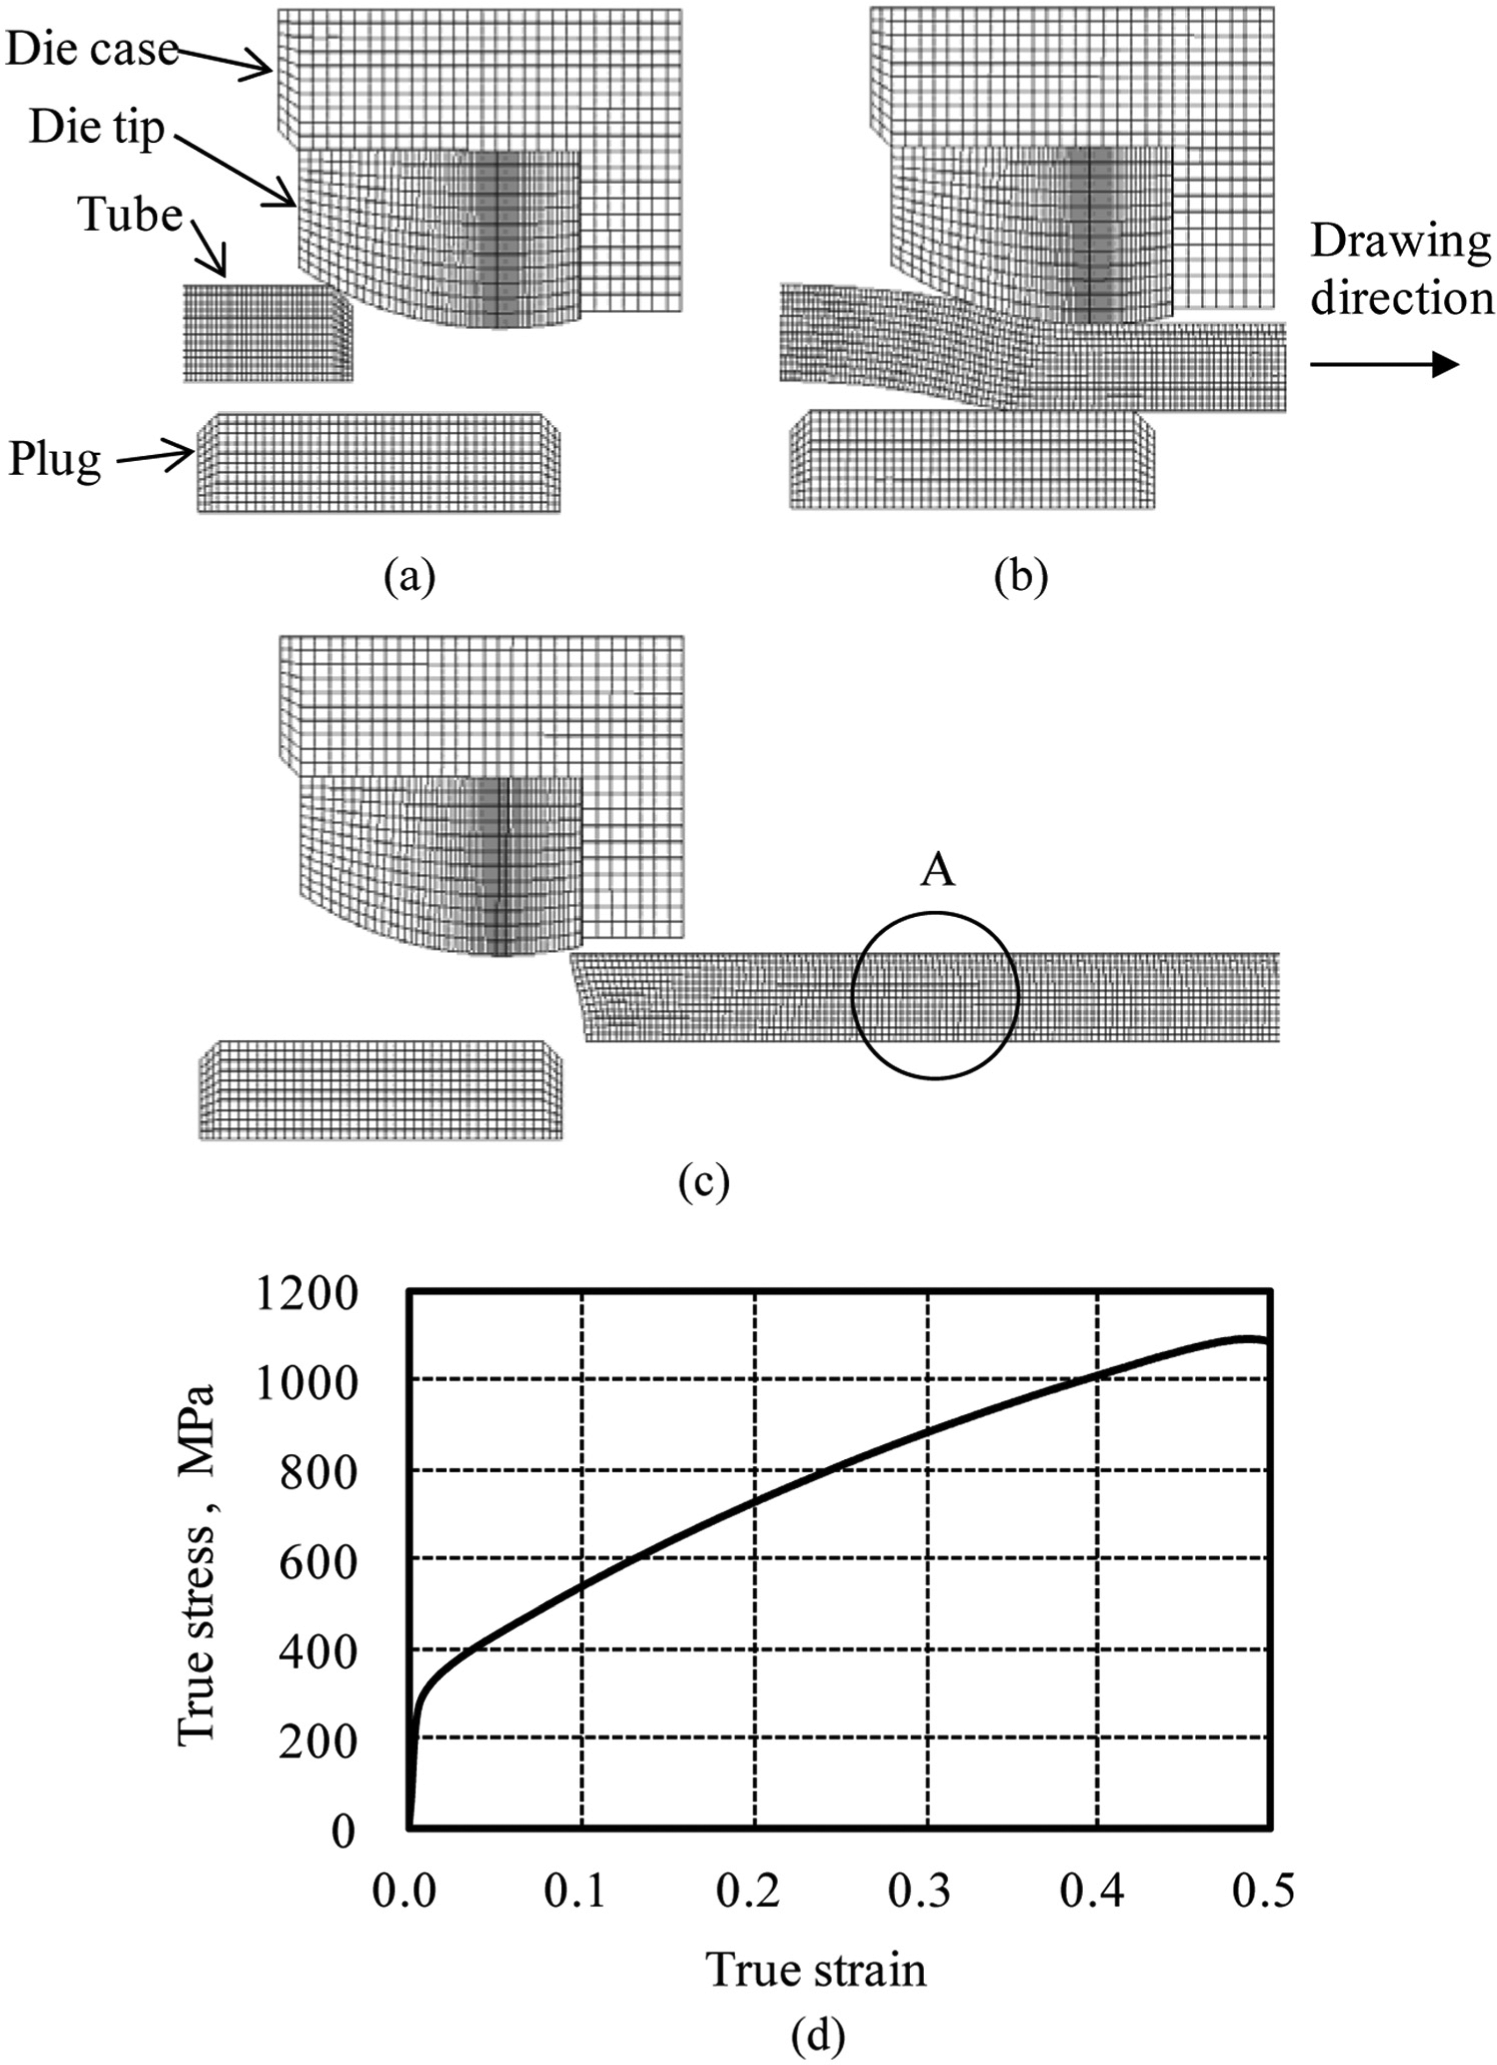
Conditions for FEA: (a) start of drawing, (b) in the mid of drawing, (c) end of drawing, and (d) stress–strain diagram of parent material.
Dimensions of tube were evaluated after the completion of cold-drawing operation in the cross section “A” shown in Figure 2(c) because the dimensions of tube under cold-drawing operation must be slightly different from those after cold drawing due to the tension force exerting on the tube on the exit side.
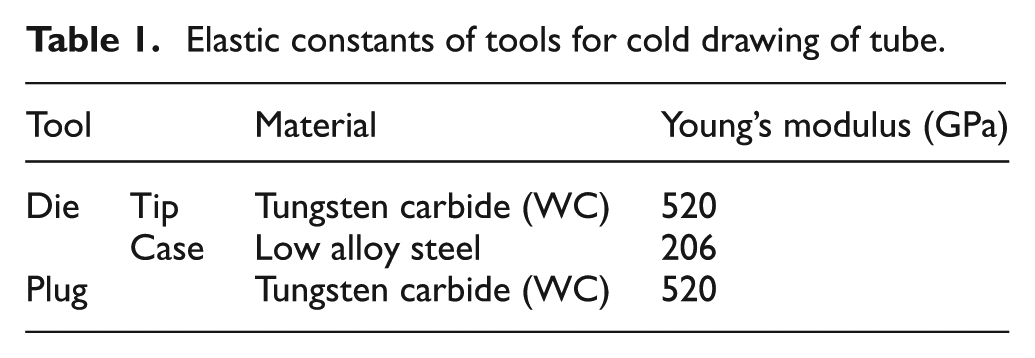
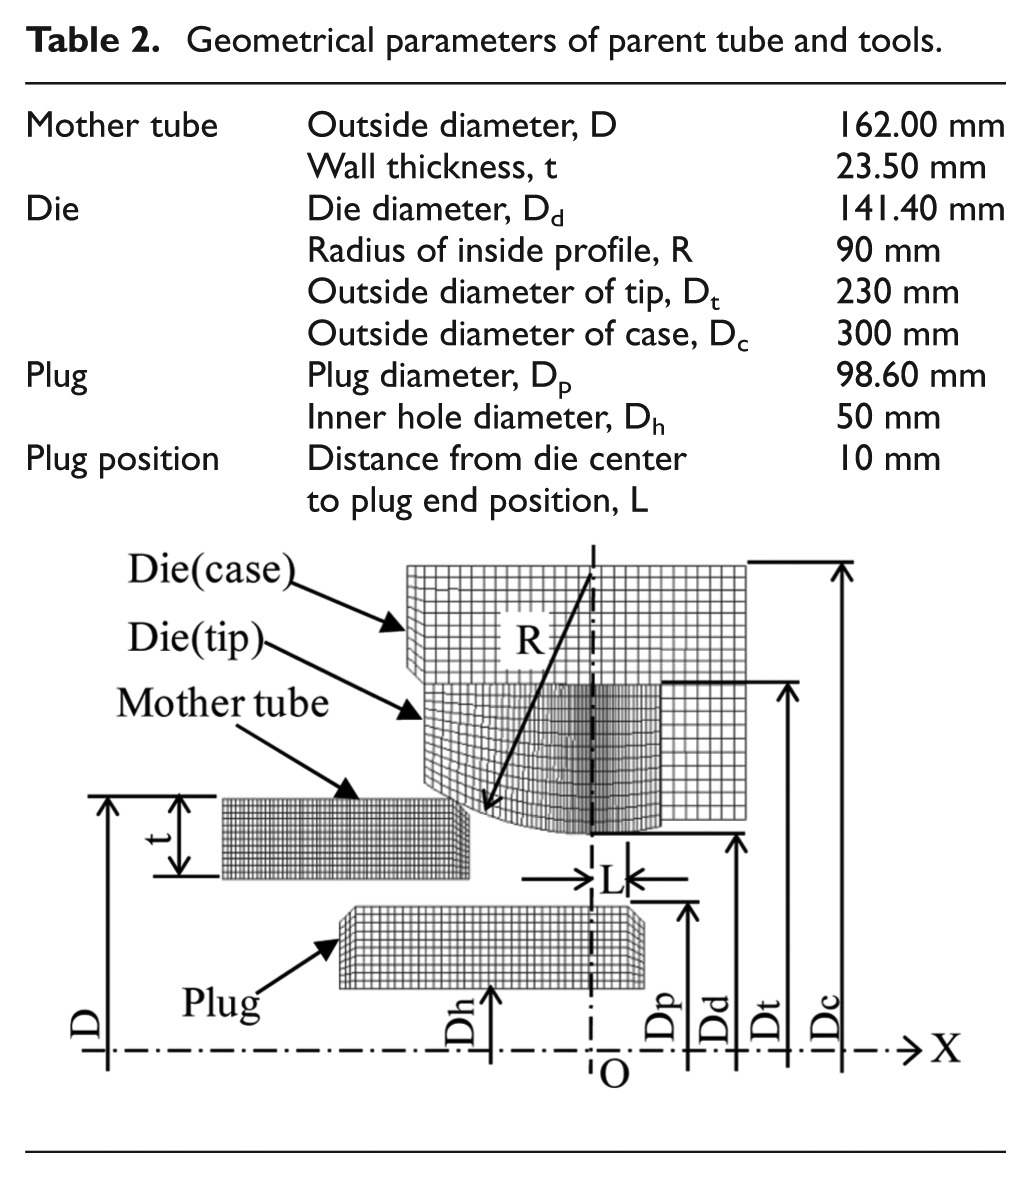
The material adopted for this study was a stainless steel of austenitic phase. The parent tube for cold drawing was subjected to thermal treatment for stress relief, and a solid specimen with a round cross section of 2.5 mm in diameter and 8 mm in gauge length was sectioned from it. The stress–strain curve of the parent material obtained after tension test is illustrated in Figure 2(d), which is applied for the numerical analysis, and isotropic work-hardening rule is adopted. The specimen was subjected to tension test under the condition that the cross head speed was 0.1 mm in 60 s. Because the speed of cold drawing is not very high and it is stable most of the time, this stress–strain curve may represent the average mechanical property of the material throughout drawing. The values of Young’s modulus and Poisson’s ratio of the parent tube material adopted for the analysis were 205 GPa and 0.3, respectively. Tools were assumed to be elastic bodies, and only the tube was assumed to be elastic–plastic. The elastic constants of tools are given in Table 1. The parameters of parent tube dimensions, geometrical parameters of tools, and the alignment and position of tools are shown in Table 2. The values of these parameters lie within the normal range in usual field operation. Usually, either R-die or a taper die is adopted for cold drawing, but in this study, R-die is adopted because it has been most commonly used in cold tube drawing, whereas taper die has been used in cold bar drawing.
Elastic constants of tools for cold drawing of tube.
Geometrical parameters of parent tube and tools.
Following the conventional manner in steel manufacturing process, Coulomb friction rule was adopted in the numerical analysis. The coefficient of friction working between the stainless tube and tools was determined by referring to the methodology of previous works on cold metal working such as tube extrusion, 8 cold bar drawing, 9 and cold sheet forming. 10 The materials in the previous studies were carbon steels and were not austenitic stainless steels. Therefore, an experiment was carried out by using stainless steel, tool with tungsten carbide, and mineral oil for lubrication that has been adopted on the production line specifically for stainless steel for many years. Using tubes sampled from the production line, drawing experiment was carried out. Drawing speed was 3 m/min. Drawing force was measured, and the value was compared with the predicted drawing force by numerical simulation. Elastic–plastic numerical simulation by ELFEN 6 was repeated by changing the coefficient of friction until the predicted drawing force met the measured drawing force. The influence of strain rate was neglected. The total number of drawing for this purpose was 10. The result showed that the coefficient of friction should fall within the range of 0.049–0.052. In the following simulation, 0.05 is adopted.
Results
A typical example of stress distribution and deformation of tube under cold drawing is given in Figure 3. The illustration in Figure 3(a) is the distribution pattern of axial stress, and the graph indicates the patterns of axial stresses on the external and internal surfaces of tube. The origin shown in Figure 3(a), where X = 0, coincides with the end point of the approach portion of the die. It is important to note that there is a changing pattern of axial stress not only in the bite but also in the portions before and after the working portion.
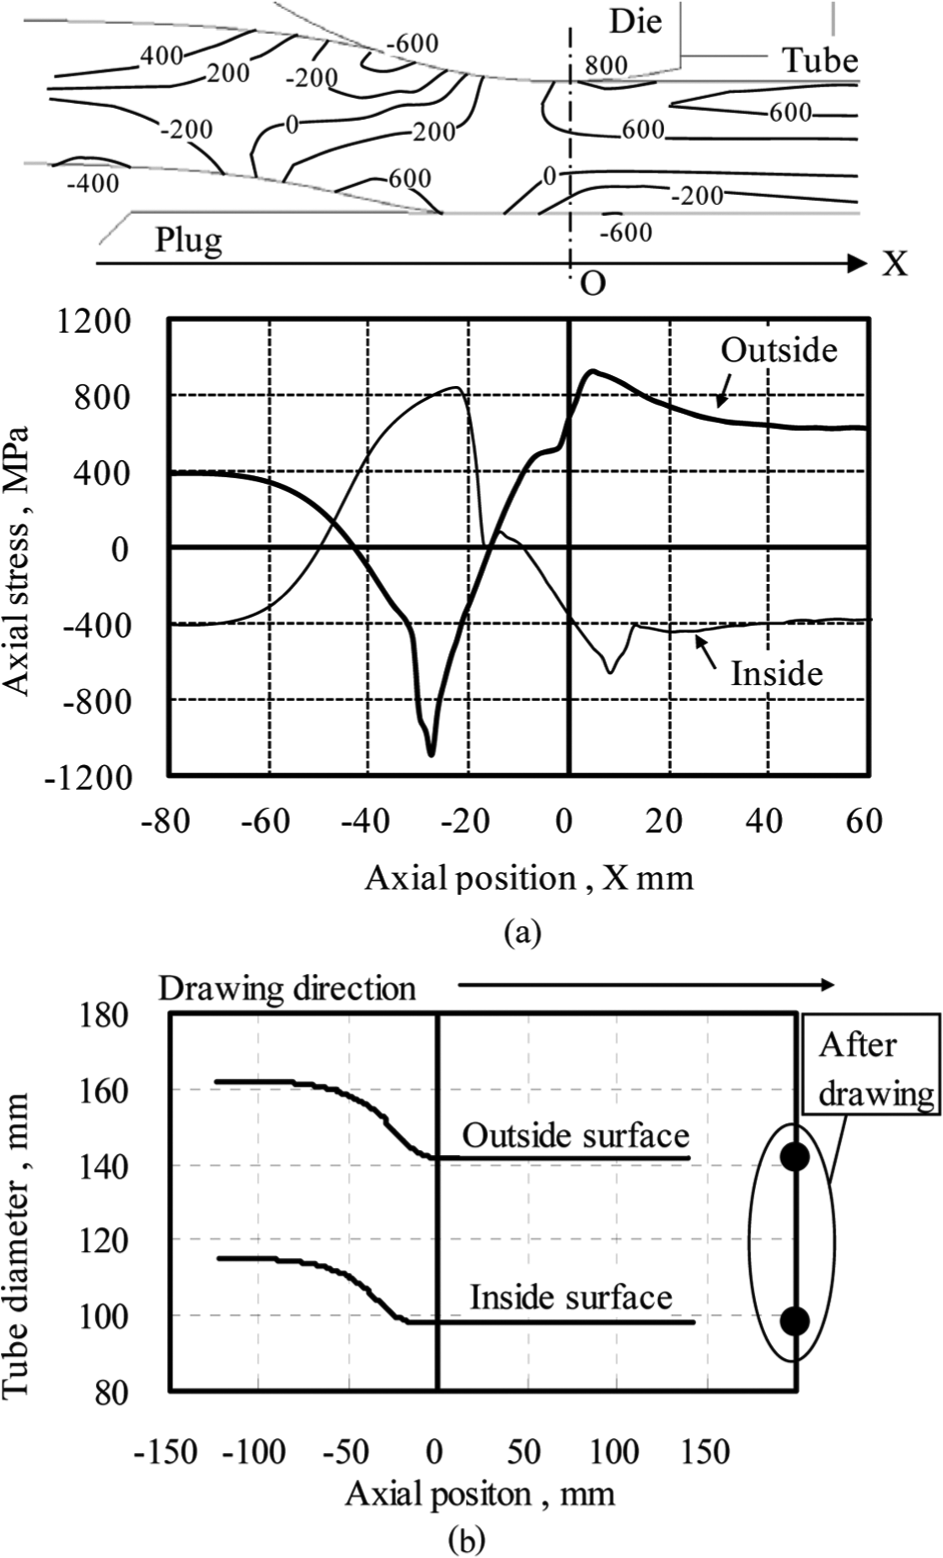
Example of stress distribution and deformation of tube under cold drawing: (a) distribution of axial stress in tube during cold drawing and (b) changes of outside and inside diameters of tube in the axial direction.
Transition of axial stress state in the vicinity of outside surface of tube illustrated in Figure 3(a) can be explained as follows. The axial profile of the outside surface of parent tube is a straight line, but in the vicinity of the inlet, it is bent to form a convex curve toward the outside to realize a smooth contact on the die surface. As a result, tensile stress exerts in the axial direction in the vicinity of tube outside surface. Once the outside surface contacts the die surface, it follows the die surface to form a concave geometry toward the outside. Namely, the tube is bent back and the state of axial stress changes from tension to compression in the vicinity of outside surface. On the final stage of drawing, the tube is again bent back to form a straight line in the axial direction on the outlet side of the die. The axial stress state changes again to tension. Similar but opposite mechanism applies on the transition of the state of axial stress in the vicinity of inside surface.
It is interesting to note that the distribution of axial stress gradually changes on the outlet side after the tube leaves the tool. It is easy to understand that the pattern of stress distribution, especially the pattern on the exit side, may directly influence the dimensional precision of cold-drawn tube. The change in dimensional precision of tube was analyzed in accordance with the progress of drawing. Figure 3(b) shows the changes of outside and inside diameters of tube in the axial direction. The dots on the right side indicate the outside and inside diameters of tube after the completion of drawing, that is, after the external force is removed. It seems that the outside and inside diameters meet the inside diameter of die and the diameter of plug, respectively.
However, close-up view gives a slightly different result. Figure 4 shows the changing patterns of outside and inside diameters in the vicinity of the bite. The inside surface starts to contact the plug at point “a,” and the inside surface of tube leaves the plug at point “c.” Point “b” is the terminal point of the approach portion of the die. Prior to point “a,” the inside diameter of tube is reduced according to the reduction of outside diameter by the die. In between points “a” and “c,” the inside surface of tube is in contact with the plug surface. It is found that the plug elastically changes to reduce its diameter in the axial direction due to the traction being exerted by the inside surface of tube. The inside diameter of tube is the same as the plug diameter because these surfaces are contacting each other, and the inside diameter of tube changes in the axial direction in the same manner as the plug diameter. The working diameter of plug is about 0.10 or 0.15 mm smaller than the original diameter, and this difference influences the dimensional precision of cold-drawn tube.
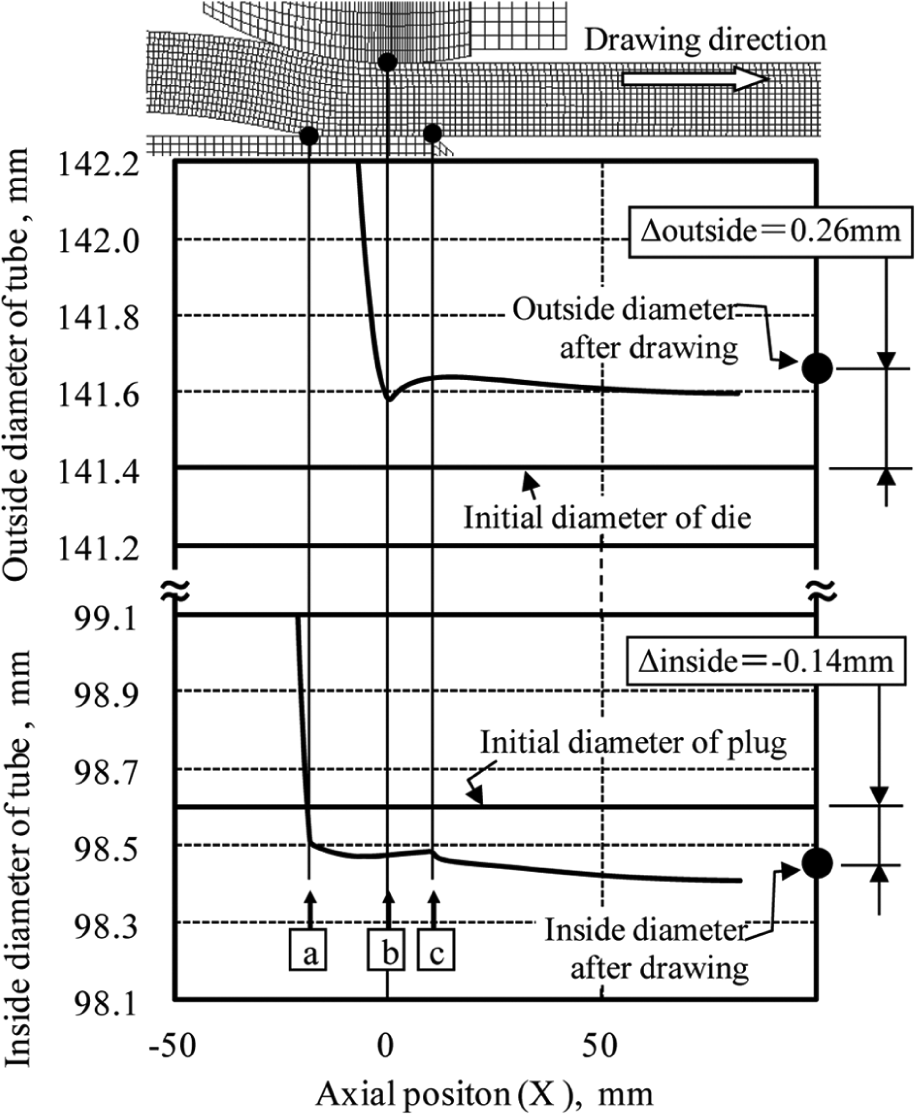
Changing patterns of outside and inside diameters in the vicinity of the bite.
The outside diameter of tube is first reduced by the approach portion of die to reach the minimum value at point “b.” It is found that the inside diameter of die is 0.19 mm larger than the initial value due to the elastic deformation of the die. After the tube passes through point “b,” the traction on the outside surface disappears and the outside diameter of tube slightly recovers.
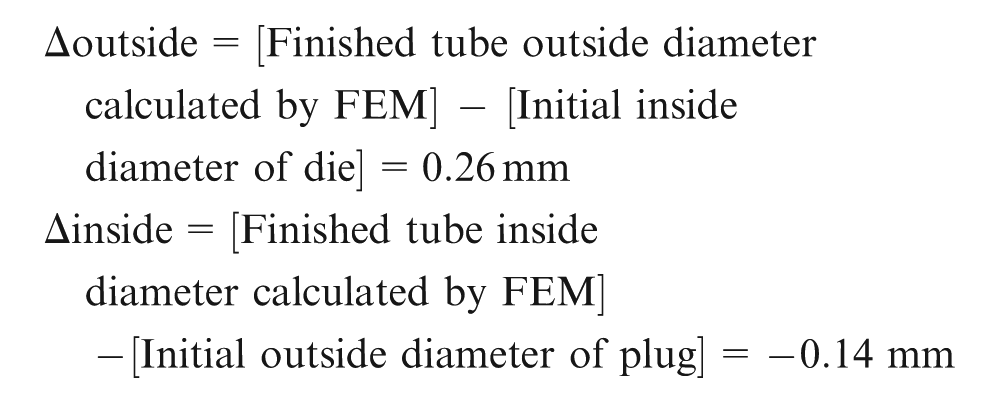
This change in the traction on the outside surface also leads to a reduction in the contact stress on the plug surface, and the diameter of plug recovers slightly after point “b.” As a result, the outside and inside diameters of tube increase after point “b.” After point “c,” the tensile force exerting on the head end of tube is the only external force to the tube, and the outside and inside diameters gradually reduce within the axial distance of 80 mm. As soon as the drawing operation is completed, the axial force disappears and the tube shrinks in the axial direction and both the outside and inside diameters increase by the elastic recovery. The dots on the right side in Figure 4 indicate the final values of these geometrical parameters. In the present case, the finished outside diameter of tube is larger by 0.26 mm and the finished inside diameter of tube is smaller by 0.14 mm than the original diameters of tools. These differences between initial tool diameter and finished diameter of tube were represented as follows
If the tools are assumed rigid in the analysis, Δoutside = 0.11 mm, and the experiment will provide the answer to the assumption that the tools are elastic.
Experiment
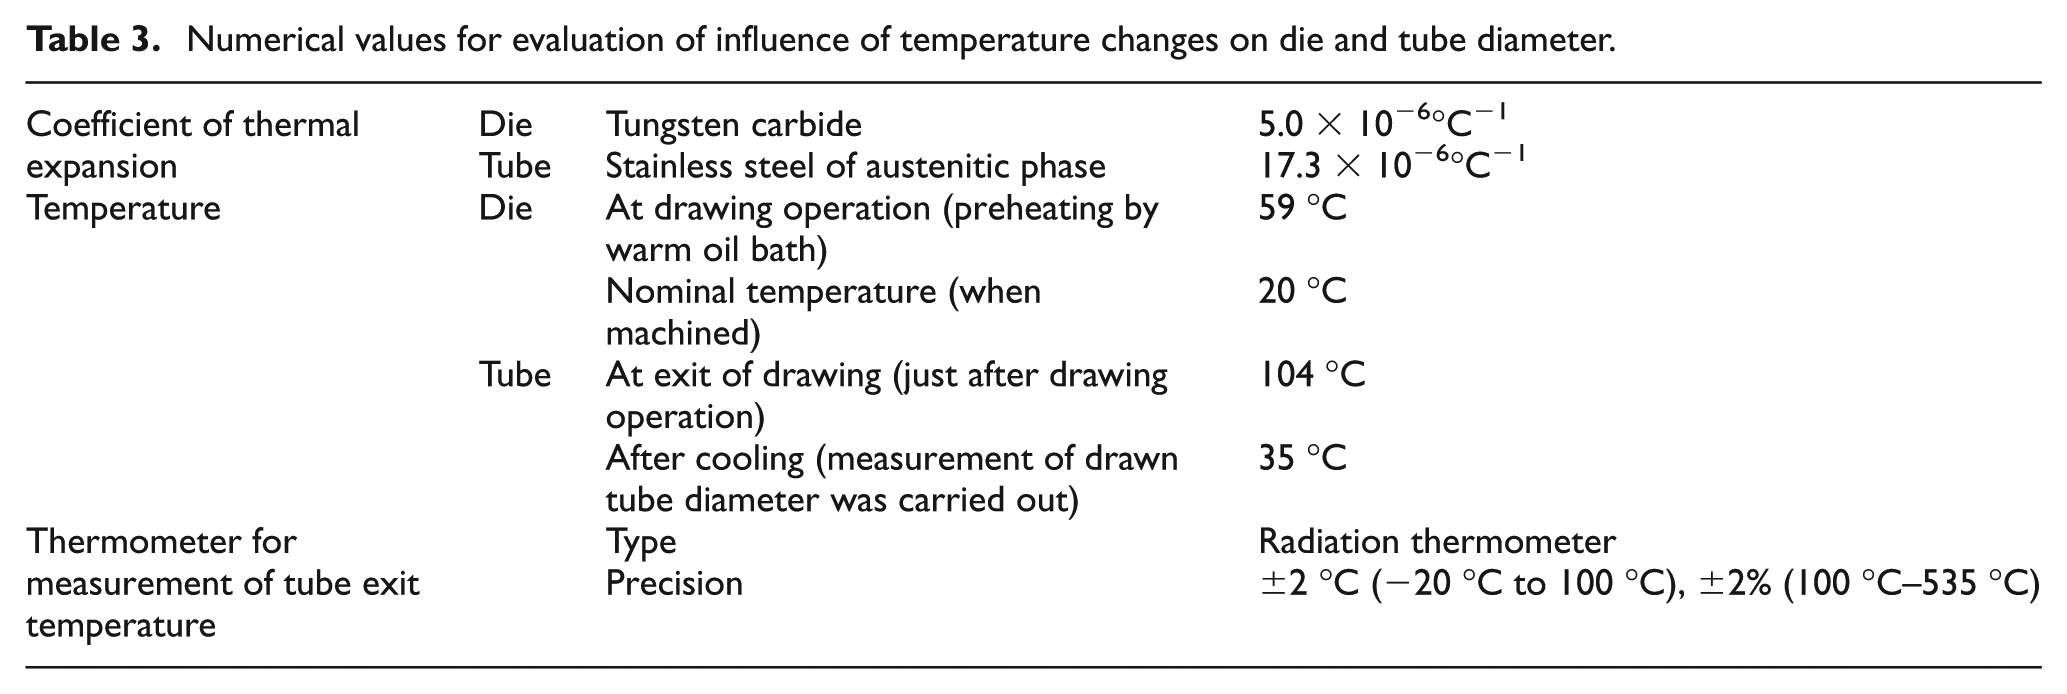
In order to validate the results of numerical analysis, cold-drawing experiment was carried out under the room temperature of 35 °C by using a tube drawn under the same condition given in Table 2, and the dimensions of finished tube and die were measured. The drawing speed was 10 m/min. Prior to the drawing operation, the die was warmed up by dipping it in a sink filled with oil of temperature 59 °C for 1200 s as it is often treated in field operation. In the experiment, the temperatures of tube were measured in order to compensate the change in dimensions due to the change in temperature that is inevitably caused by heat generation by plastic deformation and friction work on the contact surface. The measurement was carried out on the outside surface during the drawing operation immediately after the die by using a radiation thermometer. The values of coefficients, the temperatures of tube and die, and the characteristics of thermometer are listed in Table 3. The measured temperature of tube outside surface was 104 °C.
Numerical values for evaluation of influence of temperature changes on die and tube diameter.
The outside diameter of drawn tube and the inside diameter of die were measured after the tube and the die were completely cooled down to the room temperature. The inside diameter of die was exactly the same as the original value, and the outside diameter of tube was larger by 0.10 mm than the inside diameter of die.
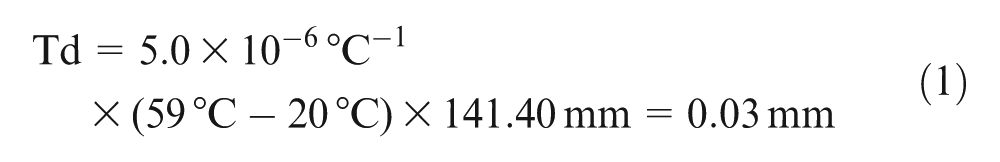
The change in diameter due to the change in temperature can be calculated by multiplying the coefficient of thermal expansion of WC, increase in temperature, and the original value of the inside diameter of die. Due to the preheating operation, the die temperature was 59 °C, and the increase in the inside diameter of die Td is calculated by multiplying coefficient of thermal expansion of tungsten carbide, increase in die temperature, and the original value of inside diameter of the die, as given by equation (1)
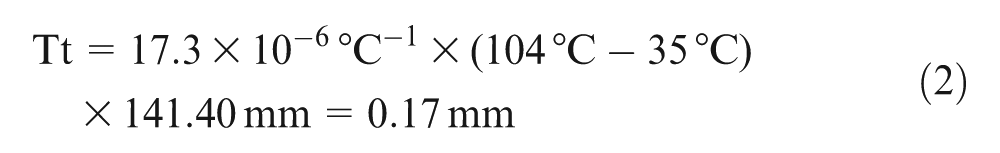
The shrinkage of tube Tt due to cooling after drawing from 104 °C to 35 °C is estimated in the similar manner by multiplying the thermal expansion ratio of stainless steel, decrease in temperature, and the aimed tube outside diameter, as given by equation (2)
In the numerical analysis, the inside diameter of die was 141.4 mm, and the measured outside diameter of tube after cooling may be smaller than the predicted value by finite element method (FEM), and the difference Δ is calculated by subtracting the result of equation (1) from the result of equation (2), as given by equation (3)

As it is predicted by numerical analysis, the outside diameter of drawn tube after cooling is larger by 0.26 mm than the initial inside diameter of die. Therefore, the final difference δ is estimated by equation (4)

The difference between the measured outside diameter of drawn tube after complete cooling and the original value of inside diameter of die was 0.10 mm, and this value is almost the same as the value δ predicted by equation (4), as shown in Figure 5. This may be a good agreement. This result supports the assumption that the tools are elastic bodies because the result of numerical analysis showed that the difference was 0.26 mm when they were elastic, whereas it was 0.11 mm when they were rigid.
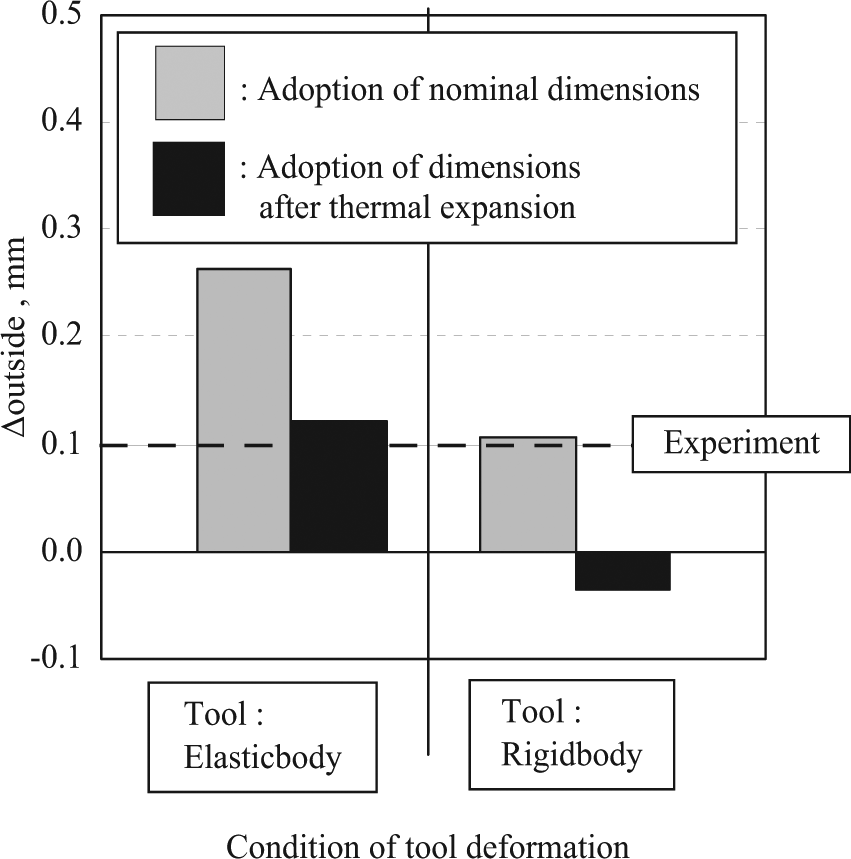
Comparison on prediction of outside diameter of drawn tube between elastic model and rigid model.
It may be concluded that elastic–plastic finite element analysis is a powerful tool for production design, and the key to the dimensional precision of product is the control of the dimensional precision of tools.
Discussions
In the previous part of this research work, analysis was carried out on a set of average values of dimensions of parent tube and tools. In the field operation, however, these parameters change within the range of tolerance and it leads to the change in the dimensional precision of the final product. Therefore, it is of important to evaluate numerically the influences of major parameters on the dimensional deviation of final product.
Influence of dimensions of parent tube
Usually, the parent tube of stainless steel tube is manufactured by hot extrusion. The tolerance values of outside diameter of hot-extruded tube normally lie within the range of ±0.5 mm for tubes, the dimensions of which are similar to the values given in Table 2. Finite element analysis was carried out taking into consideration the change in outside diameter within the range. The result is shown in Table 4. There is no remarkable influence of these parameters on the dimensional precision of final product, and the influence of deviation in parent tube dimensions may be negligibly small as long as the dimensions lie within the tolerance ranges.
Influence of change in diameter of parent tube on diameter of drawn tube.
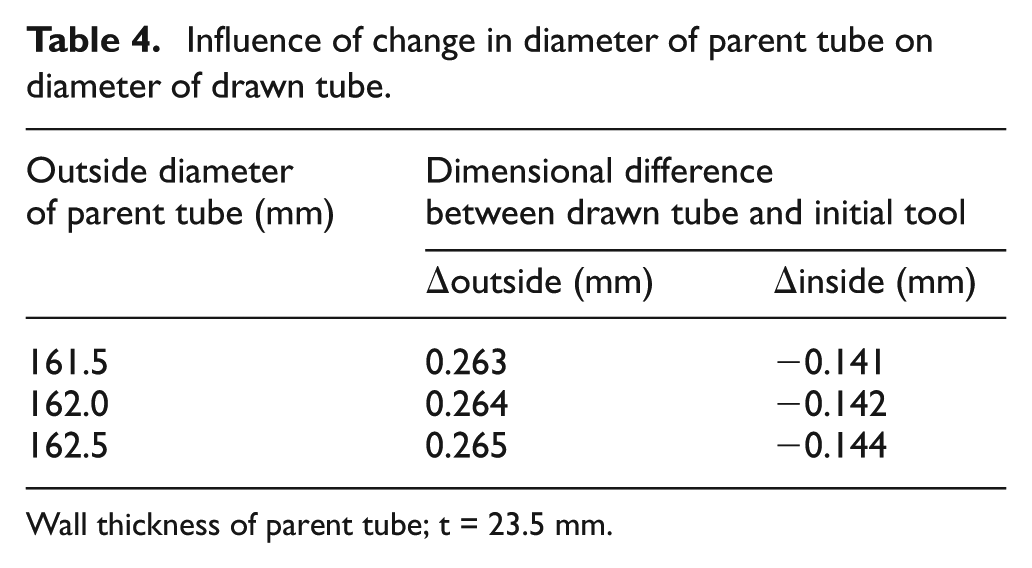
Wall thickness of parent tube; t = 23.5 mm.
Influence of plug position
In tube drawing operation, it is often the case that the plug position changes according to the fluctuation of boundary conditions. It is said that the range of the movement of the plug position falls within ±5 mm around the standard position. Table 5 shows the influence of plug position on the dimensions of drawn tube. The changes in tube outside and inside diameters are less than 0.014 mm even when the plug position changes by 10 mm. Therefore, it may be concluded that the plug position has little influence on the dimensional precision of drawn tube.
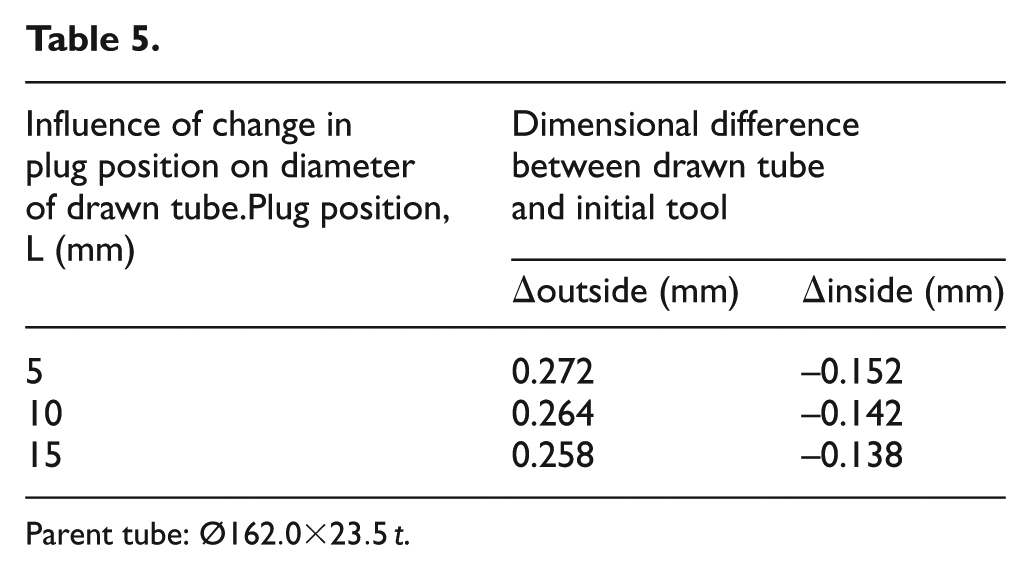
Parent tube:
Dimensional change according to time
It is often said in field operation that the outside diameter of drawn tube slightly changes according to the increase in the number of drawn tubes. In order to sort out this problem, outside diameter of drawn tube was measured. The number of a set of tubes used in drawing operation was 50, and the experiment was repeated three times. The repeatability of the result shown in Figure 6 was validated by the following two sets of additional experiment on the production line. The diameters sharply increase at the beginning stage and saturate when the number of drawn tube reaches about a dozen. Total increases in tube outside diameters are about 0.05 mm. As shown in Figure 6(b), the temperature of die also increases sharply in accordance with the increase in the number of drawn tubes, and it saturates to 110 °C when the number of tubes reaches about a dozen. This increase in temperature is caused by the heat generation on the contact surface due to friction work and by the heat flow from the drawn tube, the temperature of which is increased by plastic metal working.
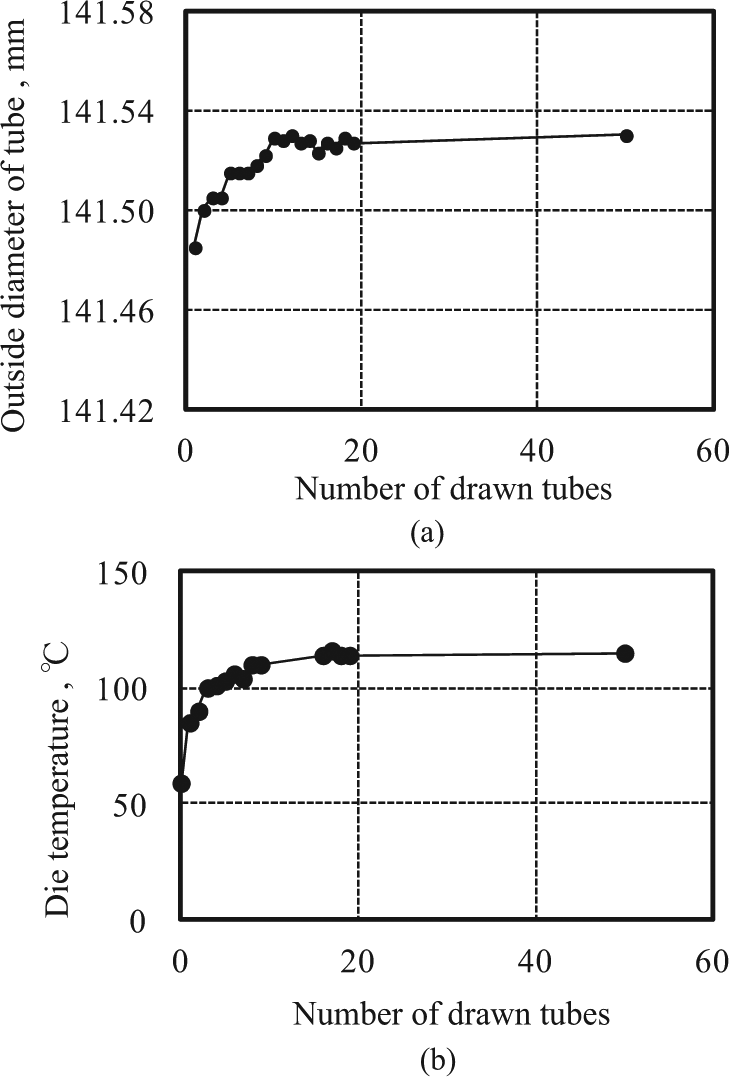
Influence of number of drawn tubes on (a) tube diameter and (b) die temperature change in field operation.
Changes in diameters predicted in the same manner as equation (1) show a good agreement with the measured changes in diameters. It may be concluded that major cause of the change in dimensions of drawn tube is the increase in temperature of tools. If one wants to keep the diameters of drawn tube within a narrower range from the beginning of field operation, one ought to warm up the die to around 100 °C prior to the start of the operation. It is important to note that these experiments were carried out under stable operational conditions, and the interval between adjacent tubes was constant. However, the interval often fluctuates in the field operation, and stoppage of production line is not a rare case. When one faces such troubles, it is important to retain the temperature of die about 100 °C. In addition, wear of tools must be checked under strict control.
Influence of die geometry
Up to the previous section, the difference between the finished tube diameter and the tool dimension was considered in the same manufacturing condition, that is, the effect of slight deviation in manufacturing condition was examined. The discussion hereafter is focused on the effect of the designed tool profile or the tube dimension. Some case studies were carried out using numerical analysis method described above.
On considering the condition of numerical study, an index of wall thickness t/D is introduced, where t is the wall thickness of tube and D is the outside diameter of tube. Normally, the value t/D falls within the range of 8%–12% for tubes subjected to energy field services. In this analysis, D = 194.0 mm and t = 12.15 mm, that is, the ratio of t/D = 6.3% was adopted.
As for tool dimensions, die diameter Dd was 178.3 mm and plug diameter Dp was 158.05 mm. For cold-drawing operation of tube, the so-called R-die is conventionally used, whereas the die for bar drawing is a taper die. Inside profile of R-die is part of circle with a radius R as shown in Table 2. For field operation, selection of optimum die is important and the influences of R on product geometry and drawing force were evaluated numerically.
Influences of radius R of die profile on the difference between outside diameter of drawn tube and original diameter of die and also on the working forces are given in Figure 7(a) and (b), respectively. According to the increase in the radius R, the change in diameter Δ on the outside surface of tube increases, whereas that on the inside diameter slightly decreases. The mechanism lying under these changes is explained in Figure 8.
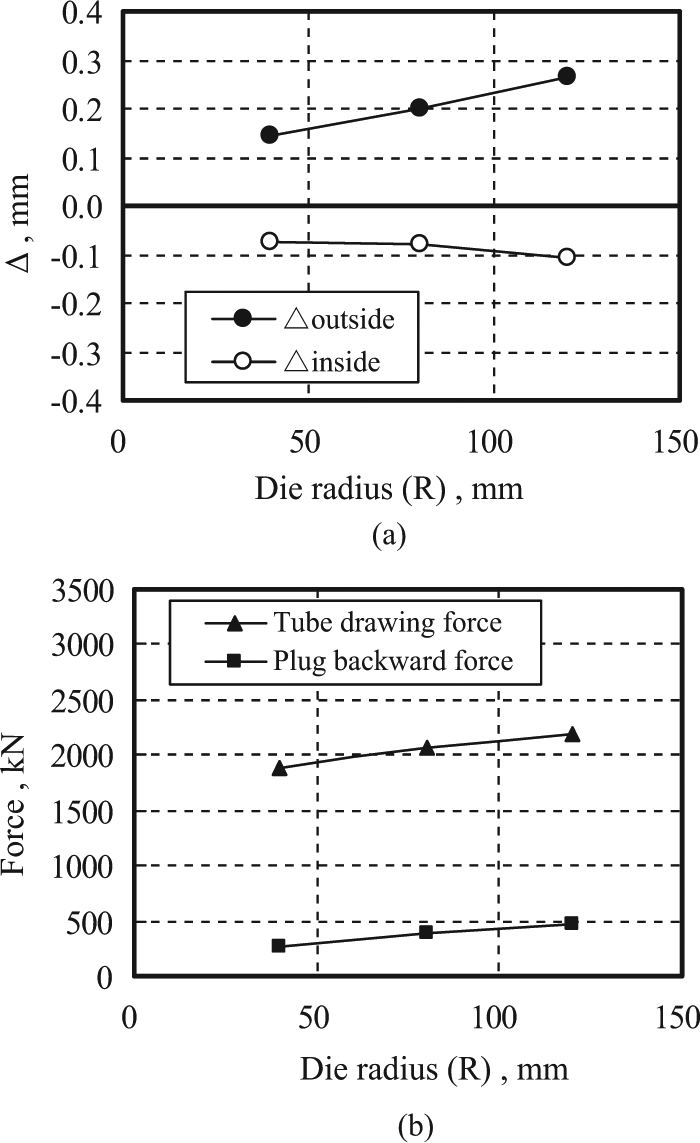
Influence of die radius on product geometry and drawing load: (a) difference between drawn tube diameter and initial tool dimension and (b) drawing load and plug load.
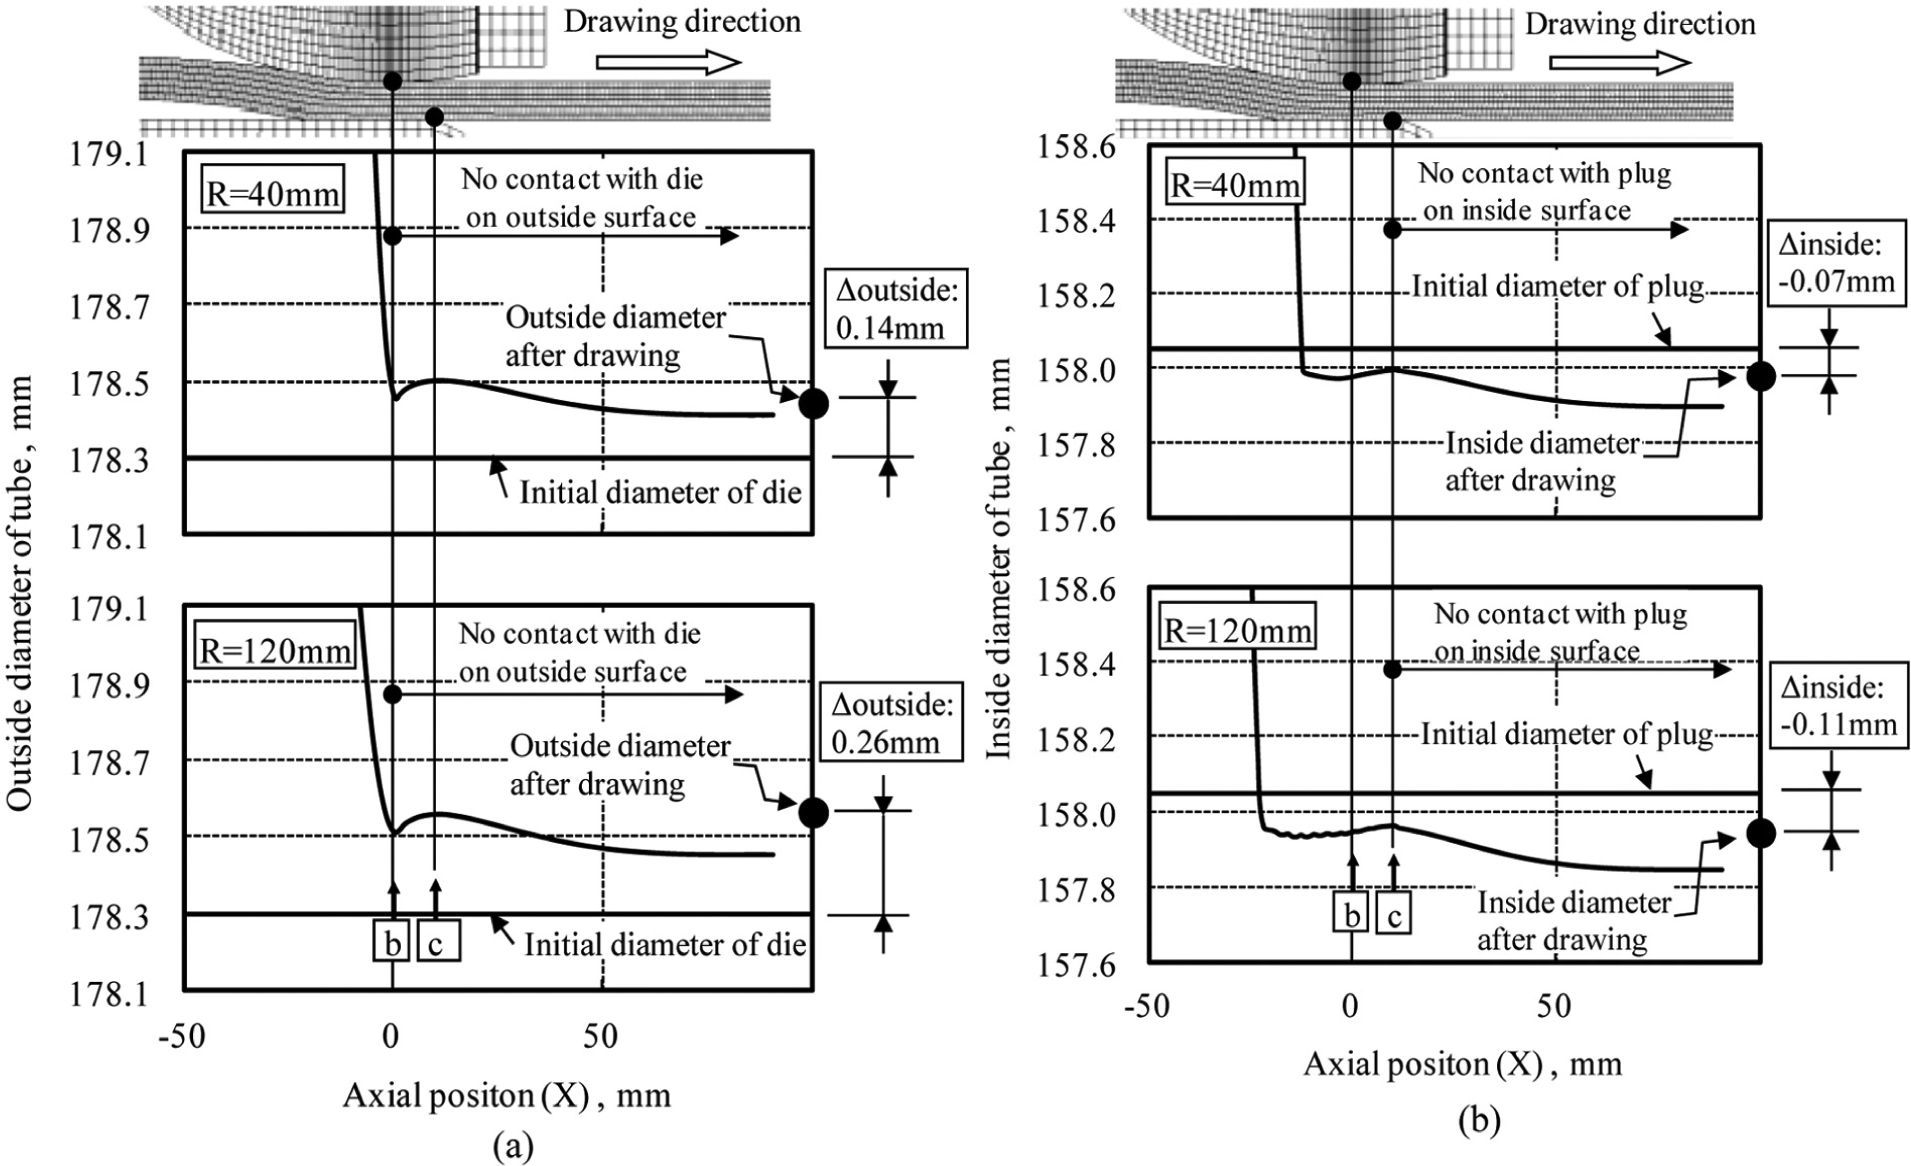
Influence of die radius on tube deformation in the vicinity of tool contact zone: (a) outside diameter change and (b) inside diameter change.
The changing pattern of dimensions was observed in the vicinity of the bite. Comparison between dies with large and small Rs is given in Figure 8(a). For the die with large R, the increase in the inside diameter of die Δoutside at point “c” is larger, and the change in outside diameter of drawn tube becomes larger after the completion of drawing.
The increase in Δoutside is caused by the increase in the contact force exerting on the die surface derived from the increase in the contact length. Increase in the change of outside diameter after drawing is caused by the increase in drawing force. The larger the R, the longer the contact length, and the longer the contact length, the larger the drawing force. When the drawing is completed, the drawing force disappears and larger recovery of outside diameter reveals. For the inside diameter, the mechanism is slightly different. As shown in Figure 8(b), shrinkage of plug diameter Δinside is large according to the increase in R, and there is a large recovery of inside diameter after drawing is finished. The shrinkage and the recovery cancel each other out, and the change in inside diameter is smaller compared to the change in outside diameter.
Special attention on tubes for heavy duty
The dimension mentioned above is a typical example of normal average size of stainless seamless steel tubes, but there are thick-walled products for heavy duty requested from the market. For this purpose, the influence of extremely thick wall on the drawing features was considered.
In this analysis, the wide range of t/D, where t is the thickness and D is the outside diameter of tube, was adopted and numerical analyses were carried out for cases between t/D = 4% and 20%. The influences of tube dimensions on the changes in the diameter of drawn tube are illustrated in Figure 9. With the increase in the index t/D, the change in outside diameter Δoutside gradually increases, whereas that in inside diameter Δinside gradually decreases.
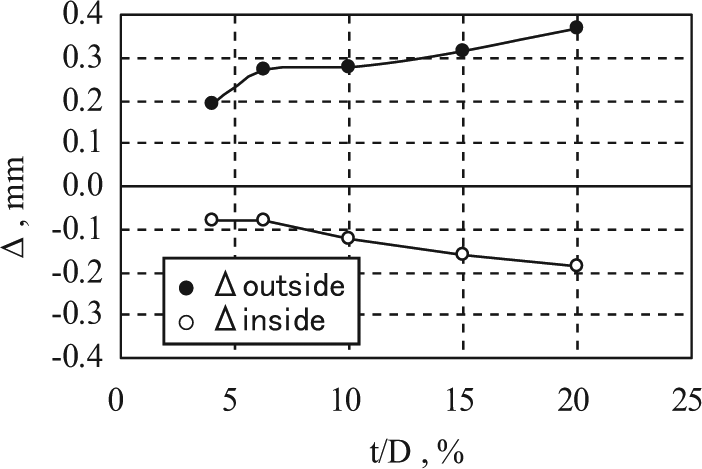
Influence of wall thickness of tube on diameter change by numerical analysis.
The mechanism lying under these changes is explained in Figure 10 for cases with t/D = 4% and 20%.
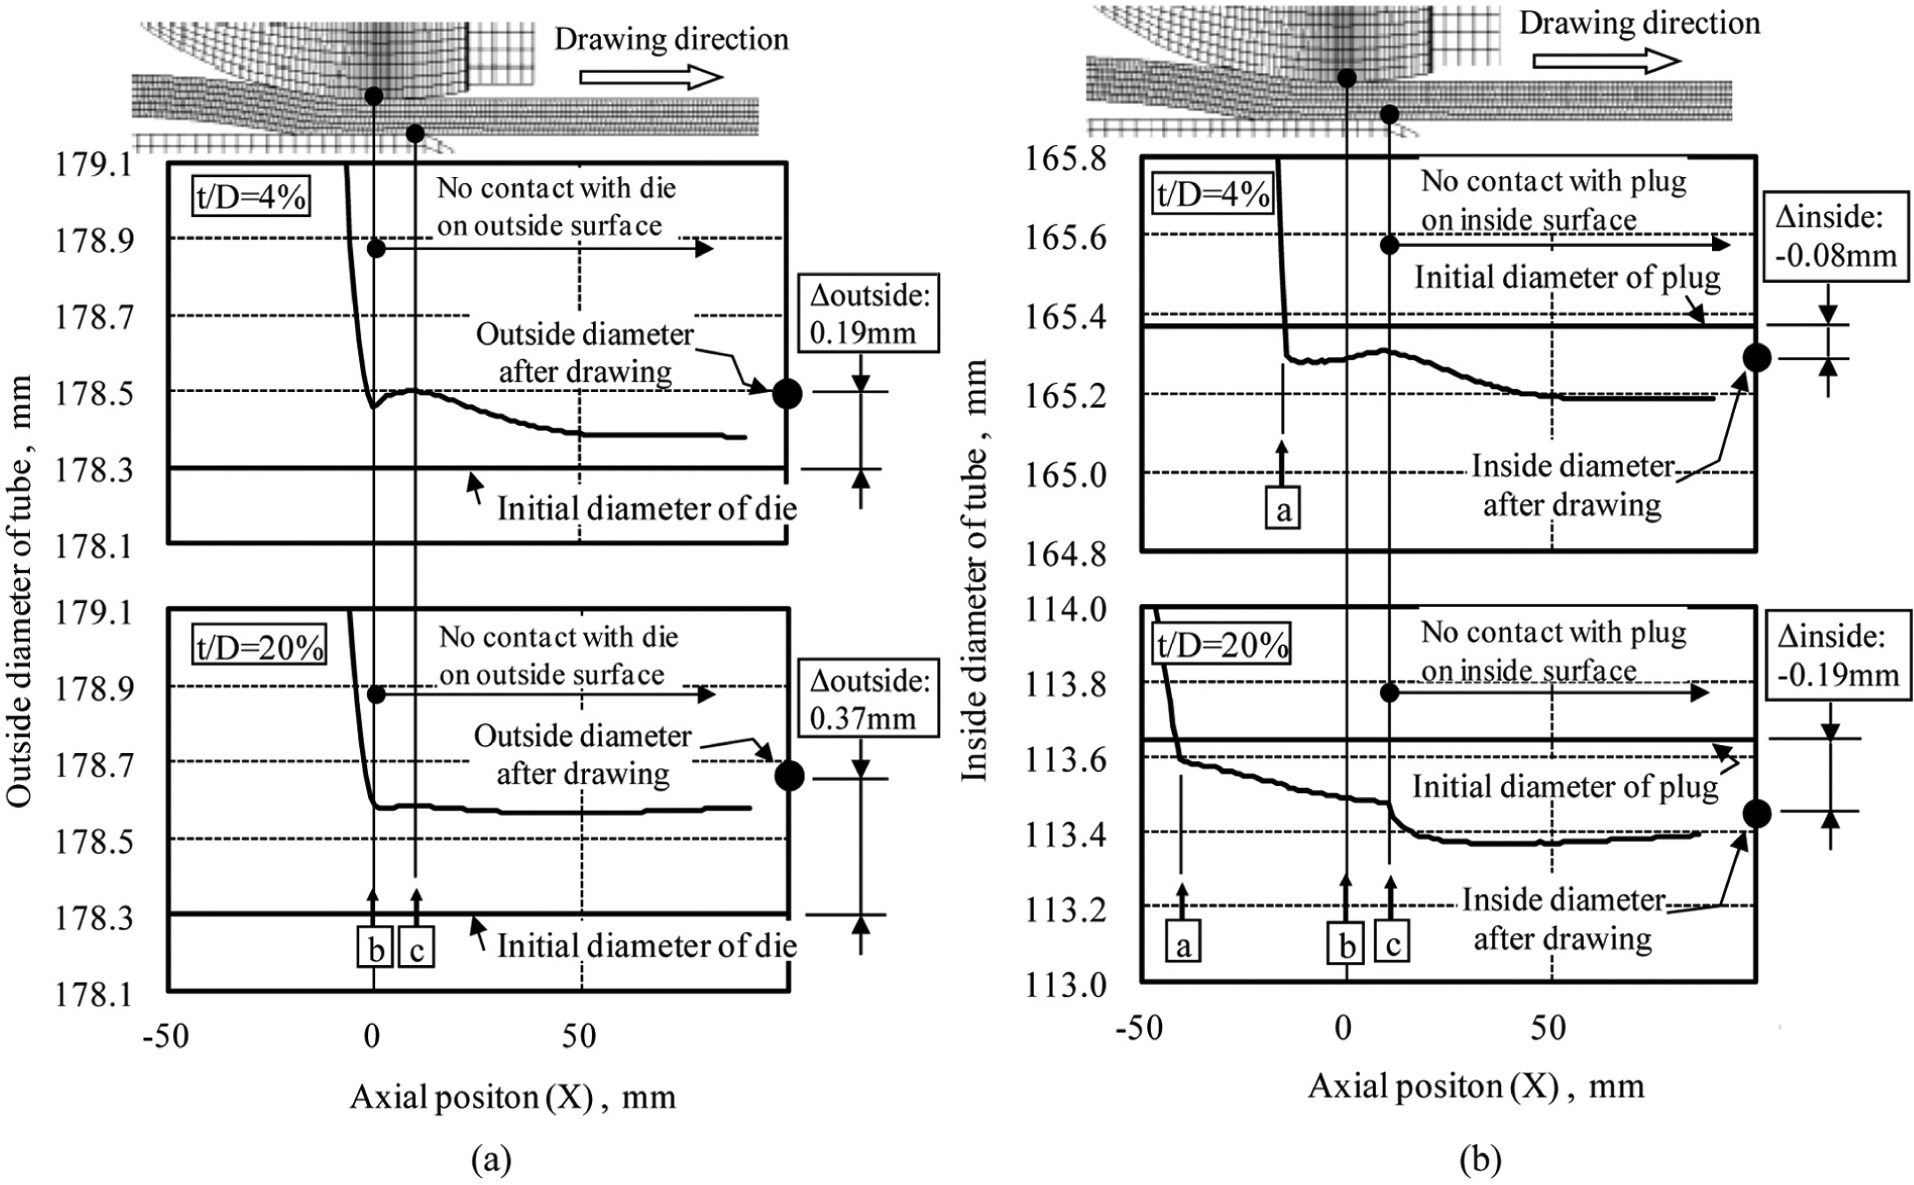
Influence of wall thickness of tube on tube deformation in the vicinity of tool contact zone: (a) outside diameter change and (b) inside diameter change.
Close-up view of the outside diameter in the bite is given in Figure 10(a). For the case with 20% t/D change in outside diameter of tube, Δoutside increases at point “c” because the contact force increases, and shrinkage of outside diameter after point “c” is negligible because the rigidity of tube is high.
Close-up view is also given in Figure 10(b) for the change in inside diameter. Decrease in inside diameter, or plug diameter, is larger at point “c” because of the increase in contact force, and the inside diameter of tube decreases as t/D increases. For the case of t/D = 20%, the inside diameter of tube sharply decreases after point “c.” The only tool that is in contact with the tube is the plug at the very end of the drawing stage. Therefore, as soon as the tail end of tube passes through the plug, the contact force is removed and the inner surface is bulged toward inside direction.
Conclusion
Elastic–plastic finite element analyses were carried out on the cold-drawing process of a stainless steel seamless tube to clarify the key factors for higher precision of product geometry. In order to check the validity of numerical results, experiments were carried out on a drawing machine and on a production line. The conclusions are as follows:
Most influential factor on the precision of final product is the change in tool dimension due to the increase in temperature.
For the first piece of tube, good agreement is obtainable between the result of numerical analysis and that of experiment. It is important to specify that the tube was assumed to be an elastic–plastic material and the tool the elastic materials. In this sense, numerical analysis is highly useful for designing the tube drawing process.
However, the dimensions of drawn tube change according to the increase in the number of drawn tubes. The cause of the occurrence of this phenomenon is the increase in tool temperature. Temperature of tools increases piece by piece because of the heat generation by friction work on the contact surface and heat transfer from the tube, the temperature of which increases due to plastic deformation in drawing.
Accumulation of heat on tools sharply increases at the beginning stage of drawing operation, but the temperature of tool saturates after some number of repetition of drawing operation. At the same time, the change in dimensions on drawn tube saturates.
In order to ensure the stability of dimensions of drawn tube, it is important to keep the temperature of tool within a specified range throughout the operation. Warming up of tools, especially the die, is most effective to obtain the stability from the first piece of tube on the production line.
Footnotes
Declaration of conflicting interests
The authors declare that there is no conflict of interest.
Funding
This research received no specific grant from any funding agency in the public, commercial, or not-for-profit sectors.