
Abstract
There is a growing need to perform automated visual surface inspection in various manufacturing processes due to increased emphasis on quality control. A number of high-resolution three-dimensional metrology products are commercially available, but they are all very limited in their fields of view. The small field of view of the scanners makes inspection of relatively large parts a time-consuming operation, which has significant negative impacts on throughput. This article presents a two-stage inspection process in which a machine vision system, based on the photometric stereo principle, is used to detect potentially defective regions on parts over a much wider field of view than the one covered by the commercial products. The suspicious regions are then inspected using a high-resolution commercial three-dimensional surface measurement system, ignoring areas that are perceived to be defect free. Experimental tests on planar steel samples, having known surface defects, show that this approach is effective and it reduces the overall inspection time significantly.
Keywords
Introduction
The need for automated visual surface inspection is increasing rapidly in a wide range of manufacturing processes due to high-quality control requirements. Manual inspection techniques, however skilled, can no longer cope with the speed, consistency and quality control requirements. The use of automated inspection methods can lead to reduced labour costs, elimination of human error or subjective judgement and the creation of timely statistical product data. 1
High-resolution optical three-dimensional (3D) surface measurement systems are available from manufacturers, such as Zygo and Alicona. The vertical and lateral resolutions of these scanners can be as high as 1 and 8 µm, respectively, which are high enough for most manufacturing applications. The main limitation of these commercial devices is that they have narrow fields of view, which typically range from 0.5 mm × 0.5 mm to 3.0 mm × 3.0 mm. This makes scanning of relatively large parts a time-consuming operation. Also, a large volume of point cloud data are generated from the scanning operations and the processing time adds to the overall inspection time.
The approach presented in this article is to perform a fast low-resolution scan of the surface to be inspected, over a relatively wide field of view, in order to detect and locate potentially defective regions. A high-resolution 3D scanner is then used to measure the perceived regions of imperfections in order to characterise the defects. In this approach, a robot manipulator could be used to present the part to the low-resolution optical measurement system. The location and area of suspicious regions are then used to guide the robot in presenting the part to the high-resolution 3D scanner. The 3D scanner could also be mounted on the robot instead and the robot moved to the locations of the suspicious regions. This approach minimises inspection and processing time as it eliminates the need to measure the entire surface of the part using the high-resolution but slow scanner.
A number of automated surface defect detection systems have been reported in the literature, but the vast majority of them are based on two-dimensional (2D) imaging techniques.2,3 The 2D vision systems rely on discontinuities in image brightness, which could result from changes in illumination conditions, material properties, depth and orientation of the surface, whereas surface defects such as scratches, dents and tooling marks are characterised mainly by localised change in depth. Although current 2D surface inspection systems use special lighting set-ups to enhance the visibility of specific features, they are still ineffective in detecting features with 3D characteristics only.
The method used in this article is to reconstruct the 3D shape of the component to be inspected using the photometric stereo (PS) technique over a field of view of 46 mm × 34 mm, which is much wider than those of the currently available high-resolution commercial products. This is then followed by automated processing of the extracted gradient map in order to detect and locate potentially defective regions. Unlike typical 3D computer vision algorithms, such as laser triangulation, depth from focus and binocular stereo, PS is only suitable for estimating surface topography and cannot be used for range and absolute height measurements.
The PS technique is not new in the field of computer vision, 4 but advancements in machine vision technology have extended its application domain to include industrial inspection tasks. Typical existing applications of the PS method reported in the literature include inspection of ceramic tiles, 5 wood6,7 and planar steel. 8 However, the existing applications are all are focused on 3D shape reconstruction only. They do not address automatic processing of the gradient map in order to detect and locate defective regions. A common approach that is used to detect local geometric surface features is to compute the curvature of the surface. 9
Shape recovery using PS
Theory
PS is a technique used to estimate the surface gradients and reflectance features of a 3D object from multiple images of the object captured from a fixed viewpoint but under a sequence of controlled and distinct illumination directions. The gradient map can then be integrated to obtain the height map of the object surface. A generalised schematic diagram of PS set-up is shown in Figure 1, where
XY plane is coincident with the surface of the object;
Z-axis is orthogonal to the surface of the object and also aligned with the optical axis of the camera;
τ is the tilt angle of the light source. It is the angle between the positive X-axis and the direction of light, measured in the XY plane;
φ is the slant angle of the light source. It is the angle between the optical axis of the camera and the direction of light.
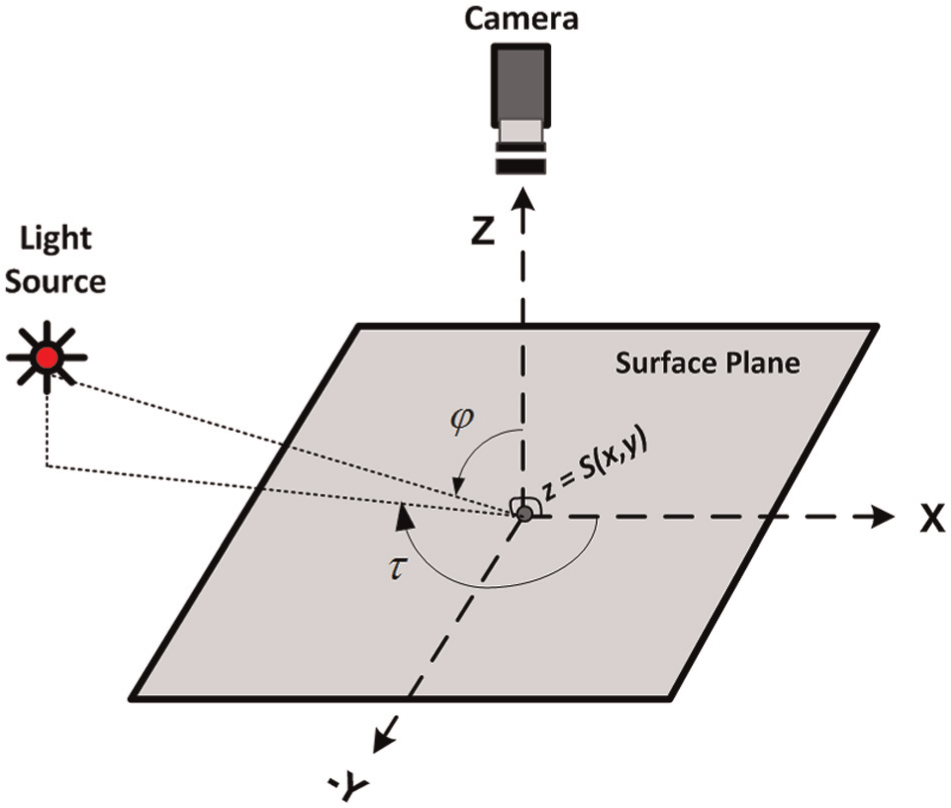
Schematic of photometric stereo set-up.
The technique is based on Lambertian reflectance model, which is given as follows 2

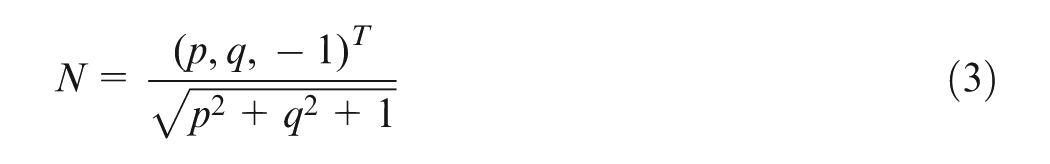
where I is the image intensity; ρ is the albedo, which represent the fraction of incident light that is being reflected from a point on the surface; L is the illumination direction vector and N is the unit surface normal vector.
Let the equation of a 3D surface be given as

If the first partial derivatives of the surface with respect to the x- and y-directions are represented as
T is the matrix transposition. The illumination direction vector can be expressed as

Therefore, equation (1) can be expressed as
The components of the gradient vector field p and q, which provide a convenient way to represent surface orientation, can be computed using the above equation.
Test rig design considerations
The PS technique is underpinned by the following assumptions:2,10
The object surface is not affected by specular heights. That is, the object exhibits Lambertian (diffused) reflection.
The camera lens effects orthographic projection of the object surface onto the image sensor so that all rays from the object to the image sensor are parallel.
The illumination sources deliver parallel and uniform light beams (point light sources).
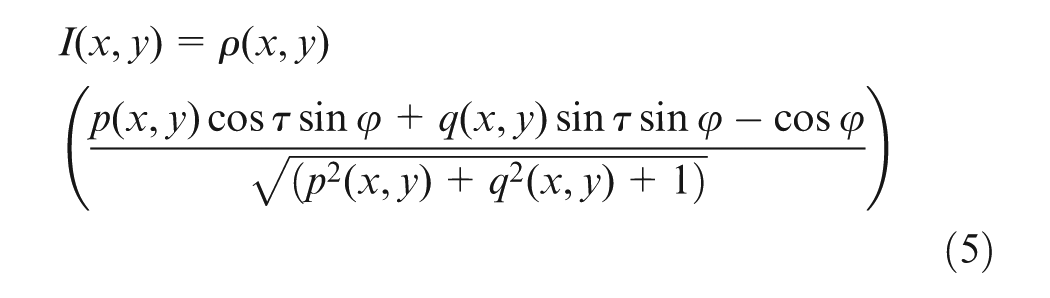
According to equation (5), the intensity at a local point on a surface depends on the gradients of the surface, the reflectance factor (albedo) and the position of the illumination source. Therefore, three images acquired under different lightening configurations are required to uniquely compute the two unknown local surface gradients and the reflectance factor. However, the 3D geometry of objects may cause shadows. The number of effective directions of illumination is reduced in shadow regions, which leads to ambiguities. Also, many industrial materials, such as polished metals, could exhibit localised specular highlights.
It has been reported in some studies that the effects of shadows and erroneous specular data could be minimised by using four or more images.11–14 This is based on the assumption that in any group of images, only one light source produces localised secularities at a particular image point. Therefore, if a specular highlight is present, the surface gradient could still be determined using the images from the other light sources. For this reason, four light sources are used in this work in order to increase the robustness of the system. The use of four lights to produce four images results into a situation where equation (5) is overconstrained, but it can be solved by using the least squares approximation method.
Approximation to an orthogonal object projection is usually achieved by positioning the camera at a considerable far away distance in relation to the camera’s field of view. 1 Reflected rays from the object are thus considered to be approximately parallel as the camera focus approaches infinity. Although projection of objects that are small relative to the viewing distance can be assumed to be orthographic, true orthographic projection of an object can only be effected by using a telecentric lens, which produces a constant magnification over a specified range of object distance. Existing PS applications generally use standard lenses with long focal lengths (35 mm and above). However, telecentric lenses are more ideal for industrial inspection and measurement of 3D parts.
The third assumption made by the PS technique is that the illumination sources project parallel beams of light (telecentric lighting). This is required in order to specify unique locations for the light sources. In addition to that, high-accuracy 3D inspection using telecentric lenses generally requires telecentric illumination. Approximate parallel light rays can be produced using collimated light sources.
In order to satisfy the three aforementioned assumptions, a camera with a telecentric lens and four collimated light-emitting diode (LED) illumination sources is used to construct a test rig for experimental work in this research.
Automatic detection of potentially defective regions
The estimated gradient data are often integrated in order to reconstruct the overall shape of the surface.15,16 However, the main objective of this work is not to recover depth information but to detect and locate regions where there are localised changes in depth. Consequently, integration of the partial derivatives in order to obtain depth information is not required. Features that indicate defects are more easily segmented in the mean curvature of a surface because it gives a local measure of the geometric shape of the surface. The mean curvature of a surface
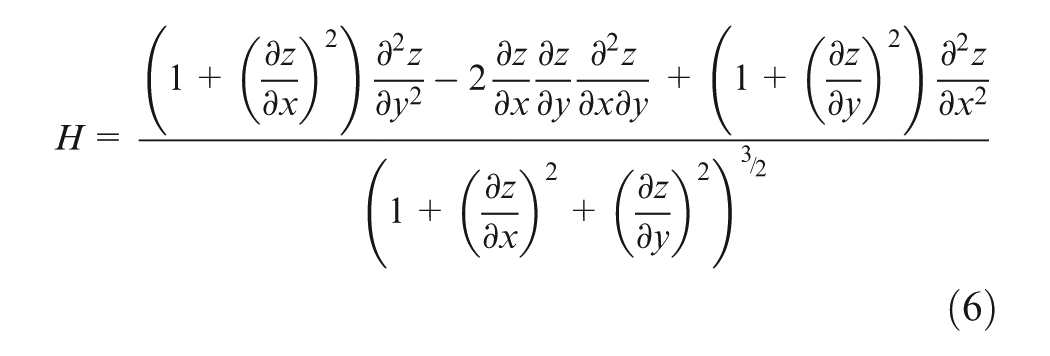
It should be noted that the first partial derivatives in the expression above correspond to the components of the gradient space (p, q) obtained from equation (5). Assuming that the components of the gradient vector field are two separate images, the second derivatives of the surface can be computed by applying a derivative of Gaussian filtering to the images. Second derivatives are very sensitive to noise. Therefore, it is desirable to remove the high-frequency components using the Gaussian filter before computing the gradients of the images. The second derivatives along the x- and y-directions are approximated using the following equations
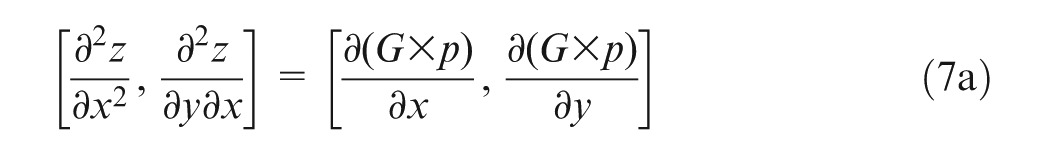
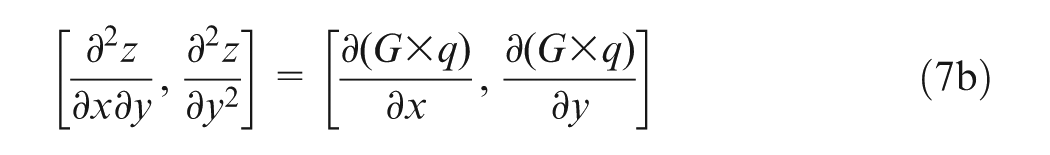
The Gaussian function G is given as
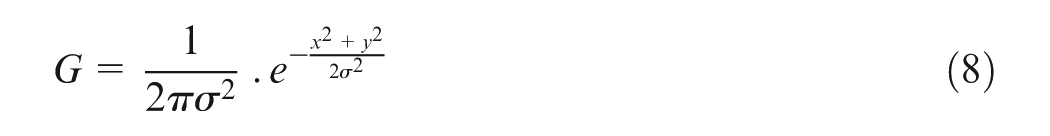
The choice of σ depends on the degree of smoothing required. A larger σ implies a wider filter size and greater smoothing effect. The degree of smoothing can be adjusted in order to achieve a compromise between noise removal and retaining the defects of interest. The defective regions are then segmented from the other regions by thresholding the mean curvature image. There are a number of thresholding schemes that can be used to segment an image using threshold values that are determined automatically from its histogram, 17 but Otsu’s method 18 has been used in this work. Geometric properties such as the lateral sizes and positions of the defects are computed from the resulting binary image.
Experimental work
It is clear that the optics and the set-up of lighting are critical to vision inspection tasks. As discussed earlier, four collimated high-power LEDs having a wavelength of 470 nm (blue) are used. All the lights are positioned at the same slant angle of 35° and tilt angles of 25°, 100°, 195° and 270°, respectively. A monochrome area scan camera with Gigabit Ethernet interface is used to capture the images. The camera is aligned orthogonally to the object plane, and the lens field of view is 46 mm × 34 mm. Industrial telecentric lenses with much wider field of view (up to 360 mm × 230 mm) are commercially available but at significantly increased costs and are often quite bulky.
The light sources, which are operated via a specialised controller, are automatically projected on to the object at different times, and the image capture is synchronised with the activation of each light in sequence. The images are captured and processed using HALCON machine vision library. The PS test rig is shown in Figure 2.
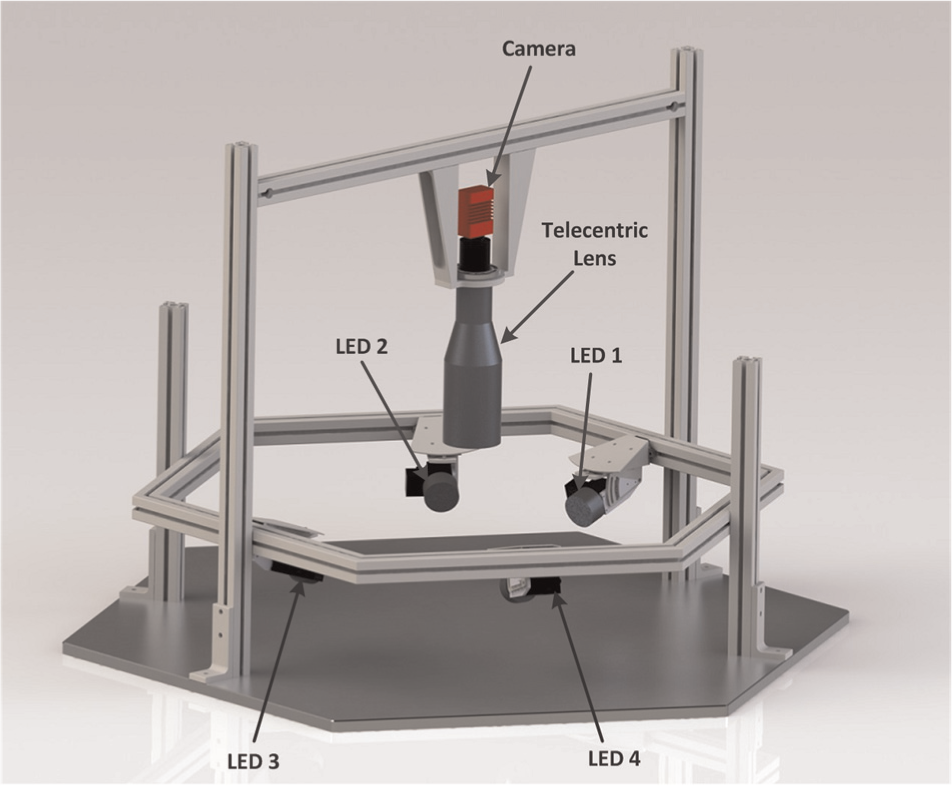
Rendered image of the photometric stereo test rig.
The system is tested on two planar steel samples with different roughness values. Sample A has a profile roughness value (Ra) of 0.1 µm, while the Ra value of sample B is 1.0 µm. Two sets of indentations were generated on the samples using the Rockwell and Vickers hardness test equipment. The depths of the Rockwell and Vickers indentations, measured using Alicona InfiniteFocus instrument, were approximately 150 µm and 40 µm, respectively. Thin shallow marks of approximately 20 µm in depth were also made on sample A. The images of the indented steel plate samples, acquired using the PS system, are shown in Figures 3 and 4. The inverted gradient map of sample A is shown in Figure 5.
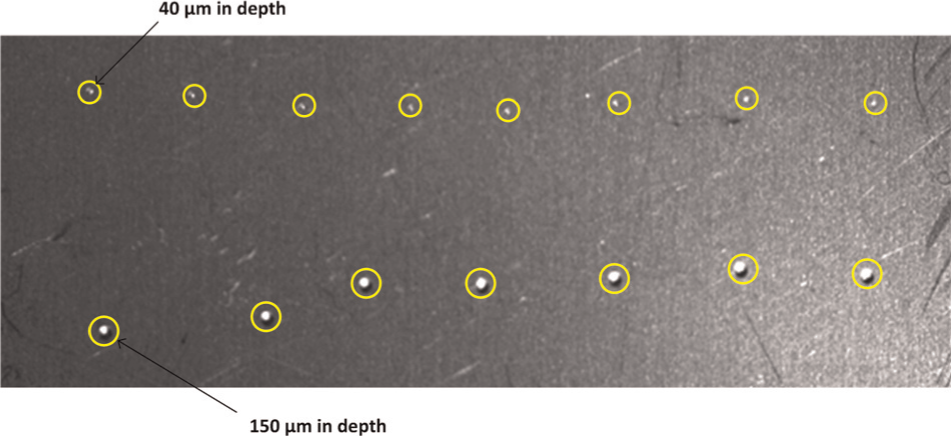
Planar steel sample A (Ra = 0.1 µm).
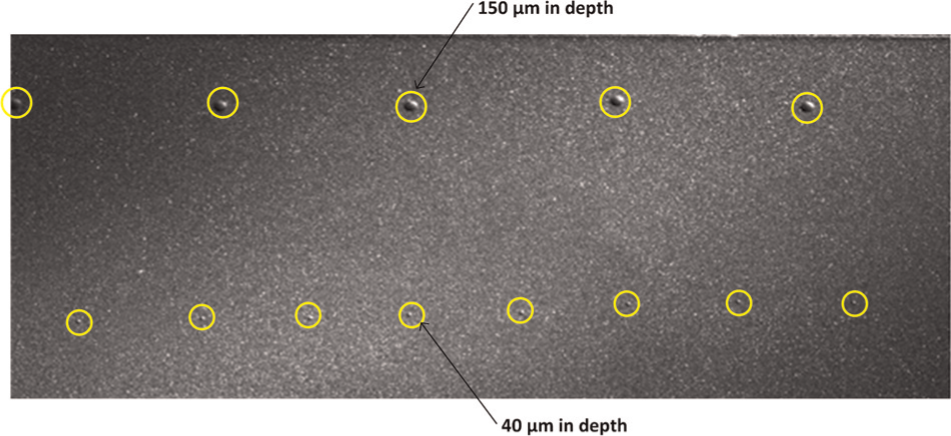
Planar steel sample B (Ra = 1.0 µm).
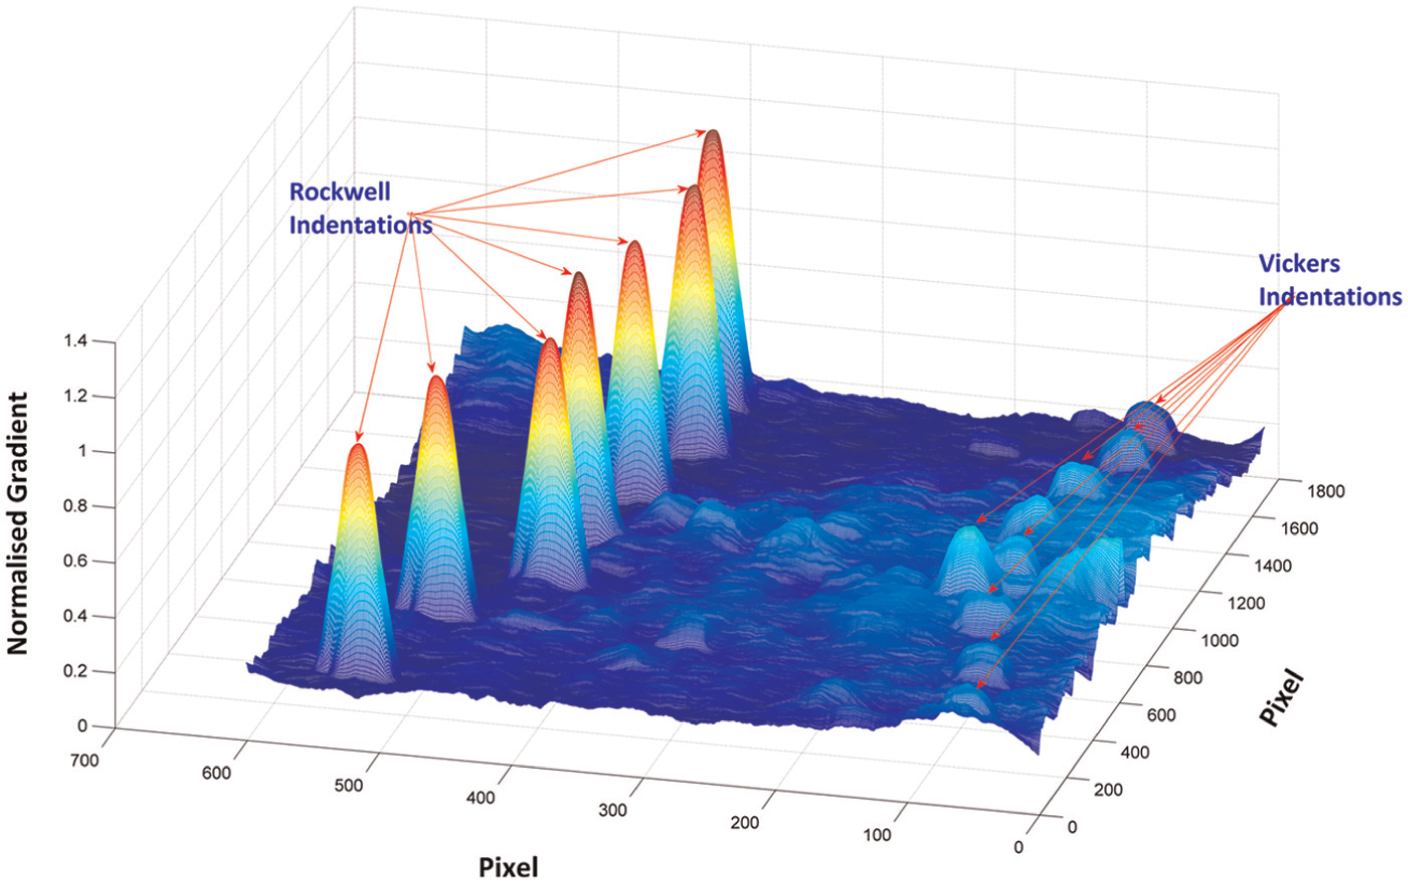
Inverted gradient map of sample A.
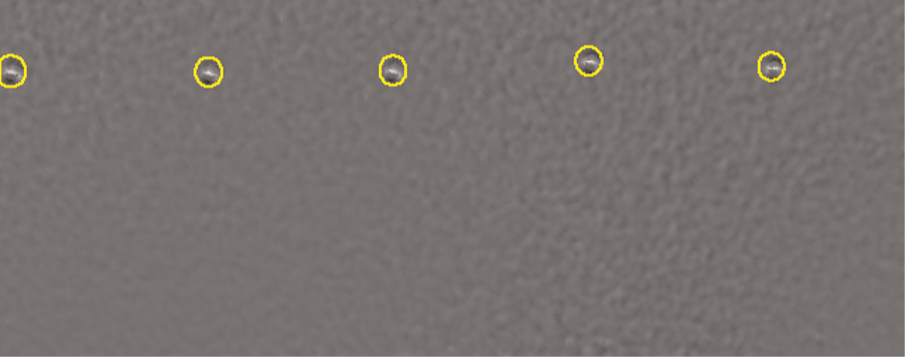
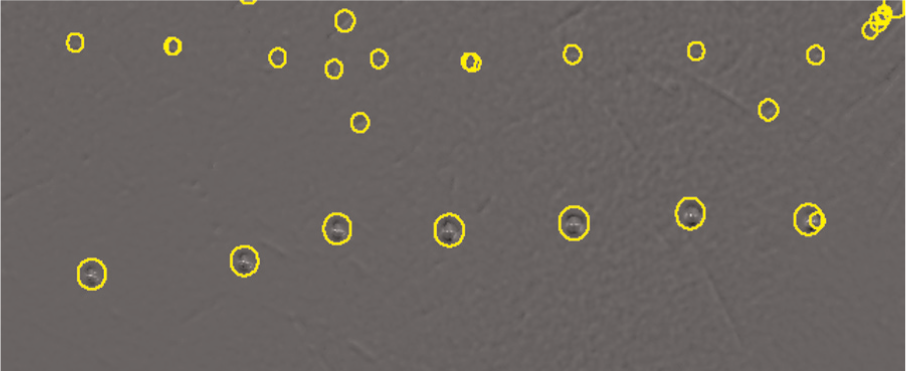
The gradient data sets of samples A and B are processed as outlined in section ‘Automatic detection of potentially defective regions’ using the value of σ = 7.0. The resulting mean curvature images of samples A and B with the automatically detected defective regions are shown in Figures 6 and 7, respectively.
Curvature image of sample A with detected defective regions (σ = 7.0).
Curvature image of sample B with detected defective regions (σ = 7.0).
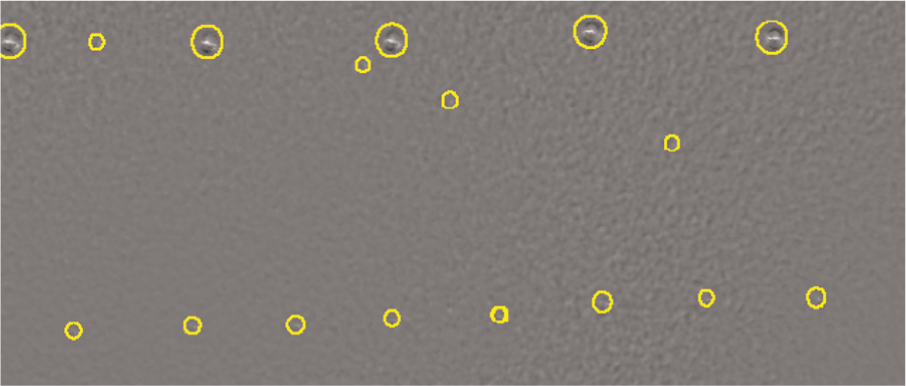
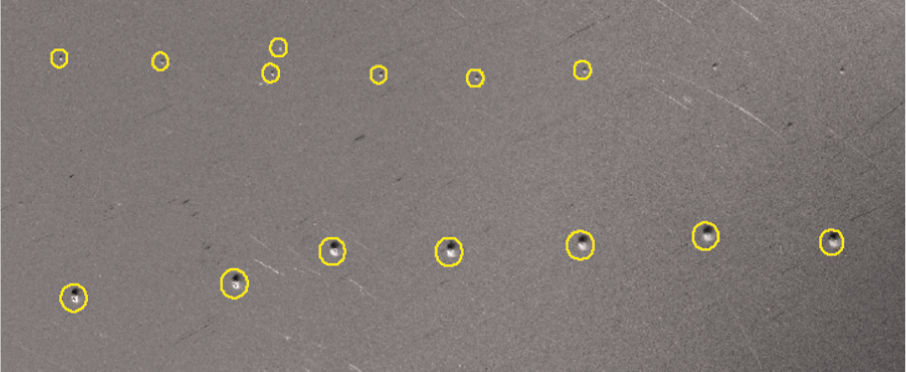
As shown in Figures 6 and 7, the system is able to detect the Rockwell indentations (150 µm depth) without any false-negative or false-positive outcomes. The Vickers indentations (40 µm depth) are not detected because of the degree of filtering applied. By reducing the value of σ to 5.0, the system is able to detect the 40-µm depth defects. However, it also picks up some false-positive defective regions, which are attributed to the effects of specular reflections (Figures 8 and 9).
Curvature image of sample A with perceived defective regions (σ = 5.0).
Curvature image of sample B with perceived defective regions (σ = 5.0).
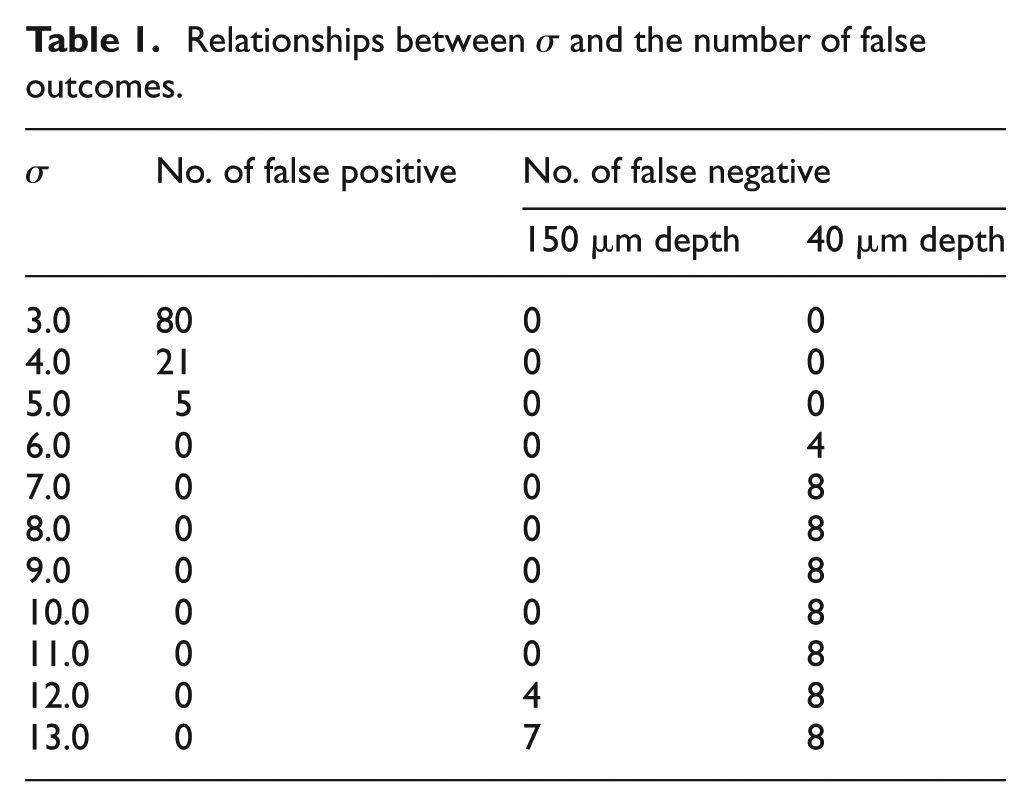
Table 1 shows the relationship between σ and the number of false detections for sample A. According to the table, σ values ranging from 6.0 to 11.0 are suitable for detecting the 150-µm depth defects. The table also shows that the 40-µm depth defects cannot be detected without picking up some false defects. This is why the choice of σ is very critical. A high value of σ minimises noise, but some defects could be filtered out, resulting into false-negative outcomes. Conversely, a low value of σ could detect small defects, but there is the possibility of picking up false defects.
Relationships between σ and the number of false outcomes.
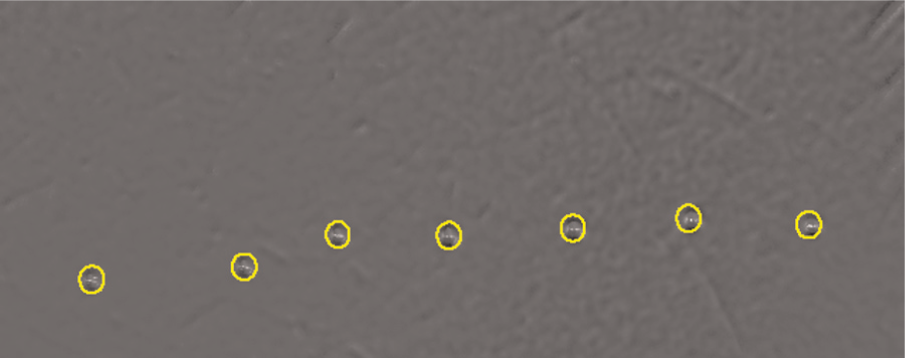
It is also possible to segment the defective areas by applying the thresholding directly to the gradient image instead of the mean curvature image. The result obtained from the application of Otsu’s thresholding to the gradient image of sample A is shown in Figure 10. As shown in the figure, two of the eight 40-µm depth defects were not detected. The expected results would be to detect all or none of the defects with similar sizes as seen in Figures 6 and 8. The gradient image is a global measure of the geometric shape of the surface. Therefore, thresholding of the gradient image will only be effective on a planar and horizontal surface. Segmentation of the mean curvature image makes it possible to detect defects on non-planar surfaces.
Gradient image of sample A with defective regions using Otsu’s thresholding.
The scanning and processing time of a steel sample of size 40 mm × 30 mm on Intel Core i7-3770 CPU at 3.40 GHz is approximately 2 s. It takes minimum of 450 s to scan the same sample using the Alicona InfiniteFocus measurement device. A significant amount of time will be saved if the scan using the Alicona InfiniteFocus measurement device is limited to areas that are perceived to be defective on the sample.
Conclusion
Commercial optical 3D surface measurement products have high resolutions, but they are very limited in field of view and scanning speed. Consequently, inspection of relatively large parts could be time-consuming. A new approach, in which surface inspection is performed in two stages, is presented in this article. In the first stage, a quick scan of the surface is done in order to detect and locate potentially defective areas in relation to a specified coordinate system. This is then followed by a more detailed scanning of the localised defective regions using a commercial 3D scanner in order to measure the defects.
The work reported in this article is focused mainly on the design and development of the automated defect detection system used for the quick (first stage) scanning operation. The system is based on 3D surface shape reconstruction using PS technique. Experimental tests on two planar steel samples show that the system can detect defects as shallow as 40 µm but with the possibility of false-positive detections. The direct benefit of this work is reduced inspection time and hence increased throughput. Significant lower cost of the system compared to the commercial 3D scanners is also a benefit for applications that do not require the actual measurements and characterisation of the defects. Future work will be focused on increasing the resolution of the system and redesign of the test rig so that it is suitable for inspecting non-planar samples.
Footnotes
Declaration of conflicting interests
The authors declare that there is no conflict of interest.
Funding
The work was funded by the EPSRC Centre for Innovative Manufacturing in Intelligent Automation under the grant reference number EP/IO33467/1.