
Abstract
The sheet metal hydroforming technique is easy to achieve lightweight and is widely applied in the aerospace and automotive fields. In order to realize the reliability test for uniaxial tensile forming properties of sheet metals under the condition of three-dimensional stress, experimental apparatus and dedicated fixtures for uniaxial tensile tests of sheet metals under fluid pressure are designed in this article. The stainless steel 304 is employed for this experiment, and commercial finite element software ABAQUS is also adopted to study the deformation behavior of sheet metals under fluid pressure. The results indicate that when the fluid pressure of gauge length reaches a certain value, the specific region will present “double necking” and the peak values of equivalent stress and reduction rate are much lower than that of the conventional ones. When the strain rate is 0.01 s−1, the elongation of the 0.95-mm thickness sheet increases more obviously, reaching 24.1%. With fluid pressure, the fracture morphologies of stainless steel thin sheets and thick sheets are all ridge distributed from both sides to the center of symmetry, and tiny dimples distribute mainly in the rest parts. Based on the results of the experiment and finite element method, the uniaxial tensile forming properties of sheet metals under fluid pressure have been evaluated successfully and easily by this experimental apparatus.
Introduction
In the field of aerospace and automobile industries, in addition to the use of lightweight materials, using lightweight structure is another major approach to reduce weight. For the structure under combined loads, the variable cross-sectional design of sheets and shells can be used to not only achieve weight loss but also make full use of material strength. Sheet metal hydroforming is an advanced manufacturing technique, which satisfies this demand. The mechanism is to form sheet metals through fluid as the force transmission medium instead of a punch or die.1,2 Lang et al. 3 predicted the stress state and deforming behavior in the hydroforming process of square cup-shaped shell by means of finite element method (FEM) and experimental demonstration. Deep et al. 4 aimed to improve the tensile and compressive stabilities in hydromechanical deep drawing by a mathematical model. Di et al. 5 studied on how to improve the equality of forming and obtain a desired final component shape.
The sheet and tube metal hydroforming technique can effectively improve the forming limit of the workpiece.6,7 Mechanical property parameters of the sheets are commonly obtained by the tensile test, but the test cannot reasonably reflect the stress state of the sheets in a hydraulic environment.8,9 Applying uniform hydrostatic pressure during the uniaxial tensile process can improve the limit of forming properties to a certain extent. 10 The related research results showed that hydrostatic pressure has a minor effect on the constitutive relations of aluminum, aluminum alloy and copper bar. However, it has a significant effect on the fracture mechanism and ductility. 11 The result of bar specimen test is suitable for bulk forming, and it is difficult to evaluate sheet-forming properties objectively.
The forming properties of sheet metals closely relate to the stress state during the forming process. 12 Applying loads along the normal direction of sheet metals can increase the hydrostatic pressure in plastic zone and inhibit the generation and development of internal cracks to improve forming properties. 11 Sun et al. 13 investigated the tensile ductility of a commercial grade transformation-induced plasticity (TRIP) steel influenced by sample geometry and loading rate, and they found that the TRIP800 under examination had positive strain rate sensitivities on both strength and ductility of the sample. The study of the bidirectional hydraulic bulging under backpressure loading condition indicated that the increase in backpressure could improve the maximum height of bulging. Furthermore, when the backpressure was close to the strength of material, the maximum height increased more significantly.14,15 If ordinary liquid is employed as the force transmission medium, the bottleneck of the technique caused by dynamic sealing at high pressure cannot be broken. In gas bulging forming, the amount of compressed gas is large and the pressure provided by the gas should not be too high. 16 For the integral formation of double sheets, the backpressure effect is to put on the cladded inner panel by the outer panel, but the normal force distribution is not uniform and the controllability is poor. 17 The forming technique using the viscous fluid as the force transmission medium can achieve the bidirectional loading during the sheet metal forming process, but the uniform stress cannot be guaranteed, because of the restriction of flowing medium. 18
Above all, testing the properties of sheets becomes an important part which cannot be neglected in the process of hydraulic forming. But the reliability test for the uniaxial tensile forming properties of sheet metals under the condition of three-dimensional stress cannot be easily realized, and there is no simple and efficient testing device. So this article has proposed a dedicated apparatus to solve these problems.
Experimental procedures
Basic principles
Based on the specific characteristics of fluid pressure in the sheet hydroforming technique, the study of deformation behavior and corresponding mechanism of the sheets under fluid pressure has an important significance. Therefore, we propose a test method for the uniaxial tensile deformation performance of sheets under fluid pressure. Its basic principle and stress state are shown in Figure 1.
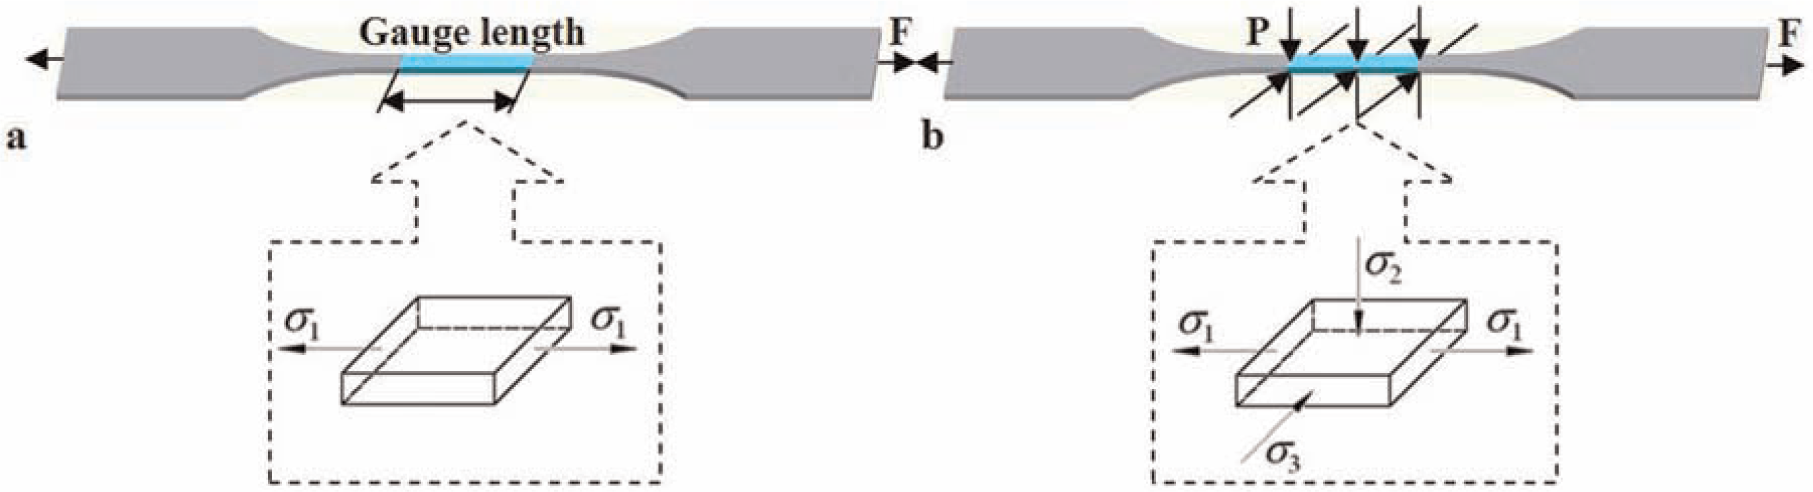
Schematic representation of basic principle and stress state: (a) conventional uniaxial tension and (b) under fluid pressure.
Taking the gauge length of specimen as the object of this study, the stress state of conventional uniaxial tensile test is one-dimensional tension stress. However, the stress state of uniaxial tensile test under fluid pressure is tension in one direction and compression in the other two directions. This complex stress state has an important influence on sheet-forming properties under the action of the normal compression along the thickness direction and tension along the uniaxial direction.
Characterization
In order to carry out the above-mentioned study, the experimental facility for the uniaxial tensile test of sheets under fluid pressure is designed and manufactured, and its principle is shown in Figure 2. Compared with the rectangular cross section, the cross section of a circular piston cylinder has a relatively mature dynamic sealing technology, so the innovation of this facility is based on the idea of geometric conversion that converts the rectangular cross section into the cross section of a circular piston cylinder. The sheet specimen is placed in two combined gluttings with special surfaces, and then, they are placed in the grips. The entire combination of specimen, gluttings and grips is placed into the die. Then, the assembled facility is connected with the tensile test machine using the upper grip and lower grip. The oil system injects fluid medium into the die via the high pressure pipe until the pressure reaches the required value. In the environment of fluid pressure, in order to achieve three-dimensional stress state, the compression is along the normal direction and tension is along the axial direction.
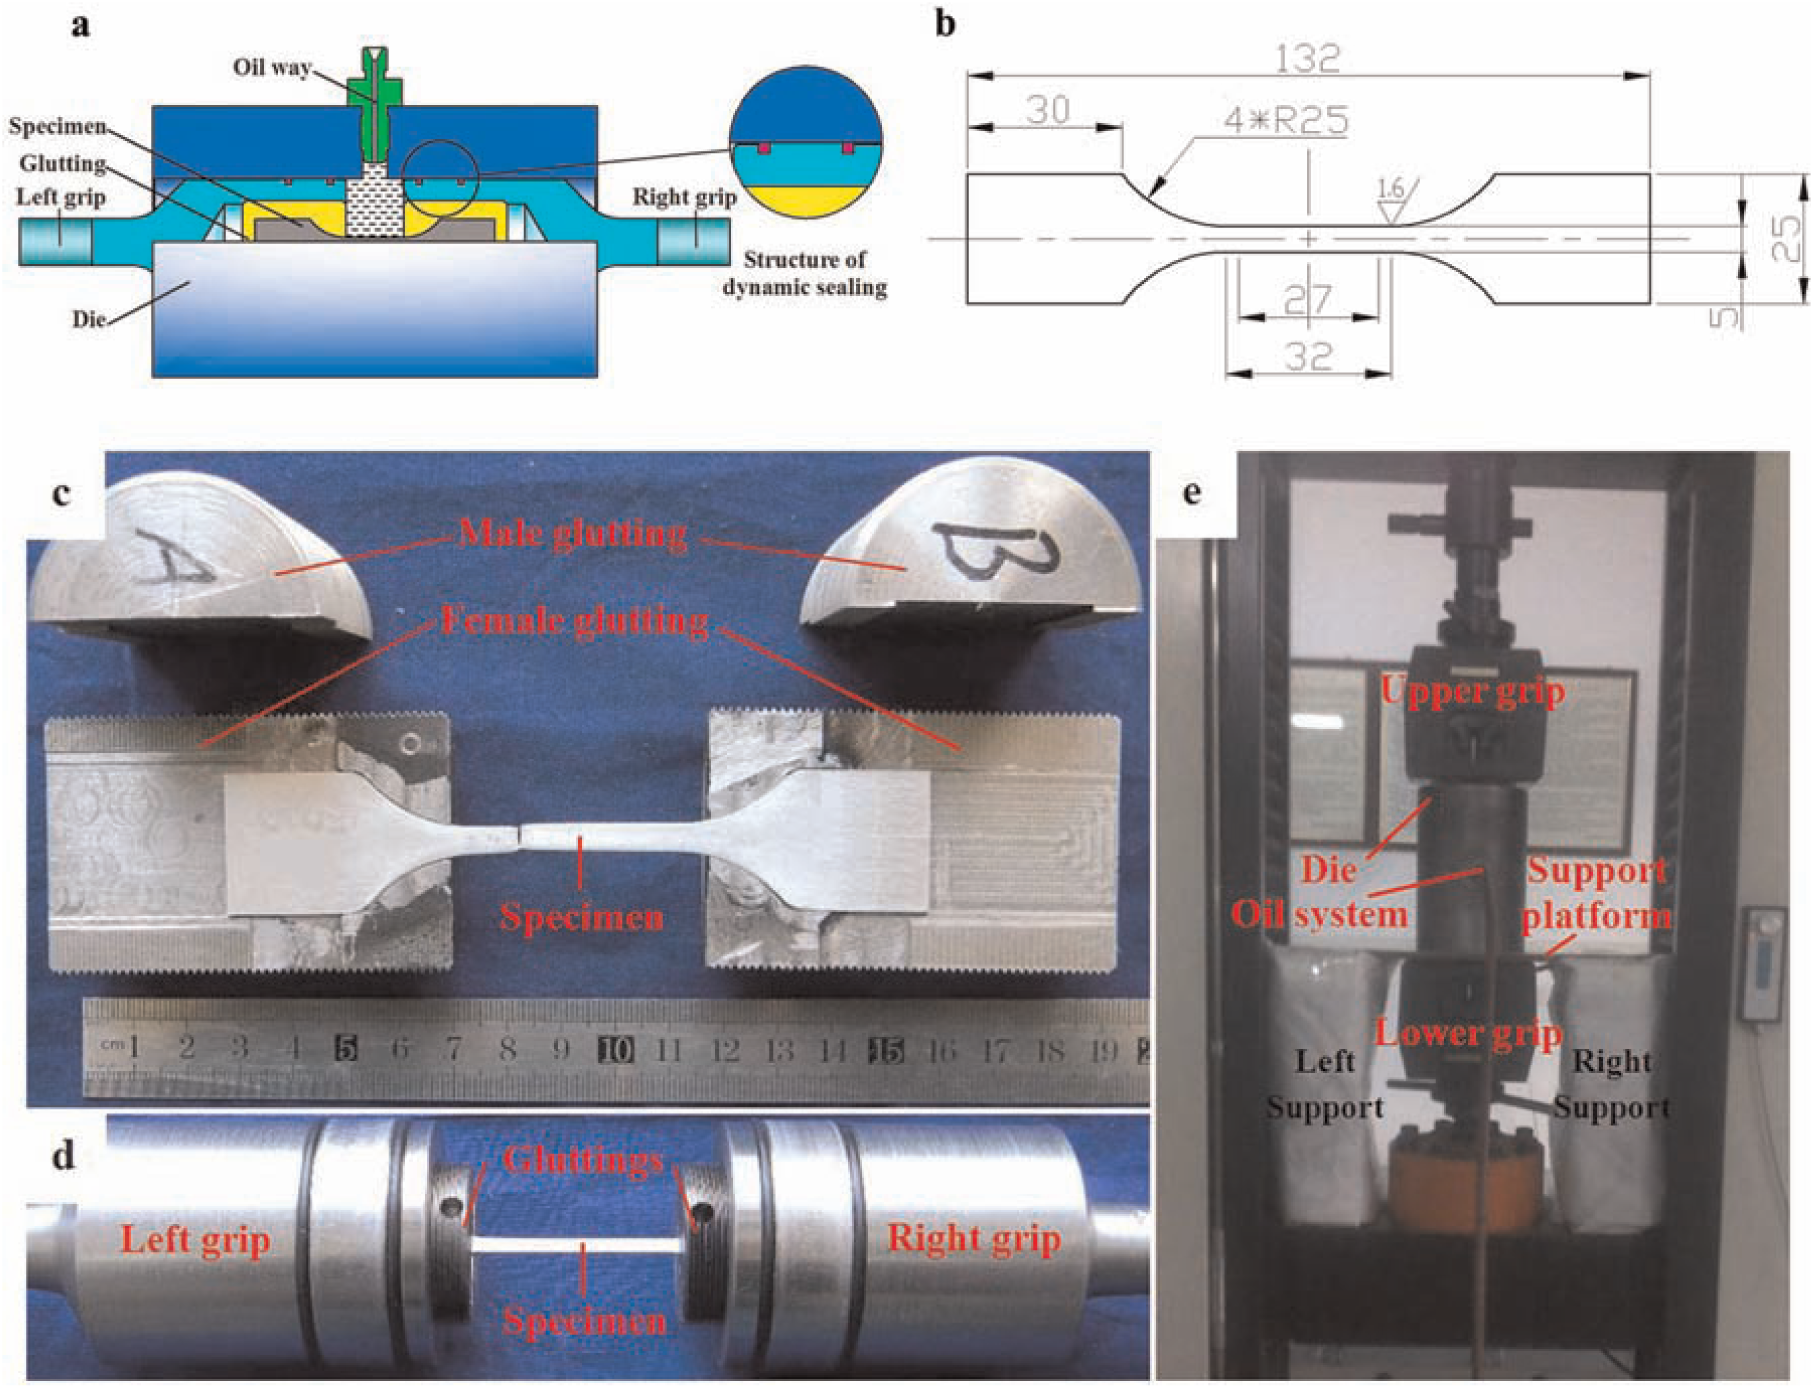
Experimental principle and facility: (a) experimental principle, (b) specimen size (in mm), (c) structure of gluttings, (d) structure of dynamic sealing and (e) assembled structure.
The material studied in this article is 304 stainless steel. The processing of 304 stainless steel is done using rolling. Furthermore, the heat treatment for this material is solution treatment. In order to make a comparison, the thicknesses of specimens are designated as 0.95 mm and 1.75 mm, respectively, and the strain rates are designated as 0.001 s−1 and 0.01 s−1, respectively. Sheet specimens having a gauge length of 27 mm and a gauge width of 5 mm are prepared, and the test experiment is carried out at room temperature in accordance with the ASTM standard test method by a universal testing machine (CSS-44300; Chaoyang Instruments, China) of 100 kN capacity. The size and shape of specimens are shown in Figure 2(b). The experimental facilities are shown in Figure 2(c) to (e). The experimental facilities include specimen gripping, oil system, pressure control, high pressure dynamic sealing and stretching rate control. The grippings designed with the geometric conversion idea are shown in Figure 2(c) and (d). The test system consists of the uniaxial tension facility and the universal testing machine under fluid pressure, as shown in Figure 2(e). The stretching volume of sheets could be controlled accurately by the upper and lower grip, and fluid pressure is controlled independently by the oil system. Left and right supporting devices are used for assuring the stability of experimental process. Three tests are carried out at different conditions, and the mean value of test results is adopted. The fracture surfaces of the samples after testing are observed by scanning electron microscopy (SEM, S-4800; Hitachi, Japan) equipped with X-ray energy-dispersive detector system (EDS, Model Link-ISIS; Oxford Instruments, UK).
FEM analysis
In order to investigate the stress state and wall thickness distribution during the uniaxial tensile deformation process of sheet under fluid pressure, the FEM analysis is employed by using an elasto-plastic commercial package ABAQUS. The 0.95-mm thickness sheet of 304 stainless steel is chosen as the object for FEM analysis. Based on the characteristics of uniaxial tensile deformation, the 20-node hexahedron quadratic-reduced integration unit C3D20R is chosen to mesh. The elastic–plastic material behavior is represented by an incremental J2-plasticity model with isotropic hardening, which has been calibrated based on a series of uniaxial tension and compression tests. The true stress–strain curve of 304 stainless steel and finite element model are shown in Figure 3. The magnitudes of fluid pressure applied on the specimens in the gauge length area are 0, 25, 50 and 100 MPa, respectively. The tensile deformation rate is 0.27 mm/s (i.e. the strain rate is 0.01 s−1).
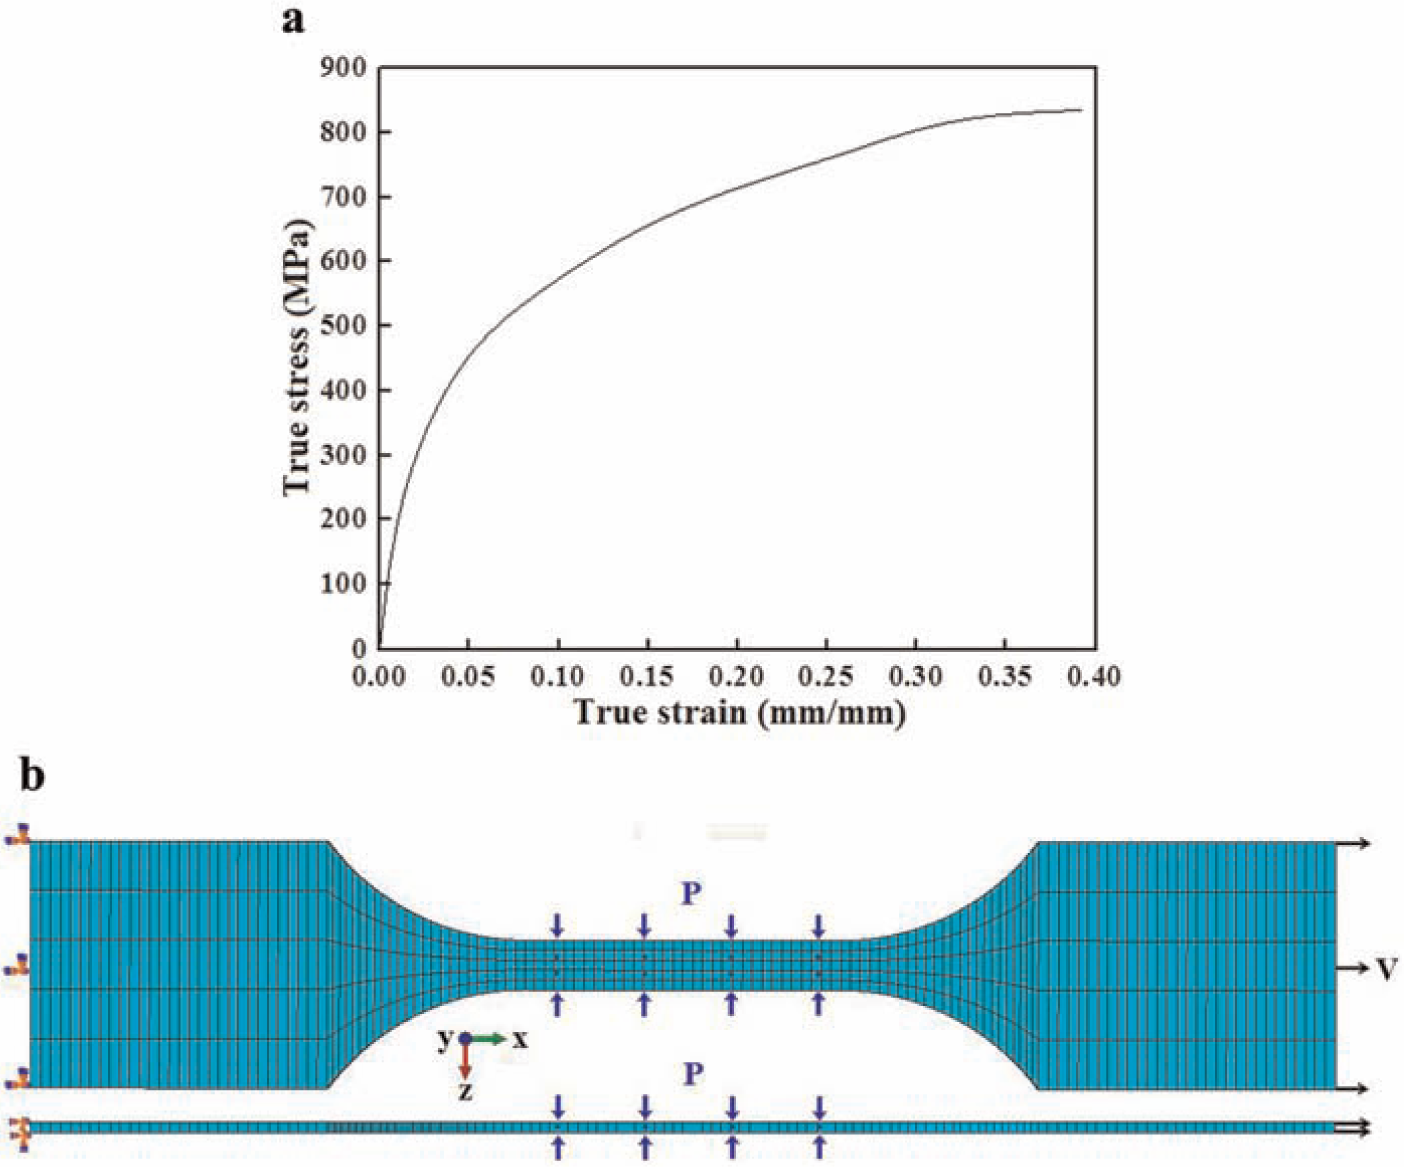
Stress–strain curve and finite element model: (a) true stress–strain curve of 304 stainless steel and (b) mesh generation and boundary condition.
Results and discussion
FEM analysis results
The FEM analysis results of effective stress (von Mises) under different fluid pressures are shown in Figure 4. Under the same condition of tensile deformation, the tensile specimen shows single necking deformation characteristics, and the necking area is located at center of the specimen when the fluid pressure increases from 0 MPa to 25 MPa. The peak value of equivalent stress is 68 MPa, which is higher than that of conventional tensile, when the fluid pressure is 25 MPa and the stress distribution of the sheet specimen is almost the same. When the fluid pressure reaches 50 MPa, under the same deformation condition, the symmetrical “double necking” appears at a certain distance away from the center point in gauge length from both sides. Under the fluid pressure of 100 MPa, “double necking” presents in the similar position compared with the condition of 50 MPa, but the peak stress is similar to the results from conventional tensile.
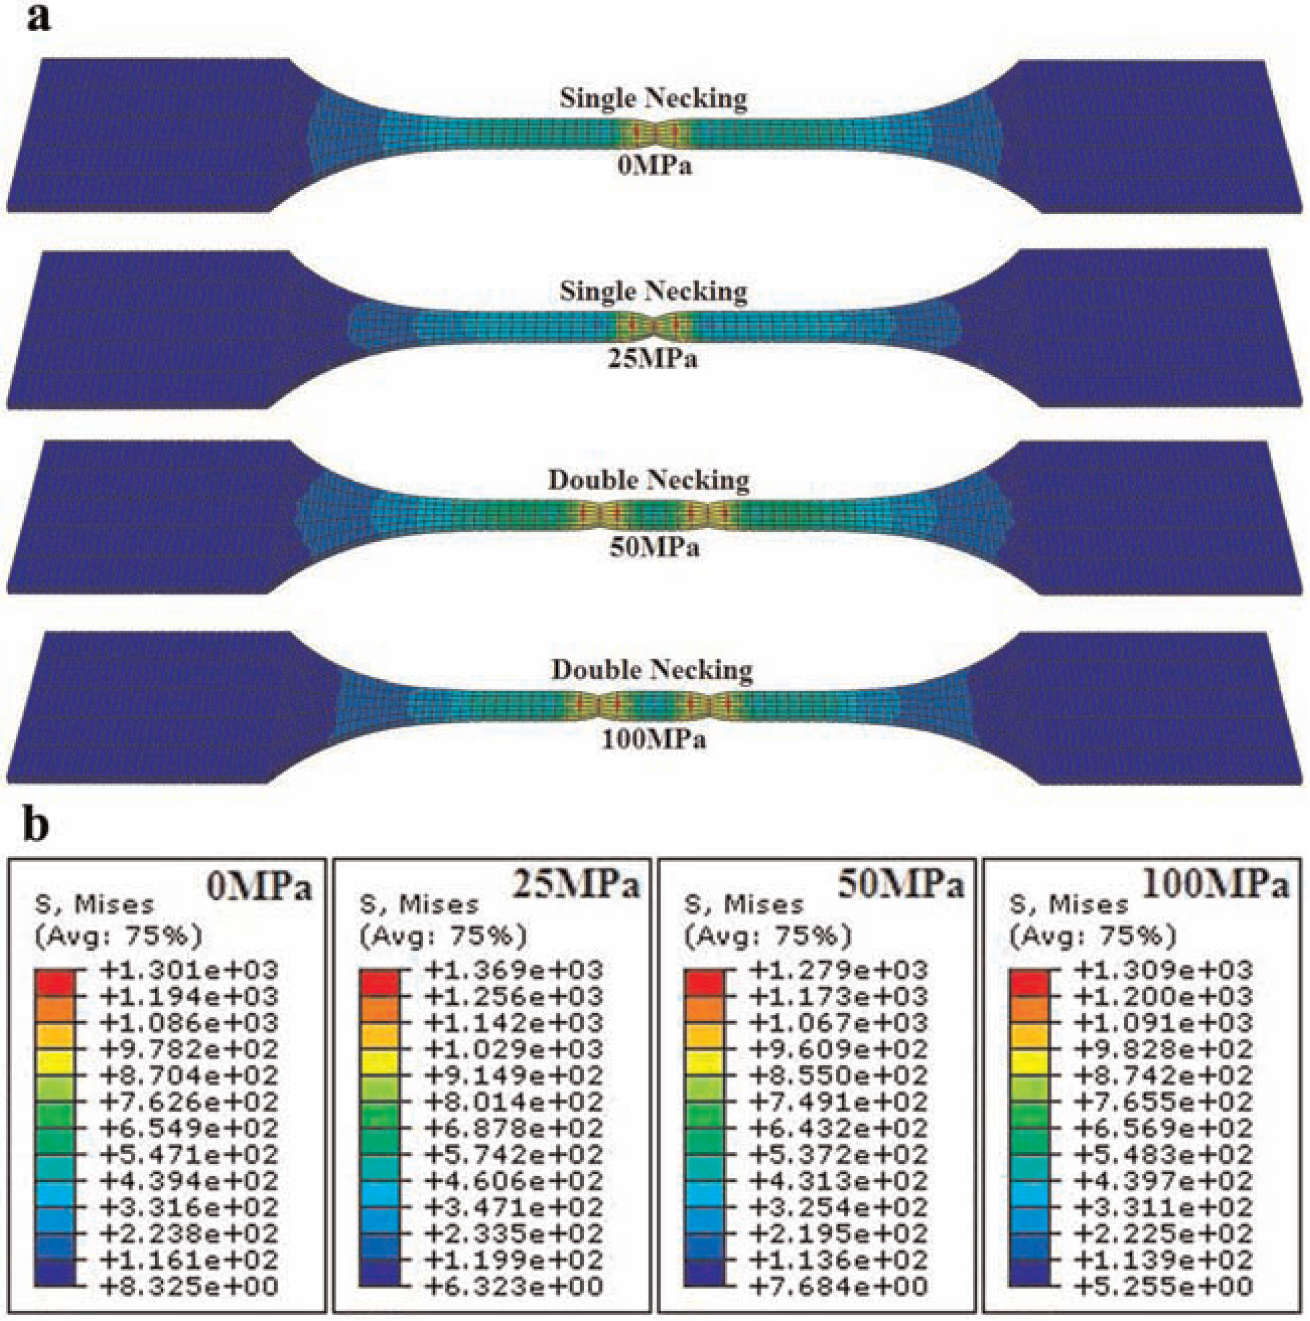
Comparison of von Mises nephogram under different fluid pressures: (a) nephogram and (b) scale.
Uneven deformation and stress lead to the generation of necking. When the volume of work hardening is less than the change of exterior stress, local distortion occurs. The zone where necking occurs is determined by the competition of stress concentration. The necking appears in the zone that meets the necking condition. The deformation will concentrate in the necking zone.
Due to the process of conventional uniaxial tension, stress state of the sheet is tensile stress in one dimension and strain state is tensile stress in one dimension and pressure stress in the other two dimensions. Under influence of fluid pressure, the stress state during tension deformation is a complex three-dimensional stress state, which is tensile stress in the axial direction and compressive stress in other directions. The strain state is tensile strain in one dimension and compressive strain in the other two dimensions. Compared with conventional uniaxial tensile, the pressure stress is larger in thickness and wide direction under the influence of fluid pressure. Furthermore, the probability that work hardening is less than the exterior stress is high. The stress concentration zones that meet the necking condition increase, thus the probability of “double necking” emergence also increases. In other words, the probability of “double necking” emergence increases with the increasing of fluid pressure.
At the same time, the stress distribution changes significantly in gauge length with the increasing of fluid pressure. In order to make an analysis of the stress distribution in different directions of sheet specimens intuitively, the sheet width stress (S11), axial stress (S22) and wall thickness stress (S33) of the sheet specimen under different fluid pressures with the same tensile deformation are analyzed. The center point of gauge length is defined as the origin of coordinates, and the equidistant points along the axial are fitted, as shown in Figure 5(a)–(e).
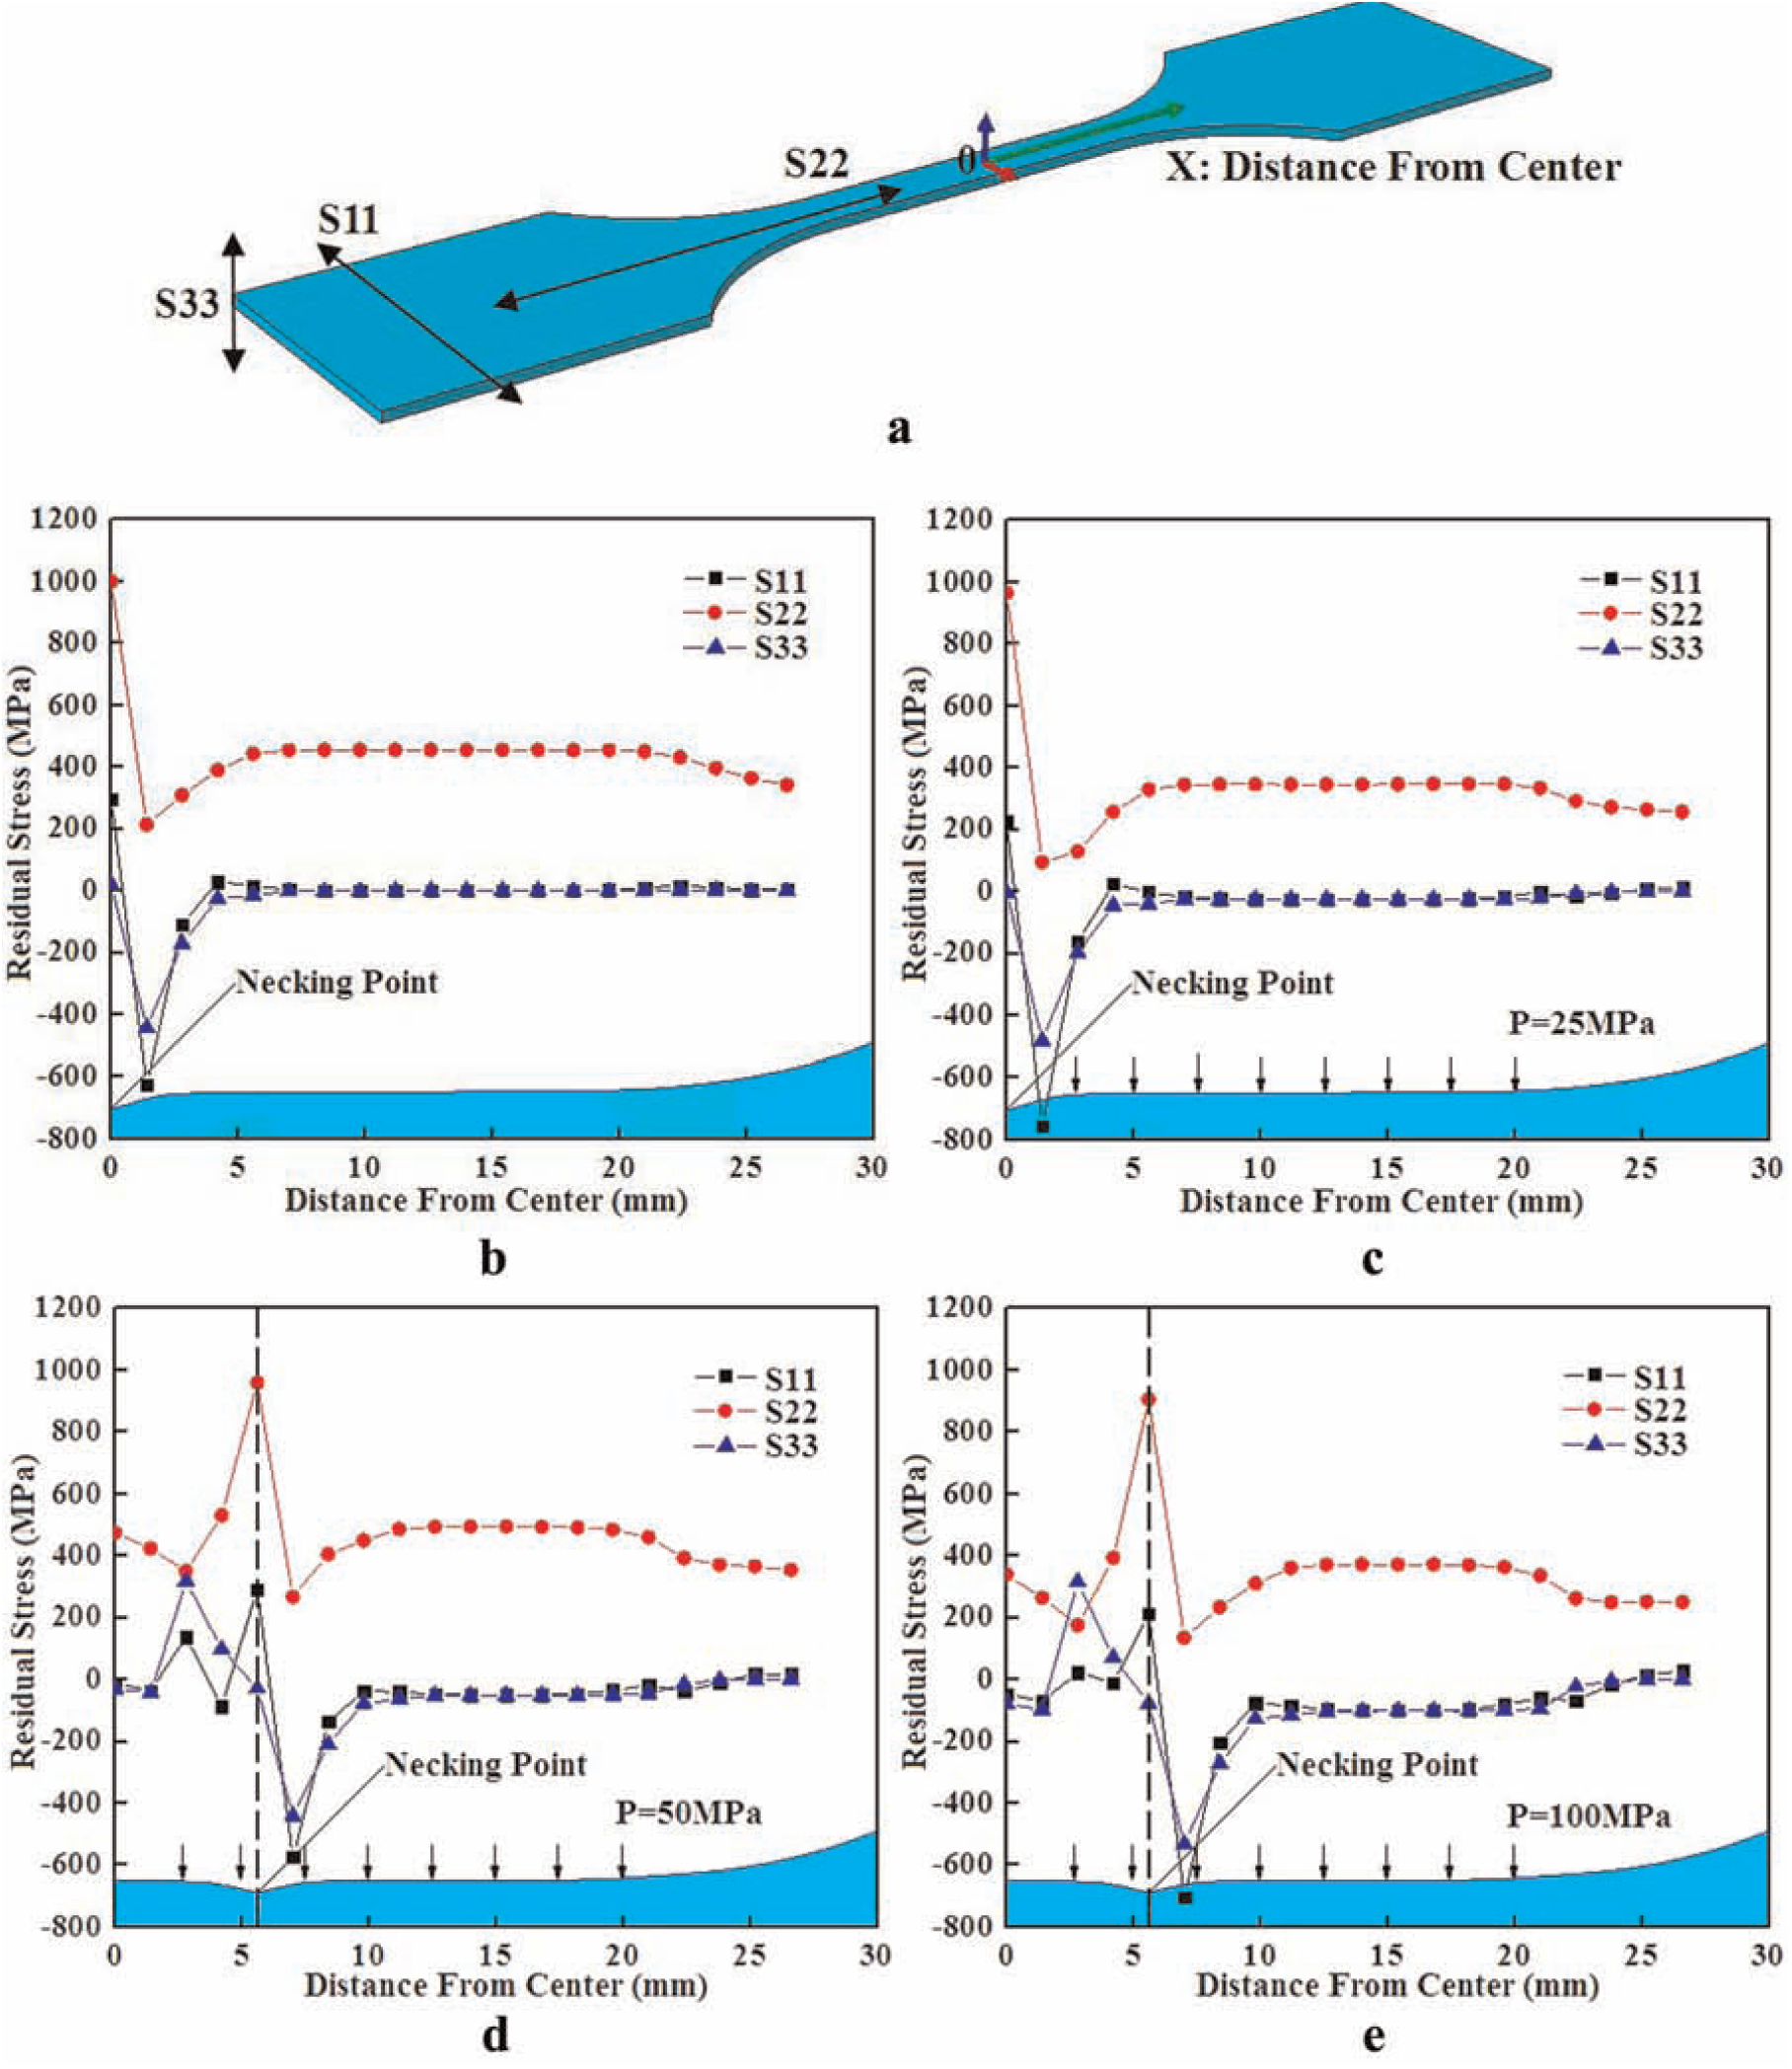
Comparison of distribution of stress component under different fluid pressures: (a) schematic representation of stress component and point location, (b) 0 MPa, (c) 25 MPa, (d) 50 MPa and (e) 100 MPa.
When the sheet specimen in the conventional uniaxial tensile test reaches the ultimate elongation, the comparison curves of major stress distribution along the axial in gauge length are shown in Figure 5(b). It can be seen from the figure that the distributions of the major stress component are different in different directions, and the stress concentration area is mainly located in the necking region, that is, the gauge center (origin of coordinates). All the major stress components reach a peak value here. The tensile stress along the width and axial direction are about 300 MPa and 1000 MPa, respectively. As the distance from the center of origin gets larger, all the stress components become unchangeable gradually. The stress components along the width and thickness direction tend to zero, and the axial tensile stress maintains at 400 MPa. When 25 MPa fluid pressure is exerted that is shown in Figure 5(c), the change of the major stress component in gauge length is not obvious, but the axial tensile stress component presents a decreasing tendency, maintaining about 380 MPa. The compression along the width and thickness direction stably maintains 25 MPa.
When the fluid pressure reaches to 50 MPa, which is shown in Figure 5(d), the distribution of the major stress is totally different from the former in gauge length. Under the effect of 50 MPa fluid pressure, the area that undergoes necking is not located at the center of gauge length but symmetrically distributed at both sides. The tensile stresses along the width and axial direction are 300 MPa and 983 MPa, respectively. The compressive stress along the thickness direction is about 30 MPa. Every major stress component fluctuates around the necking area. With the distance getting farther away from the origin center, the major stress along each direction gradually becomes stable and the axial stress maintains 500 MPa. The compression along the width and thickness direction maintains 50 MPa with the effect of fluid pressure. Under the condition of 100 MPa, as shown in Figure 5(e), the major stress distribution in gauge length presents a similar tendency as that under 50 MPa. What needs to be paid attention is that the major stress components in three directions of the necking area decrease, compared to that at 50 MPa. The major stresses along the width and axial direction decrease, but the decreasing tendency of the major stress component is not obvious. Each major stress component away from the center of specimen keeps unchanged. Compared to the axial stress with the 50 MPa fluid pressure, it presents a decreasing tendency and maintains 350 MPa. The stresses along the width and thickness direction are compressive stress, maintaining 100 MPa.
When the origin thickness of sheet is 0.95 mm, at the same elongation, the thickness variation and distribution of the specimen have been described under the effect of four different fluid pressures, as shown in Figure 6. The nephograms of single necking specimen and double necking specimen are shown at the top and bottom of Figure 6, respectively. Combined with wall thickness curves, it can be seen that the sheets reduce to 0.5 mm and 0.4 mm at the 0 MPa and 25 MPa fluid pressures, respectively. Thus, with the fluid pressure of 25 MPa, the plastic deformation of necking area is much greater than the conventional one. They reduce to 0.61 mm and 0.52 mm when the fluid pressures are 50 MPa and 100 MPa, respectively, while the thinning ratio at 100 MPa is larger than that at 50 MPa. Compared to single necking, the thinning ratio is lower when double necking occurs. The result illustrates that double necking can increase the uniformity to some extent under fluid pressure.
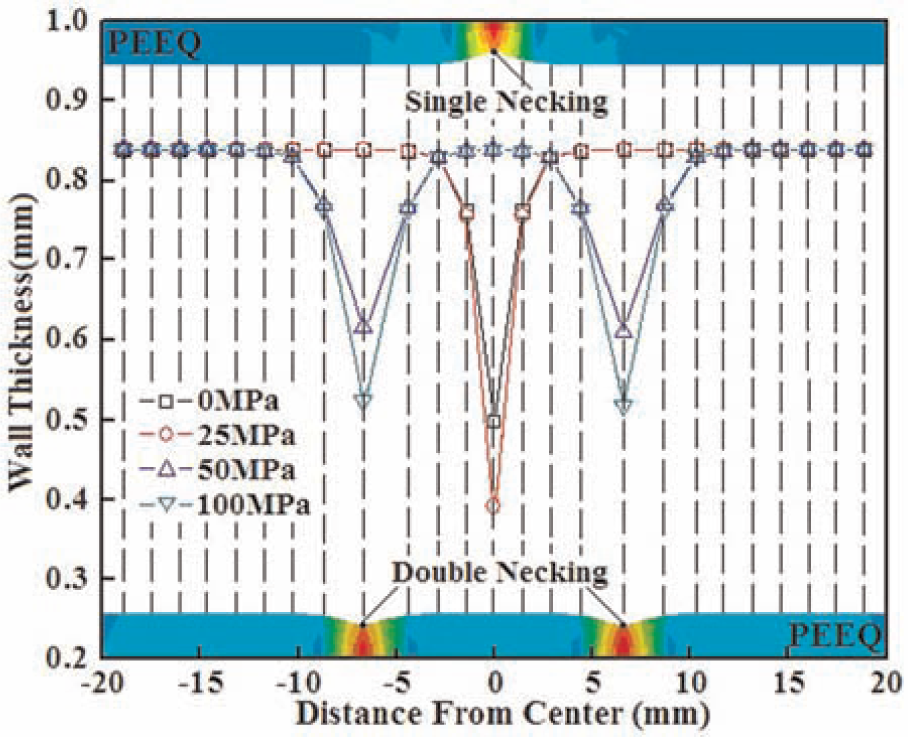
Comparison of distribution of wall thickness under different fluid pressures.
Forming property
Figure 7 shows the comparison of uniaxial tension results of two stainless steel sheet specimens of different thicknesses with and without fluid pressure. The specimens in the dotted boxes are stretched with fluid pressure, and the ones in the solid boxes are stretched in a conventional way without fluid pressure.
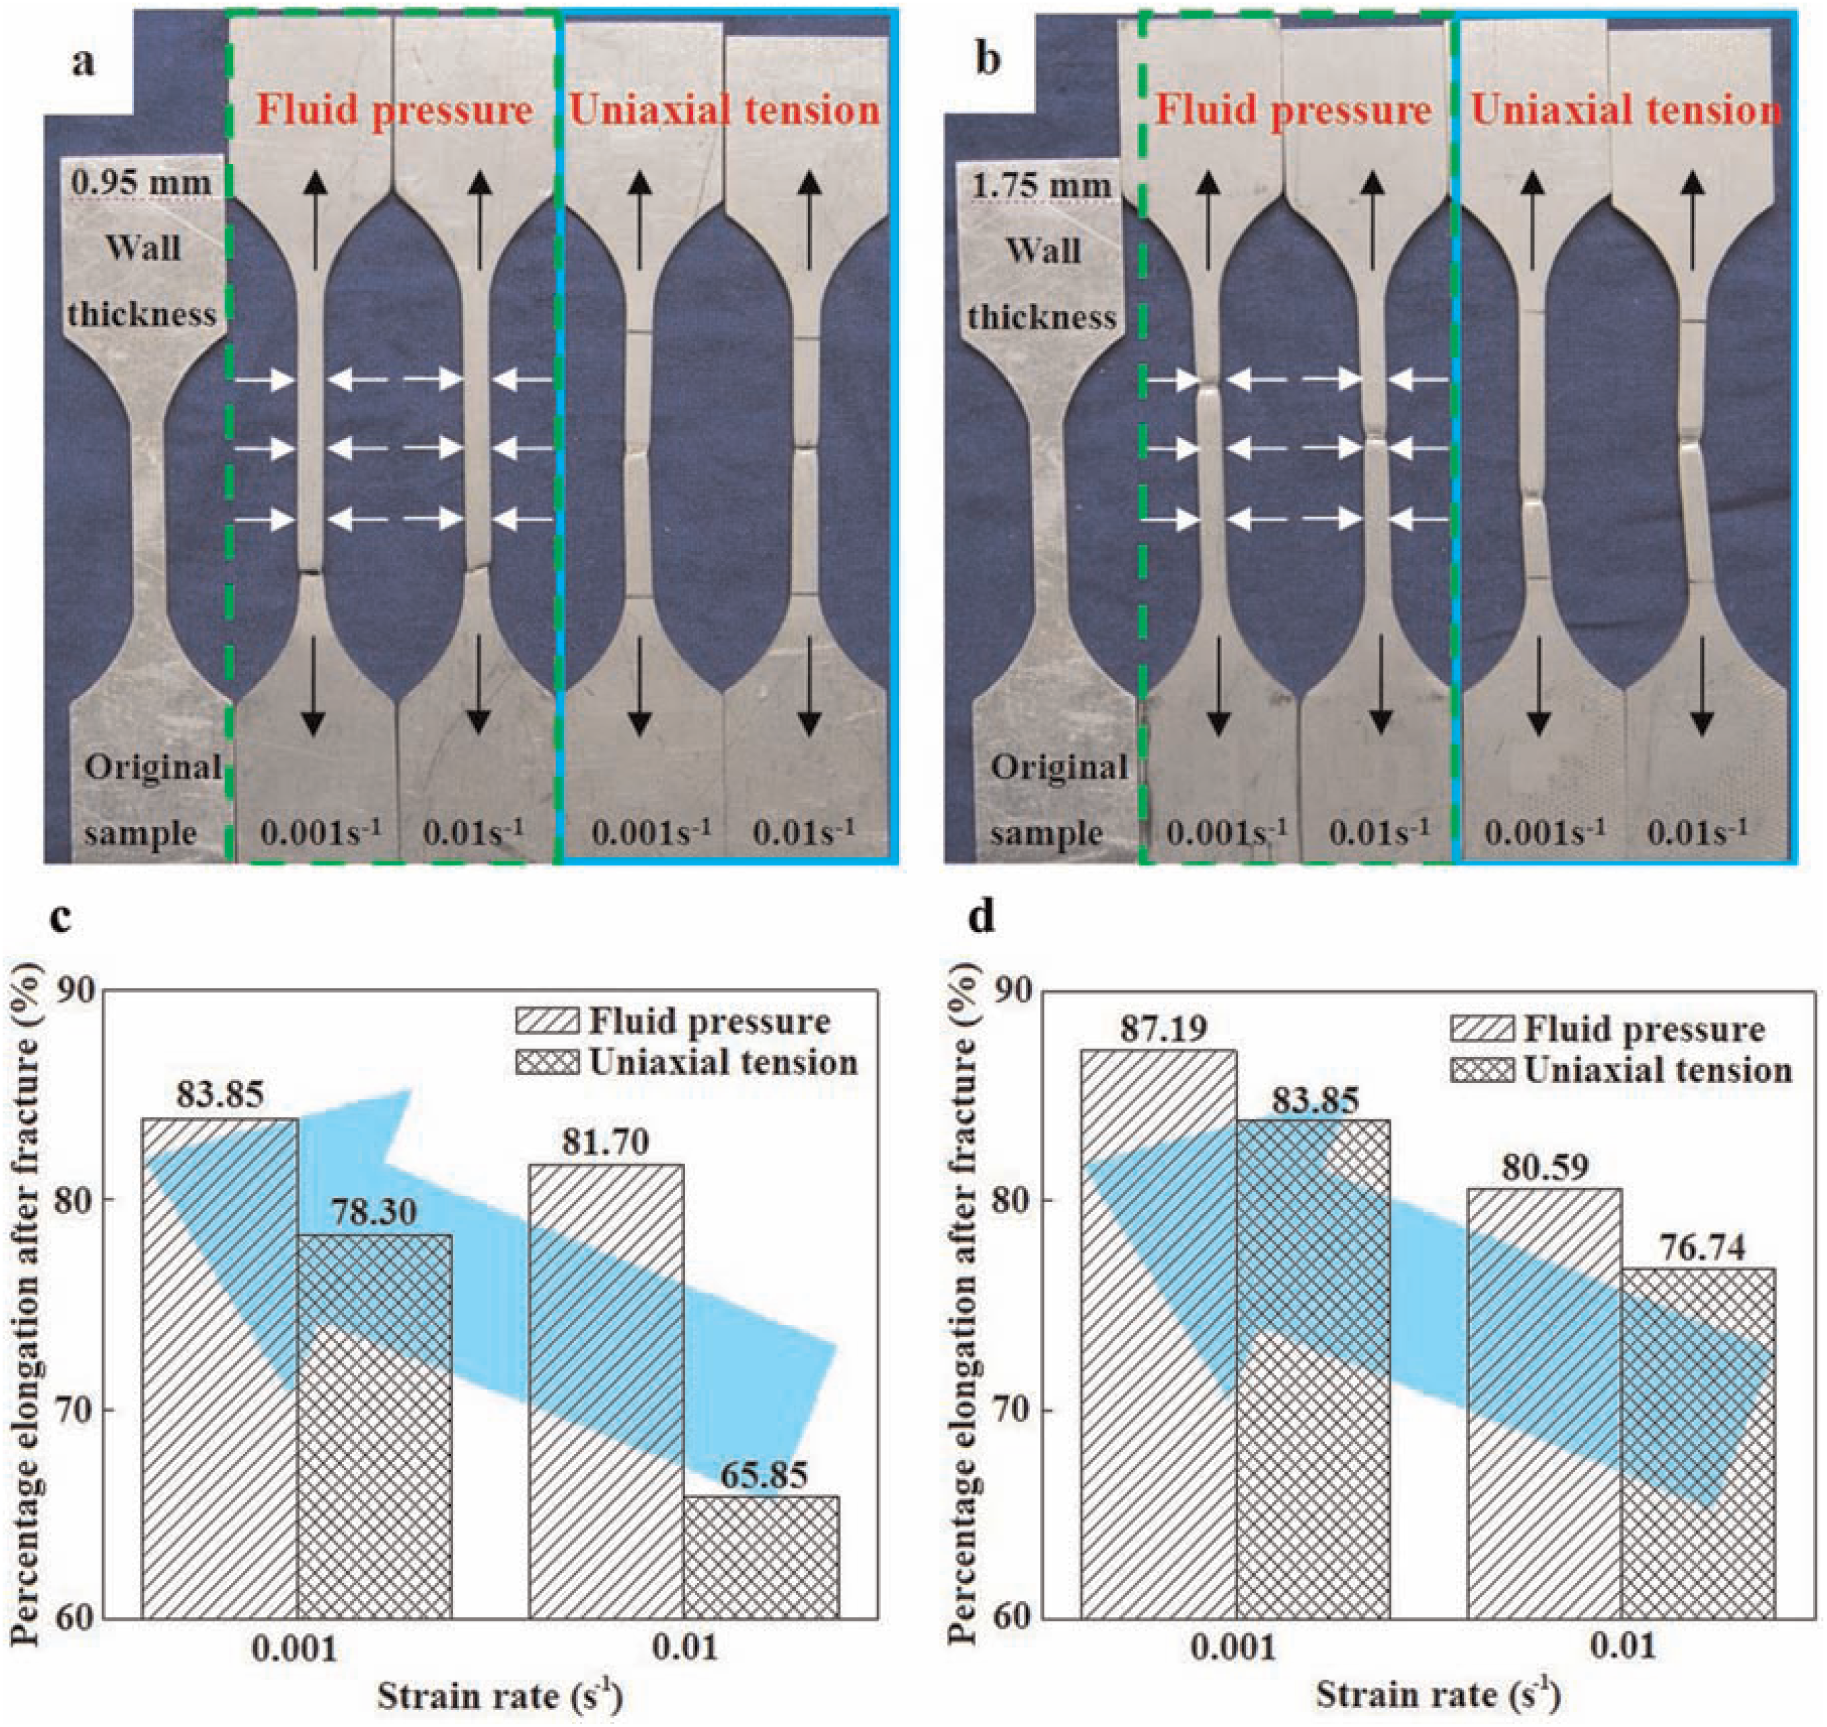
Results of the uniaxial tensile experiment of the sheet under fluid pressure: (a) shape change of 0.95-mm thickness specimens with and without the fluid pressure, (b) shape change of 1.75-mm thickness specimens with and without the fluid pressure, (c) column diagram of elongation of 0.95-mm thickness specimens after fracture, and (d) column diagram of elongation of 1.75-mm thickness specimens after fracture.
Figure 7 shows that, at the same strain rate, the elongation under fluid pressure has been improved to different degrees compared to conventional tensile deformation without fluid pressure. In addition, the effect of fluid pressure on thin sheets is more obvious than that on the thick ones. When the strain rates are 0.001 s−1 and 0.01 s−1, the corresponding elongations of 0.95-mm thickness stainless steel sheets after fracture are 78.30% and 65.85%, respectively. Under fluid pressure, the elongations of 0.95-mm thickness stainless steel sheets after fracture increase by 7.1% and 24.1%. At the same condition, the elongations of 1.75-mm thickness stainless steel sheets after fracture increase by 3.9% and 4.9%.
These results indicate that the elongation of thin stainless steel sheet after fracture is more easily affected by fluid pressure, and the increase of elongation after fracture is also enlarged with the increase of strain rate. It can be seen that the applied fluid pressure can markedly improve the elongation after fracture at a higher strain rate. Decreasing deformation rate is often used to increase the formability of sheet metal at room temperature, while the above experimental results provide another feasible way to increase the forming limit by applying fluid pressure.
Fracture morphology
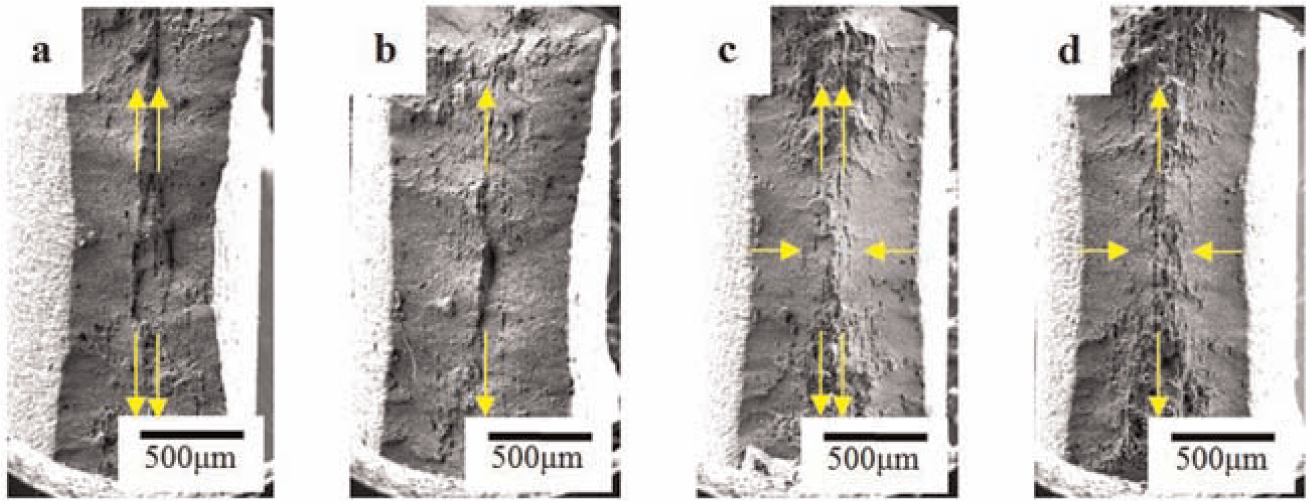
Applying fluid pressure on the sheet can change its uniaxial tensile deformation behavior, which has an important influence on the fractograph. In order to analyze it deeply, we observe and analyze the SEM fractographs of sheet specimens. Figure 8 shows the comparison of fracture morphology of the 0.95-mm thickness stainless steel sheets with and without fluid pressure at low magnification. In this scale, the fracture surface of conventional uniaxial tension specimen is flat. When the sheet is applied fluid pressure, ridge stripes are distributed on the fracture surface along the axis. Comparing Figure 8(c) with (d), it can be seen that the stripes have a single movement direction at the strain rate of 0.001 s−1, while the movement direction of stripes are disordered at the strain rate of 0.01 s−1.
Low-magnification SEM fractographs of 0.95-mm thickness fracture specimens: (a) conventional uniaxial tension (0.01 s−1), (b) conventional uniaxial tension (0.001 s−1), (c) under fluid pressure (0.01 s−1) and (d) under fluid pressure (0.001 s−1).
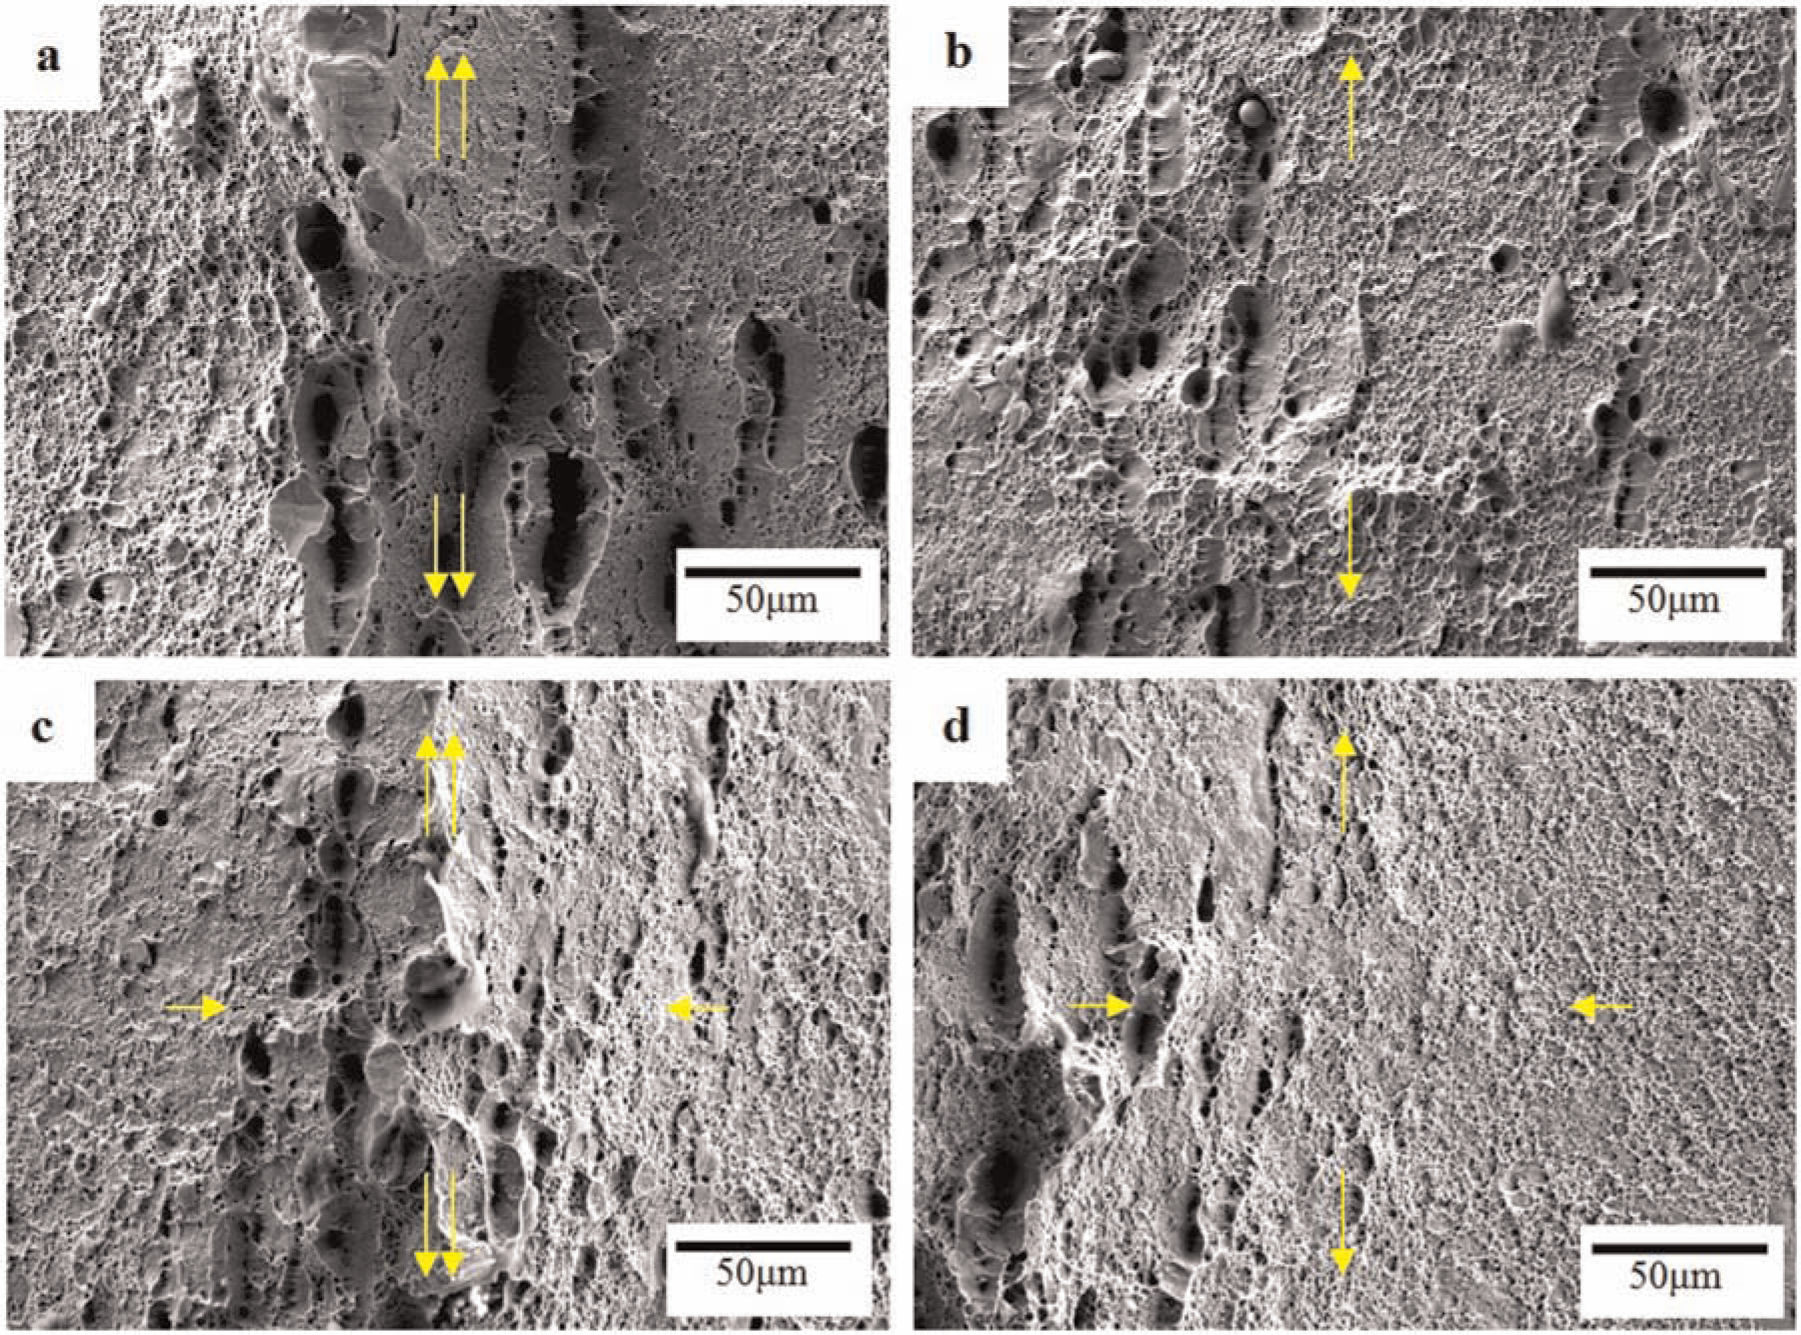
Figure 9 shows the fracture morphology of 0.95-mm thickness specimens with and without fluid pressure at various strain rates. According to Figure 9(a), the fracture of conventional uniaxial tension at the strain rate of 0.01 s−1 can be analyzed. It shows that the size of dimples on the fracture surface is not uniform, and there are less large-sized dimples. The main reason of their formation is the connection of small dimples after their nucleation and growth. Through observation of the fracture morphology, it can be seen that the boundary of shear lip and fiber area is obvious. In addition to the large-sized dimples, the depth of small dimples in the fiber area is shallow and some of them have a smaller diameter. The distribution of small dimples is disordered. However, the distribution of dimples in the transitional region has a clear direction, although there are many tiny dimples. Due to the shallow dimples in this region without any clear shear direction, the proportion of shear dimples and isometric tiny dimples in the shear lip region has changed. The amount of shear dimples is obviously larger.
SEM fractographs of 0.95-mm thickness fracture specimens: (a) conventional uniaxial tension (0.01 s−1), (b) conventional uniaxial tension (0.001 s−1), (c) under fluid pressure (0.01 s−1) and (d) under fluid pressure (0.001 s−1).
The fracture morphology of conventional uniaxial tension at a strain rate of 0.001 s−1 can be seen in Figure 9(b). In the central area, there are narrow and long shear ridges surrounded by many tiny dimples, which are distributed as equiaxed state. The long and narrow flaws in the shear ridges are linear and parallel to the sheet in width direction. Unlike the traditional dimples produced by holes, there are transverse fibrous textures on the undersurface of flaws. The amount of small-sized dimples in the transitional region is large, and some of those larger dimples present a certain orientation. In addition, the surface of the marginal shear lip is relatively smooth with little tiny dimples and shear dimples. The depth of those tiny dimples is shallow, while all the shear dimples have the same direction, and the direction of shear stress is same, too.
Figure 9(c) shows the fracture morphology of the sheet after the uniaxial tensile test with fluid pressure at the strain rate of 0.01 s−1. In the center of the sheet, there are many radial ridge-shape stripes, and the flaw is long and narrow. Both sides of the long axis are apparently affected by normal stress, and the characteristics can also be found in the surrounding cracks. In transitional region, the dimples have long and narrow elliptical shape and some are even like the sharpened linear flaws. The other dimples which discretely distribute in this area are all small and shallow. The shear lip area on both sides has a smooth surface, and it is close to inward with an obvious orientation. But the shear extent in shear lip area is severer than that in the transitional region.
Figure 9(d) indicates the fracture morphology of the sheet after the uniaxial tensile test with fluid pressure at the strain rate of 0.001 s−1. In the middle of the sheet, the radial ridge-shape stripes are all closed to inward and their trends are much more obvious than those in Figure 9(c). The inside of the linear flaws are full of tiny dimples whose distribution is even and linear. The left and right shear lips are taken for micro level analysis. Under the effect of fluid pressure, the tiny dimples separated inward with shear deformation in shear lip area and the small-sized dimples in transitional region are distributed evenly.
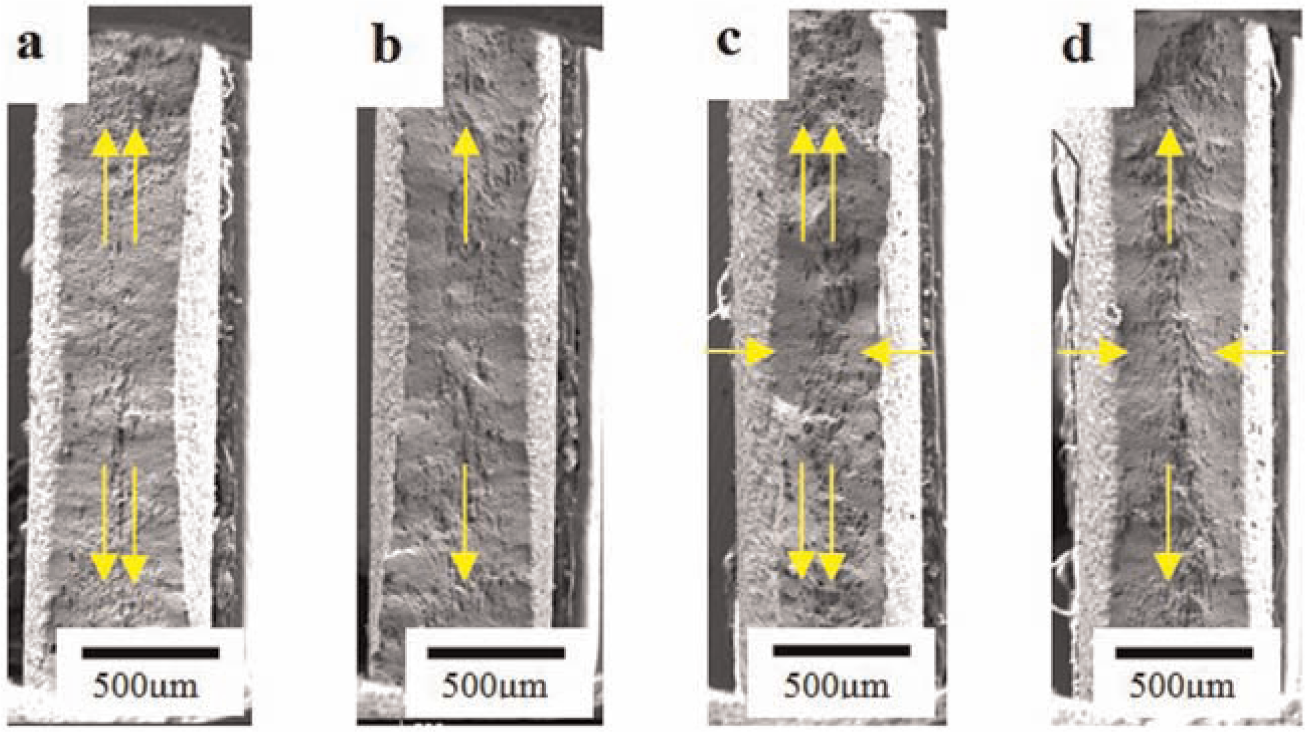
As mentioned above, in order to analyze the principle how fluid pressure affects the performance of stainless steel sheets with different thicknesses, Figure 10 shows the comparison between fracture morphology of 1.75-mm thickness stainless steel sheets with and without fluid pressure.
Low-magnification SEM fractographs of 1.75-mm thickness fracture specimens: (a) conventional uniaxial tension (0.01 s−1), (b) conventional uniaxial tension (0.001 s−1), (c) under fluid pressure (0.01 s−1) and (d) under fluid pressure (0.001 s−1).
Based on Figure 10(a) and (b), the central area of fracture of thick sheet under the conventional uniaxial tensile test has a straight line shape and the other regions are much flatter. There is no obvious herringbone distribution on the surface of fracture, and the source of flaw is located in the central area. From Figure 10(c) and (d), it can be seen that under normal pressure, the ridge-shape stripes distribute on the central area of fracture surface and the ridge-shape stripes have a certain orientation, which corresponds to the direction of normal pressure.
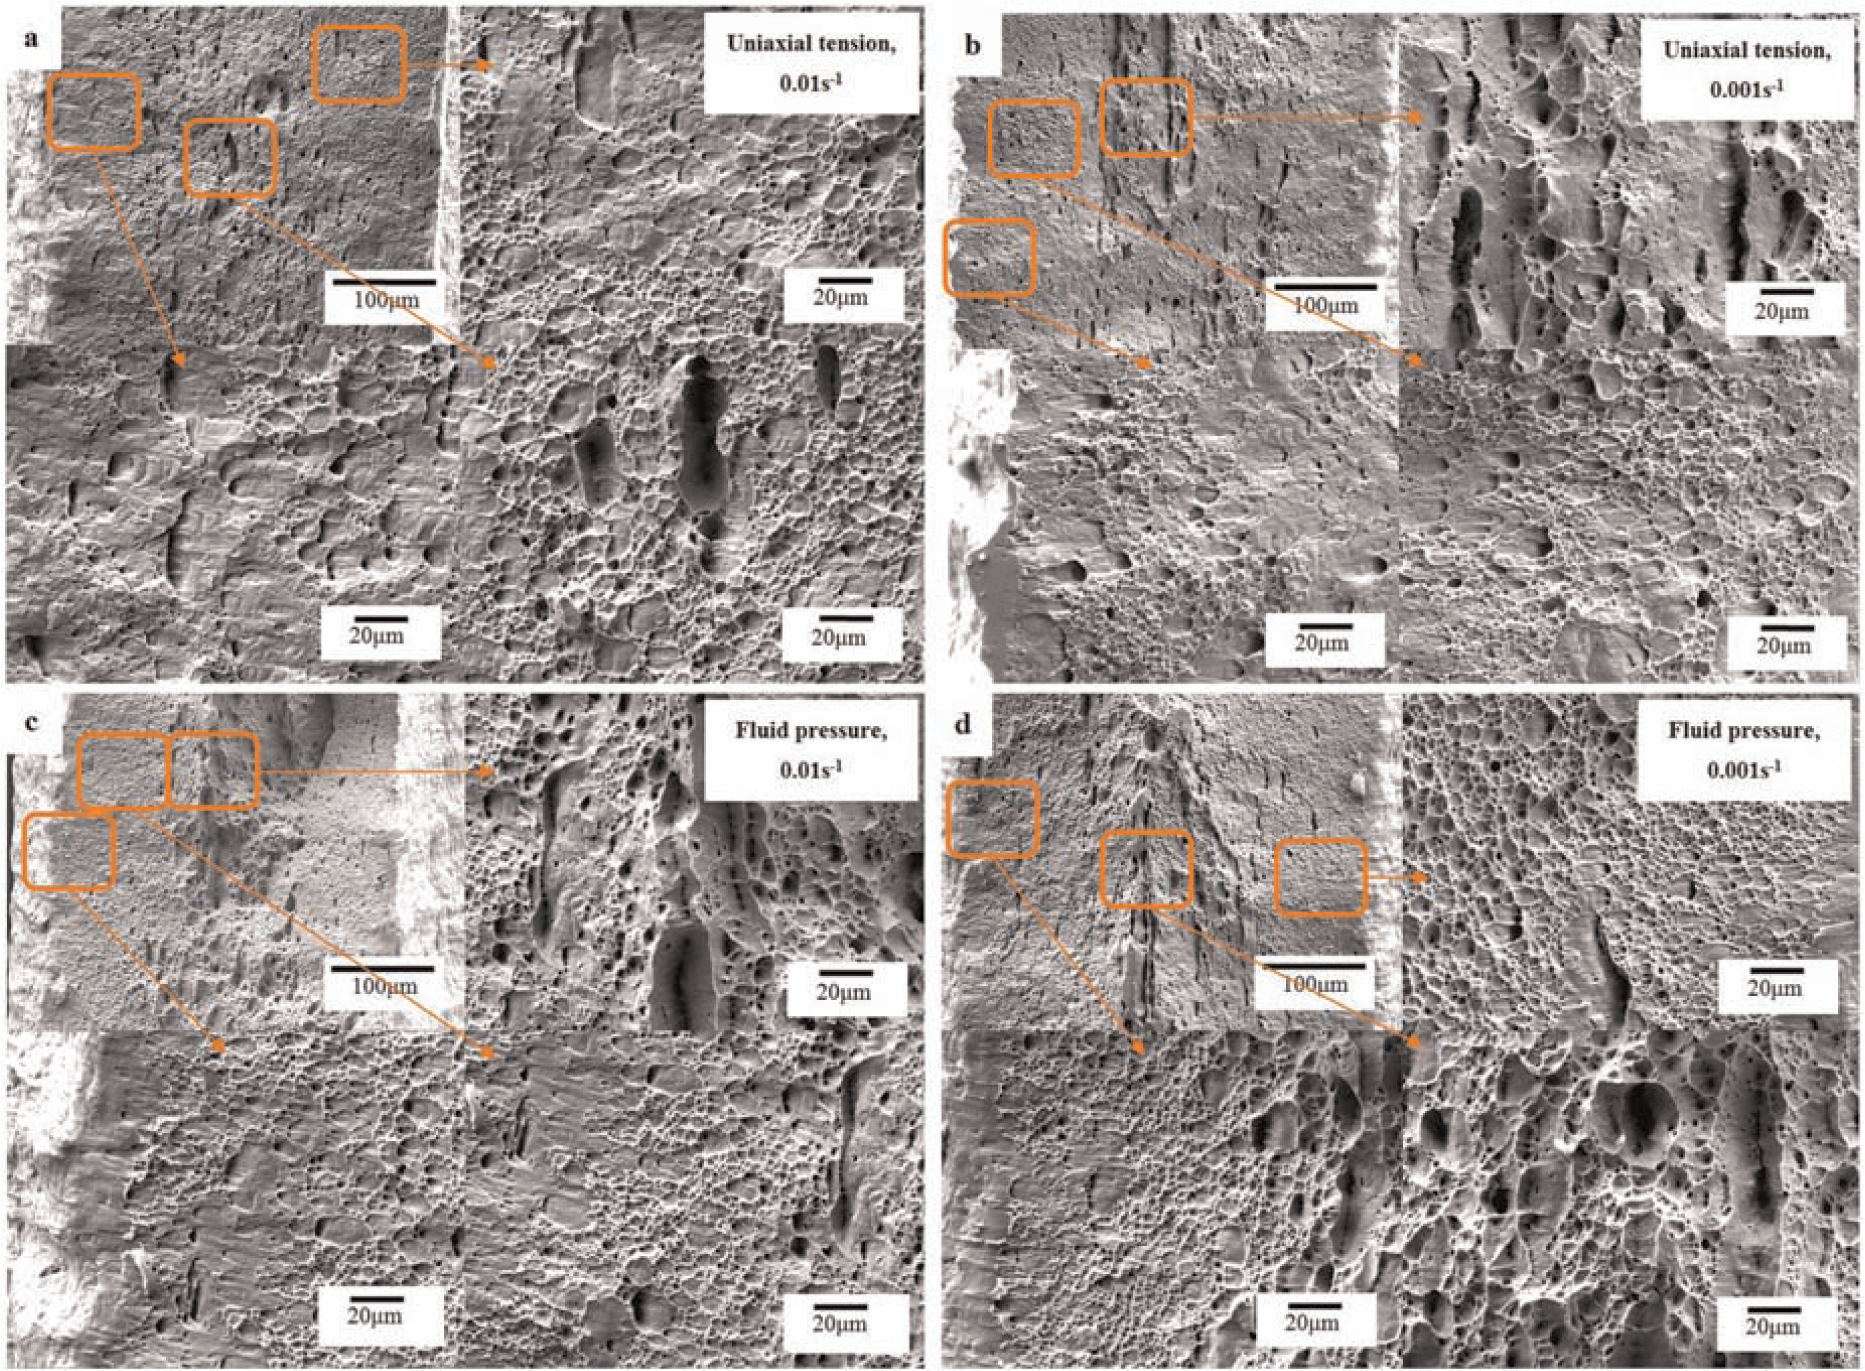
Figure 11(a)–(d) show the fracture morphology of 1.75-mm thickness stainless steel sheets. It can be seen that the macro morphology with and without the effect of fluid pressure is approximately the same. Figure 11(a) shows the central straight line area under conventional uniaxial tension at high strain rate. It has an obvious shearing section, and the holes are inhomogeneously distributed. The configuration is cluttered, and the sizes of dimples are not uniform. Figure 11(b) shows the fracture morphology of the central area under conventional uniaxial tension at the strain rate of 0.001 s−1. The dimples are homogenously distributed and tend to become equiaxed. Some large-sized dimples are surrounded by small-sized dimples. Figure 11(c) shows the ridge-shape stripe area of fracture at high strain rate with fluid pressure. The sizes of dimples on both sides of the ridge are almost the same, and these dimples are distributed along the axis with elliptical shapes. It indicates that these dimples are inhibited by fluid pressure along the direction of thickness during the growth and connection of the dimples. Figure 11(d) clearly shows the fracture morphology in the central area under fluid pressure at the strain rate of 0.001 s−1. The distribution of equiaxed dimples has a certain direction and is near the side of central axis, the sizes of dimples are larger while their number is relatively small.
SEM fractographs of 1.75-mm thickness fracture specimens: (a) conventional uniaxial tension (0.01 s−1), (b) conventional uniaxial tension (0.001 s−1), (c) under fluid pressure (0.01 s−1) and (d) under fluid pressure (0.001 s−1).
In order to observe the distribution of the tiny dimples on the fracture surface, parts of above fracture morphology are magnified as in Figure 12. Under conventional uniaxial tension, the sizes of dimples are different and they grow evenly along three directions before they become round equiaxed dimples. Compared to the fracture under uniaxial tension with fluid pressure, the dimples are deeper and larger. The dimples with fluid pressure have a uniform distribution, and most of these dimples are shallower. In this scale, the orientation of dimples is not so obvious. As cracks appear, the deformation in the thickness direction is constraint. Both the stress and strain here are three dimensional. This is because the normal pressure has weakened the stress of sheet under axial tension and delayed the expansion of tiny cracks. In this way, it restrains the cavity growing along the thickness direction and finally delays the fracture of sheet to improve its deformation capability.
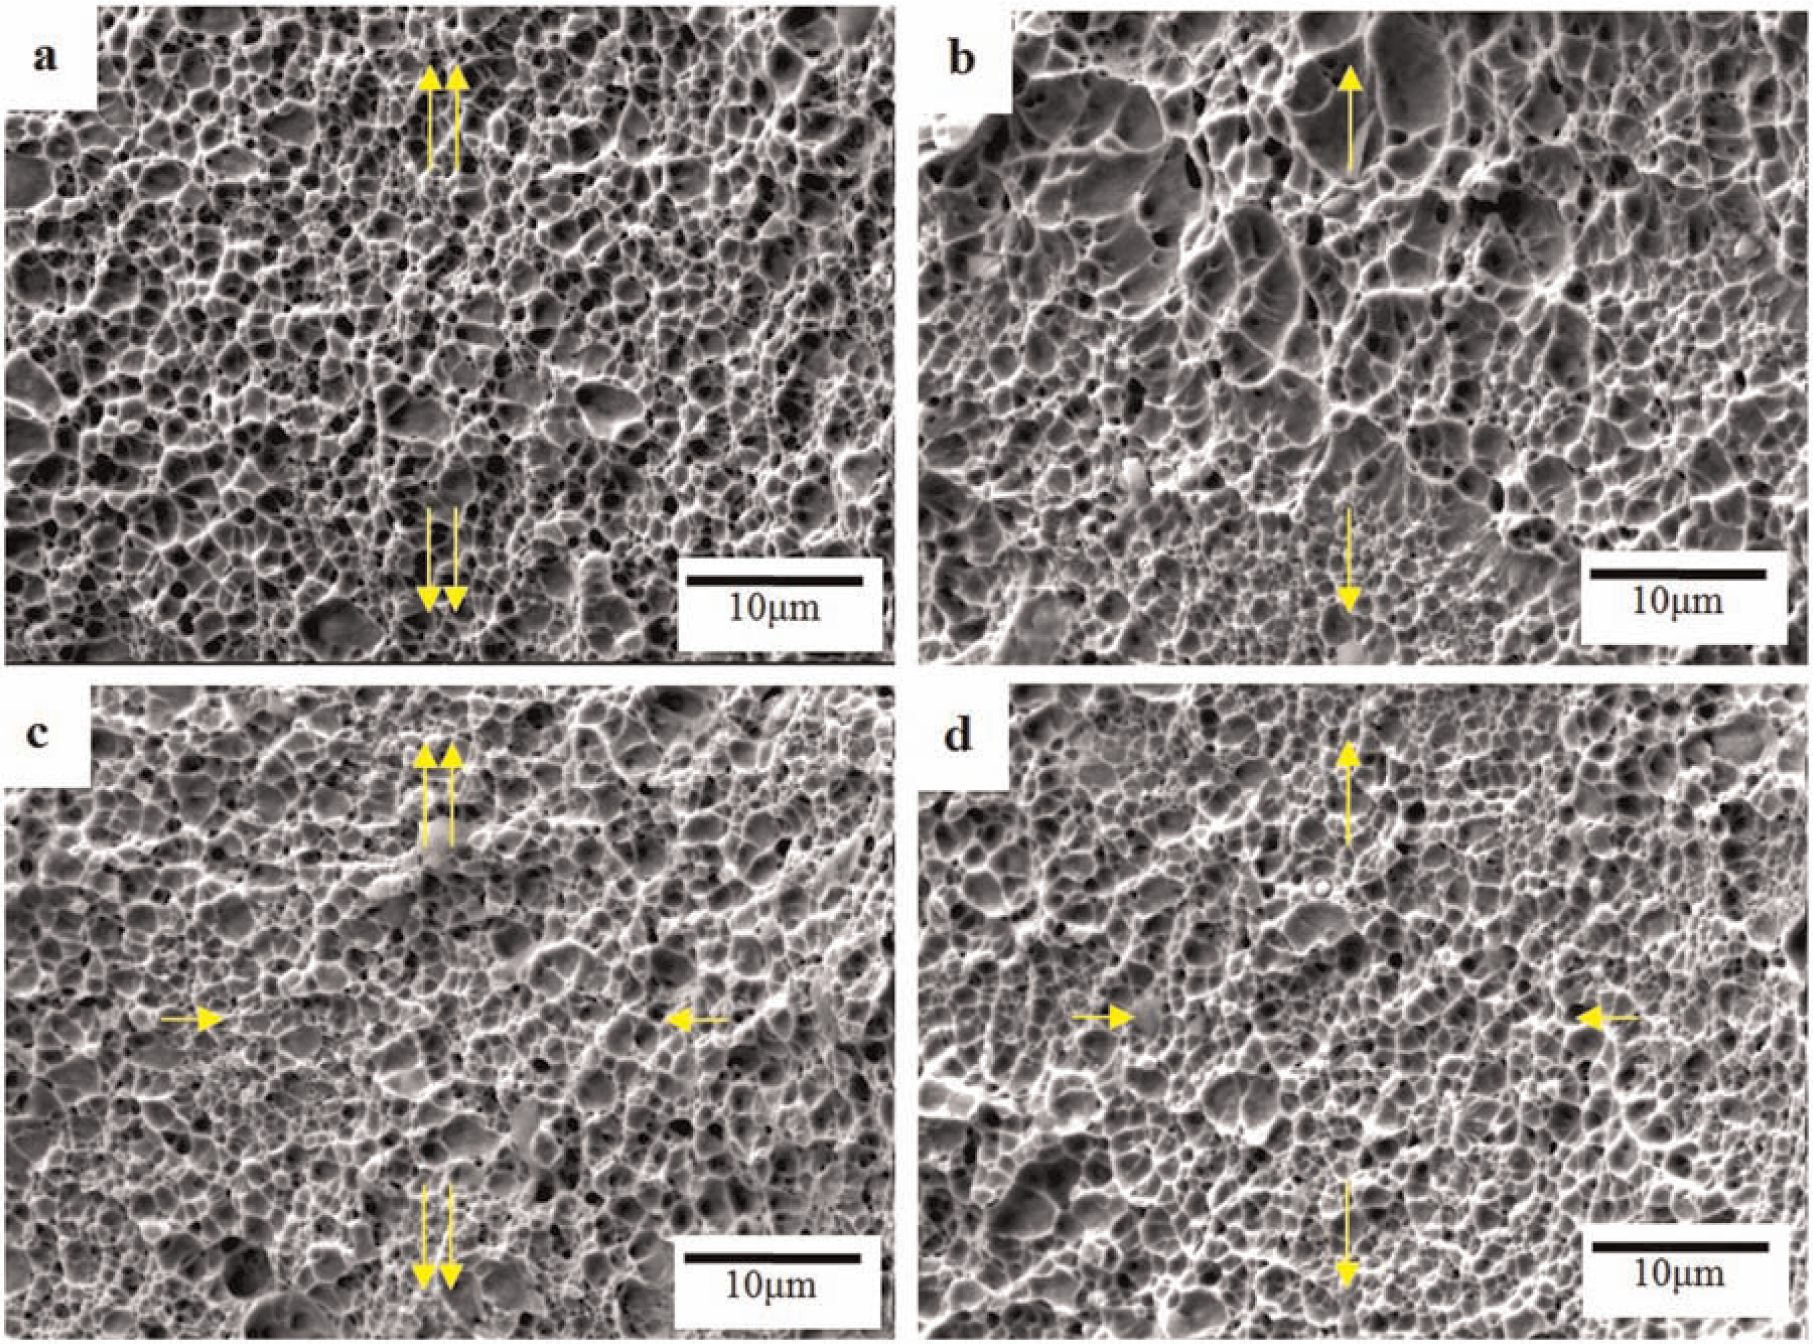
High-magnification SEM fractographs of 1.75-mm thickness fracture specimens: (a) conventional uniaxial tension (0.01 s−1), (b) conventional uniaxial tension (0.001 s−1), (c) under fluid pressure (0.01 s−1) and (d) under fluid pressure (0.001 s−1).
According to the description of damage variable in damage mechanics, the percentage of the area of cracks or the area of cavities on the cross section of sheets can be defined as damage degradation operator. It is assumed that the tiny cracks are isotropically distributed and an arbitrary element (Figure 13) on the surface of fracture is taken. If F is the axial load which is applied on this element, Ac is the element’s projected area that is perpendicular to F on the plane of fracture, and Ay is the effective bearing area of this element. It can thus be seen that
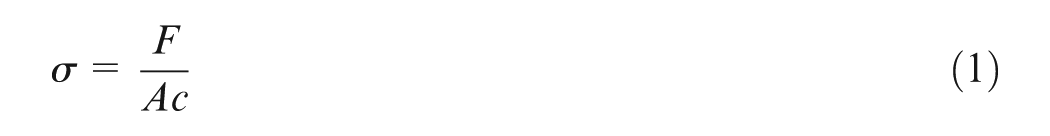
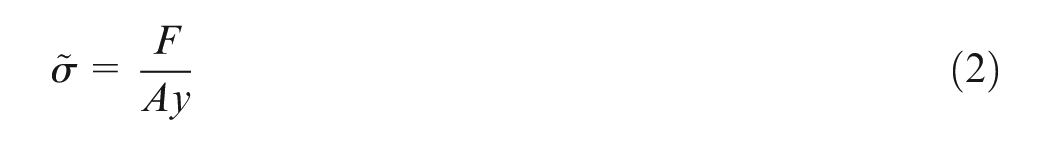
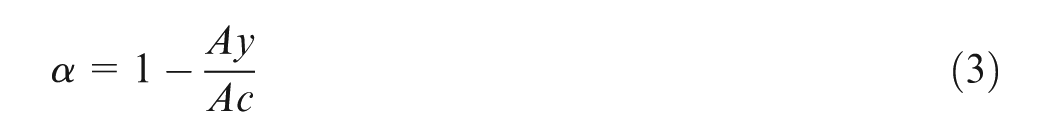
where
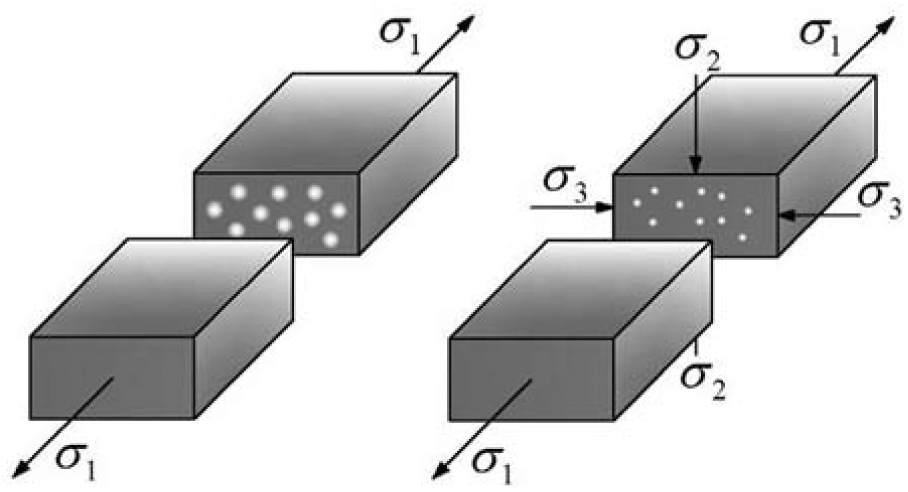
Damage element under different stress states.
Conclusion
Experimental apparatus and dedicated fixtures for sheet metal uniaxial tensile test under fluid pressure are designed in this article. The assessment for forming properties of sheet metals under the controllable three-dimensional stress is realized. The limitation of dynamic sealing technology aiming at the non-circular section under fluid pressure has been solved.
When the fluid pressure increases to a certain value, “double necking” phenomenon presents in gauge area. Compared to conventional uniaxial tension, the peak equivalent stress value in “double necking” region has decreased. Each major stress component changes with the increase of fluid pressure in gauge length. The thickness thinning rate of the sheet with “double necking” is obviously lower than the one with “single necking.”
Fluid pressure can effectively improve the elongation of 304 stainless steel sheet. When the strain rates are 0.001 s−1 and 0.01 s−1, the elongations of 0.95 mm specimens increase by 7.1% and 24.1% respectively, and the elongations of 1.75 mm specimens increase by 3.9% and 4.9% respectively.
The SEM fracture morphology analysis shows that 0.95-mm stainless steel sheet presents ridge shape under the influence of fluid pressure, and the dimples on both sides are close to the center. Compared to simple uniaxial tension, most of the tiny dimples on the fracture surface are small and shallow. The fracture morphology of 1.75-mm stainless steel sheet is similar to the former (0.95 mm). Besides, the shallow dimples with small sizes and uniform distribution can improve the macro plastic elongation rate of materials.
Footnotes
Declaration of conflicting interests
The authors declare that there is no conflict of interest.
Funding
This work is financially supported by Major State Basic Research Development Program (No. 613152), Program for New Century Excellent Talents In Heilongjiang Provincial University (No. 1253-NCET-008) and the Scientific Innovation Project for Graduate of Heilongjiang Province (No. YJSCX2012-100HLJ). The authors would like to take this opportunity to express their sincere appreciation.