
Abstract
Laser bending is an innovative technique to obtain the required bend-angle and sheet metal curvature by means of laser beam irradiation with controlled laser parameters. In this work, a numerical investigation on curvilinear laser bending of magnesium M1A aoy sheets has been carried out. Three-dimensional sequential transient thermomechanical numerical model is developed by using finite element method. The model has been validated by comparing the predicted results with those obtained in the experiments. The curvilinear laser bending process is studied in terms of temperature distribution, stress–strain distribution, bend angle and displacement at the edges. The results showed that the bend angle increases with increase in scanning path curvature. It is observed that the displacement at various edges and final shape of the worksheet are affected by the scanning path curvature. The results will be useful in adjustment and alignment processes and the generation of complex shapes using lasers.
Keywords
Introduction
Laser bending is a noncontact type of advanced manufacturing process to bend the sheet metal worksheet by means of laser beam irradiations. 1 The process is suitable for a wide range of materials, including metals, nonmetals, ceramics and composites.2–4 The important features of the laser bending process are as follows: spring-back is not present, forming at inaccessible areas is possible, complex shapes can be generated with different irradiation strategies, possibility of bending brittle materials and the process can easily be controlled.5,6 Laser bending has many applications in ship-building, aerospace, automobile, medical and microelectronics industries for prototype bending, spatial forming, design shape correction and welded component alignment. 7 In this process, the controlled laser beam irradiates over the worksheet surface as shown in Figure 1. The important controlling parameters are laser power, scanning velocity and laser beam diameter. The laser beam diameter can be controlled by changing the stand-off distance. The laser beam irradiation generates nonuniform thermal stresses in the worksheet. Due to uneven mechanical restraint and temperature distribution, the bend angle is not uniform along the scanning line and is called as “edge effect.” 8
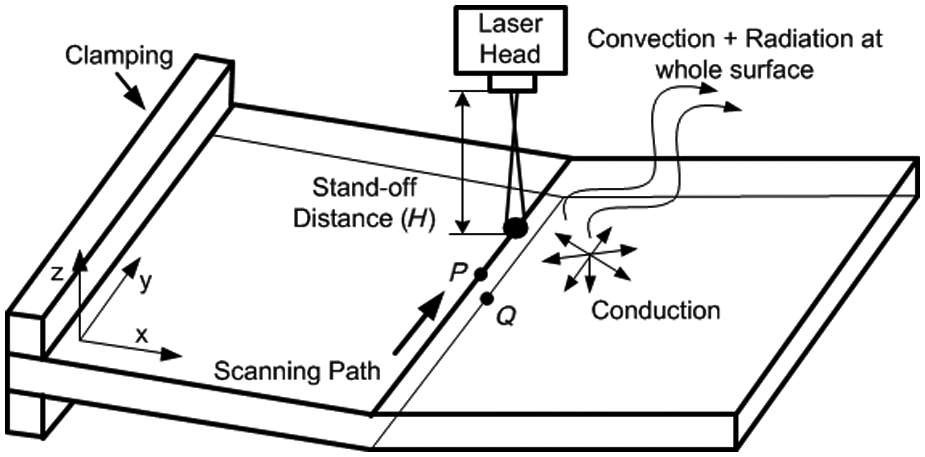
Schematic representation of laser bending process.
Magnesium M1A alloy is one of the lightest structural materials with low density, high specific strength and stiffness, superior damping capacity, high thermal conductivity and good electromagnetic shielding characteristics. 9 Therefore, it is widely used in the manufacture of structural components required for automobile, aviation and aerospace applications. It is also used in the manufacture of parts needed for consumer electronics applications such as cell phones. 10 Magnesium alloys have low ductility at room temperature due to hexagonal crystal structure. This restricts the precision bending of magnesium alloy sheets by using mechanical bending operations. However, the formability of magnesium alloys was found to be improved at elevated temperatures of about 250 °C due to thermal activation of pyramid sliding planes in the hexagonal structure. 11 Therefore, it was found to be interesting to study the behavior of magnesium alloys under the operation of laser bending process.
Literature reports various experimental and numerical studies to generate the complex shapes by using various laser beam irradiation strategies. Kyrsanidi et al. 12 presented experimental and numerical analyses of straight line laser bending of steel plate to generate sine-shape. Hennige 13 investigated the differences in the forming behavior of sheet metal parts using straight and curved laser beam irradiations. Bao and Yao 14 showed that the edge effects are characterized by a concave pattern in buckling mechanism (BM) and a convex pattern in temperature gradient mechanism (TGM). Shen et al. 8 proposed that the combination of acceleration and deceleration scanning scheme can minimize the edge effects. Li and Yao 15 postulated a new scheme to get a confirmed convex shape. Kim and Na 16 presented two distance-based and angle-based algorithms to generate laser scanning path for desired shape generation. Later, they adopted recalculation methods for better accuracy. 17 Liu et al. 18 presented an optimal approach to determine the laser scanning paths and heating conditions for laser forming of doubly curved shapes. Ojeda and Grez 19 worked on stepped scanning patterns to get higher degree of bend angle.
Some work has also been reported on curvilinear laser beam irradiations. Chen et al. 20 have studied the deformation behavior of laser curved bending of sheet and found that the deformation occurs only on one side of the scanning path along which the rigid constraint is relatively lower. Zhang et al. 21 found that the peak temperature at the scanning surface increases with increase in laser beam scanning path curvature. Venkadeshwaran et al. 22 have studied the deformation behavior of circular plate subjected to various patterns of circular laser beam irradiation.
From literature review, it was noted that a number of experimental and numerical investigations are reported on irradiation strategies to generate complex shapes and to control the edge effect. Most of the presented work is focused upon the straight line laser beam irradiations. Scant literature is reported on the study of effects of curvilinear laser beam irradiation parameters, particularly the effect of its arc height on the deformation behavior, temperature distribution and warping of the worksheet. A need thus exists to investigate the effect of scanning path curvature on bend profile, bend angle and edge displacements in curvilinear laser bending process. This work is an attempt in this direction.
Development of finite element method–based numerical model
In this work, nonlinear transient thermomechanical analysis of curvilinear laser bending process is carried out by using finite element method (FEM). The approach of thermomechanical analysis is shown in Figure 2. Initially, the thermal analysis is carried out by employing various input process parameters such as worksheet geometry, material properties, laser power, scanning velocity, laser beam diameter and the scanning path. Based on the predicted temperature distribution during thermal analysis, various performance parameters, namely, induced stress−strain distributions, distortions and bend-angle distributions, were computed in the mechanical analysis.
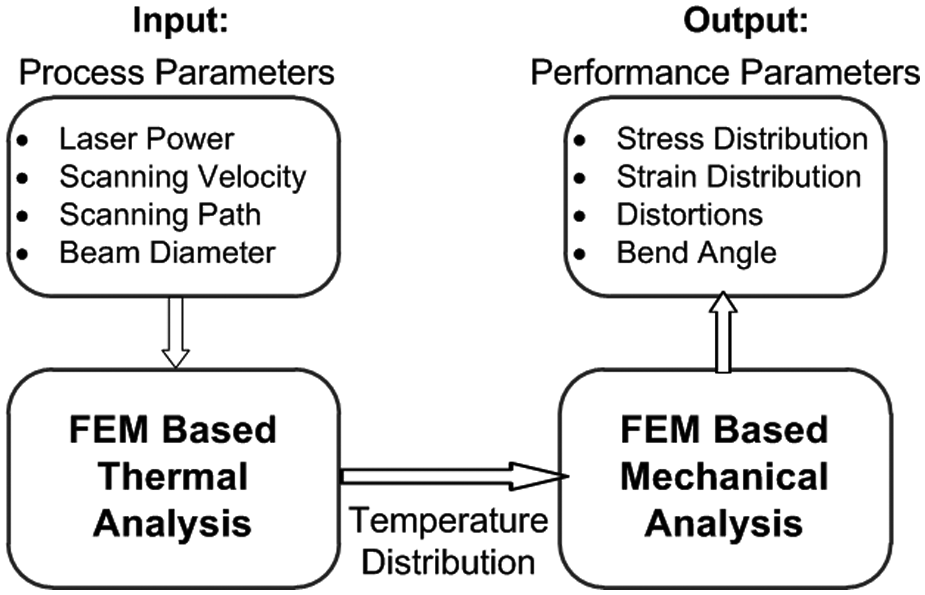
Schematic representation of thermomechanical analysis.
Assumptions
Thermomechanical modeling of laser bending process involves complex nonlinear interaction between laser process conditions, material properties and worksheet geometry. However, it is difficult to incorporate all the nonlinear properties, process conditions and their interactions. Therefore, some assumptions are considered during the development of the present numerical model. The important assumptions are as follows.
The workpiece material is isotropic and homogeneous.
The laser parameters are selected such that negligible amount of melting occurs. Therefore, effect of melting is not considered.
Von Mises criterion is used for plastic yielding, which is suitable for the ductile materials.
The sheet metal is considered flat and free of residual stresses.
The energy dissipation due to plastic deformation is neglected as compared with the laser heat applied.
Heat flux model
The Gaussian distributed constant speed moving laser heat source was modeled and applied on the worksheet surface. The scanning path was defined by using arc height (h) and arc length (L) as shown in Figure 3. The scanning path curvature was changed by changing arc height (h). The arc height is related to the scanning path radius (RSP) by the following equation
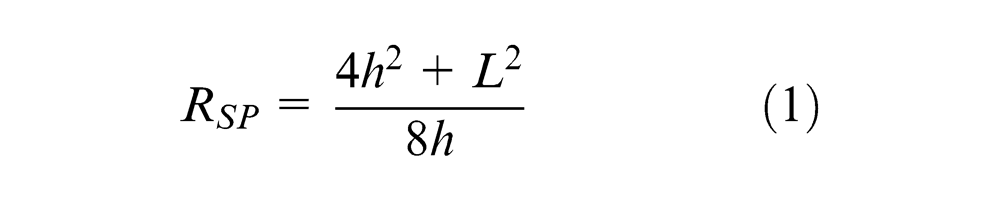
The higher value of h results in lower value of path radius and hence higher scanning path curvature. Therefore, the arc height is directly proportional to the scanning path curvature. It is to be noted that the irradiation path is a straight line when the arc height (h) is equal to zero.
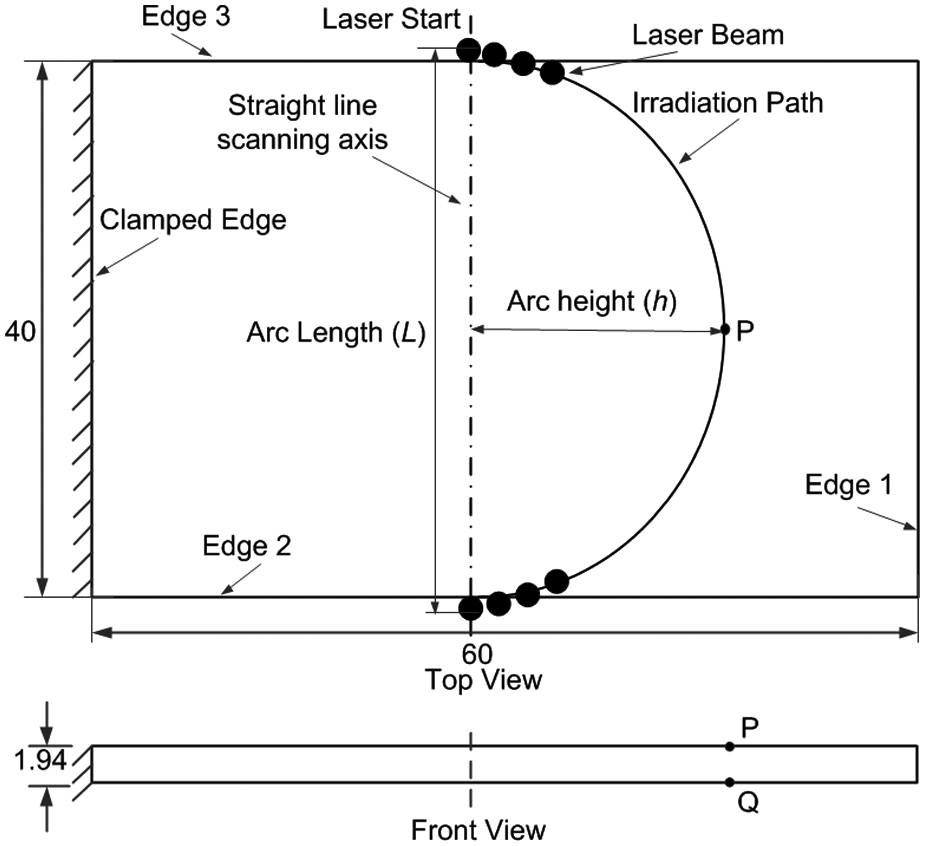
Laser beam irradiation scheme.
The laser beam diameter can be controlled by changing the stand-off distance (H) between the laser head and the worksheet surface (Figure 1). Hence, the laser beam radius (R) was calculated from the stand-off distance (H) by using standard beam propagation equations23,24 as given below
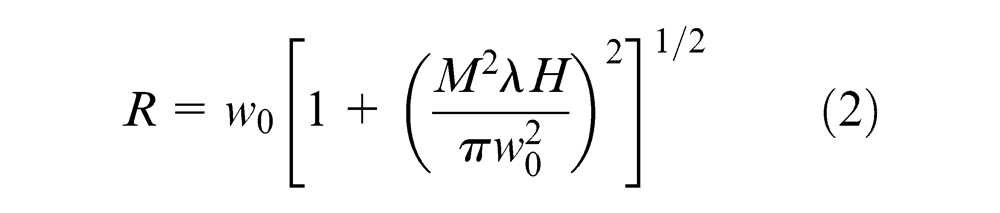
where w0 = 0.05 mm is the laser beam waist, λ = 10.6 µm is the CO2 laser beam wavelength, H is the stand-off distance and is set equal to the distance of the worksheet surface from the lens focal point and

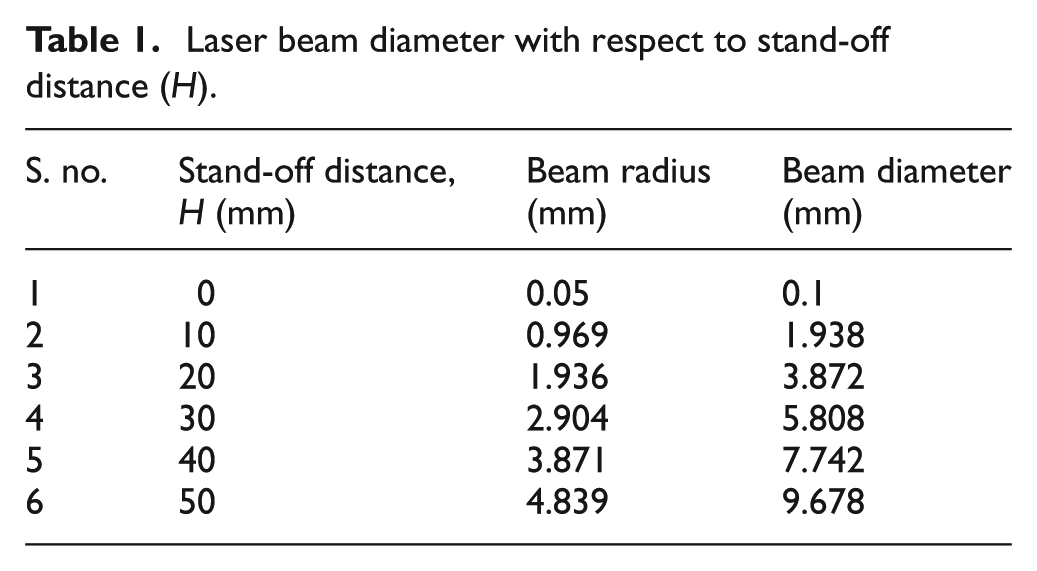
where f = 127 mm is the focal length of the lens and r = 12 mm is the laser beam radius before lens. The respective value of laser beam diameter with respect to stand-off distance is given in Table 1.
Laser beam diameter with respect to stand-off distance (H).
Laser beam was assumed to be circular, and distribution of heat flux inside the beam was taken as Gaussian distribution, which is close to the real condition for CO2 lasers and widely reported in the literature. The Gaussian distribution of heat flux inside the circular laser beam was given by the following equation
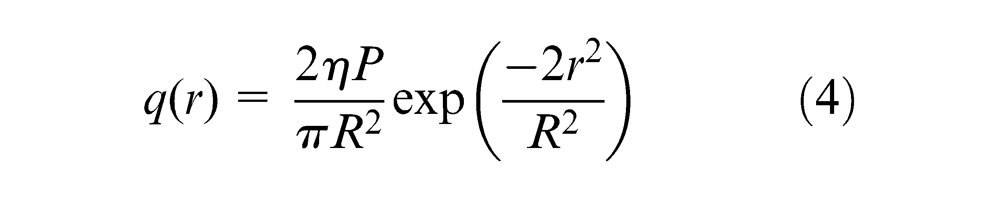
where η is the absorption coefficient, P is the laser power, r is the distance from the center of the laser beam and R is the laser beam radius. The absorption coefficient can be influenced by the temperature. However, it is difficult to find the absorption behavior during laser heating; therefore, a constant value of absorption coefficient can be considered, which may be the average of absorption coefficient before and after laser beam irradiation. The consideration of constant absorption coefficient is widely reported and accepted by the researchers. Therefore, a constant value of equivalent absorption coefficient was considered in this work.
Thermal analysis
The Gaussian distributed moving heat source was applied through a specified path over the worksheet surface. The transient temperature field generated during laser beam irradiation was determined by using the following three-dimensional (3D) heat conduction governing equation
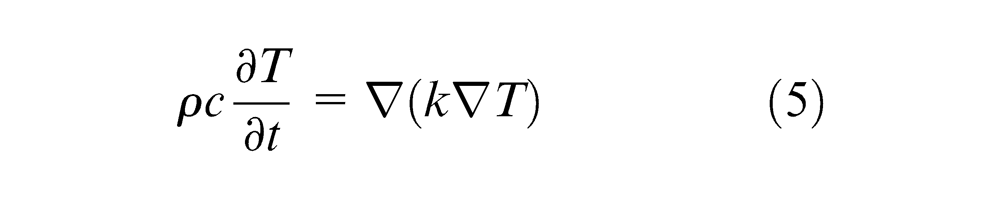
where ρ, c, T, t and κ are the worksheet density, specific heat, temperature, time and thermal conductivity, respectively.
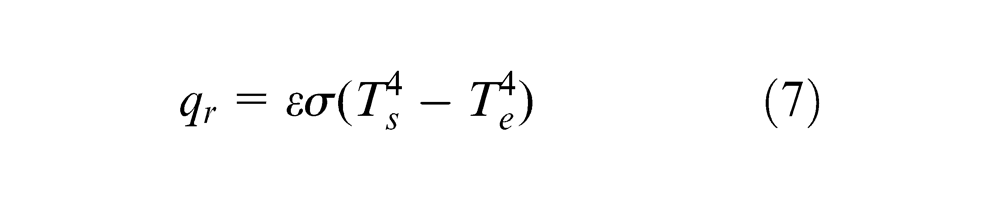
The heat loss to the surrounding occurs due to convection and radiation. These boundary conditions affect the temperature distribution in the sheet metal worksheet. The radiation loss is very small as compared to conduction and convection. Therefore, many researchers did not consider the radiation losses. However, application of both boundary conditions makes the approach more realistic. Hence, thermal boundaries were modeled by using natural convection and radiation heat losses. The convection heat loss (
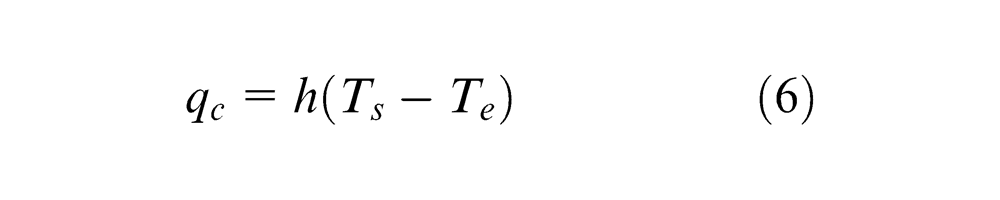
where
where
Mechanical analysis
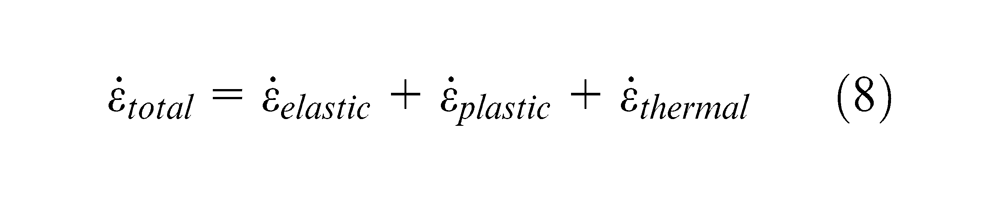
The temperature distribution from thermal analysis was given as input to the mechanical analysis. The worksheet was assumed to be clamped at one side (shown in Figure 1). Therefore, the mechanical constraint, zero displacement and zero rotation at one side (clamped side) of the worksheet, was applied. The total strain and strain rate can be decomposed into elastic, plastic, creep and thermal components of strain and strain rate. However, the deformation occurs at a relatively short time scale, and hence, the contribution of creep can be neglected. Therefore, the effect of creep was not considered. The total strain rate as a sum of elastic, plastic and thermal strain rates was given as follows
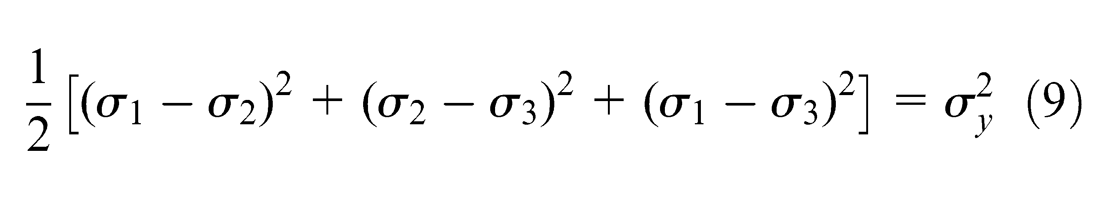
Elastic strains were calculated through an isotropic Hook’s law and yielding was determined by using von Mises criterion as follows
where
The material properties are significantly affected by the temperature and the strain rate. Therefore, both temperature-dependent and strain rate–dependent yielding was considered in this model. The strain rate–dependent flow stress was given by the following equation

where C is the strength coefficient and m is the strain rate sensitivity exponent. The C and m are temperature-dependent parameters.
Solution methodology
The developed numerical model was solved by using commercial finite element code ABAQUS™. In ABAQUS, the worksheet continuum was discretized using 3D linear hexahedron eight-node elements. The elements “C3D8T,” which are meant for coupled thermomechanical analysis, were used for the discretization. The heated and nearby region was discretized by using uniform mesh of element size of 0.5 mm, and outer region was discretized by using coarse biased mesh. The scheme of worksheet meshing is shown in Figure 4. The effect of mesh distortion on thermal analysis was not considered. In the thickness direction, four equidistant elements were taken. The same mesh model was used for both thermal and mechanical analyses. The solution was obtained by using full Newton technique.
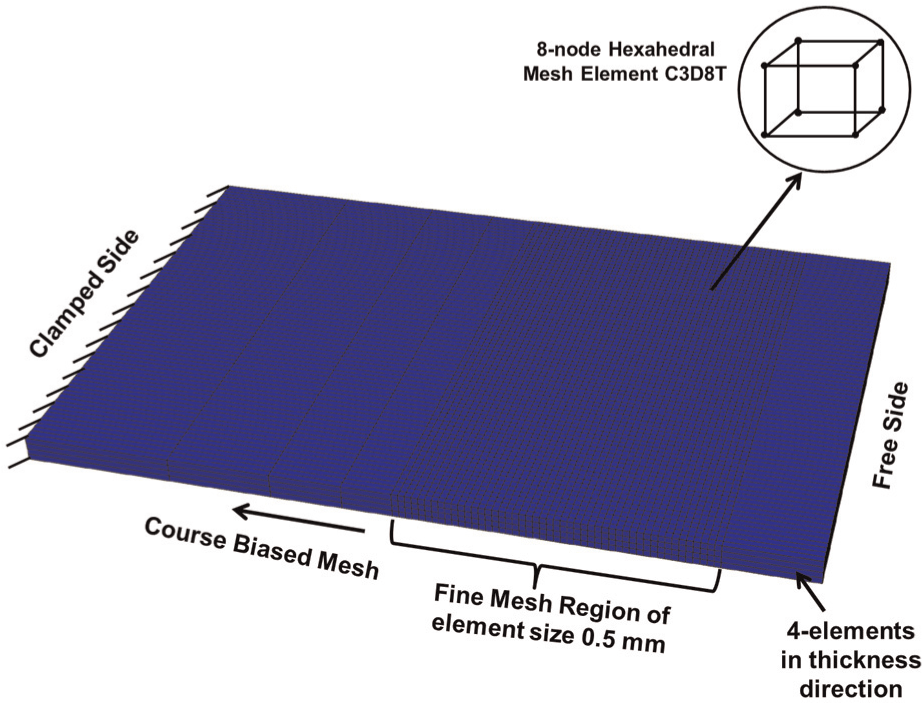
The scheme of worksheet meshing.
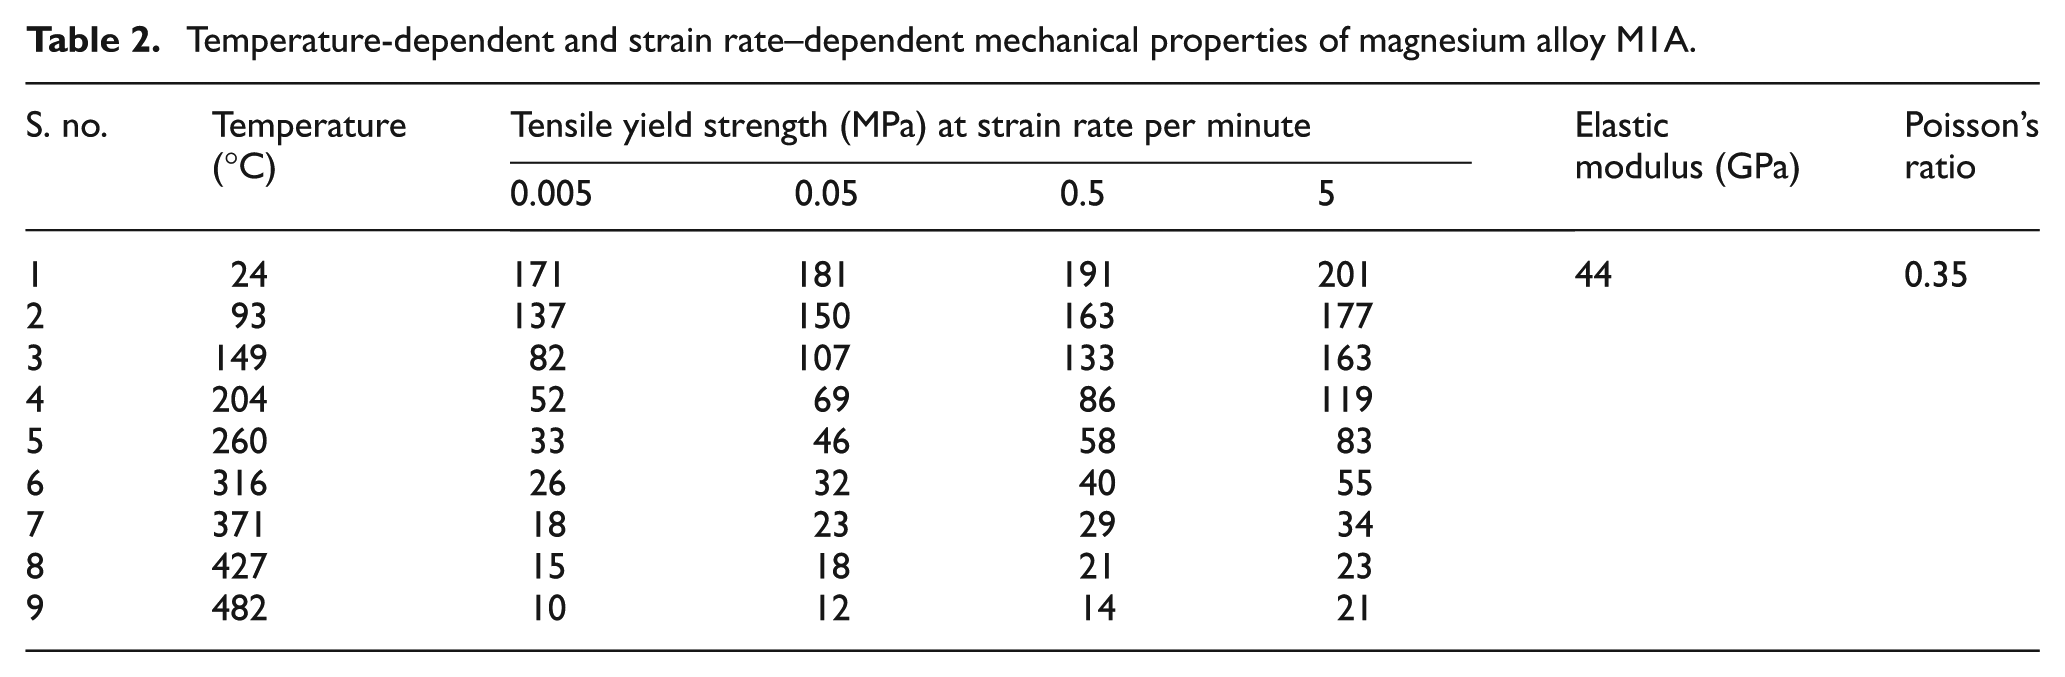
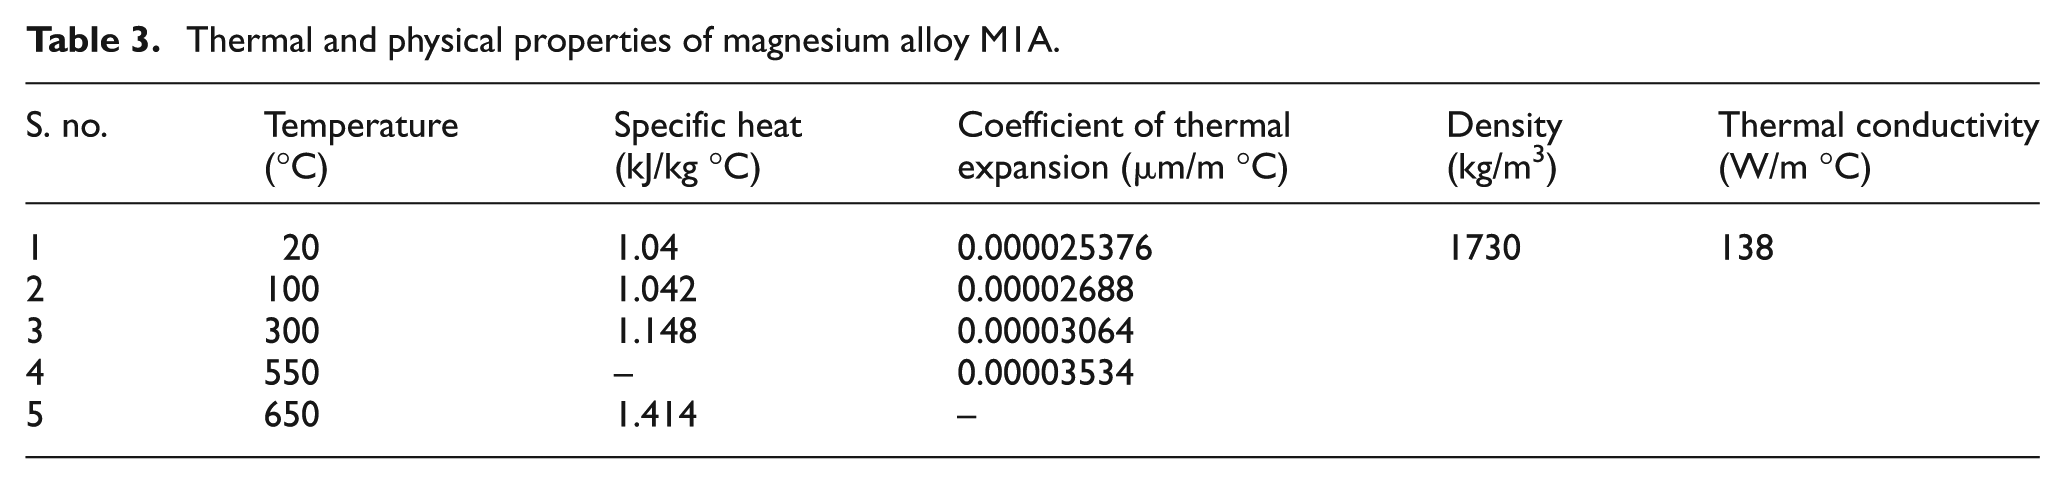
The developed numerical model was validated with experimental results for the material magnesium alloy M1A. The temperature-dependent and strain rate–dependent material properties were employed from the published data. 10 The mechanical, thermal and physical properties of magnesium alloy M1A are shown in Tables 2 and 3.
Temperature-dependent and strain rate–dependent mechanical properties of magnesium alloy M1A.
Thermal and physical properties of magnesium alloy M1A.
Experimental validation of the developed numerical model
Experimental details
The experimental studies were performed on the commercially available magnesium alloy M1A sheet. The composition of material was 98.07% of magnesium and 1.93% of manganese. The specimens of 60 mm length, 40 mm width and 1.94 mm thickness were cut by using laser cutting machine. The specimens were cleaned with a cloth to remove dust and other extra particles and then coated with graphite spray to increase the absorptivity. The sprayed specimens were then allowed to dry for about 1 h under normal room conditions. The specimen was clamped over the laser machine bed using a fixture as shown in Figure 5. The laser heating was performed by using LVD Orion 3015 2.5-kW continuous wave CO2 laser machine. The laser beam was irradiated over the specimen surface along the predefined path. The laser parameters, namely, laser power, scanning velocity, stand-off distance and scanning path, were varied. Each set of process conditions (experiment) was performed with three trials to check the repeatability. The specimens were allowed to cool naturally after the laser beam irradiation. Due to laser beam irradiation, the specimens were bent. By using Zeiss coordinate measuring machine (CMM), the bend angle was measured at the middle of scanning path, that is, about point P (shown in Figures 1 and 3). For a set of process conditions, the average of three trials was considered as the experimental value. Figure 6 shows the laser beam irradiated specimen. It can be observed that due to laser heating, the coating was burnt out and the worksheet was bent, which can be seen in Figure 6.
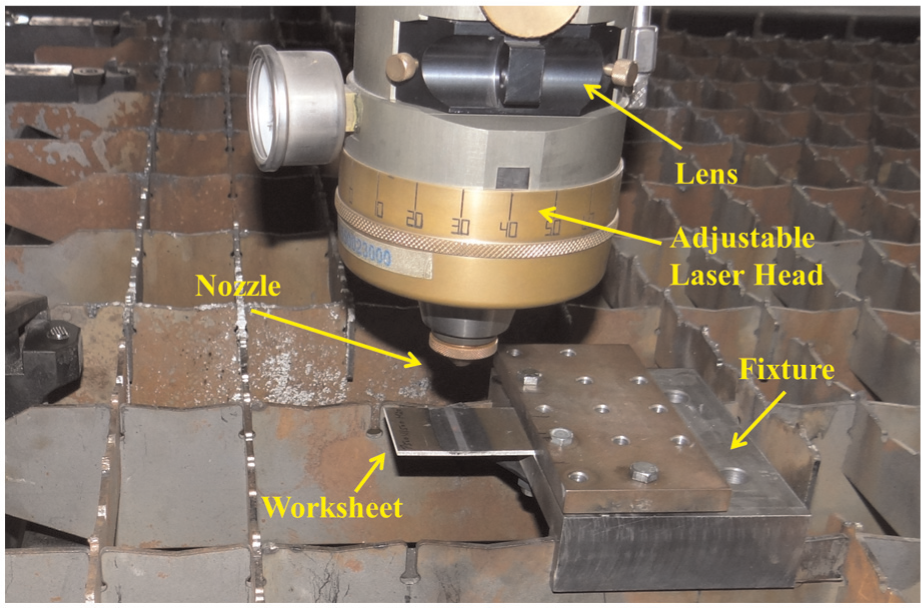
The specimen clamped over the laser machine.
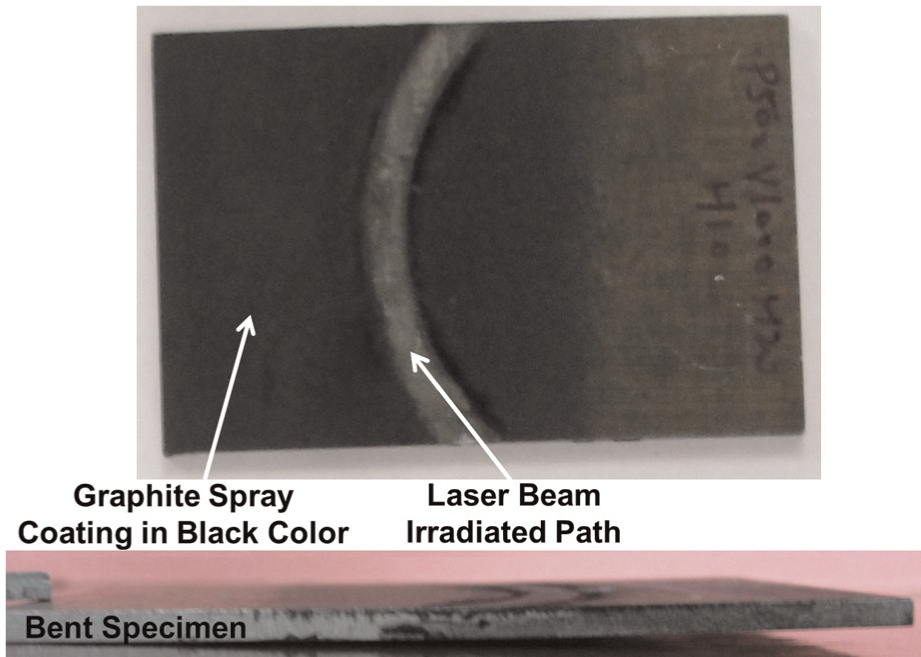
Laser beam irradiated bent specimen.
Comparison between numerical and experimental results
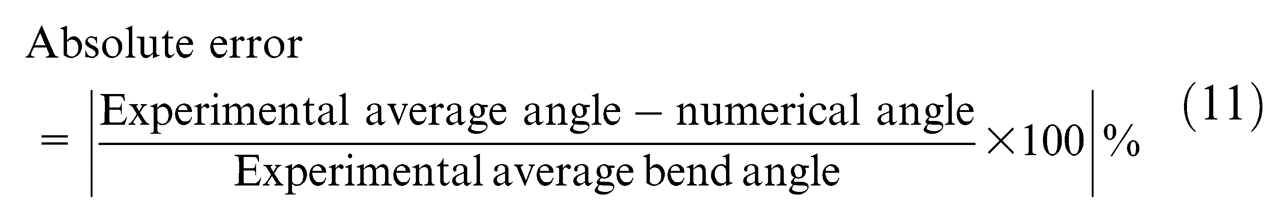
As presented in the above sections, both experiments and numerical simulations were performed for the same set of process conditions. Initially, experiments on CO2 laser machine with random process parameters have been carried out to study the bending phenomenon. Based on the observations, the range of process conditions that provided negligible melting has been chosen for this work. The range of the process parameters is as follows: laser power (P) = 300–600 W, scanning velocity (V) = 2000–5000 mm/min, worksheet to laser head stand-off distance (H) = 20–50 mm and arc height (h) = 0–20 mm. The numerical results were compared with the experimental results to validate the developed numerical model. The comparison between numerical and experimental results is shown in Table 4. The difference between experimental and numerical results is studied by using the absolute error, which can be given as follows
Comparison between numerical and experimental results.
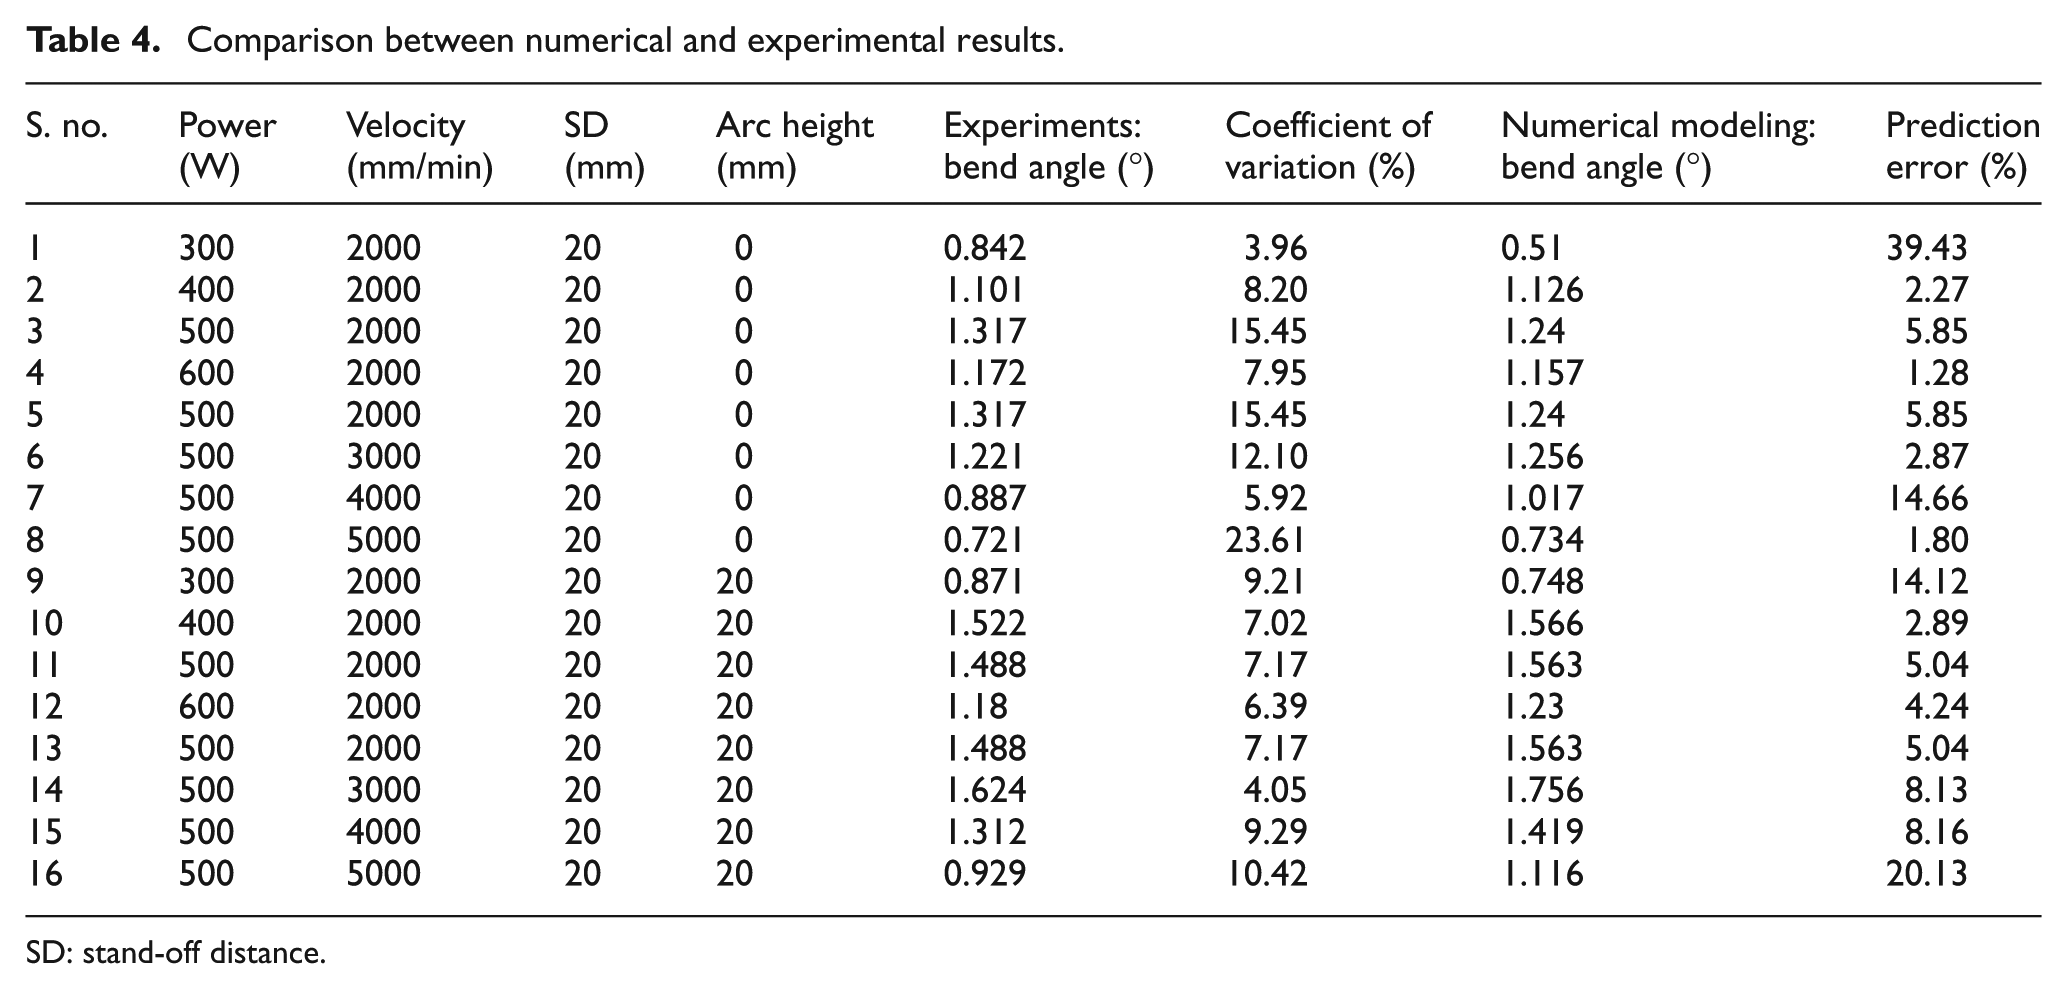
SD: stand-off distance.
Table 4 shows the comparison between numerical and experimental values of bend angle for straight line as well as curvilinear laser bending. The process conditions with arc height equal to zero represent the straight line laser bending process. The curvature of scanning path increases with increase in arc height as shown in Figure 3. The experiments were repeated three times for each set of process conditions. The variation between each set of experiments is presented by the coefficient of variation. The term “SD” represents the stand-off distance in Table 4.
The effect of laser power on bend angle for the process conditions of scanning velocity = 2000 mm/min and stand-off distance = 20 mm at various arc heights is shown in Figure 7. It can be observed that the bend angle increases with increase in laser power, attains a peak and then decreases with further increase in laser power. The increase in bend angle with laser power is due to more amount of heat energy absorbed in the worksheet, which causes higher peak temperature and hence more plastic deformation at the scanning surface. After attaining a peak, the bend angle decreases with increase in laser power. It may be due to two reasons. First, at higher power levels, the heat energy is utilized in phase transformation (surface melting) instead of worksheet bending and results in lower bend angle. Second, the peak temperature at bottom surface is higher in comparison with that in the case of lower power levels, which results in higher plastic deformation at bottom surface. It reduces the difference between plastic deformation at top and bottom surfaces that lead to production of lower bend angles.
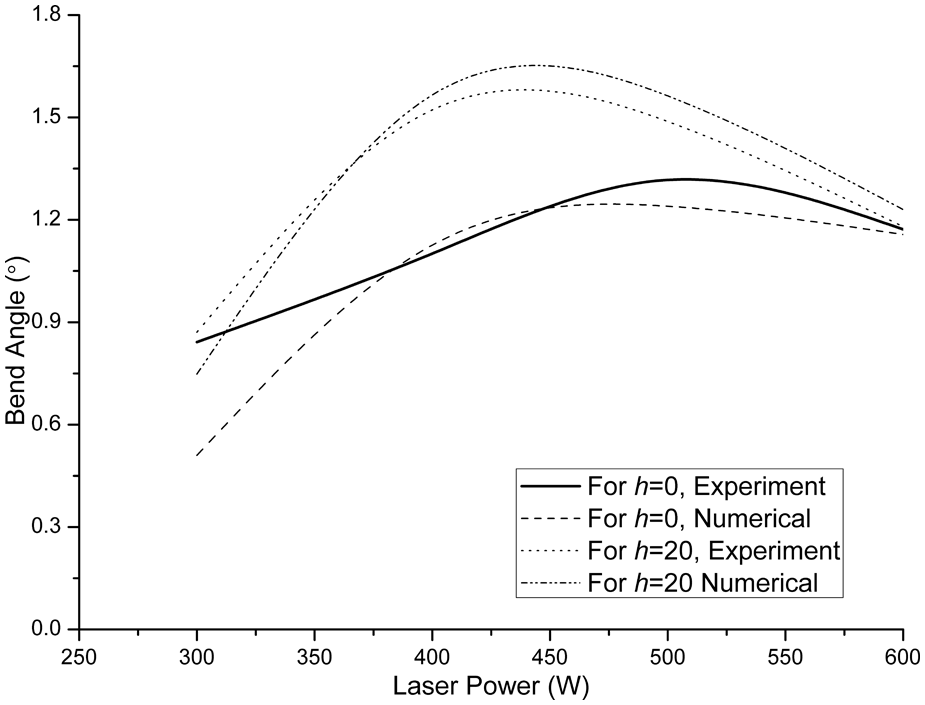
Effect of laser power on bend angle.
Figure 8 shows the effect of scanning velocity on bend angle for the process conditions of laser power = 500 W and stand-off distance = 20 mm at various arc heights. It is observed that the bend angle first increases slightly with increase in scanning velocity. It may be due to increased temperature gradient along the thickness direction at higher scanning velocity. The conductivity of the worksheet material (magnesium alloy M1A) is high, and therefore, the significant temperature gradient cannot be generated at lower scanning velocity. It results in reduced plastic deformation gradient along the worksheet thickness direction and hence less bend angle at lower scanning velocity. The bend angle decreases with increase in scanning velocity. It may be due to less heat energy absorbed at higher scanning velocities as a result of reduced contact time between laser beam and worksheet surface. The lower heat absorption results in the lower peak temperature at the scanning surface. This leads to less plastic deformation at the scanning surface and hence less bend angle at higher scanning velocity.
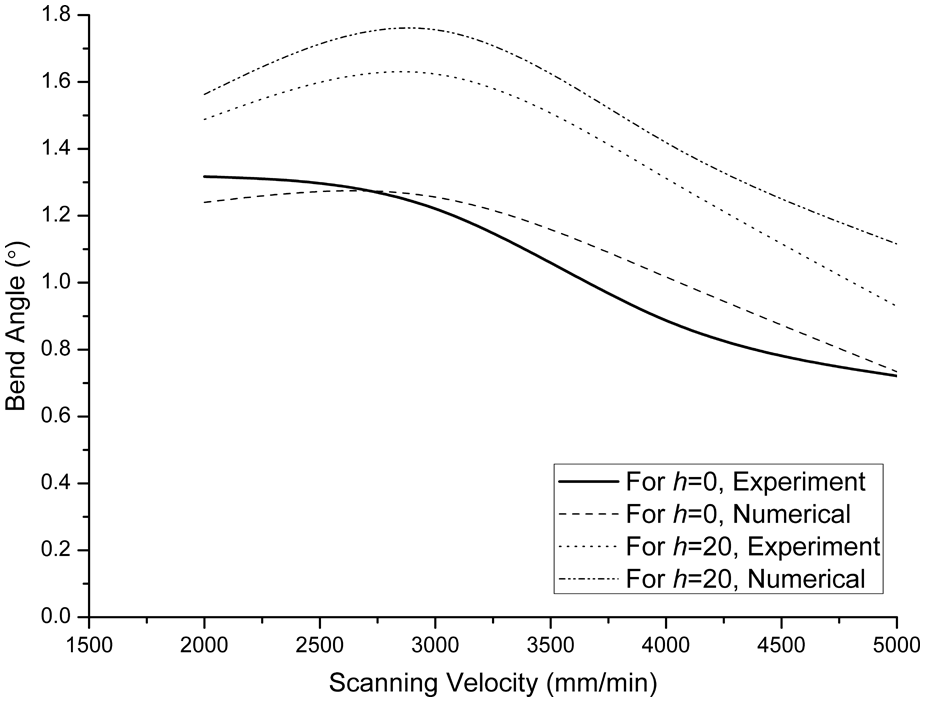
Effect of scanning velocity on bend angle.
From Table 4 and Figures 7 and 8, it is noted that the curvilinear irradiation produces an average 22.26% higher bend angle in comparison with straight line irradiation in case of experimental studies. However, in the case of prediction by numerical modeling, curvilinear irradiation produces an average 34.44% higher bend angle in comparison with that of straight line irradiation. It may be due to the fact that energy absorption is more in case of curvilinear laser bending process because the scanning path is longer, which increases laser beam contact time with the worksheet surface. The details of the effect of scanning path curvature on bend angle are presented in section “Effect on bend angle.”
From Table 4, it can also be observed that numerical results are in good agreement with the experimental results. Numerical model predicts the bend angle with the mean absolute error of 8.86%. The trends of numerical results are similar to those of the experimental results as shown in Figures 7 and 8. Therefore, it is felt appropriate to employ the developed numerical model for the preliminary parametric study of curvilinear laser bending process. These are presented in the next section.
Results and discussion
The developed numerical model is used to investigate the effect of scanning path curvature on the laser bending process. The effect of scanning path curvature on stress–strain distribution, bend angle, distortions, edge effect and edge displacement has been studied and compared with straight line (h = 0) laser bending process. The results are presented and discussed in the following.
Process mechanism
The dominating process mechanism can be ensured by knowing temperature history at top and bottom surfaces of the irradiated region. Figure 9 shows the temperature history at points P and Q for the following process parameters: laser power (P) = 500 W, scanning velocity (V) = 2000 mm/min, worksheet to laser head stand-off distance (H) = 20 mm and arc height (h) = 0 mm; laser power (P) = 500 W, scanning velocity (V) = 2000 mm/min, worksheet to laser head stand-off distance (H) = 20 mm and arc height (h) = 20 mm.
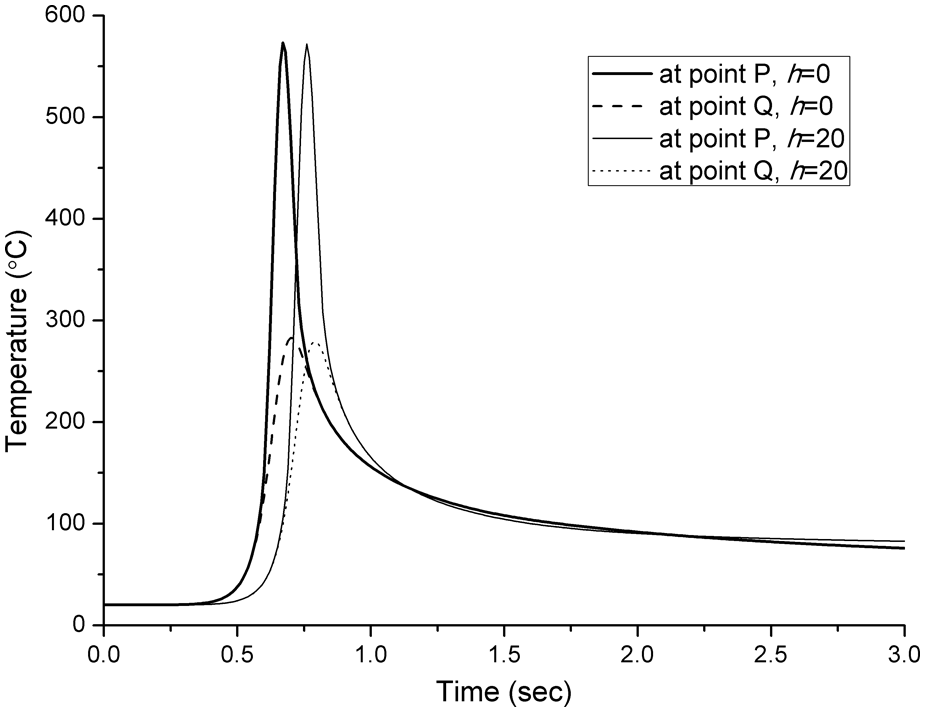
Temperature history at points P and Q.
As the laser beam irradiates over the worksheet surface, the heat is absorbed by the irradiated region. Therefore, temperature of the irradiated region increases and heat conduction starts from the heated to cooler region. Due to heat conduction, temperature at the bottom surface of the worksheet also starts increasing. The peak temperature is higher at the top surface compared to the bottom surface as shown in Figure 9. As laser beam moves away, the temperature of heated region starts lowering down due to heat flow in the surroundings (due to conduction, convection and radiation heat flow). It can be observed that the steep temperature gradient occurs between top and bottom surfaces of the worksheet. Therefore, it can be concluded that the laser bending process followed the TGM. In TGM, the worksheet bends toward the laser head, and similar results were observed for all the cases. It can also be observed that the heating at points P and Q starts later for the case of h = 20 as compared to the case of h = 0 (straight line irradiation). This is because as the arc height (h) increases, the length of scanning path also increases. It should be noted that the temperature history is drawn for the minimum scanning velocity used in the study, and all the parameters are investigated at this velocity. The temperature gradient will be higher for the higher range of velocities. Therefore, the process is TGM dominating for the mentioned range of process conditions. After confirming the bending mechanism further, the studies are carried out on the effect of scanning path curvature on laser bending process.
Worksheet bending path
It is observed from literature survey and numerical and experimental investigations that the worksheet bends about the laser beam irradiation path axis in the case of straight line laser bending process as shown in the schematic in Figure 1. However, in the case of curvilinear laser beam irradiation, it is observed that the worksheet bending does not occur along the curvilinear laser beam scanning path. Figure 10 shows the 3D model of bent worksheet with the laser beam scanning start position and bending start position. It is clearly seen that the bending occurs outside of the scanning path curvature. It may be due to two reasons: first, the focus of laser beam on work surface is partially outside of the worksheet near the end edges as shown in Figure 3. This results in offsetting of higher peak temperature outside the center of irradiation path. Second reason may be that the bending at middle of the scanning path tries to bend the worksheet away from the scanning path. For example, the bending about point P (Figure 3) tries to bend the worksheet about the y-axis passing through point P. However, at the middle of scanning path, the bending occurred over scanning path. The comparison between laser beam scanning profile and worksheet bending profile at various levels of process parameters is shown in Figures 11 –13.
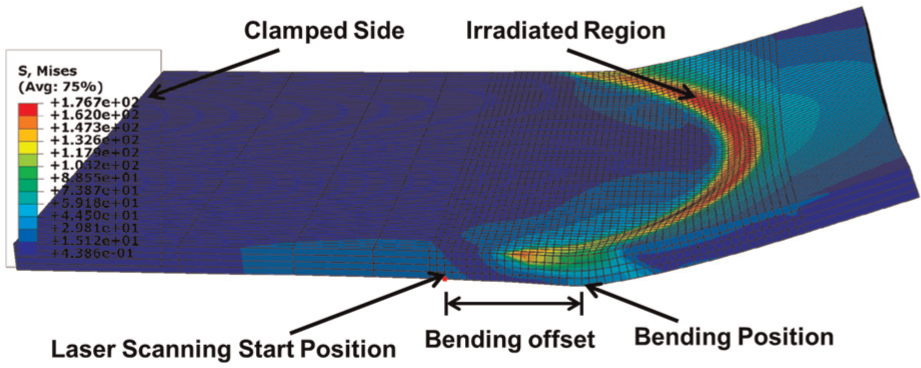
Image showing laser scanning position and sheet bending position.
Effect of laser power on bending path profile.
Effect of scanning velocity on bending path profile.
Effect of stand-off distance on bending path profile.
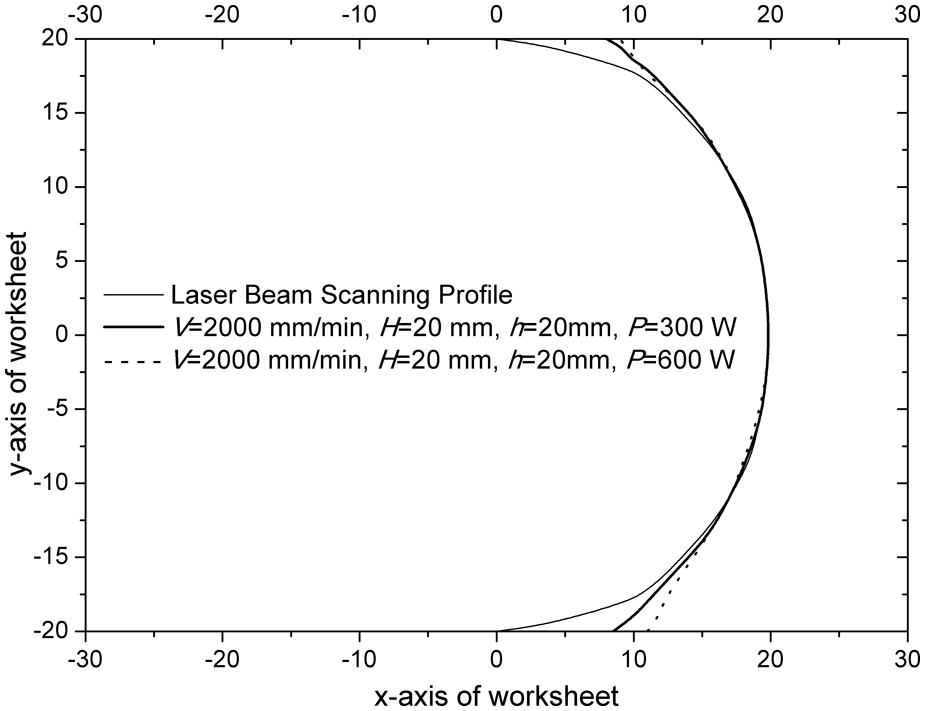
Effect of laser power on bending path
Figure 11 shows the comparison between laser beam scanning profile and worksheet bending profile at various levels of laser power. The effect of power on bending path is studied for two power levels, namely, 300 and 600 W.
From Figure 11, it can be observed that the bending path is offset by about 8 and 9 mm from the starting of laser beam scanning path for the laser power levels of 300 and 600 W, respectively. However, the bending offset was found to be about 9 and 11 mm, respectively, at the end of scanning path. The offset at both the starting and end points of the bending path was observed to be more for larger power level (600 W). This may be due to the fact that with the increase in laser power, the thermal stresses generated near the scanning path also increase. The thermal stresses at the middle of the scanning path (e.g. at point P), which try to bend the worksheet about the y-axis passing through it, dominate, and therefore, the bending offset increases with the increase in laser power. It is also observed that the bending offset is more near the exit as compared to the entrance of laser beam scanning. It may be because of higher preheating of material at the exit of laser beam scanning. At an elevated temperature, the flow stress decreases, and therefore, the tendency of worksheet bending outside the scanning path curvature is more effective at the exit of laser beam scanning. It results in the more bending offset near the end of scanning path curvature.
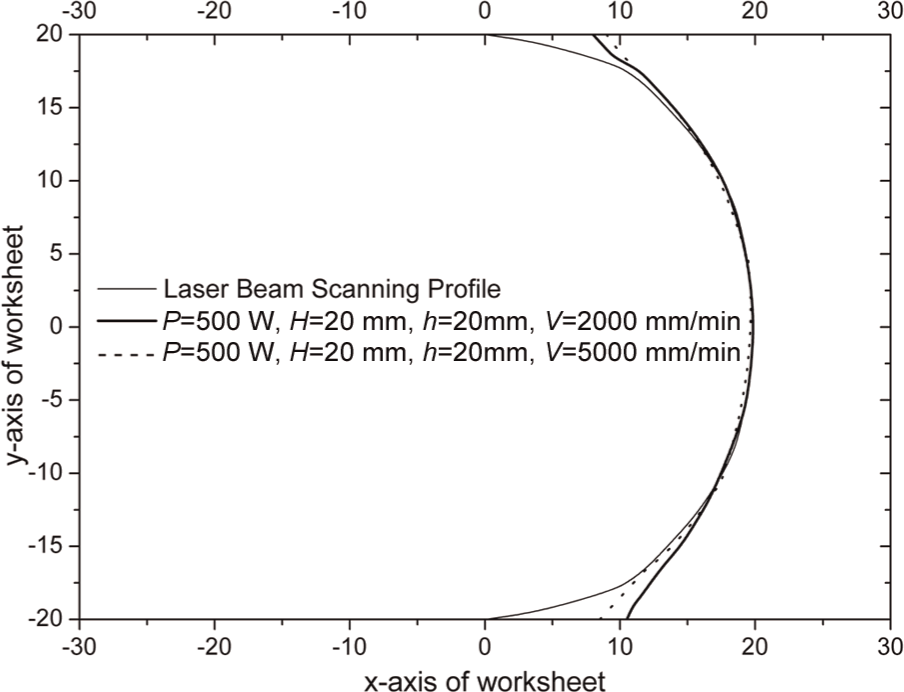
Effect of scanning velocity on bending path
The effect of laser beam scanning velocity on bending path profile is shown in Figure 12. It shows a comparison between laser beam scanning profile and worksheet bending profile for two levels of laser beam scanning velocities, namely, 2000 and 5000 mm/min.
Figure 12 shows that bending offsets are about 8 and 9 mm at start of the bending path for scanning velocities of 2000 and 5000 mm/min, respectively. However, 10.5 and 8.5 mm offset values are noted for bending at the end of scanning path. For laser scanning start point, a higher offset value is observed for higher level of scanning velocity. It may be due to the fact that the energy absorption per unit length at higher scanning velocity is less, which results in less peak temperature and hence less induced thermal stresses in the irradiated region. The thermal stresses near the scanning start point are less effective in comparison with those induced at the middle of the scanning path (e.g. at point P).
The bending path offset decreases with increase in scanning velocity near the end of scanning path. It may be due to the fact that the preheating temperature is less at higher scanning velocity, which results in higher resistance to the tendency of worksheet bending outside the scanning path profile.
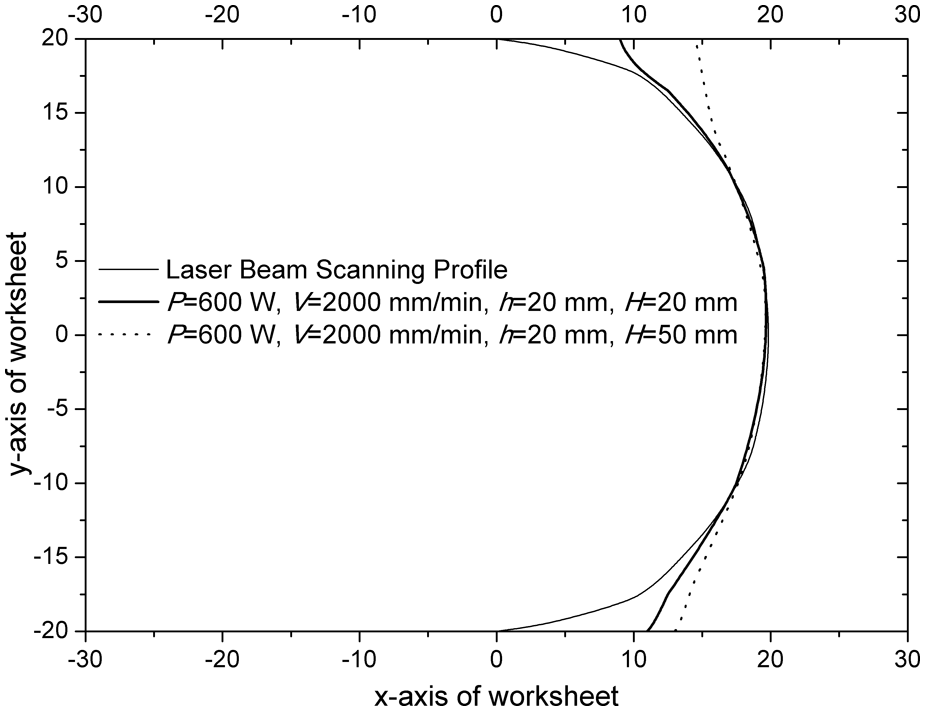
Effect of stand-off distance on bending path
Figure 13 shows the effect of stand-off distance on bending path profile. For the stand-off distances of 20 and 50 mm, the bending offsets of about 9 and 14.5 mm, respectively, are observed at the start of laser beam scanning. However, at the end of scanning path, about 11 and 13 mm of offset values were noted. At both start and end points, the bending path offsets were found to be increased with increase in stand-off distance. It may be due to the fact that the laser beam diameter increases with the increase in stand-off distance, which results in the decrease in heat flux density. At higher stand-off distance, the beam diameter is larger; therefore, the peak temperature moves outside the center of scanning path as the complete laser beam enters the worksheet surface at some offset toward the free edge as shown in Figure 3.
Effect on edge displacement
In this work, the z-displacement is studied to know about the warping of the edges during curvilinear laser bending process. The edge displacement in curvilinear laser bending is compared with the straight line (h = 0) laser bending process. Figure 14(a)–(c) shows the effect of arc height on z-displacement along edge 1. It can be observed that the z-displacement along edge 1 decreases with increase in arc height (h). It may be due to the fact that for large arc height, the bending occurs near the free edge; however, for small arc height, it occurs at a far distance from the free end. Therefore, for the same bend angle, the z-displacement for h = 20 is lower than that for h = 0 (straight line irradiation). It is also observed that the warping is less at free edge 1 when arc height is less. It may be because of the mechanical constraint (clamping), which is nearer to the laser beam scanning path in case of less arc height, and it resists the curved deformation along the y-axis. At all the process conditions, warping at edge 1 is found to be more for higher arc height and a bowl shape is observed as shown in Figure 14(a)–(c). Therefore, the curvilinear laser bending process can be used to generate complex shapes and alignment of sheets with complex geometries by controlling arc height or laser beam scanning path geometry. The presented results may be important guidelines in such applications.
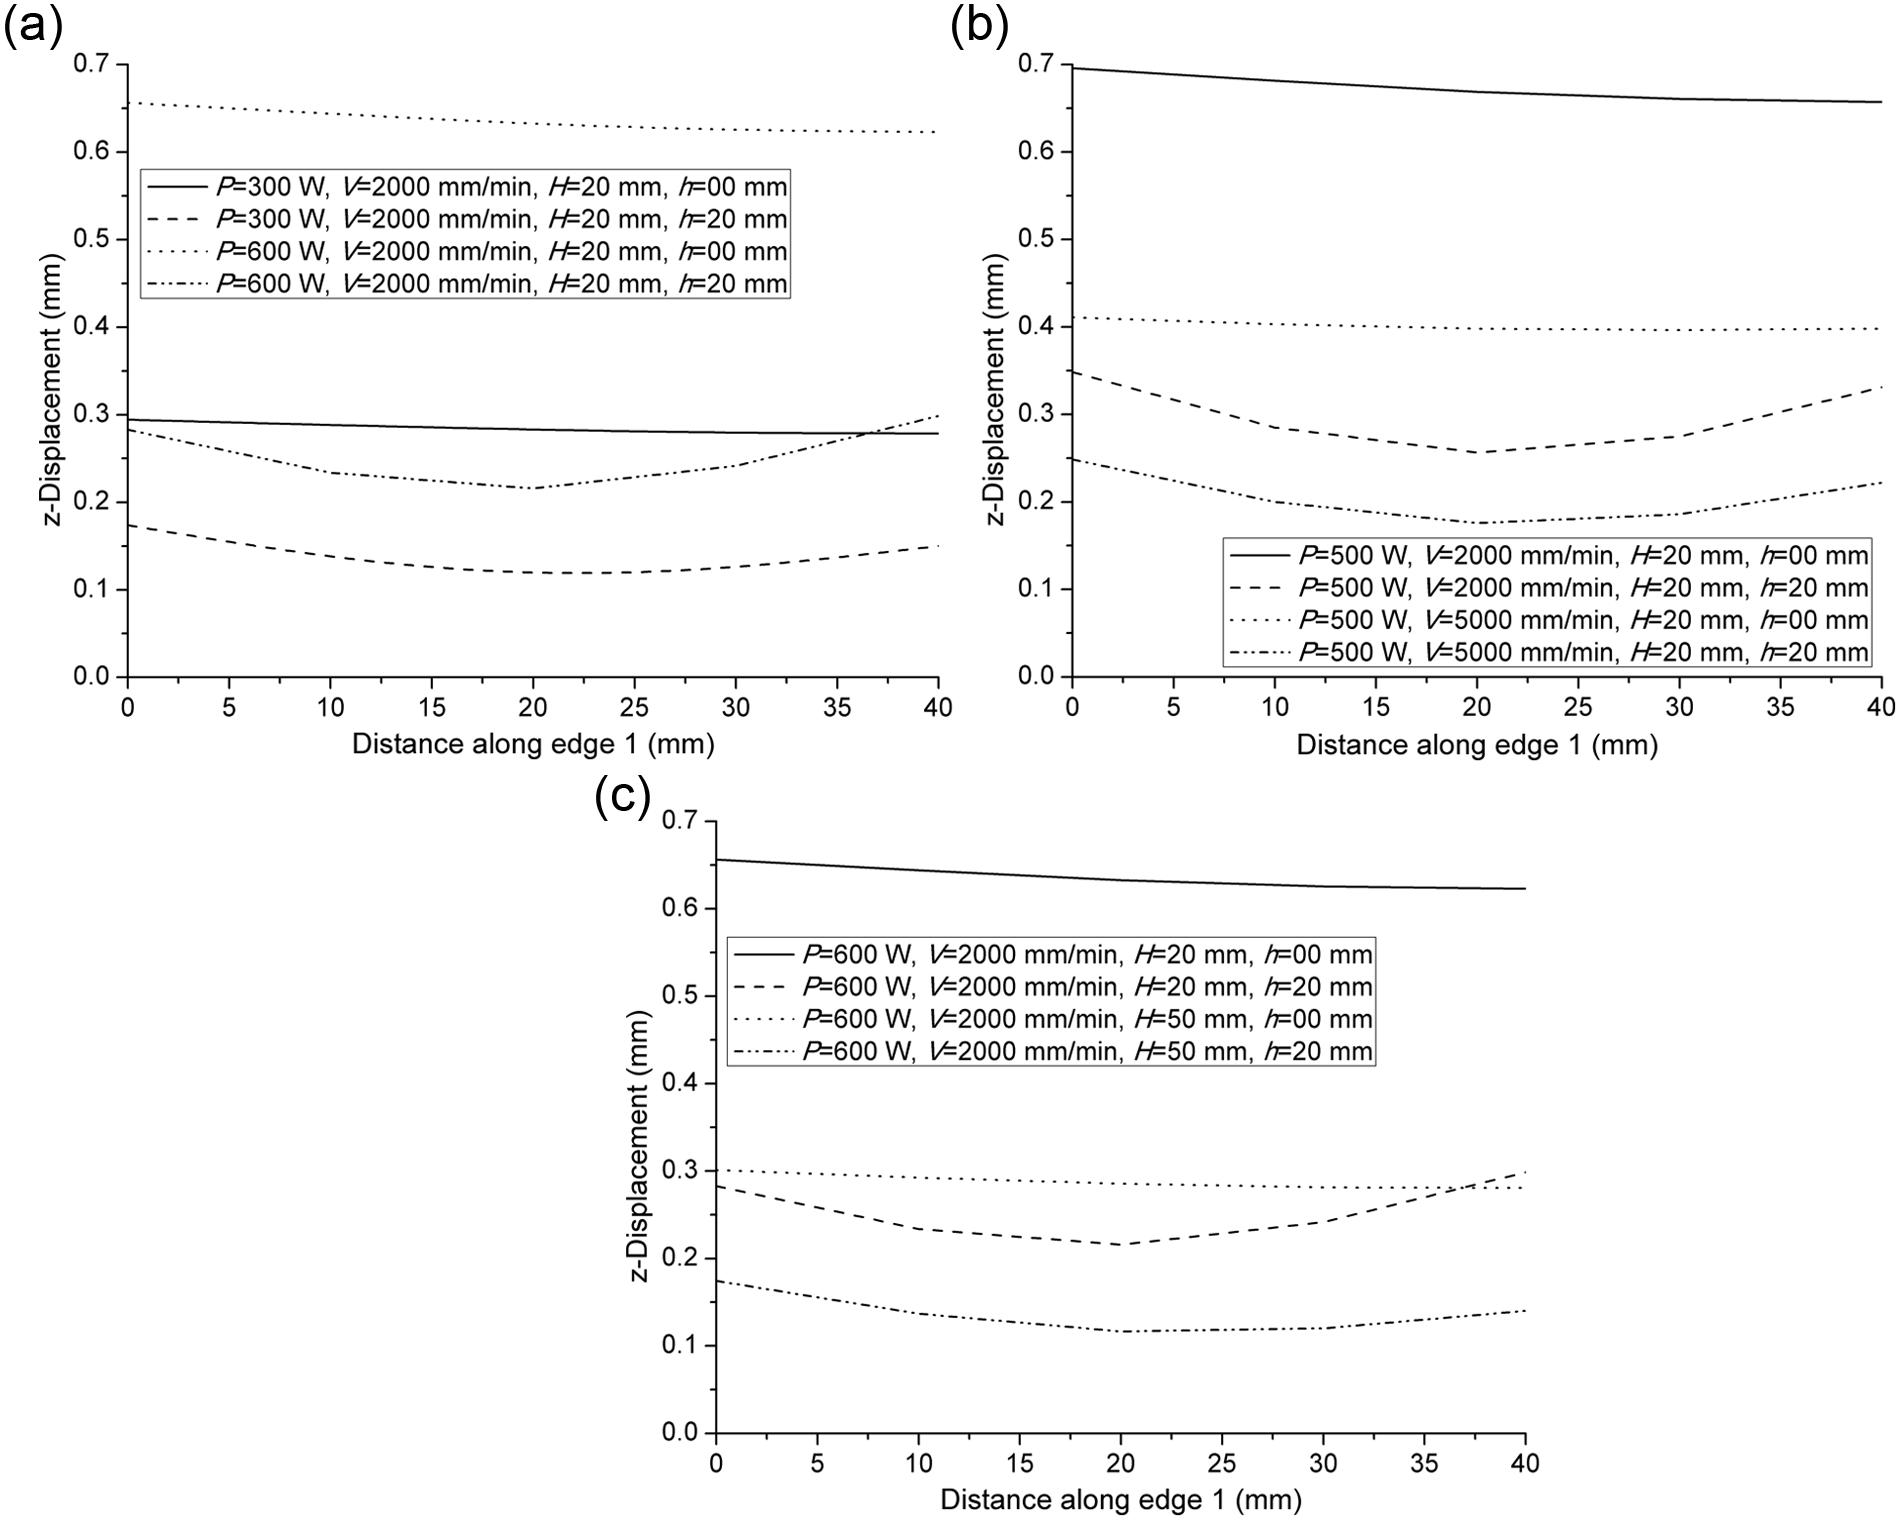
Effect of arc height on z-displacement along edge 1 (a) with varying laser power, (b) with varying scanning velocity and (c) with varying stand-off distance.
It can also be noted that the z-displacement is not uniform in the case of straight line laser beam irradiation (h = 0), and it decreases from the start to the end of scanning path. It may be due to the edge effect caused by the uneven temperature distribution near the edges. The conductivity of magnesium is high, which leads to more heat conduction. This results in lower temperature gradient near the scanning path end. Thus, the z-displacement decreases along the laser beam scanning path.
Figure 14(a) shows that the edge effect increases with increase in laser power. It may be due to more preheating at bottom surface by the increased laser power. Figure 14(b) shows that the edge effect is less at higher scanning velocity, which may be due to less preheating at higher scanning velocity. Figure 14(c) shows that the edge effect is less at higher stand-off distance. It may be due to lower temperature gradient along the thickness direction at higher stand-off distance, which reduces the effect of preheating.
The z-displacement along edge 2 is shown in Figure 15. It also confirms that the bending does not start from the starting and end points of the laser beam irradiation path, which is explained in section “Worksheet bending path.” It is observed that the deformation behavior of straight line irradiation and curvilinear irradiation is different. In straight line irradiation, the bending occurs about a single axis, namely, the scanning line axis as shown in Figure 3. In the case of curvilinear laser beam irradiation, the irradiation line does not have a single scanning axis and bending occurs along the curvilinear scanning path as shown in Figure 15. It is also seen that in the case of curvilinear irradiation, edge 2 moves in downward direction at the bending position. It may be due to the fact that the mechanical constraint is far from the scanning path, and hence, the sheet has less restriction to move in the vertical direction.
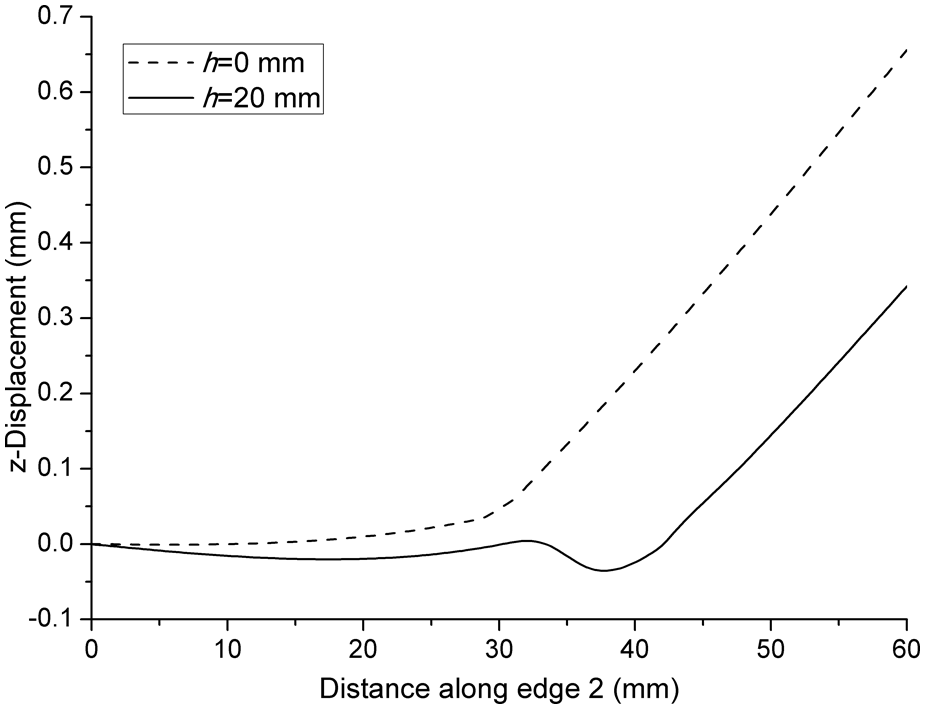
z-displacement along edge 2.
Effect on bend angle
Figure 16(a)–(c) shows the effect of scanning path curvature (arc height) on bend angle for varying laser power, scanning velocity and stand-off distance, respectively. It can be observed that the bend angle increases with increase in scanning path curvature (arc height). It may be due to the fact that as the arc height increases, the laser heat input is more because of larger scanning path length. It results in higher peak temperature at the scanning area and therefore more plastic deformation in the heated region.
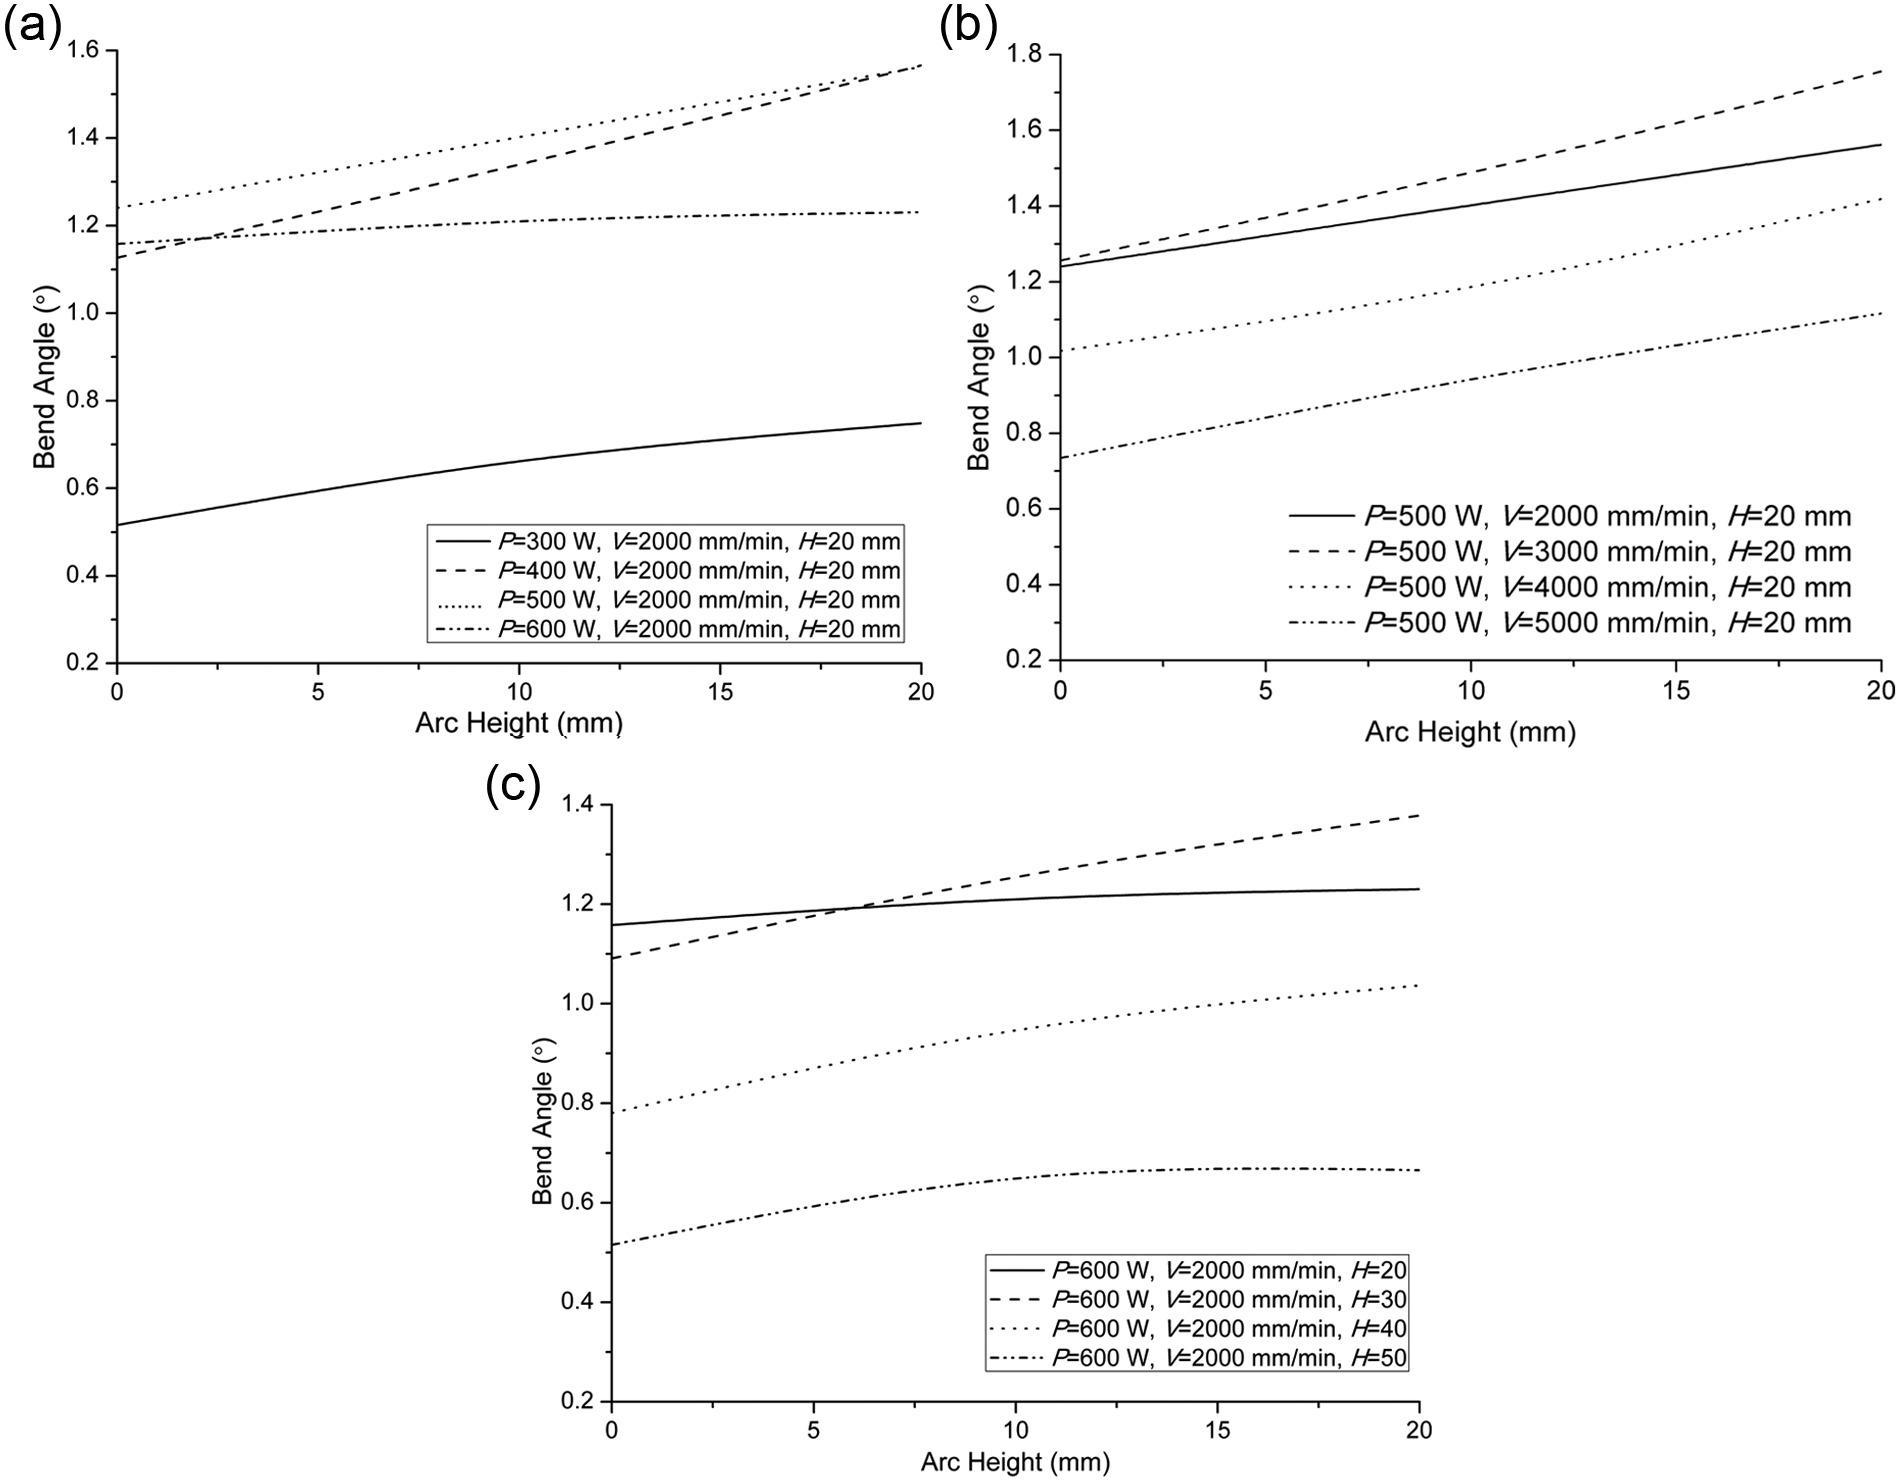
Effect of arc height on bend angle (a) with varying laser power, (b) with varying scanning velocity and (c) with varying stand-off distance.
Figure 16(a) shows the effect of arc height on bend angle at various levels of laser power. It can be noted that the bend angle increases with increase in arc height (h) at various levels of laser power, but the rate of increase in bend angle decreases at higher power. It may be due to more plastic deformation at bottom surface in case of higher laser power. Figure 16(b) shows that the rate of increase in bend angle with arc height increases with scanning velocity. It may be due to higher temperature gradient at higher scanning velocity. Therefore, scanning velocity is an important parameter in the laser processing of high conductive materials such as magnesium, aluminum and beryllium. Figure 16(c) shows the rate of increase in bend angle with arc height at various levels of stand-off distance. The rate of change in bend angle first increases and then decreases with increase in stand-off distance. It may be due to the fact that the increase in stand-off distance leads to the decrease in temperature gradient and heat flux density.
Conclusion
In this work, numerical simulation and experimental validation of curvilinear laser bending of magnesium alloy M1A is carried out. A 3D nonlinear sequential thermomechanical numerical model has been developed by considering temperature-dependent and strain rate–dependent material properties. The developed numerical model is validated with the experimental results. The numerical results and trends are found to be in good agreement with the experimental results. The developed model is used to study the effect of laser beam scanning path curvature on the temperature distribution, edge displacement, bend angle and the deformation behavior. The process was found to be TGM dominating, and the worksheet was bent toward the laser head. The results showed that in curvilinear laser bending process, the deformation does not occur over the laser beam scanning path. The deformation was found to be occurred outside of the scanning path curvature. The presented results showed that the stand-off distance is the most effective parameter to control the worksheet bending path. The bend angle was found to be increased with increase in scanning path curvature. The warping at free edge was found to be decreased as the scanning path moves toward the clamped edge. It was found that the z-displacement decreases with increase in arc height. Therefore, for the alignment and complex shape generation, the arc height/scanning path curvature is an important parameter. It was also observed that the material with high thermal conductivity should process at higher scanning velocity and lower stand-off distance for efficient laser bending process. The presented results will be useful in the laser forming of magnesium alloys for complex shape generation, sheet alignment and assembling processes.
Footnotes
Acknowledgements
This article is a revised and expanded version of a paper entitled “Thermo-mechanical Analysis of Curvilinear Laser Bending of Magnesium Alloy Sheet using Finite Element Method” presented at AIMTDR 2012 organized by Jadavpur University, Kolkata on 14–16 December 2012.
Declaration of conflicting interests
The authors declare that there is no conflict of interest.
Funding
This research received no specific grant from any funding agency in the public, commercial or not-for-profit sectors.