
Abstract
Sequentially coupled thermo-mechanical model based on finite element method is used for simulation of friction stir welding. The relationship between the rotational speed and the heat input power is investigated. By comparison to experimental data in published literatures, the model is validated. Results indicate that the longitudinal bending curvature is increased with the decrease in the weld width. But longitudinal bending curvature is hardly changed with the variations in the weld length. A formula is established for the prediction of the maximum residual distortion.
Keywords
Introduction
Friction stir welding (FSW) has been applied to many industrial fields due to the advantages compared with the fusion welding, such as high strength, low distortion and reduced occurrence of defects.1–4 In FSW, the rotating tool is inserted into the joining plates in the plunge period. Then, the tool moves along the weld line in the welding stage and significant plastic deformation occurs around the rotating tool.5,6 In the past few years, some numerical models have been established in order to study FSW process, such as computational fluid dynamic (CFD) models,7–9 arbitrary Lagrangian–Eulerian (ALE) models,10–13 adaptive re-meshing (ARM) models14,15 and sequentially coupled thermo-mechanical models.16–18
The CFD models7–9 have been used to study the material flow and heat transfer during FSW process. The material is analyzed as a non-Newtonian, viscoplastic and incompressible fluid flowing across an Eulerian mesh. Colegrove and Shercliff 7 established a CFD model to study the material flow around the threaded pin, welding force and the temperature field. Some real process characteristics were observed. However, the model assumed that the material sticks at the tool interface, which possibly led to an overprediction in temperature. Atharifar et al. 8 considered a sliding/sticking condition at the tool interface. The numerical results agree well with the experimental data. The CFD model is based on the fluid mechanics, so the prediction of residual stress is hardly possible.
ALE model10–13 enables large deformations and adaptive meshing, which can avoid unacceptable element distortion in the simulation of FSW. Compared with the CFD model, the main advantage is that the free surfaces have Lagrange properties in the normal direction, such that surface tracking can be avoided. 10 Furthermore, separation between the specimen and the rotating tool can be modeled, which is often neglected in other models. The ALE model can be used to predict the influence of threads on the material flow, temperature field and welding forces.
ARM model is a fully thermo-mechanical coupled, rigid-viscoplastic model proposed by Buffa et al.14,15 using commercial program package DEFORM. The transient phases, such as plunging stage, dwelling stage and welding stage, can be simulated. A nonuniform mesh with ARM is adopted with fine element close to the rotating tool. As the tool moves along the weld line, a re-meshing controlled by volume is identified. This model can be used to study the temperature, strain, strain rate, material flow and forces during FSW.
Sequentially coupled thermo-mechanical model16–18 consists of a transient heat transfer model19,20 and a mechanical model. In this model, the temperature fields from the predictions or even from experiments can be directly transferred to load in the constructed mechanical model to obtain the residual state of friction stir weld. In this process, the stress concentrations caused by the pinhole can be avoided. So, this method is employed in this work to study the residual state of FSW.
Although the residual distortion is lower in FSW in comparison to other welding techniques, the residual distortion cannot be ignored 21 if the welded plates are large enough. Few works have been carried out to study the reliable function between the residual states and the weld plate sizes. So, sequentially coupled thermo-mechanical model is used to study the size effects of the weld plates on the residual states of friction stir welds.
Model descriptions
The governing equation of the transient heat transfer analysis can be written as22,23
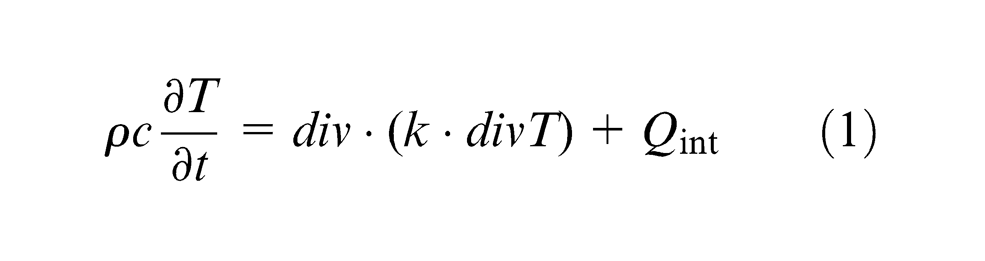
where
The frictional heat between the welding tool and the plates is considered as a moving surface heat source and a moving body heat source, respectively 24
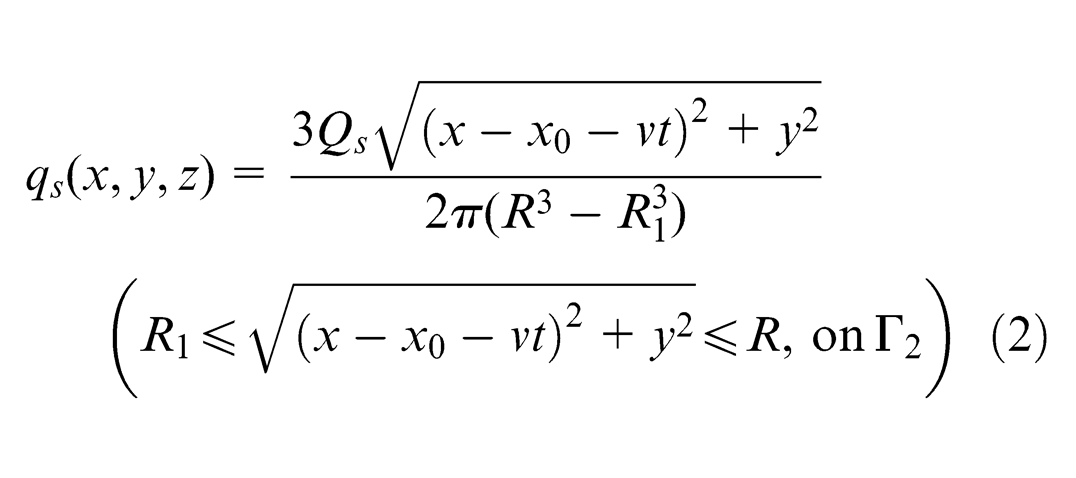
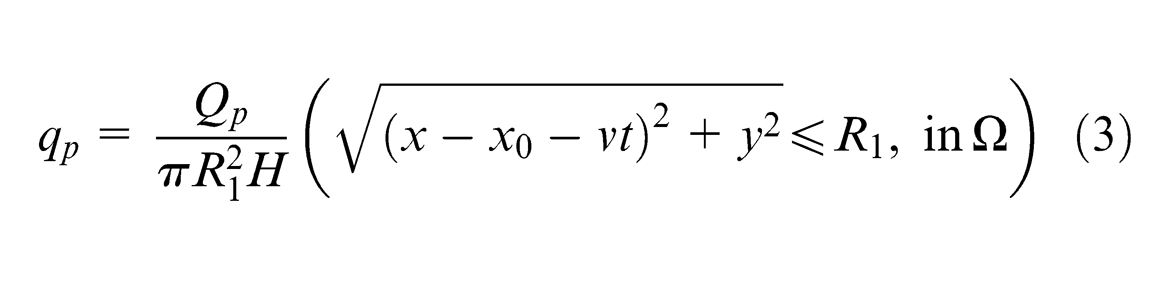
where
The convection on workpiece surfaces can be written as
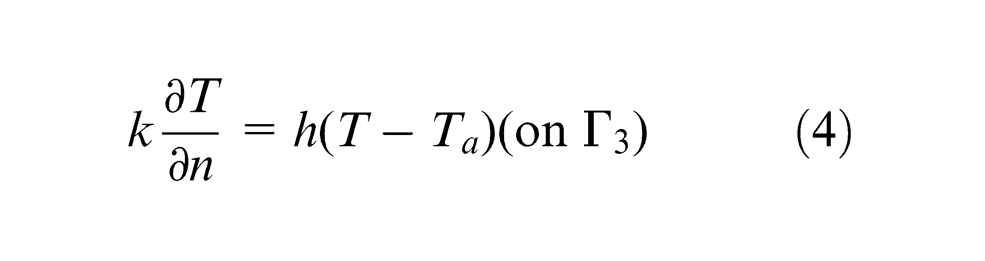
where h is the convection coefficient and
The temperature can be discretized in time domain by the following equation
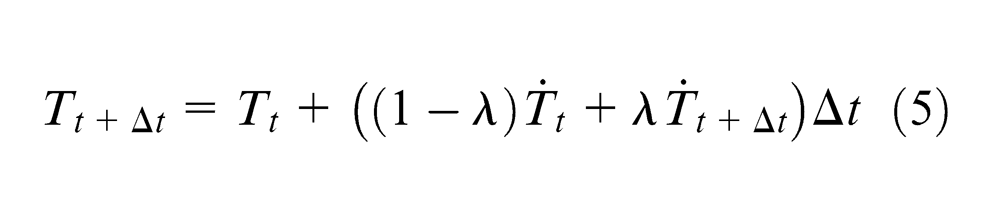
where
The total thermo-elastic–plastic incremental strain in the solid consists of the following components 26
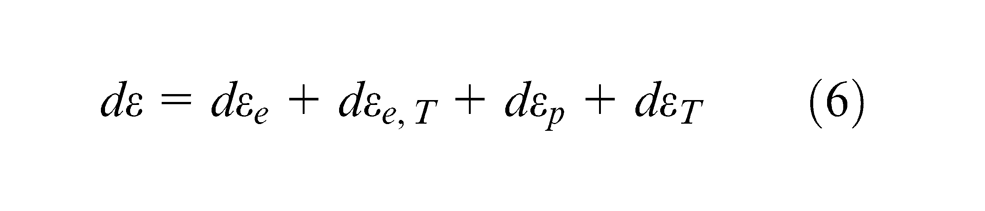
where
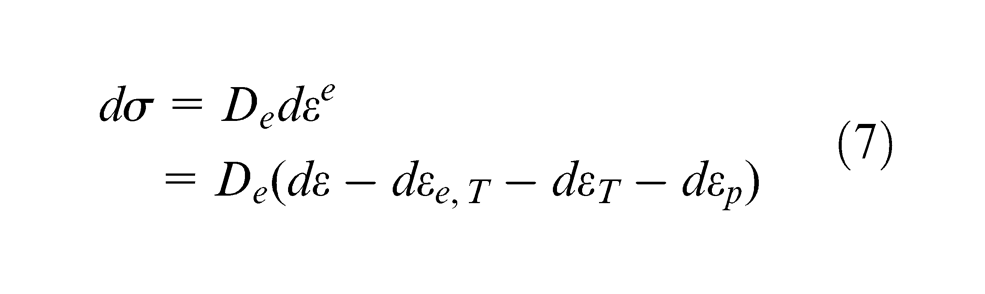
The incremental stress can be expressed as 27
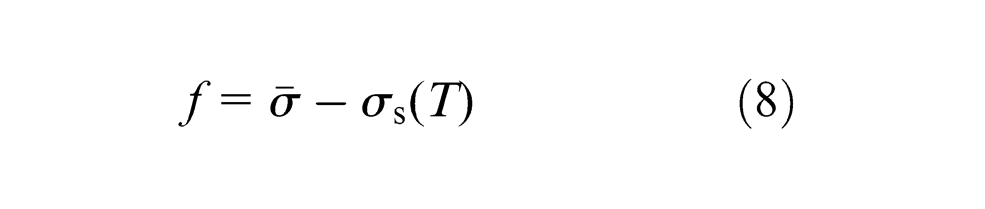
Considering the plate undergoing elastic–plastic deformation and subject to obvious temperature variation, the yield function can be written as 28
Minimum potential energy principle is employed to establish the finite element equation for thermo-elastic–plastic analysis. At
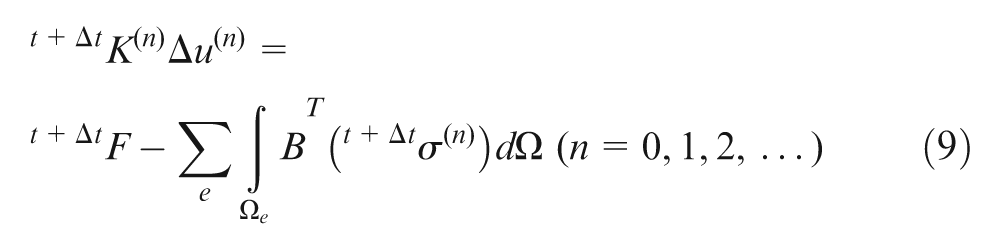
where
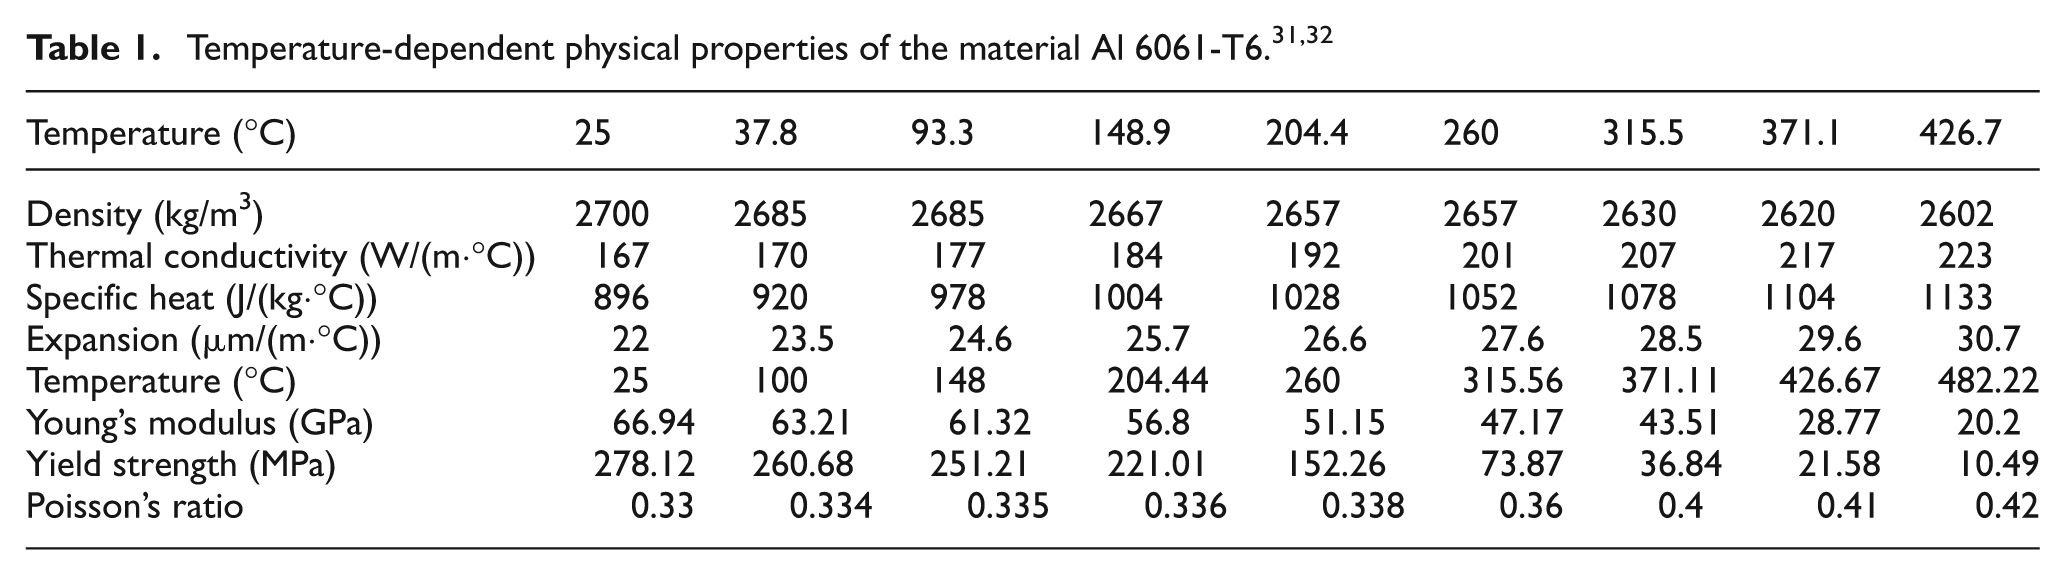
The material properties31,32 are described in Table 1. The finite element model based on commercial program package ABAQUS is shown in Figure 1. An edge line and a centerline are selected to measure the longitudinal and transverse distortions, respectively. The plate size is 304 mm × 304 mm × 6.35 mm. The rotational speed is 1250 r/min. Eight-node linear brick element is used for the heat transfer analysis and the subsequent thermal–mechanical analysis. The finite element model consists of 115,311 nodes and 98,040 elements. The smallest element size is 1 mm × 1 mm × 1.06 mm.
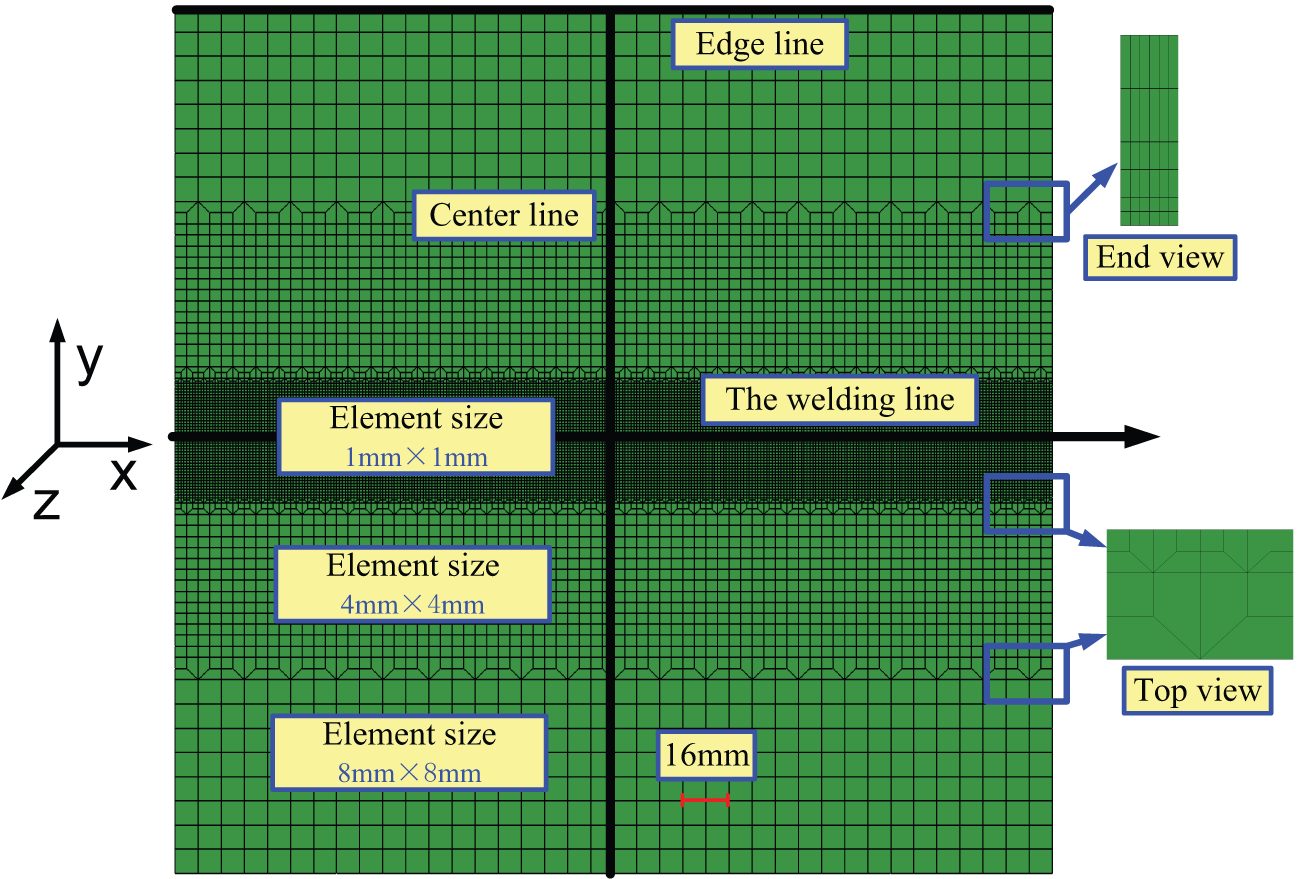
FEM model and lines selected for the measurement of the residual distortion.
In the thermal analysis, FORTRAN code is used to calculate the position and time-dependent surface heat source and volumetric heat source. The temperature field obtained can be directly transferred to load in the constructed mechanical model to obtain the residual state of friction stir weld. In the mechanical analysis, the backing plate and the fixtures are treated as rigid constraints in FSW and the sequential cooling, as shown in Figure 2. Once the plate is cooled down to the ambient temperature, the constraints are released. Then, Point A is fixed in 3 degrees of freedom. Point B is fixed in transverse and thickness directions.
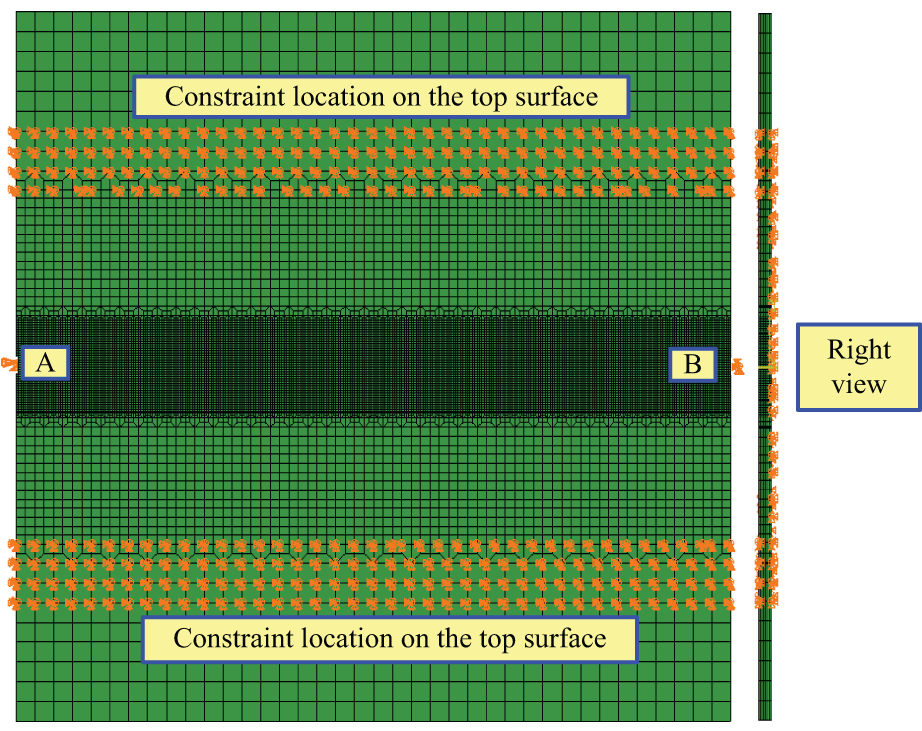
The constraint pattern for the thermo-mechanical analysis.
Results and discussion
Determination of the heat input
Different heat input powers between 1400 and 1850 W are selected for the moving heat source model for tests. It is found that the peak temperature increases with the increase in the heat input power as a quasi-linear relation, as shown in Figure 3. From the experimental data in the literature, 33 the maximum temperatures in 300, 650 and 1000 r/min are 425 °C, 453 °C and 473 °C, respectively. Then, the heat input power can be determined to be 1618, 1755 and 1846 W according to Figure 3. The experimental data from Tang et al. 33 consist of two 152 mm × 101 mm × 6.4 mm Al 6061-T6 plates. The transverse speed is 2 mm/s. The tool shoulder diameter is 19 mm and the pin diameter is 6.35 mm. The rotating speed is selected to be 300, 650 and 1000 r/min. All the parameters used in the numerical model are consistent with the literature. 33
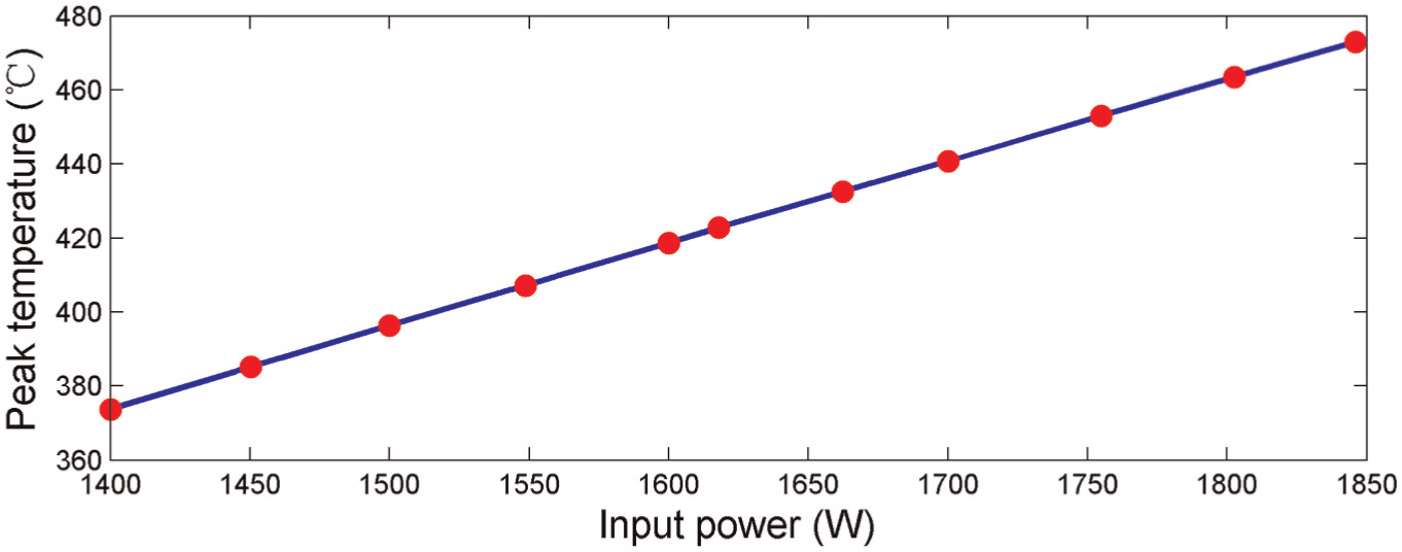
Relationship of the heat input power and the peak temperature.
The heat input power can be expressed as 34
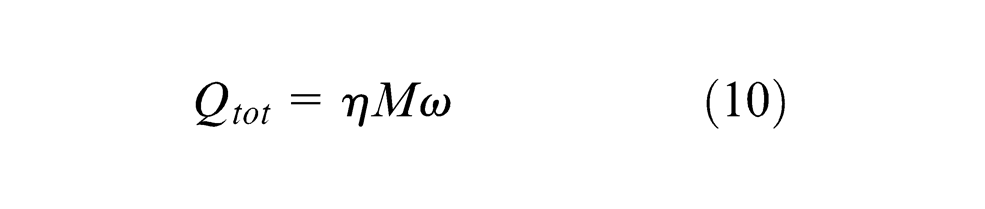
where
The torque is expressed as 36
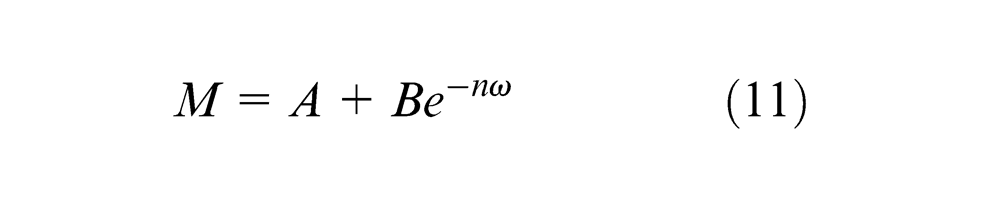
Substituting equation (11) into equation (10) gives
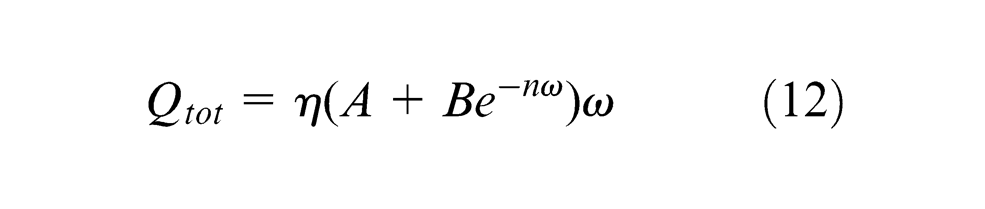
Least square method is used for the curve fitting, as shown in Figure 4.
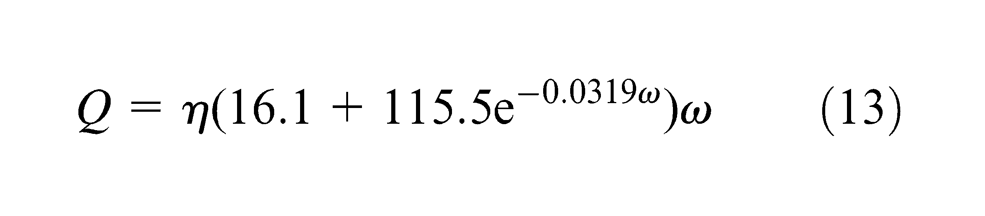
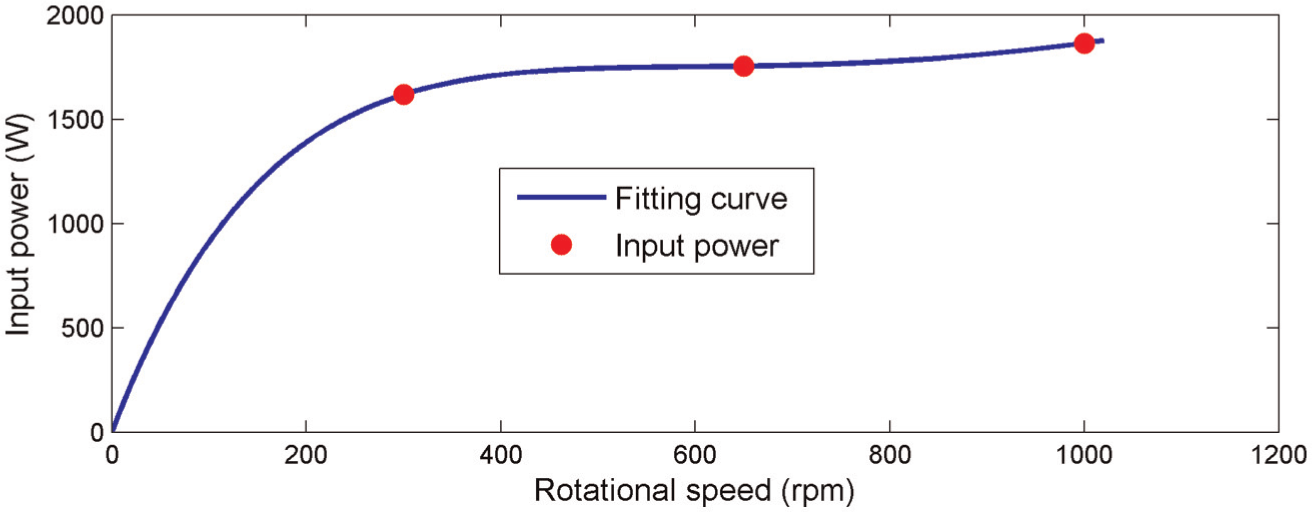
The relationship between the rotational speed and the heat input power.
Equation (13) describes the relationship between the heat input power and the rotational speed for Al 6061-T6. Using equation (13), the heat input powers for FSW in 300, 650 and 1000 r/min are determined. Then, the predicted temperature distribution can be obtained, as shown in Figures 5–7. Compared to the experimental results, 33 the errors of the simulation results are less than 1%, which can validate this work.
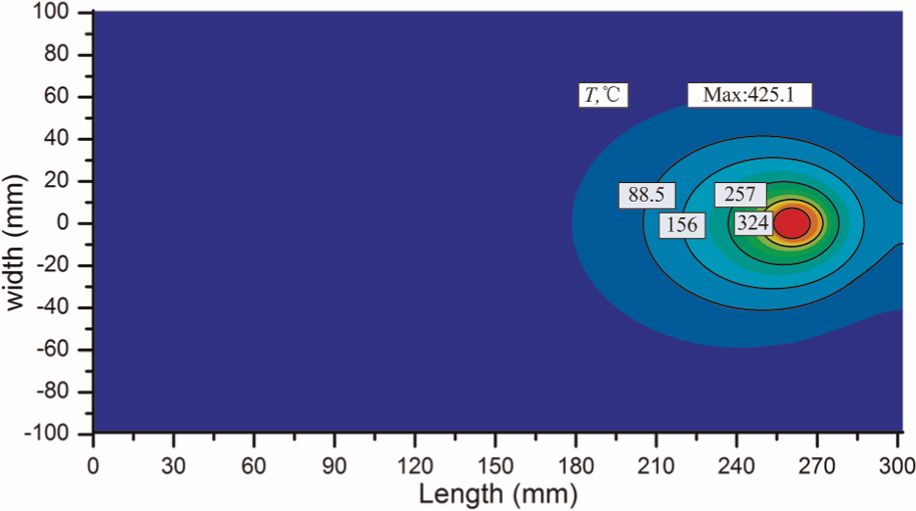
The temperature distribution at the rotational speed 300 r/min.
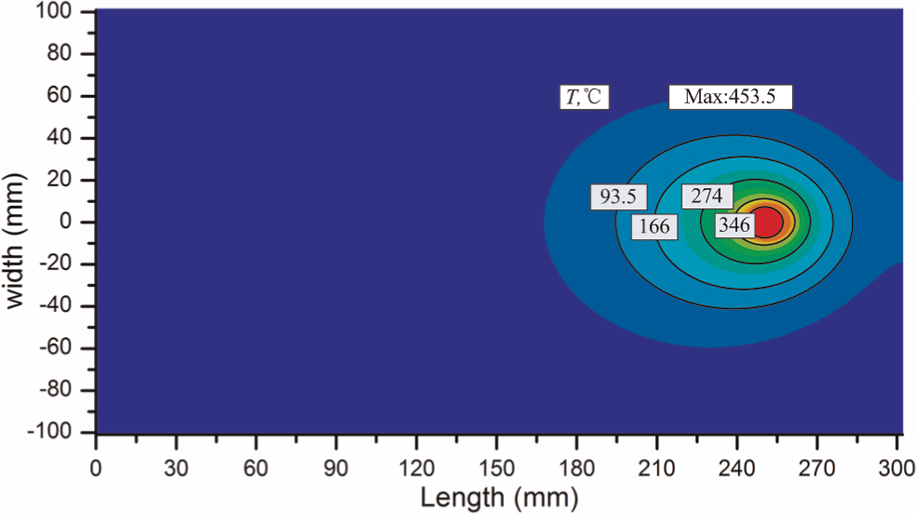
The temperature distribution at the rotational speed 650 r/min.
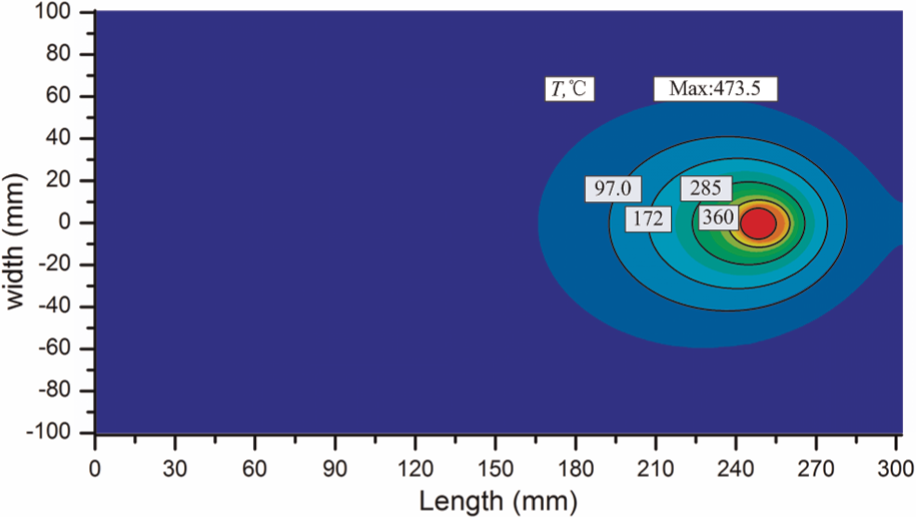
The temperature distribution at the rotational speed 1000 r/min.
From equation (13), the heat input power in 1250 r/min is 2064 W. The case of 1250 r/min is simulated by the use of the obtained heat input power.
Model validation on residual state
To validate the current model in FSW, two 240 mm × 75 mm × 4.06 mm Al 2024-T3 plates are selected according to the experiment. 37 The transverse speed is 120 mm/min and the rotational speed is 500 r/min. The shoulder diameter is 18 mm and the pin diameter is 8 mm. All the parameters used in the numerical model are consistent with the literature. 37 Figure 8 shows the comparison of the predicted temperatures and the corresponding experimental data. 37 Y is the distance between the location for measurement and the weld centerline. The predicted maximum welding temperatures at Y = 15 and 20 mm are 235.4 °C and 198.9 °C, respectively. The corresponding experimental results 37 are 223 °C and 190.7 °C. The errors are 5.56% and 4.3%, respectively.
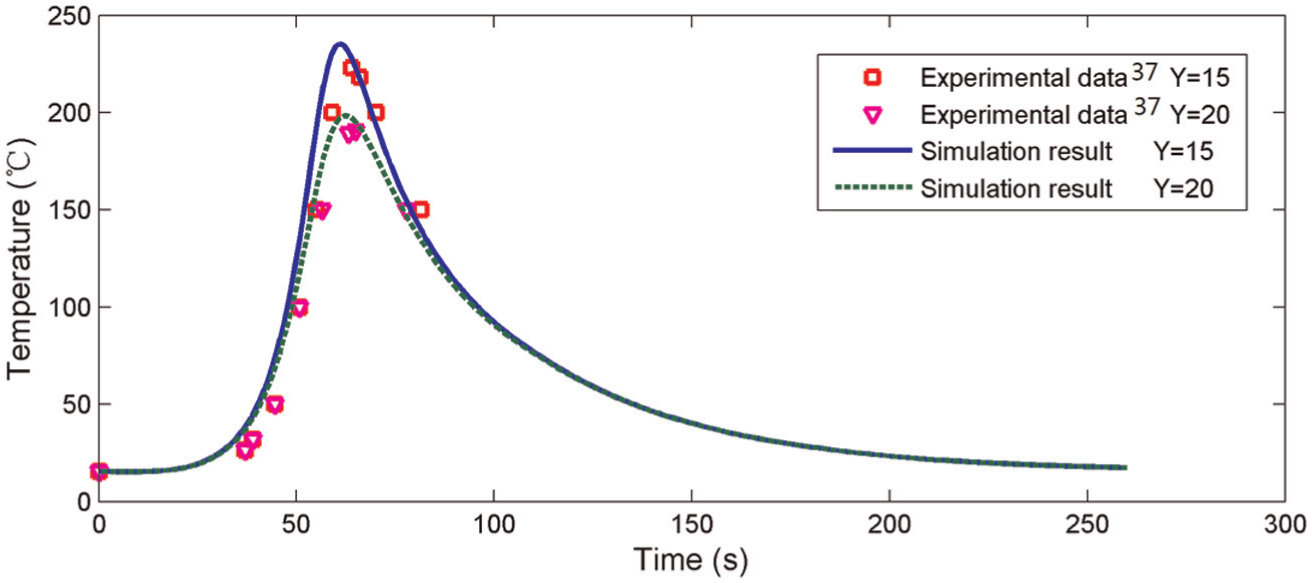
Temperature history of the simulation result and experiment data.
Figure 9 shows the predicted distortion of the FSW. The distorted plate is an anti-saddle shape. The predicted curve agrees well with the experimental data, 37 as shown in Figure 10. To further validate the predicted residual stresses, two 304 mm × 152 mm × 6.35 mm AA6061-T6 plates are selected for comparison to the residual stress obtained in the experiment, 38 as shown in Figure 11. The transverse speed is 280 mm/min and the rotational speed is 1250 r/min. The shoulder diameter is 19 mm and the pin diameter is 6.35 mm. All the parameters used in the numerical model are consistent with the literature. 38 The predicted maximum longitudinal and transverse residual stresses are 141.2 and 39.3 MPa, respectively. The corresponding experimental results 38 are 141.8 and 43.1 MPa. The errors are 0.4% and 8.8%, respectively, compared to the experiment. 38 The comparison of the predicted results and the experimental data validates the current model.
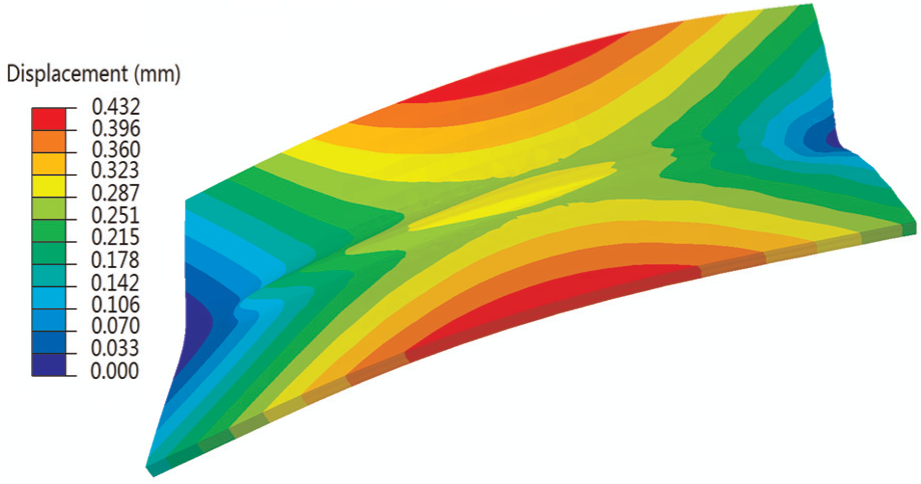
The distribution of the predicted residual distortion.
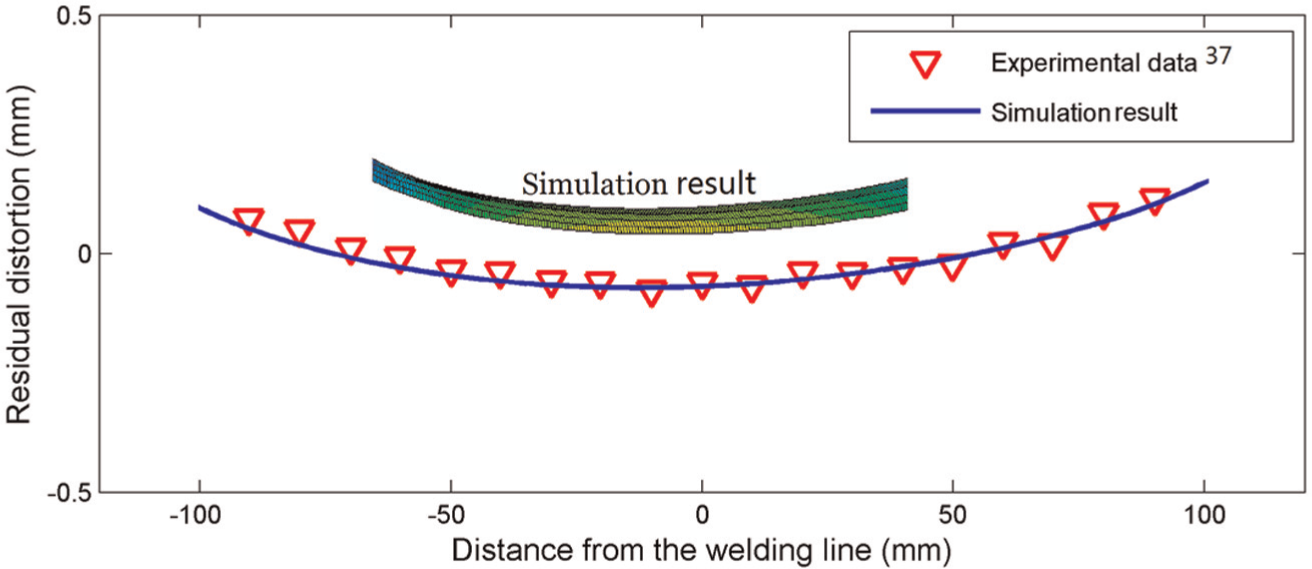
The residual distortion validation on the welding line.
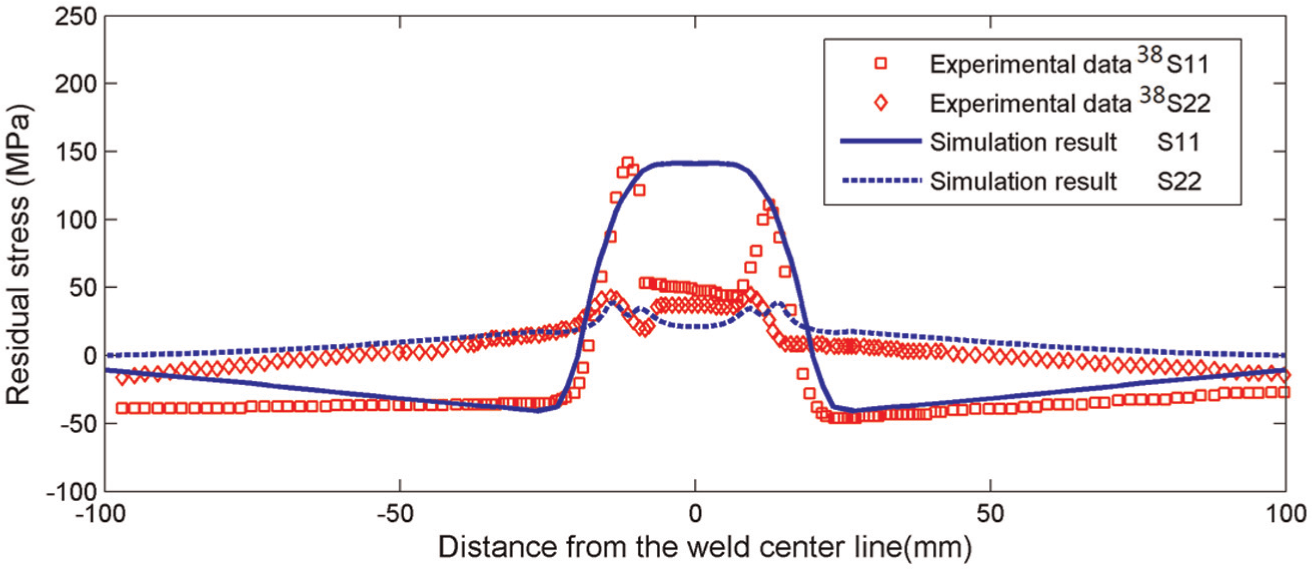
Comparison of the longitudinal (S11) and transverse (S22) residual stresses of the simulation results with the experimental data.
Size effects on residual distortions
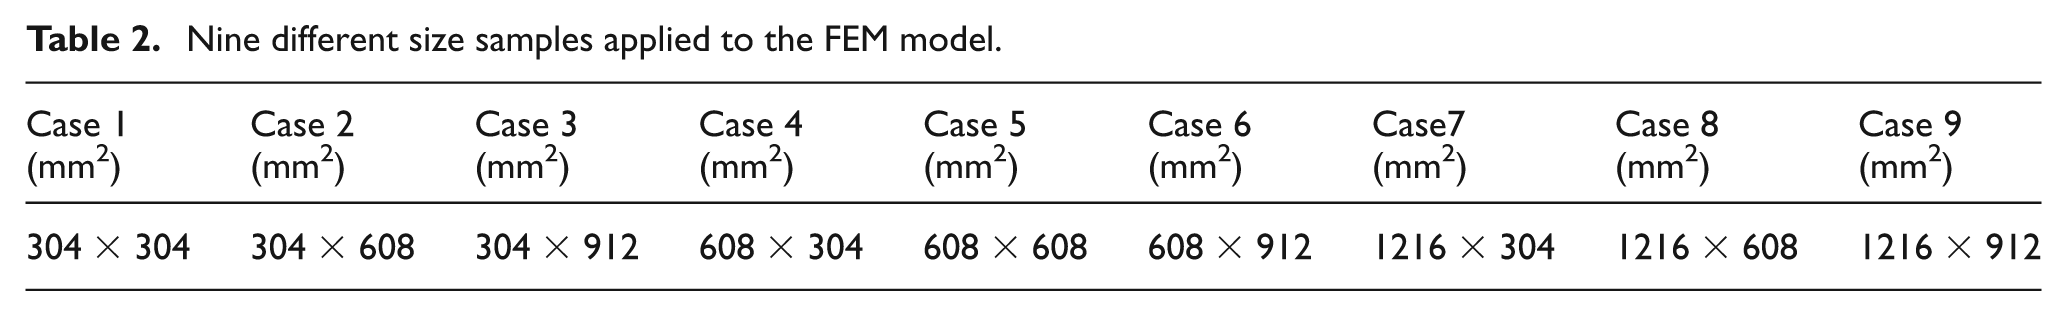
Nine different size samples applied to the finite element model are selected to investigate the influence of the plate sizes on the residual distortions, as illustrated in Table 2. The thicknesses of the samples are 6.35 mm.
Nine different size samples applied to the FEM model.
Two nodes on the top and bottom surfaces are selected for the investigation on the variation of the stress with time during the FSW process, and the node on the top surface is also selected to show the temperature history, as shown in Figure 12. The longitudinal stress of the material around the welding tool is negative due to the high temperature in this region. When the tool moves away, the longitudinal stress is transferred to be positive in the cooling period. This is the reason that the longitudinal residual stress is positive when the constraint is released.
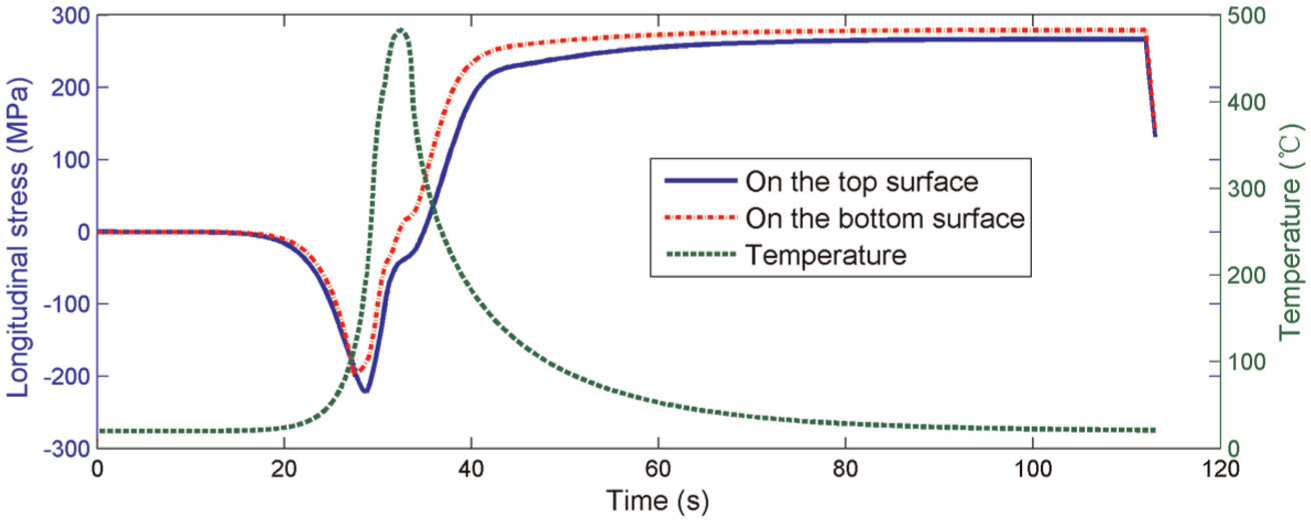
The variation of the longitudinal stresses and temperature with time.
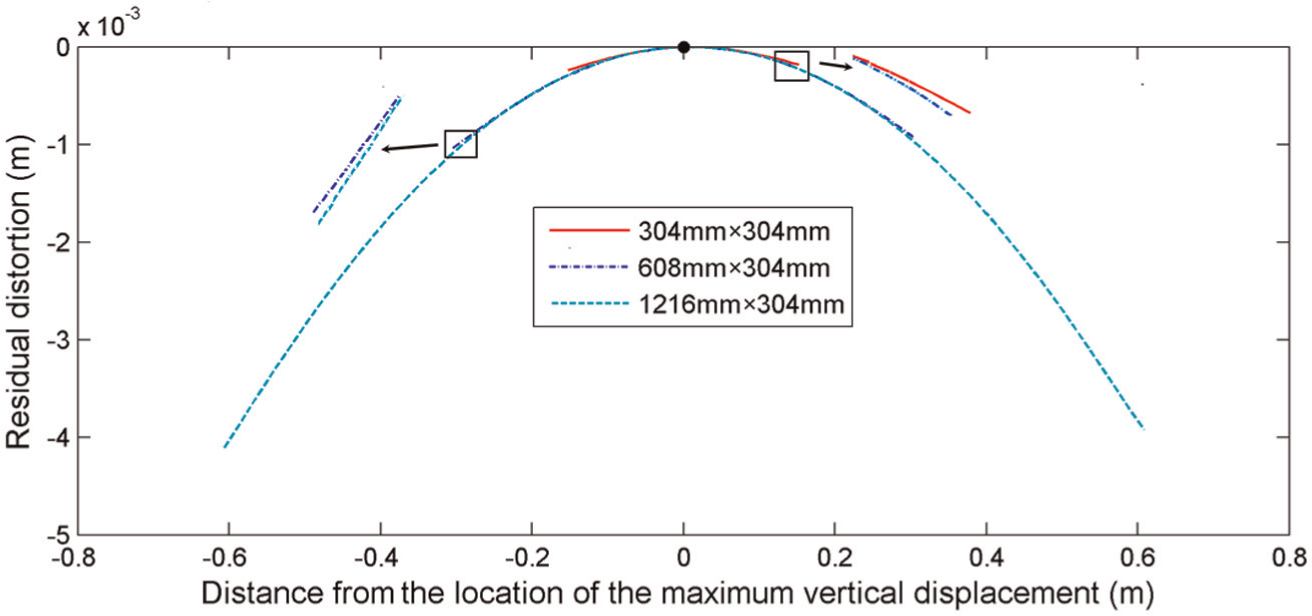
As shown in Figure 12, the longitudinal stress in the lower part of the plate is higher before releasing the constraint that causes the higher shrinkage rate in the lower part. So, the upward deformation occurs. In order to investigate the size effects of the plate on the weld distortions, the location of the maximum vertical displacement on the edge line, as shown in Figure 1, is treated as the origin of the coordinate. The longitudinal distortions in the new coordinate with different widths are shown in Figures 13–15. It can be seen that the deformation curvature decreases with the increase in the weld width.
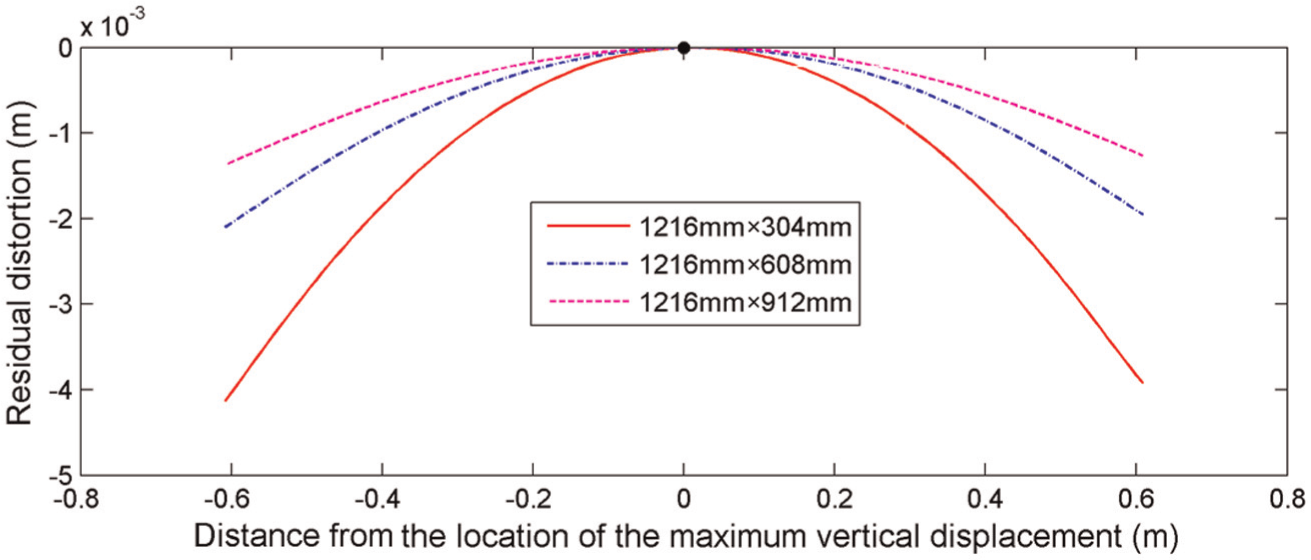
Longitudinal residual distortion profiles with the length 1216 mm.
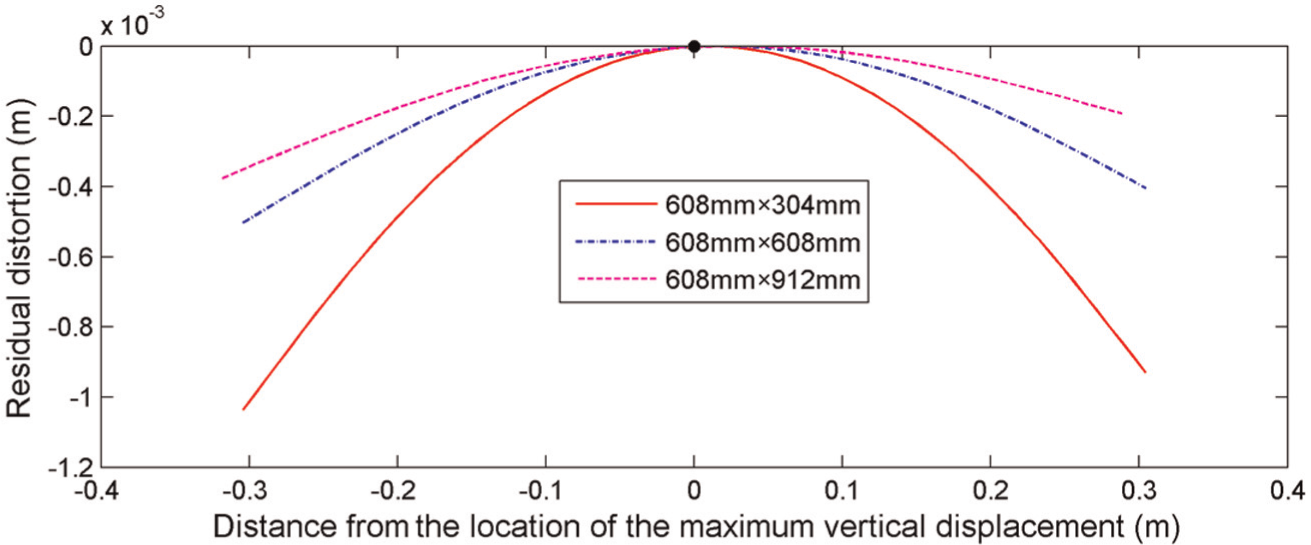
Longitudinal residual distortion profiles with the length 608 mm.
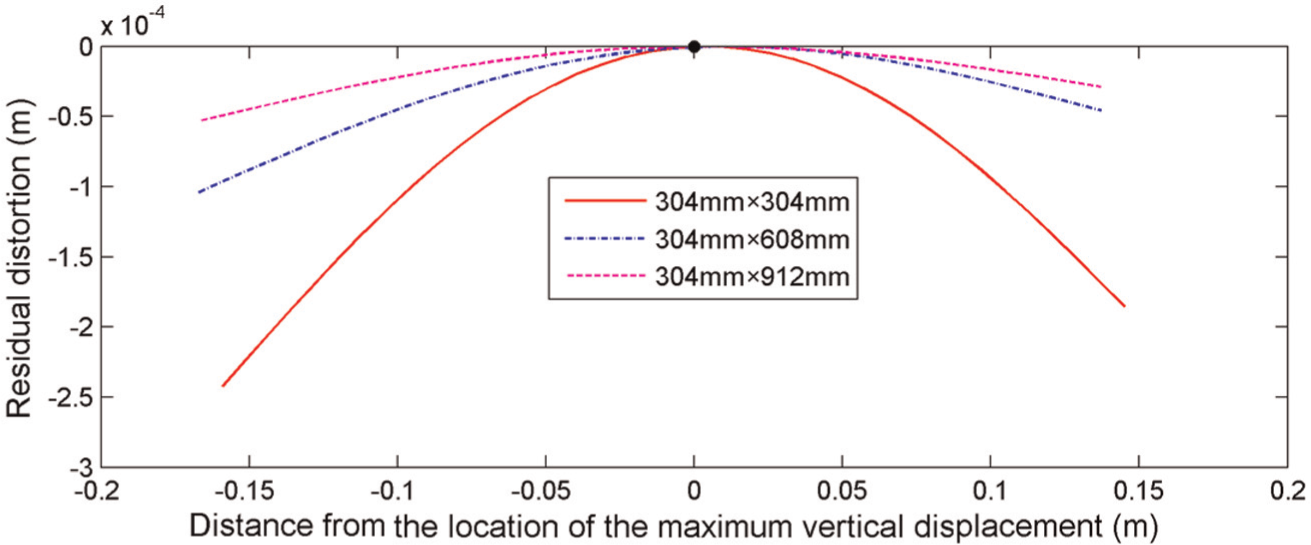
Longitudinal residual distortion profiles with the length 304 mm.
Figures 16–18 show the longitudinal distortion with different lengths. Compared to the cases with different widths, the influence of the weld length on the deformation curvature is smaller.
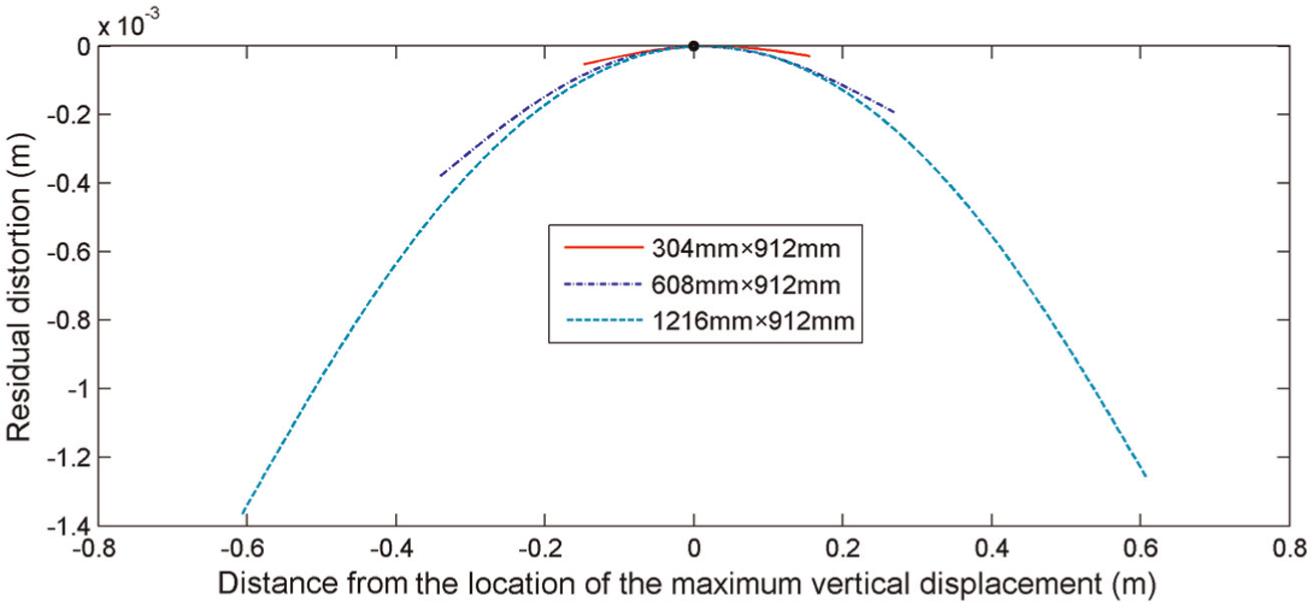
Longitudinal residual distortion profiles with the width 912 mm.
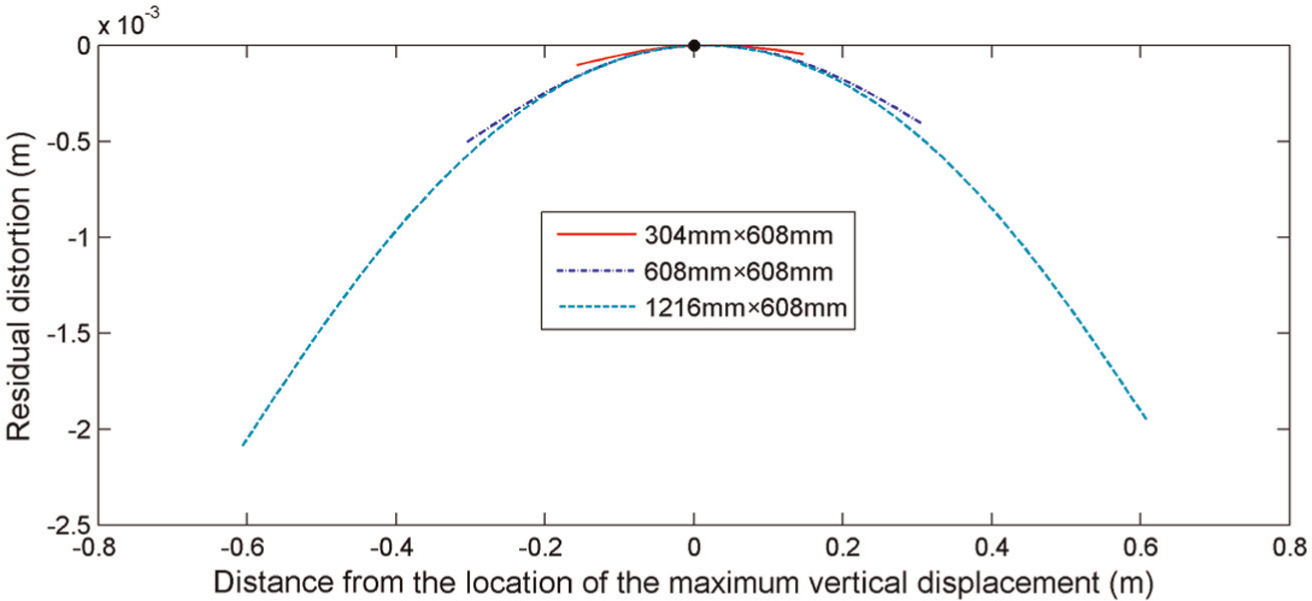
Longitudinal residual distortion profiles with the width 608 mm.
Longitudinal residual distortion profiles with the width 304 mm.
The transverse distortion is not sensitive to the plate sizes, as shown in Figure 19. The transverse residual distortion is mainly caused by the deformation in the weld zone. Far away from the weld zone, the distortion profile is quasi-linear, and the effect of the plate size on the line slope is very small.
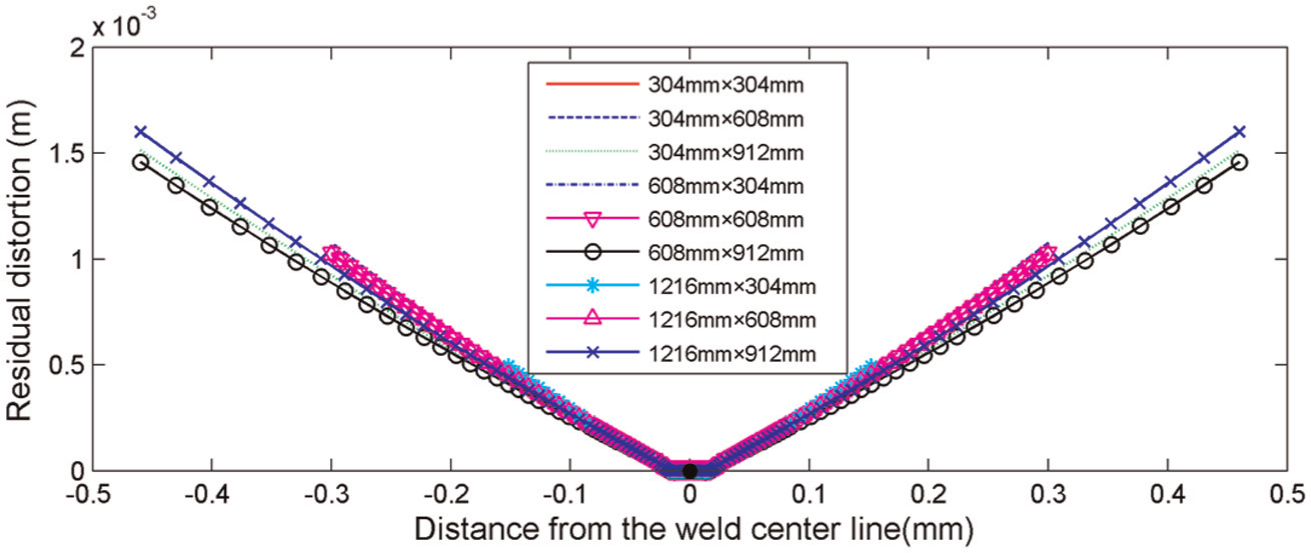
Transverse residual distortion profiles of the nine cases.
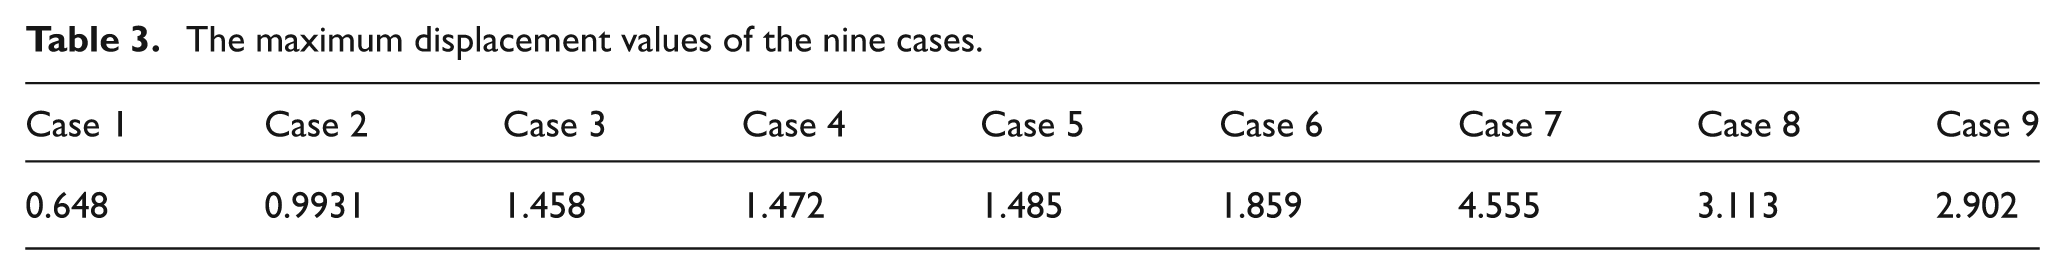
The maximum displacements of the nine cases are summarized in Table 3. A function is established to describe the relationship between the maximum displacement and the model sizes
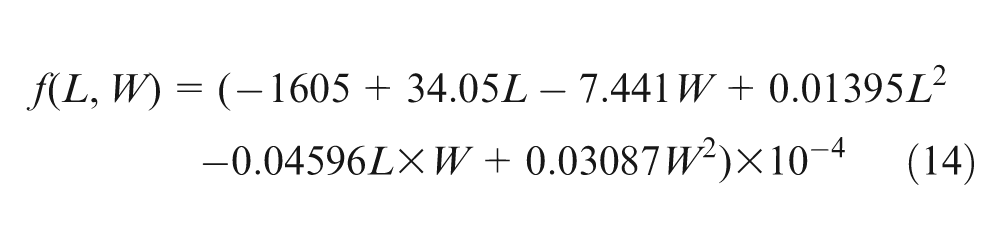
where L and W are the length and width of the weld, respectively.
The maximum displacement values of the nine cases.
Two different size samples applied to the finite element model (456 mm × 304 mm and 456 mm × 456 mm) are selected to verify the feasibility of equation (14). The maximum displacements of the simulation are 1.004 and 1.07 mm. The predictions according to equation (14) are 1.104 and 1.029 mm. The errors are less than 10%, which can validate the established function.
Conclusion
Sequentially coupled thermo-mechanical model with validations of the experimental data in published works33,37,38 is used for FSW in this article. The size effects of the weld plates on residual states are investigated. The main results are summarized as follows.
The relationship between the heat input power and the peak temperature is quasi-linear. A function is established to describe the relationship between the rotational speed and the heat input power. The longitudinal deformation curvature increases with the decrease in the width. The influence of the length on the deformation curvature is smaller compared with the effect of the width. The plate size has little effect on the transverse deformation curvature. The relationship between the maximum residual distortion and the plate sizes is established.
Footnotes
Declaration of conflicting interests
The authors declare that there is no conflict of interest.
Funding
This work was supported by Program for New Century Excellent Talents in University, the Fundamental Research Funds for the Central Universities, the National Natural Science Foundation of China (No. 11172057), the National Key Basic Research Special Foundation of China (2011CB013401) and the National High Technology Research and Development Program of China (2012AA050901).