
Abstract
The Taguchi method has been found effective for optimizing a single quality response. In reality, customers are concerned about multiple quality responses of a product. Although several approaches have been proposed to deal with this issue, however they ignored engineers’ satisfaction regarding process factor settings. This research, therefore, proposes an approach for optimizing multiple responses in the application of the Taguchi method. The mathematical relationships between each response quality and process factors are first formulated. Then, a proper satisfaction function is selected to represent each response and process factor. A complete optimization model is developed. Three case studies are provided for illustration; in all of which the proposed approach provides the largest improvement percentages while considering process engineers’ satisfaction about process factors. Compared to previous approaches in literature, such as gray analysis and fuzzy-gray analysis, the proposed approach provides optimal solution within factor setting ranges, relies on mathematical relationships between response and process factors, and considers engineers’ preference regarding process factor settings. Definitely, the proposed approach shall provide practitioners a great assistance in optimizing performance with multiple responses while considering their preferences about responses as well as process factor settings.
Introduction
In today’s escalating competition, customers are concerned about more than one quality characteristic of a product or process. The Taguchi 1 method utilizes fractional factorial designs, or so-called orthogonal arrays, to determine the combination of factor levels that optimize a quality response of main interest. There are three main types of quality responses, including the smaller-the-better (STB), the larger-the-better (LTB), and the nominal-the-best (NTB). The Taguchi method is reported to be only efficient in optimizing business application with a single quality response. 2 Therefore, optimization of multiple responses has received an increasing research attention.3–17 Nevertheless, most of the proposed approaches in previous literature relied on nonparametric methods and ignored the satisfaction of a decision maker about process settings due to cost and time constraints or the preference on desired response values.
The concept of satisfaction functions 18 explicitly integrates the decision maker’s preferences in goal programming models in an uncertain environment and evaluates the impact of the deviations from the decision maker’s aspiration level. The general shape of the satisfaction function is presented in Figure 1, where Fi(δi) is the satisfaction function associated with deviations δi, αid is the indifference threshold, αio is the dissatisfaction threshold, and αiv is the veto threshold.
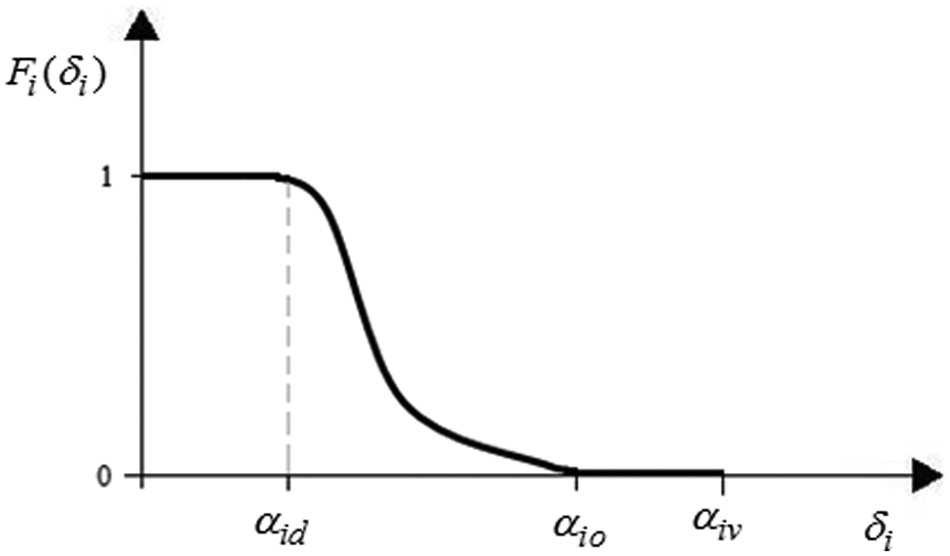
The general shape of the satisfaction functions.
In Figure 1, the Fi(δi) in the interval [0, αid] indicates total satisfaction. Then, satisfaction decreases within the interval (αid, αio]. The Fi(δi) in the interval (αio, αiv] indicates dissatisfaction. Otherwise, the solution is completely unacceptable. The concept of satisfaction functions has been utilized in different applications.19–22
The concept of satisfaction functions has been rarely reported in optimizing business performance. This research, therefore, aims at optimizing multiple responses in manufacturing applications on the Taguchi method utilizing satisfaction function model. This approach is of great importance to practitioners seeking improving a product or process performance while considering desired response targets and engineer’s satisfaction about factor settings. The remaining of this article including the introduction is organized as follows. Section “The proposed optimization approach” introduces the proposed approach. Section “Illustrations of the proposed optimization approach” provides three case studies for illustration. Section “Optimization results” summarizes research results. Finally, conclusions are made in section “Conclusion”.
The proposed optimization approach
Typically, the Taguchi method conducts I experiments with different level combinations of J controllable process factors to optimize K responses. The proposed optimization approach is outlined in the following steps:
Step 1. Formulate mathematical relationships between the kth response and the J process factors, that is
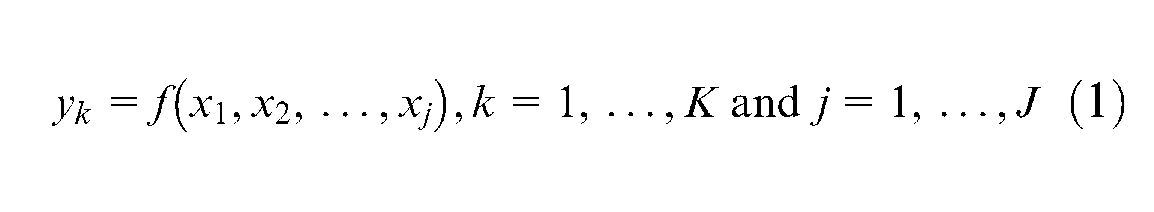
where f is assumed to be a linear function that relates the kth response, yk, with the J process factors, xj.
Step 2. Let S, L, and N denote the number of responses of STB, LTB, and NTB, respectively. Define a proper satisfaction function to represent each response, yk, as follows:
1. For the STB-type response, the proper satisfaction function is depicted in Figure 2 and is expressed as 13
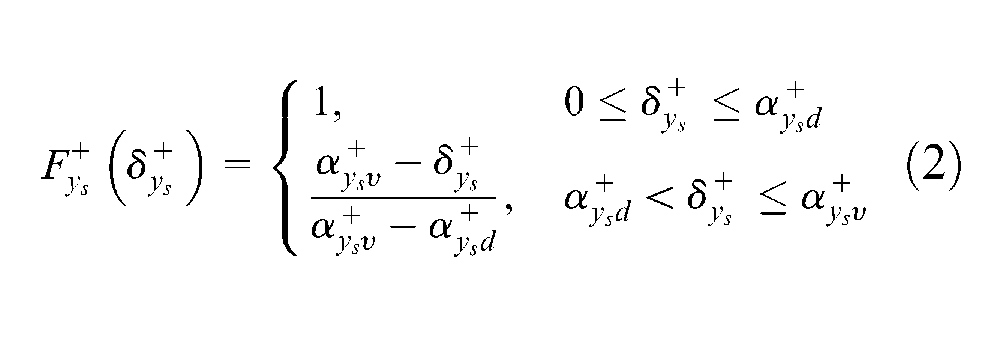
where
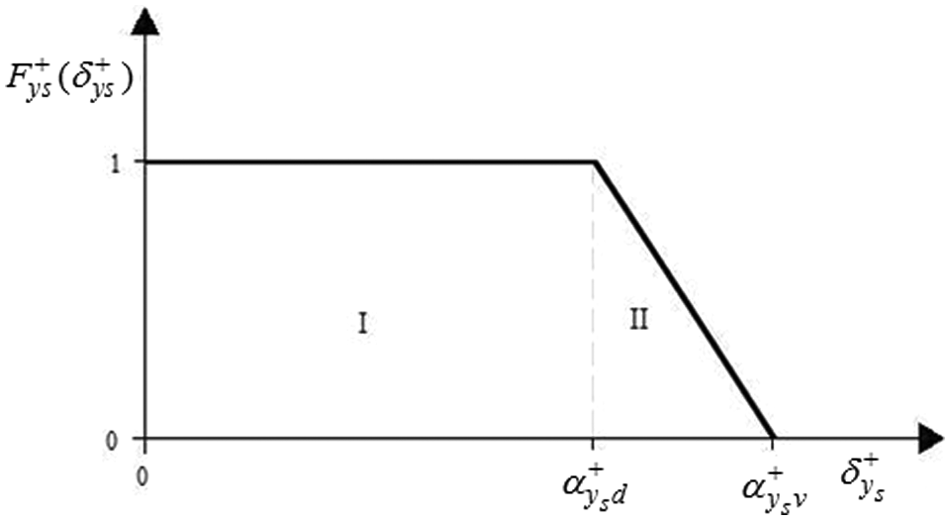
The satisfaction function for STB-type response.
Furthermore, the corresponding constraints will be

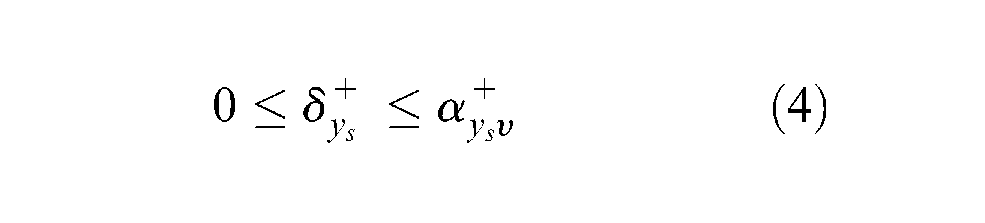
Equation (3) indicates that the value of ys is larger than gys by a value of
Then, the
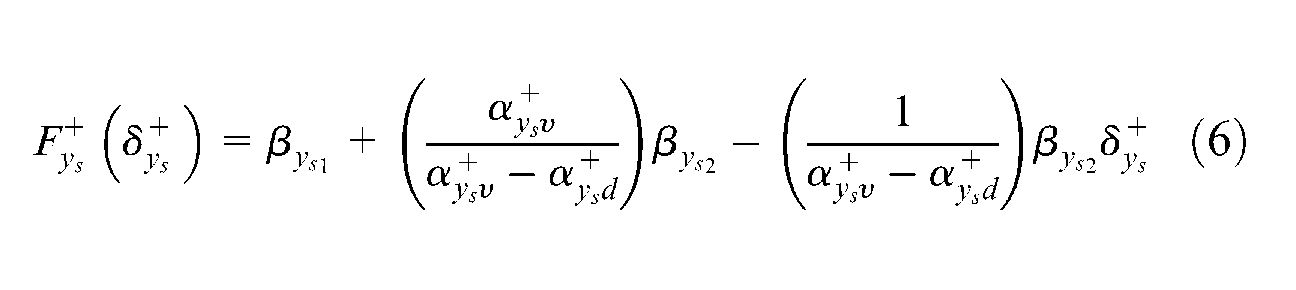
Since the process engineer seeks the largest degree of satisfaction, the objective function is to maximize
Since maximize
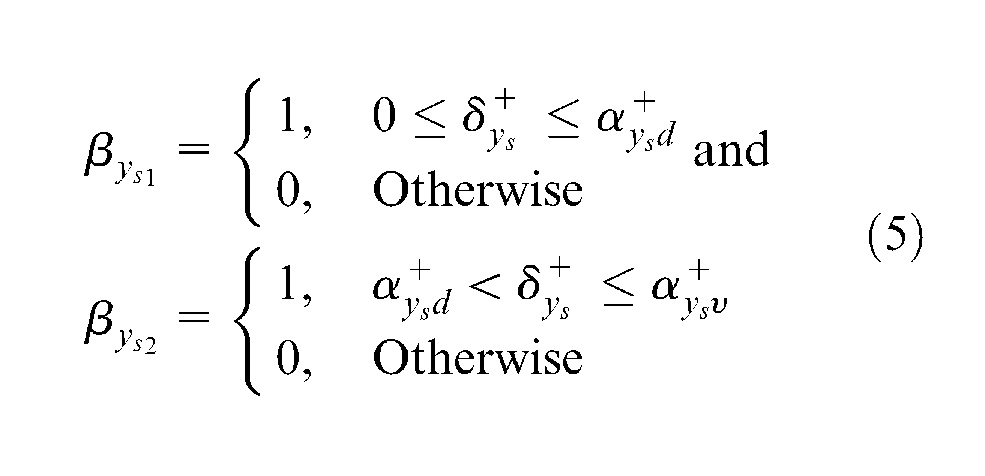
where
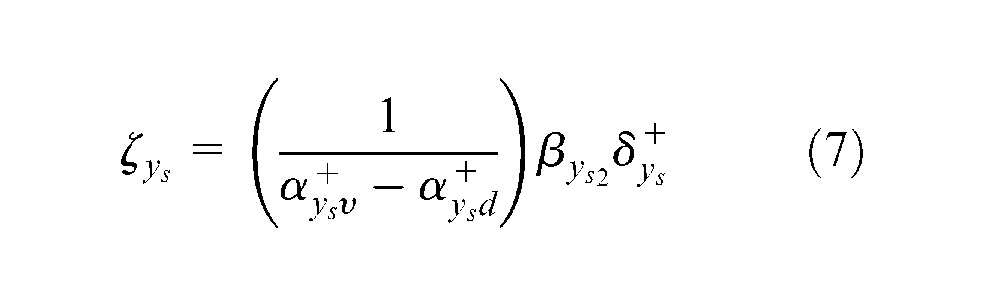
Knowing that, when
Utilizing equation (5), additional two constraints are formulated
Finally, the objective function is to maximize the satisfaction function and is expressed as follows
2. For the LTB-type response, let
The satisfaction function for LTB-type response.
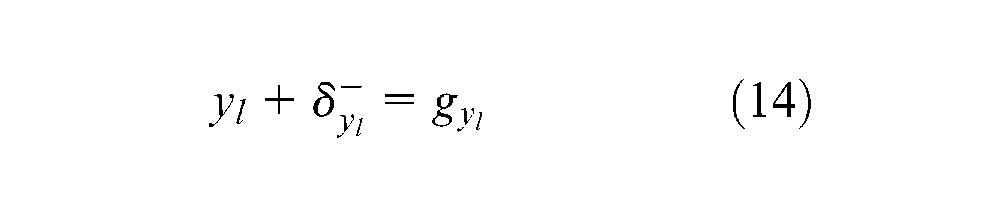
Typically, a process engineer aims to obtain the upper desired value of LTB response. Let gyl be the upper bound of the yl. The associated constraints will be
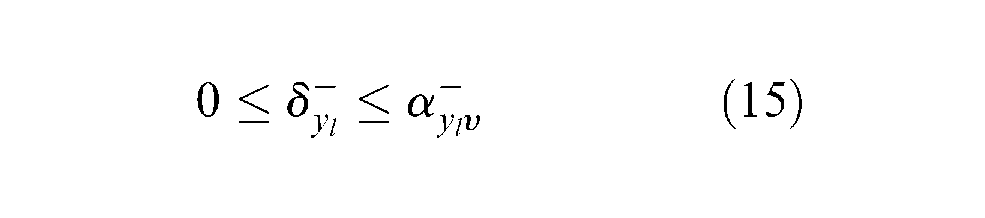
Similar to STB, two binary variables,
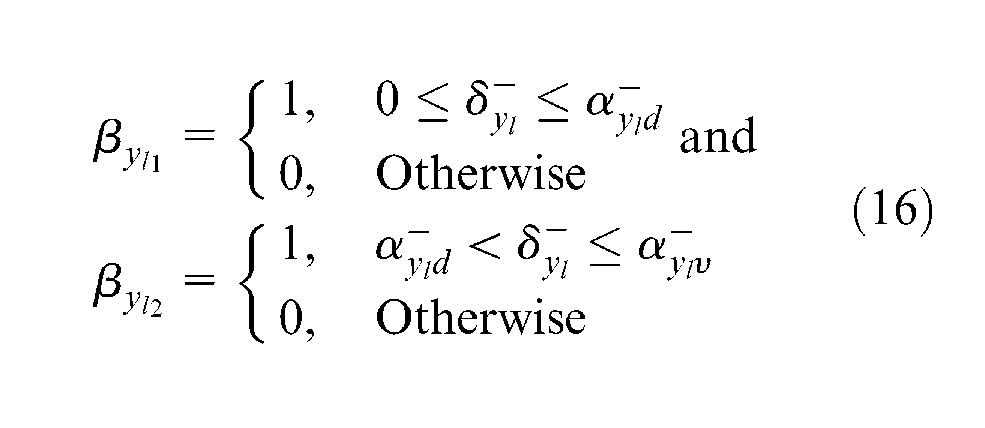
Then, the
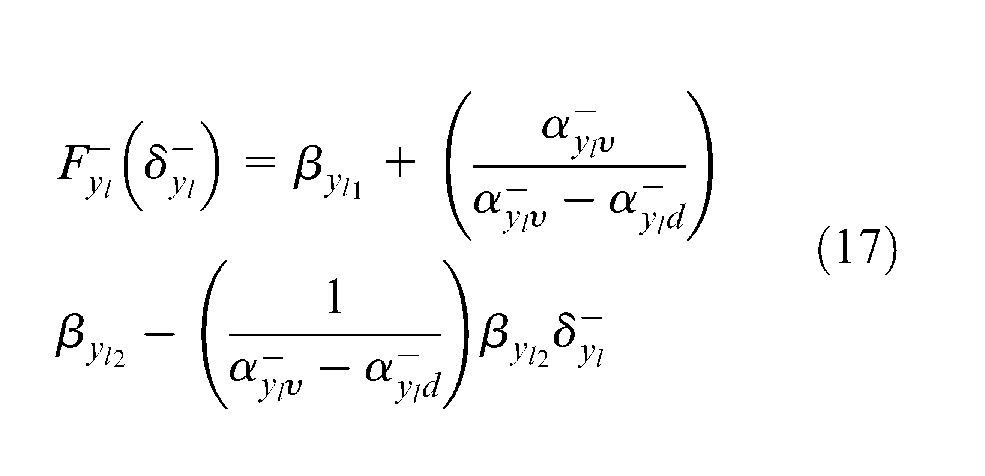
Equation (17) includes nonlinear terms. A linear form can be expressed as
Knowing that the sum of
Finally, the objective function will be to maximize the satisfaction function or mathematically
3. For the NTB-type response, let
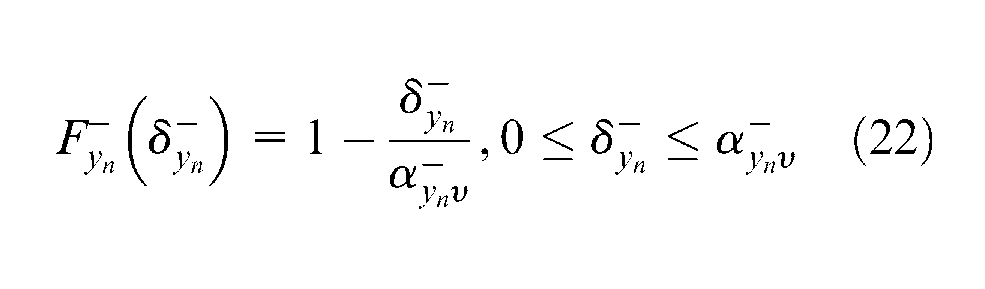
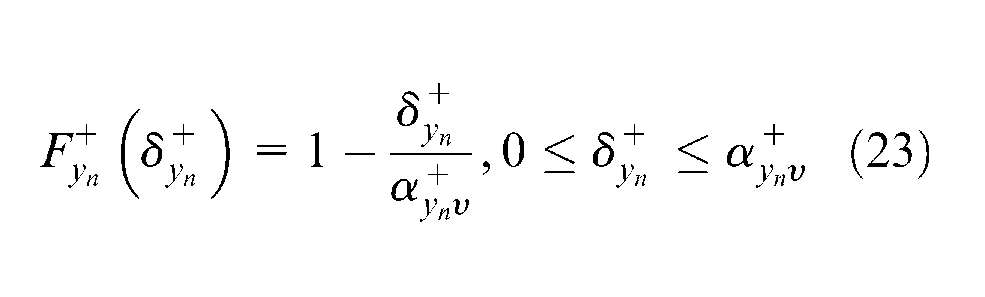
The
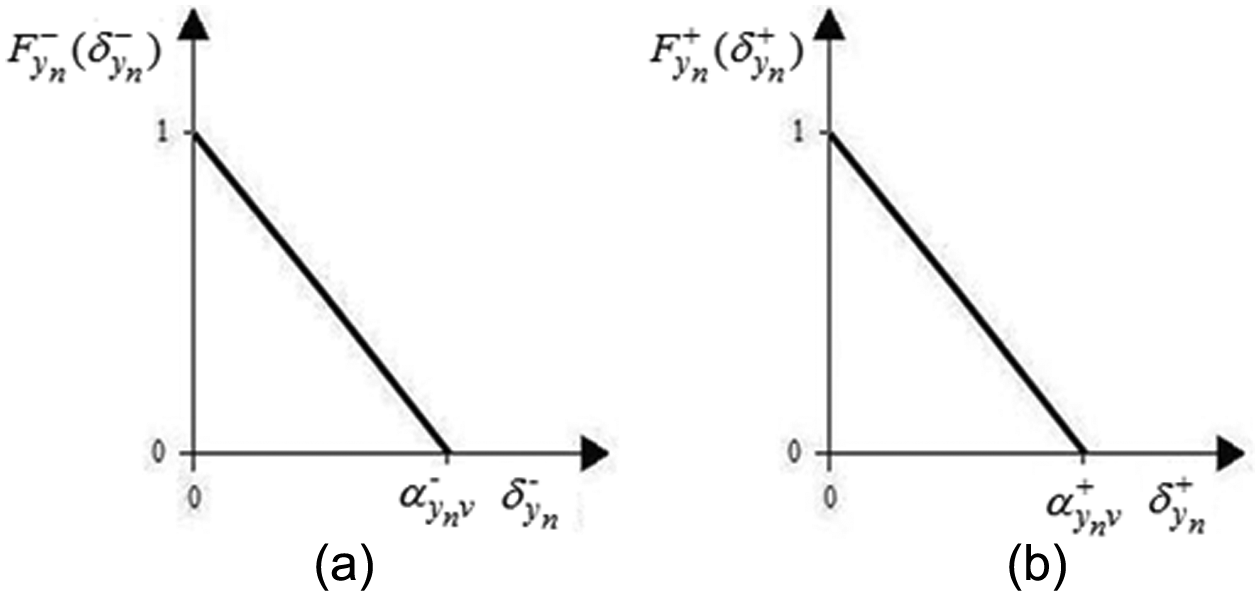
The satisfaction functions for the NTB-type response: (a) negative deviation and (b) positive deviation.
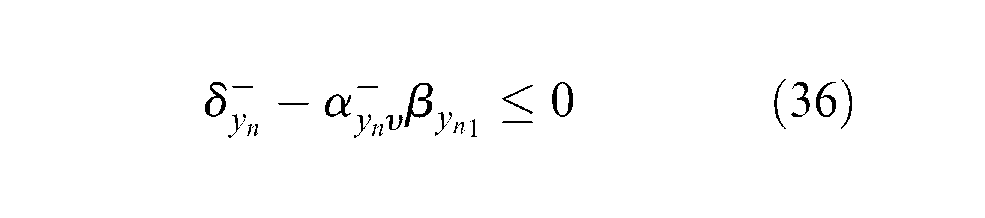
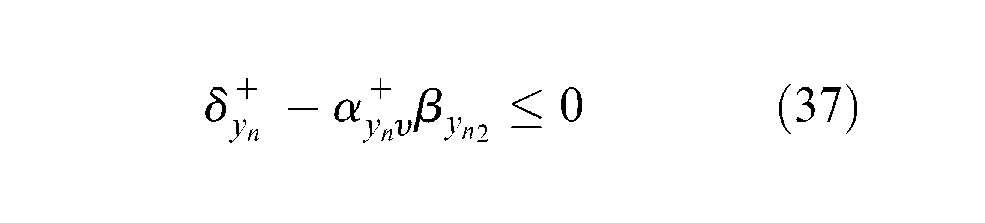
Hence, the model constraints are expressed as
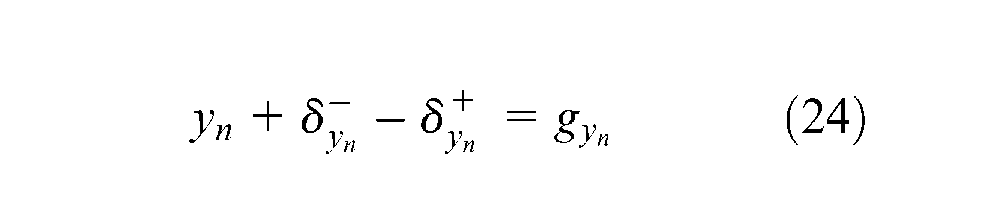
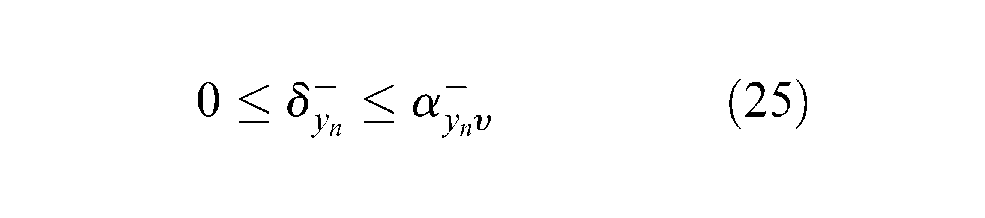

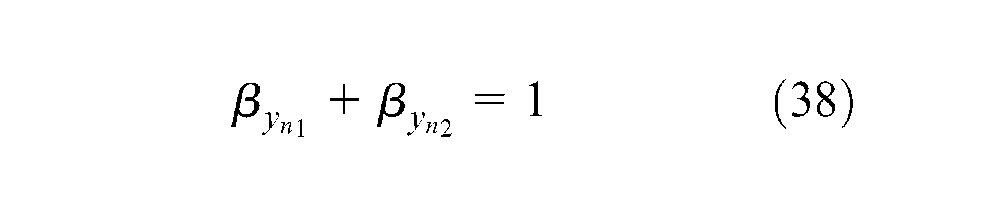
However, at least one of
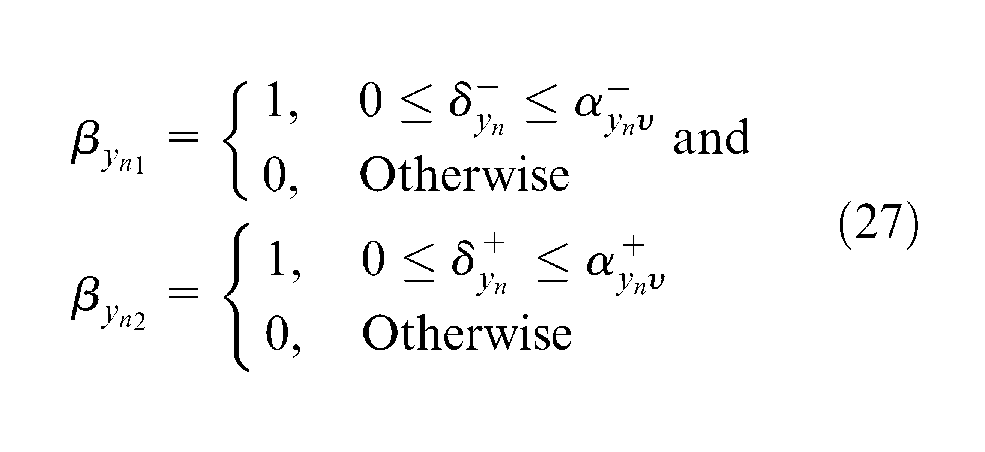
Accordingly, two satisfaction functions are obtained and can be rewritten as
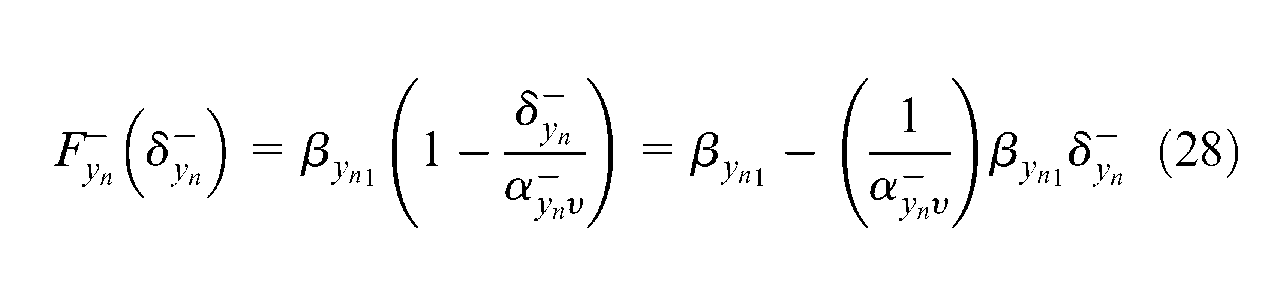
However, the variables
Since maximize
Equivalently
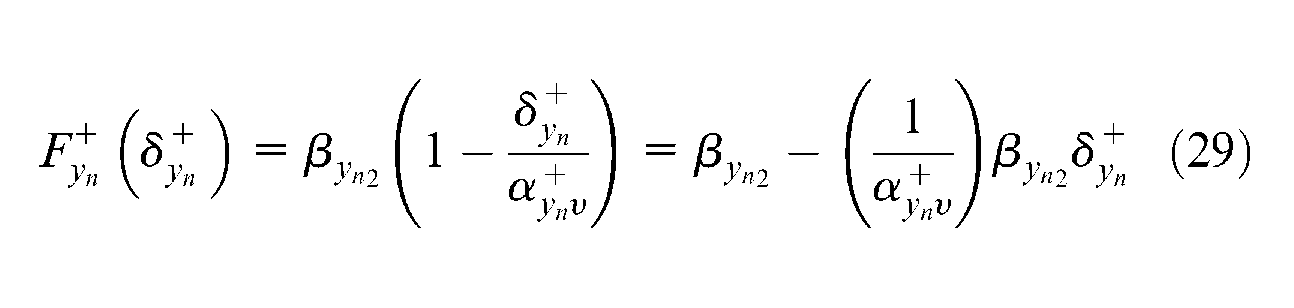
Similarly, let
Since maximize
or
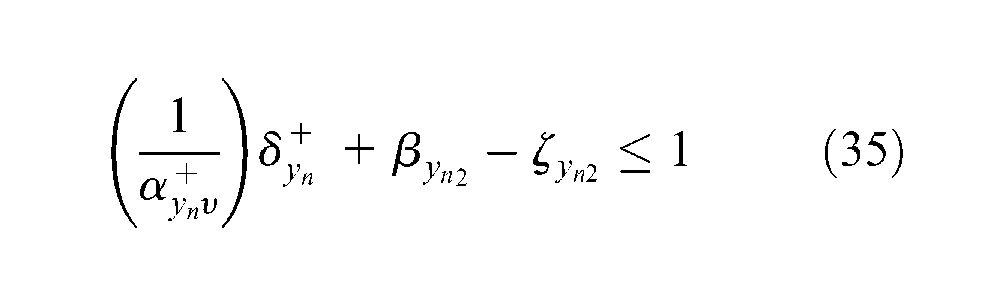
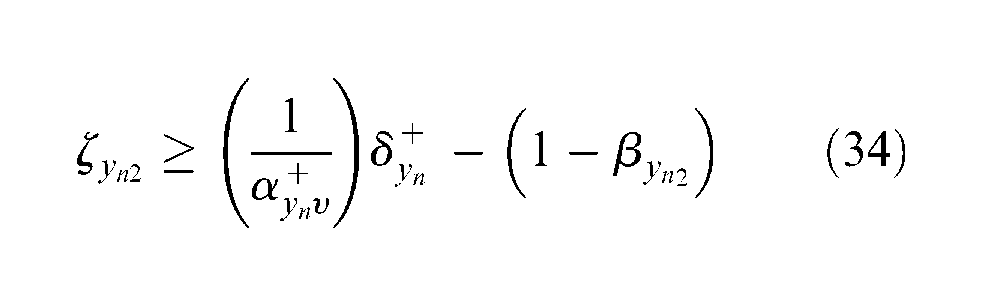
In a similar manner, the following constraints are formulated
Also
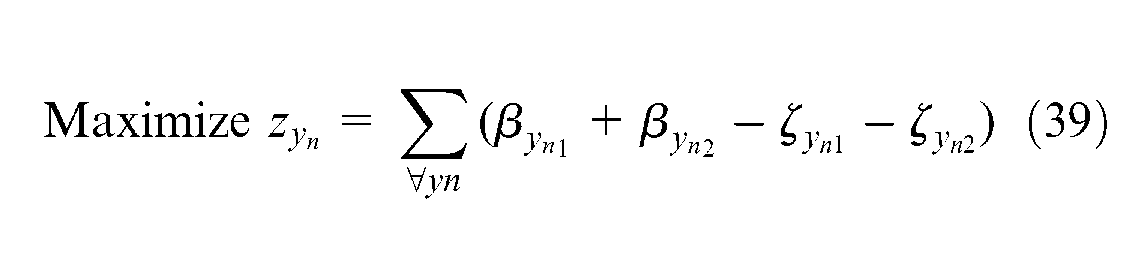
In the end, the objective function will be to maximize the sum of the satisfaction functions; equivalently
Step 3. In Taguchi method, a process engineer has no information about the target value of xj. Thus, the satisfaction functions for negative and positive deviations shown in Figure 5 are used to describe the jth process factor. The imprecise fuzzy value, gxj, of xj, is usually preferred at interval midrange. Let
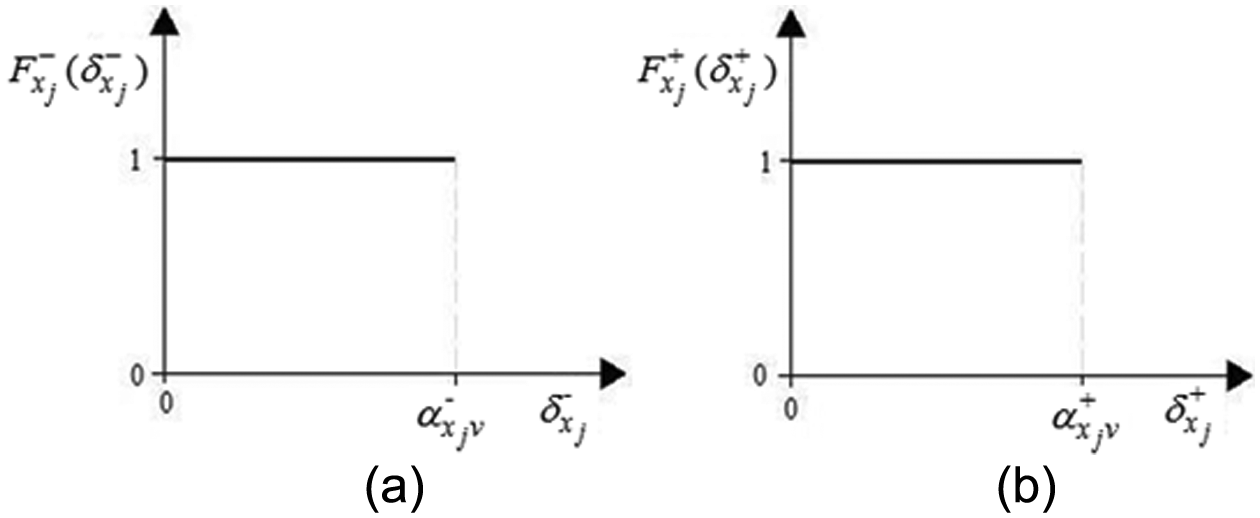
The satisfaction functions for the process variables: (a) negative deviation and (b) positive deviation.
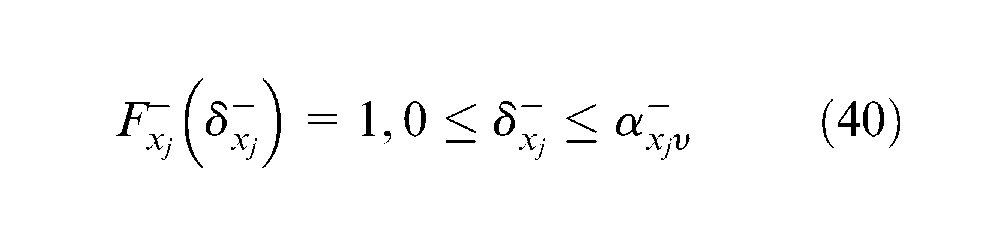
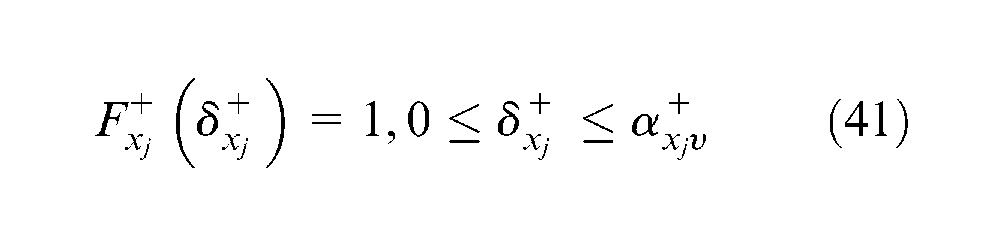
The

and

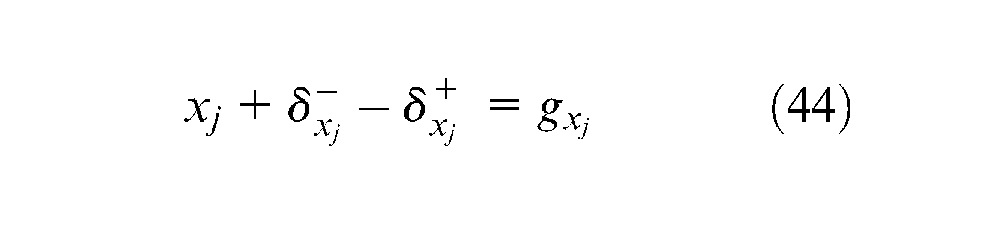
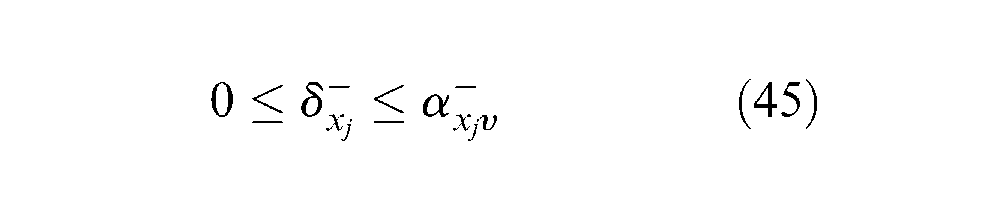
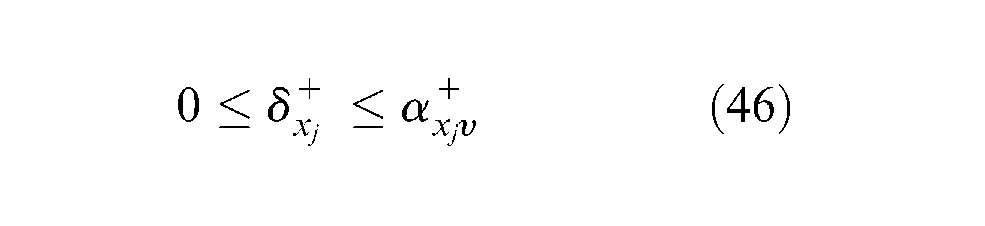
Furthermore, the constraints of xj are formulated as
Similarly, two binary variables are required to represent the xj satisfaction functions, which are defined as
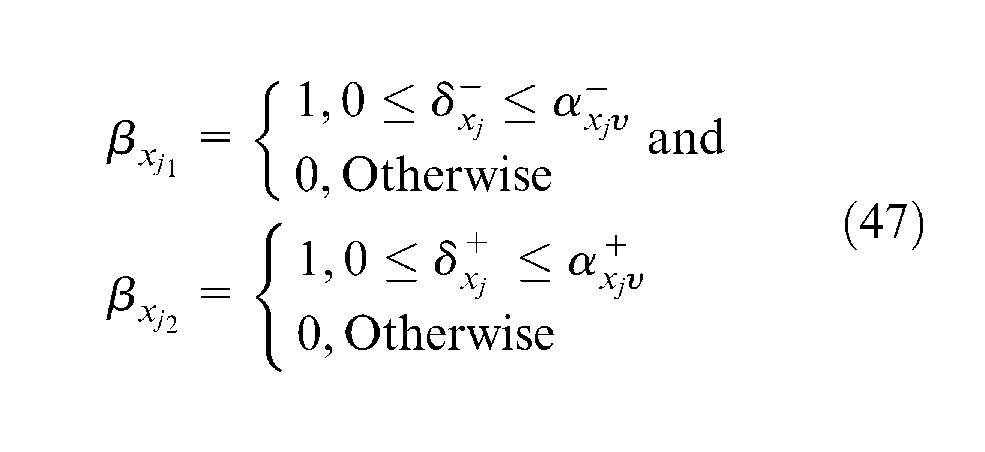
Thus, the satisfaction functions, equations (46) and (47), can be rewritten as


Similarly, the following constraints can be formulated
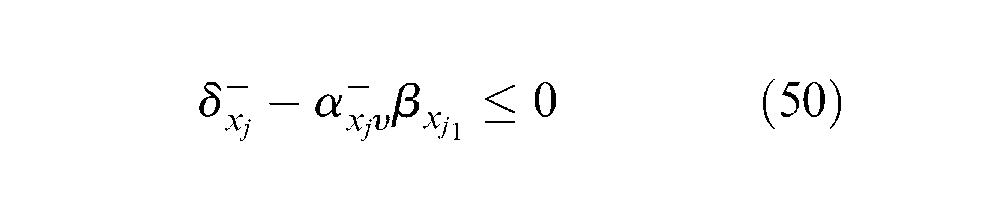

Also

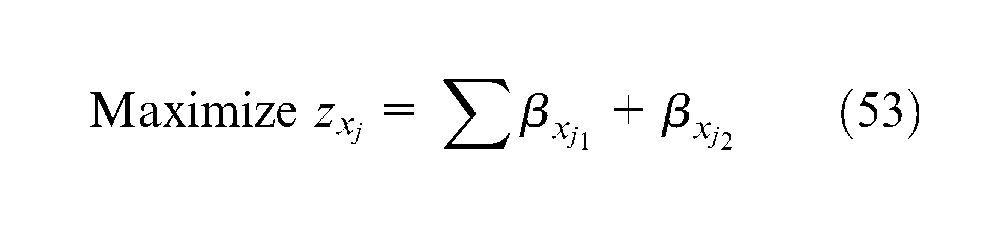
Finally, the objective function is expressed as
Step 4. Assign weights for the objectives of the satisfaction functions, wys, wyl, wyn, and wxj, according to their relative importance to a process or product. For a combination of sth, lth, and nth responses with J process factors, the general optimization model is formulated as
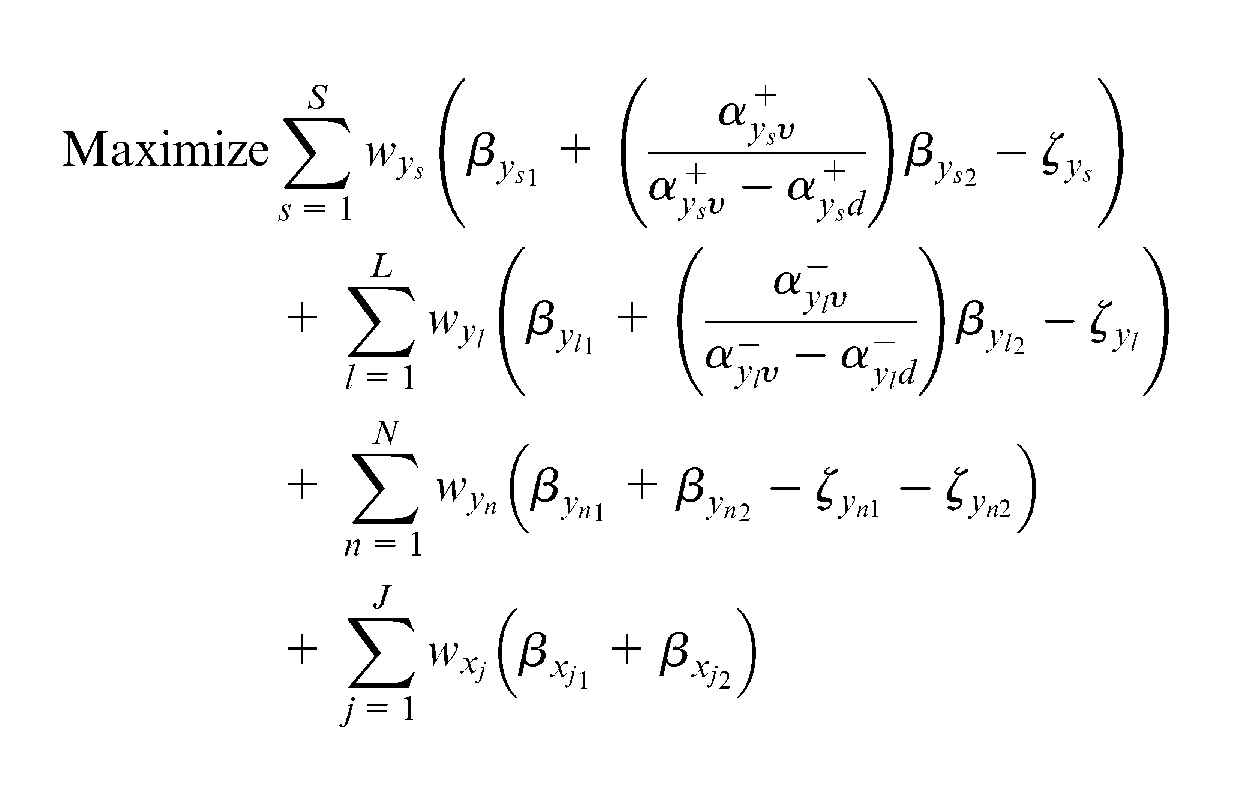
Subject to


Step 5. Solve the optimization model to determine the values of the decision variables xj and yk. Validate or compare the obtained results with those obtained using other approaches.
Illustrations of the proposed optimization approach
Three case studies are employed to illustrate the proposed procedure.
Optimizing the process conditions of an injection-molded thermoplastic part
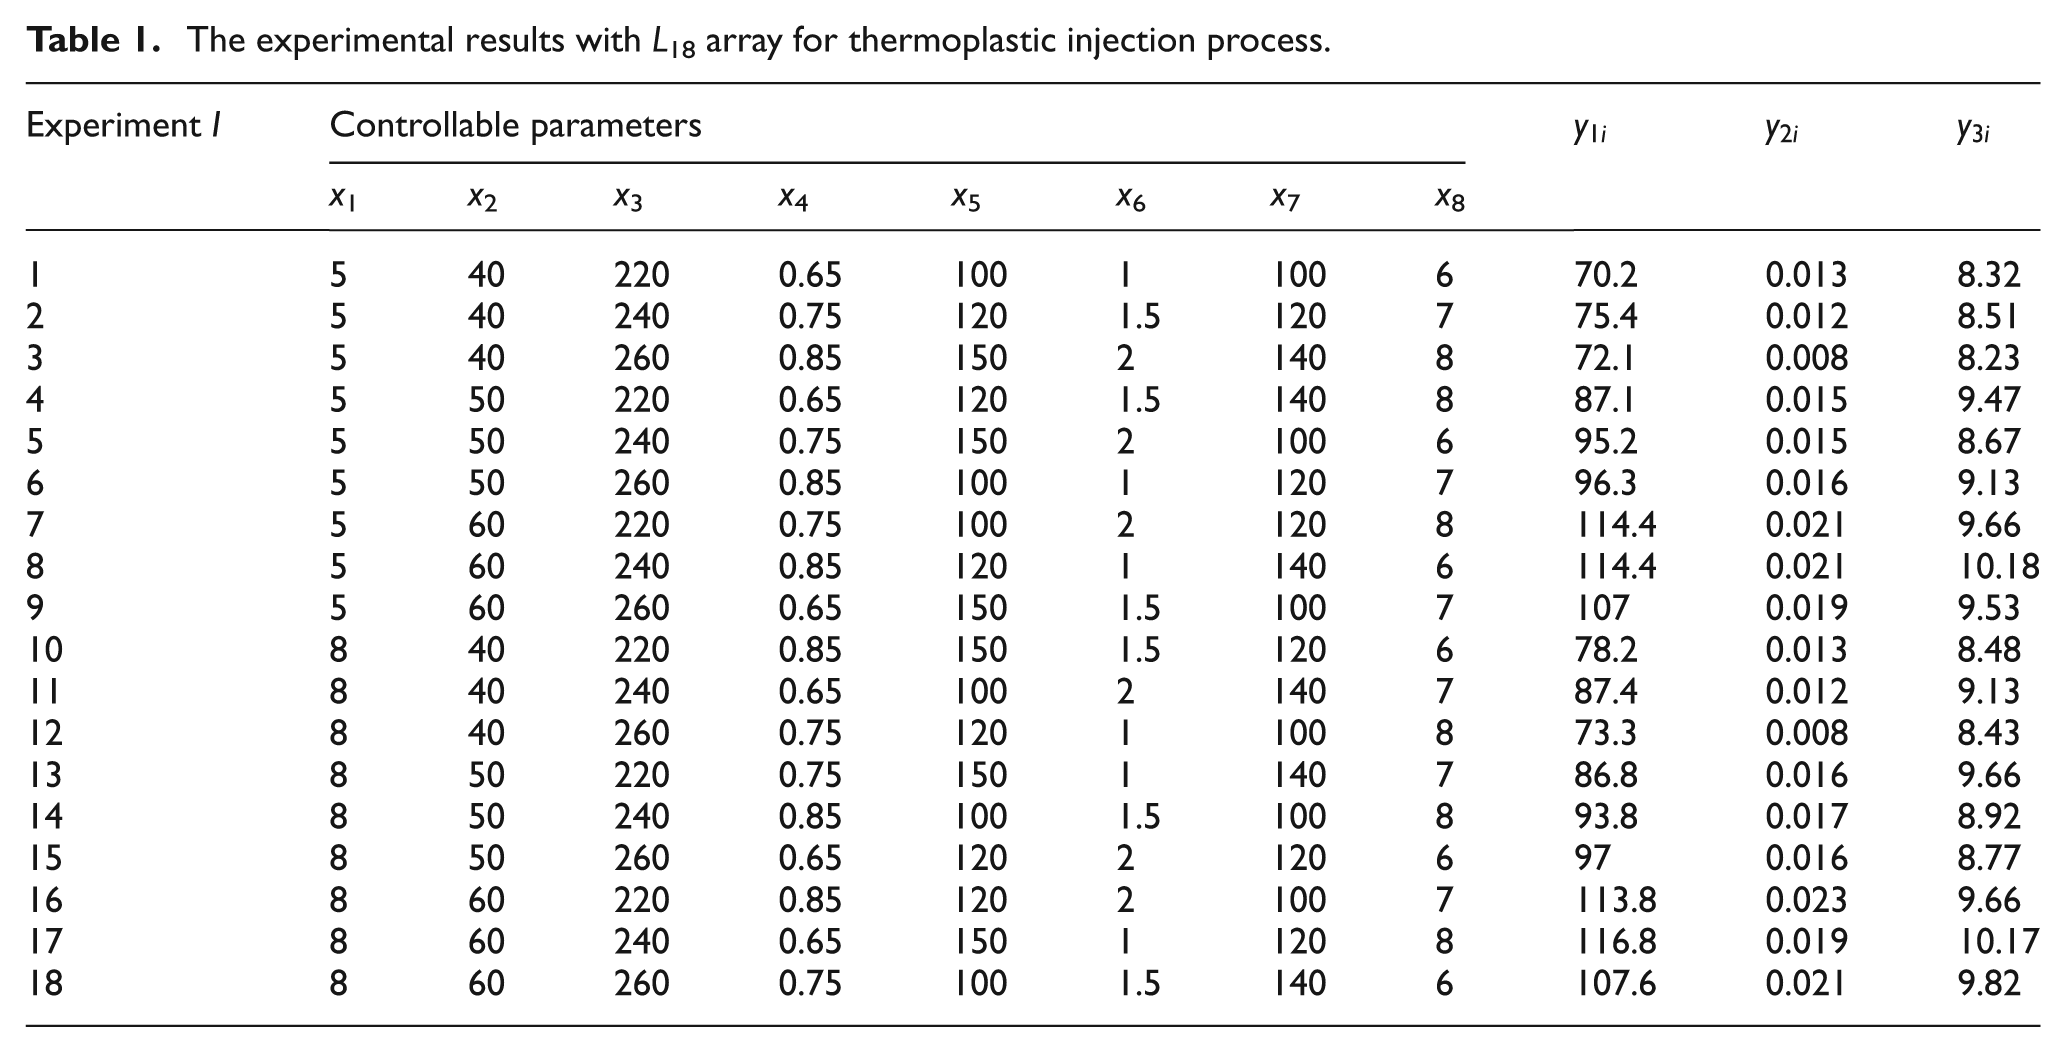
Chiang 4 aimed at optimizing the process conditions of an injection-molded thermoplastic part, polycarbonate/acrylonitrile butadiene styrene (PC/ABS) cell phone shell, by utilizing the gray relational analysis and fuzzy logic. Eight principle machining parameters are investigated simultaneously utilizing L18 (21× 37) orthogonal array, including the opening mold time (x1, s), mold temperature (x2, °C), melt temperature (x3, °C), filling time (x4, s), filling pressure (x5, MPa), packing time (x6, s), packing pressure (x7, MPa), and cooling time (x8, s). Three responses are of main interest, including the strength of welding line (y1, kg/cm2, LTB), shrinkage (y2, STB), and difference of forming distributive temperature (y3, °C, STB). Each experiment was repeated three times. The level values of the process controllable parameters and the average responses are displayed in Table 1.
The experimental results with L18 array for thermoplastic injection process.
The proposed procedure was then implemented to solve the three responses for the injection molding process and is described as follows:
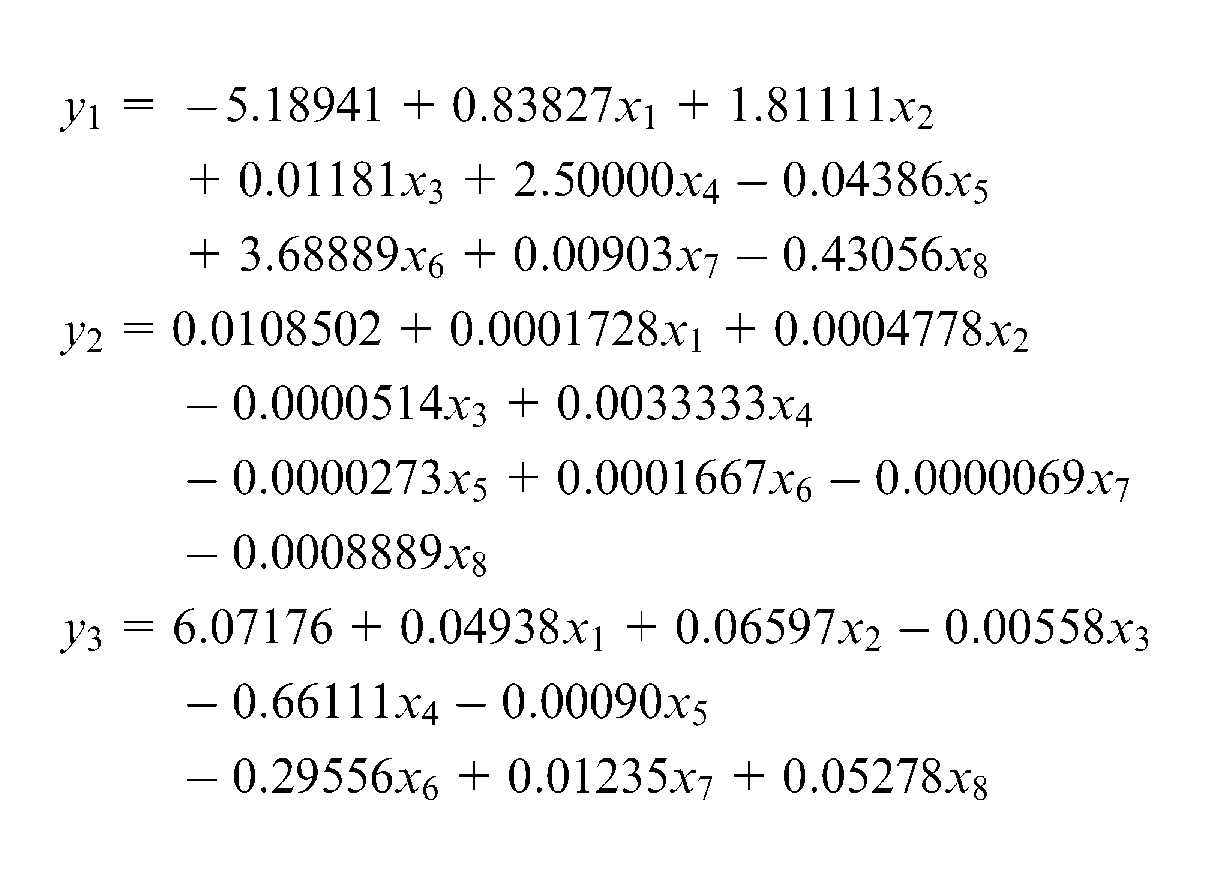
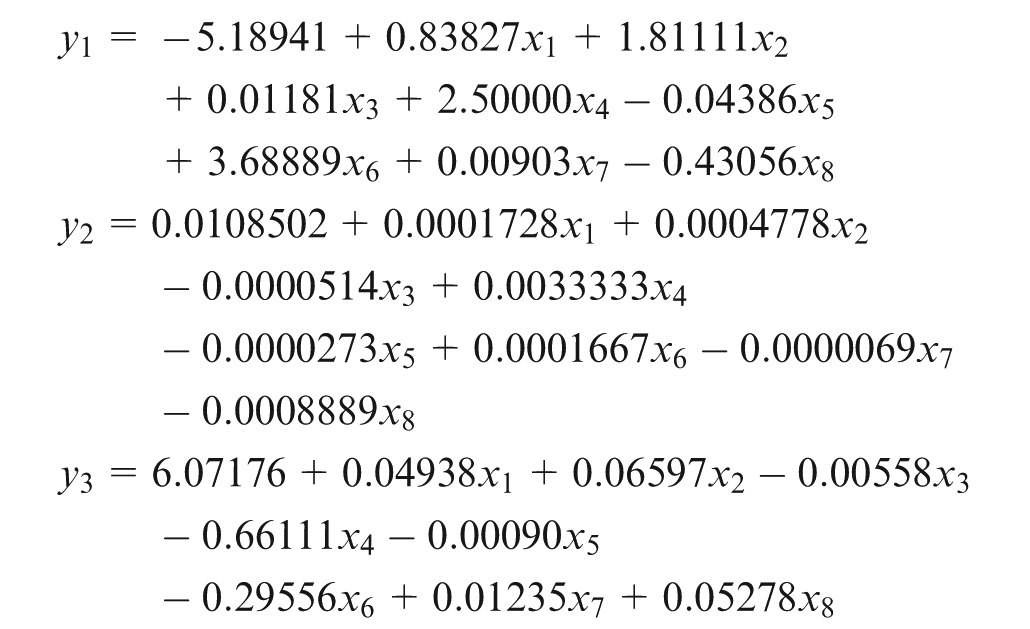
Step 1. The multiple linear regression equations for y1, y2, and y3 are estimated as
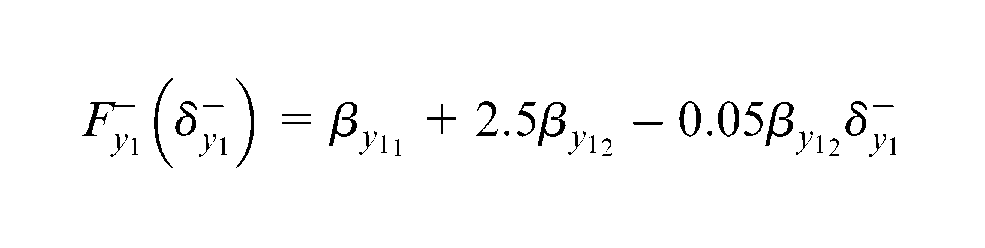
Step 2. For y1 (LTB type), the value of gy1 equals to 130 kg/cm2, and the values of
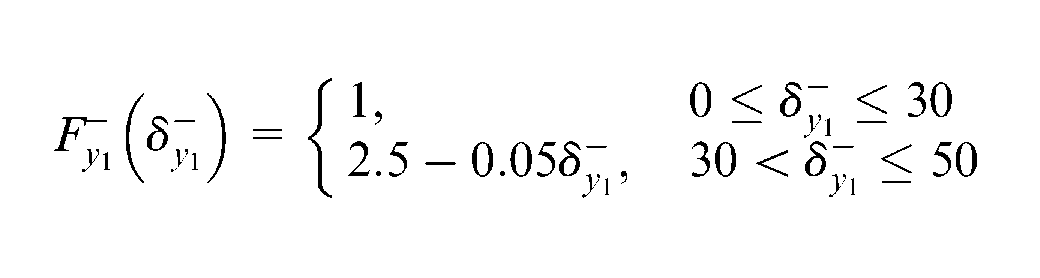
or
Similarly, for y2 (STB type), the value of gy2 equals 0, the target of the shrinkage response. The
or
Finally, for y3 (STB type) response, the value of gy3 equals 0, the target of the temperature difference which is a measure of warpage. Assume the values of
or
Step 3. The satisfaction functions for negative and positive deviations are used to describe the eight process factors. For example, the satisfaction function of x1 is obtained as follows. The value of gx1 equals to 6.5, which is the midpoint of x1 range. The values of


Step 4. Assume that the relative importance of the satisfaction functions of responses and factors is assigned equal weights. Then, the complete model is formulated as
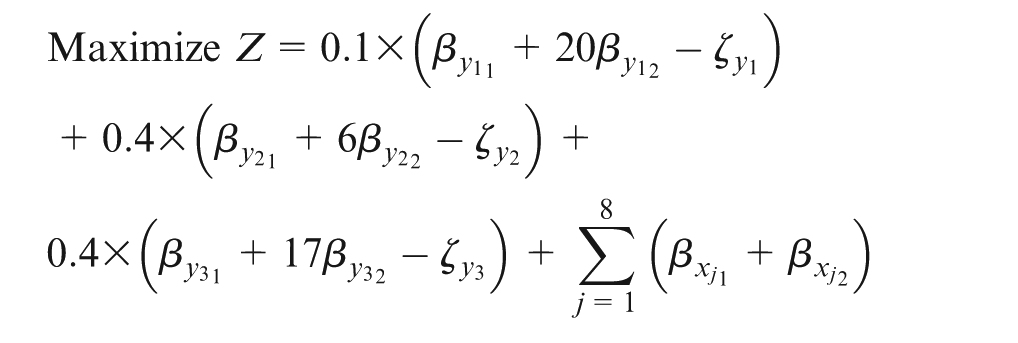
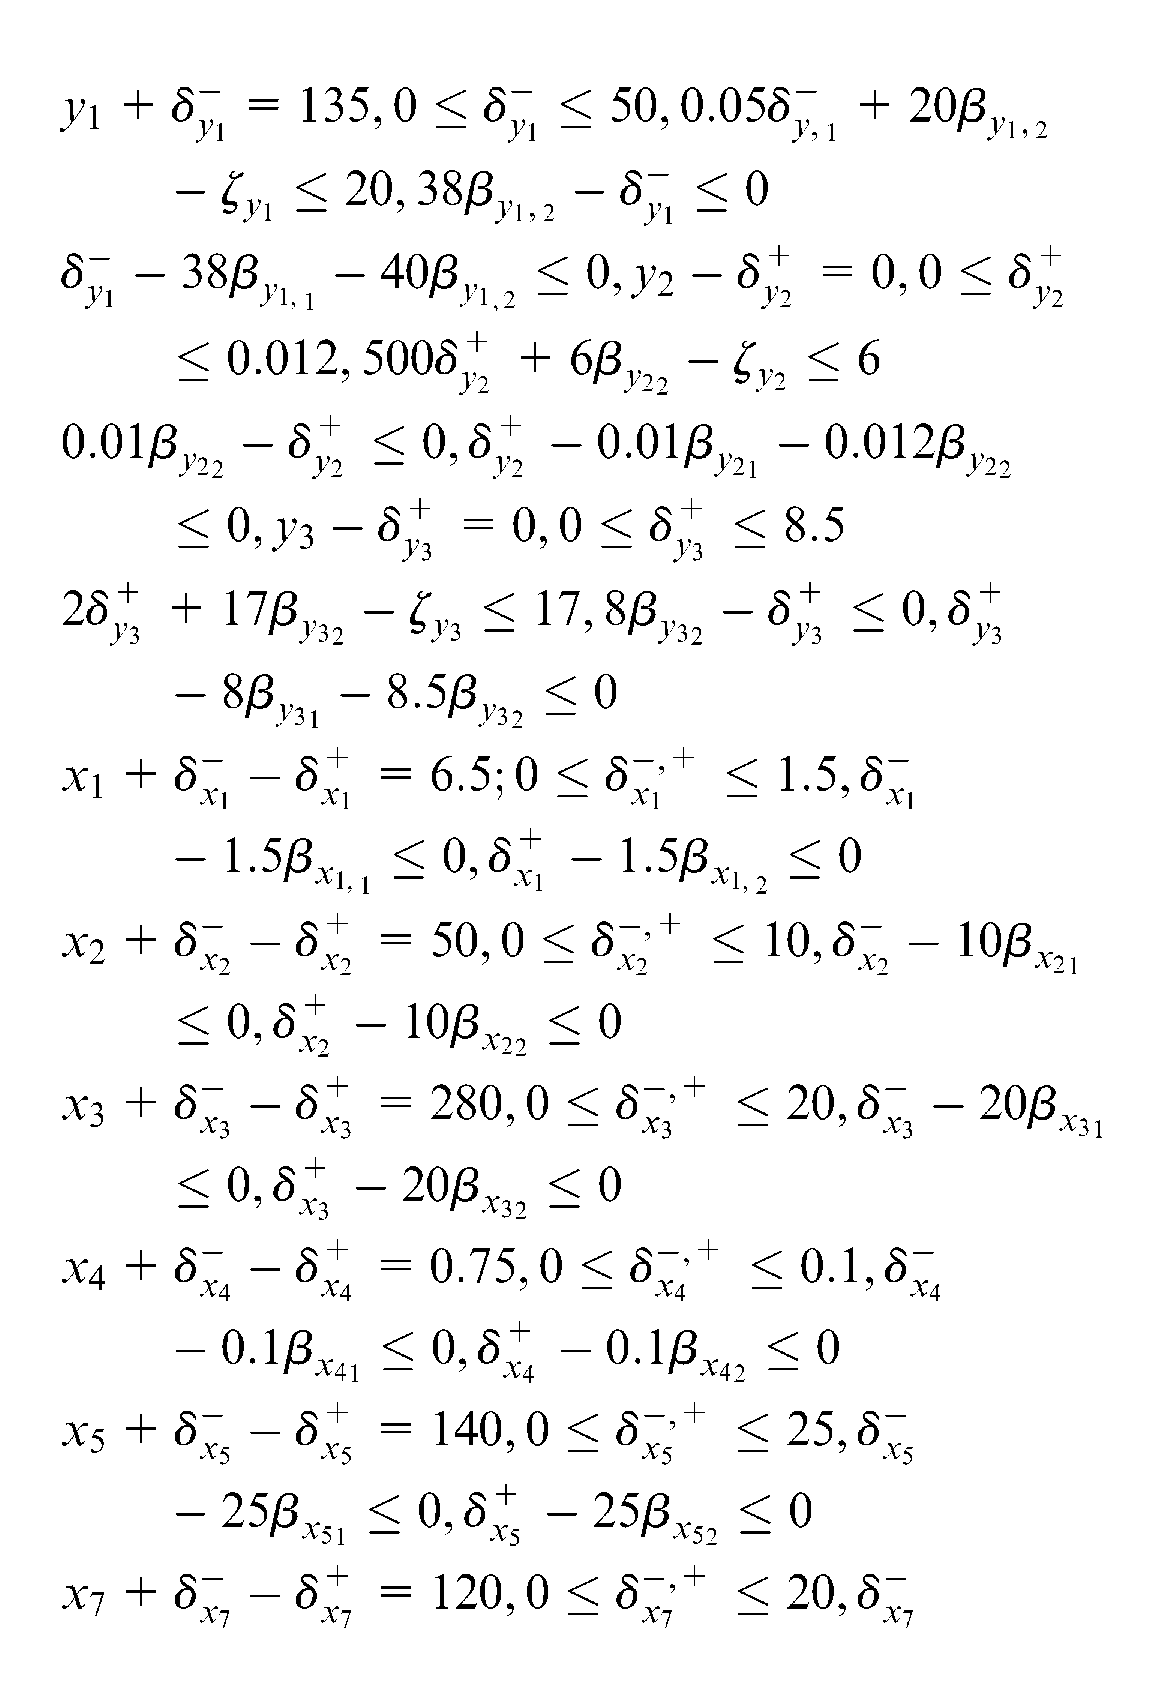
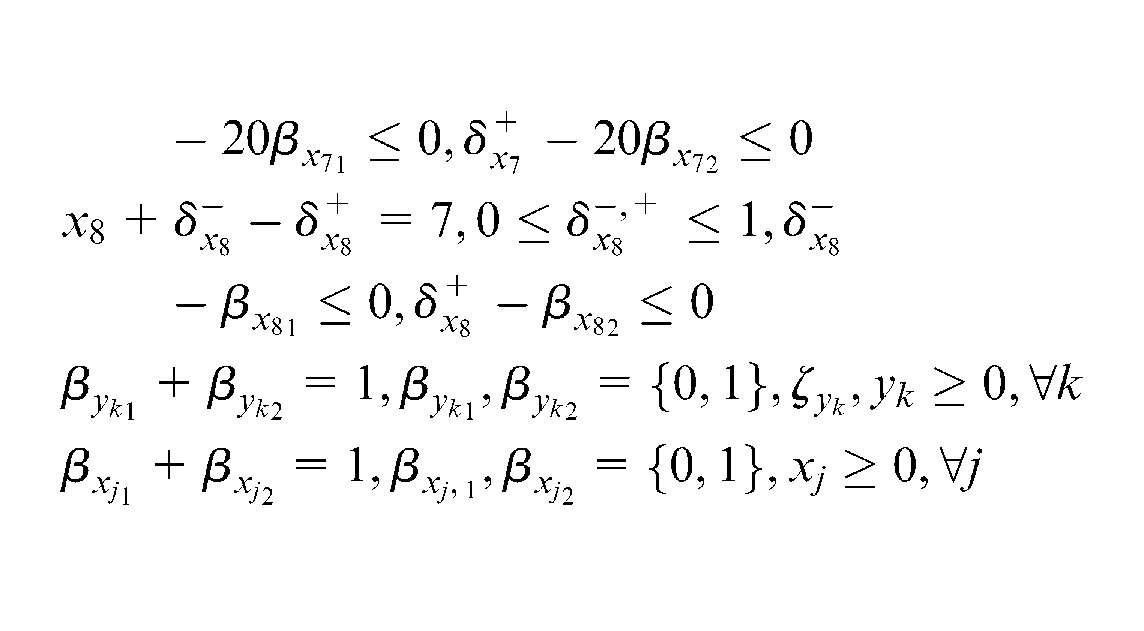
Subject to:
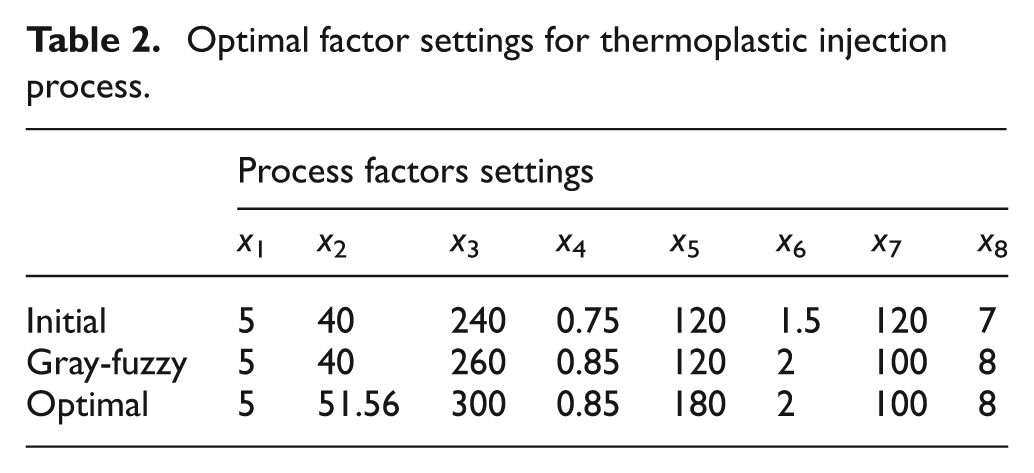
By solving the model, the resulted optimal factor settings are then estimated as shown in Table 2. It is found that the optimal settings are x1 = 5, x2 = 51.56, x3 = 300, x4 = 0.85, x5 = 180, x6 = 2, x7 = 100, and x8 = 8.
Optimal factor settings for thermoplastic injection process.
Optimizing film coating process for polymer blends
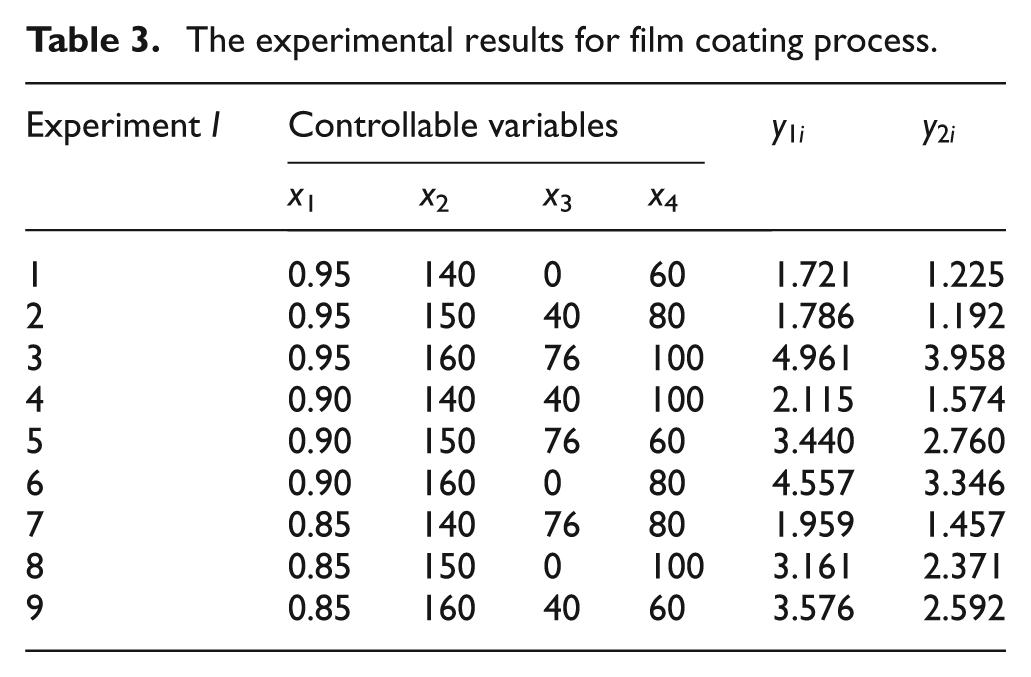
Kuo and Wu 3 investigated the influence of major processing parameters on the morphological properties of the material surface of a film coating process for polymer blends using the gray analysis. Two STB-type responses are studied: the root mean square roughness, (y1, nm), and the roughness average (y2, nm). Four 3-level controllable process factors are investigated, including the silicone concentration ratio (x1, wt%), cure temperature (x2, °C), vacuum degree (x3, cm Hg), and cure time (x4, min), utilizing the L9 (34) orthogonal array shown in Table 3.
The experimental results for film coating process.
The multiple linear regression equations for y1 and y2 are estimated as
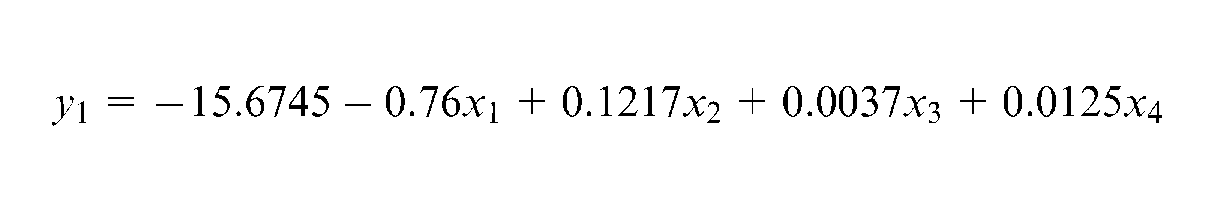
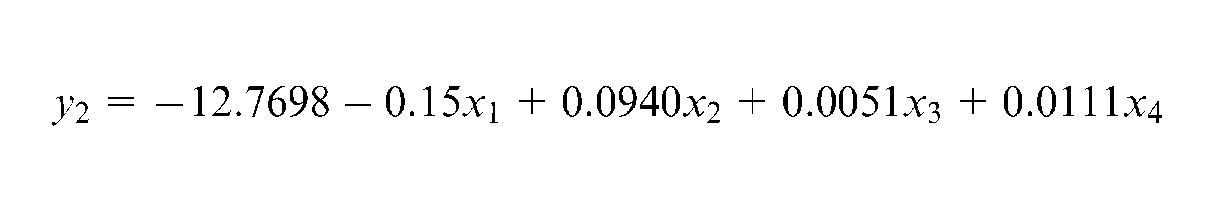
Since y1 and y2 are STB-type responses, the values of gy1 and gy2 equal 0. For y1, the values of
Optimizing plastic pipes extrusion process
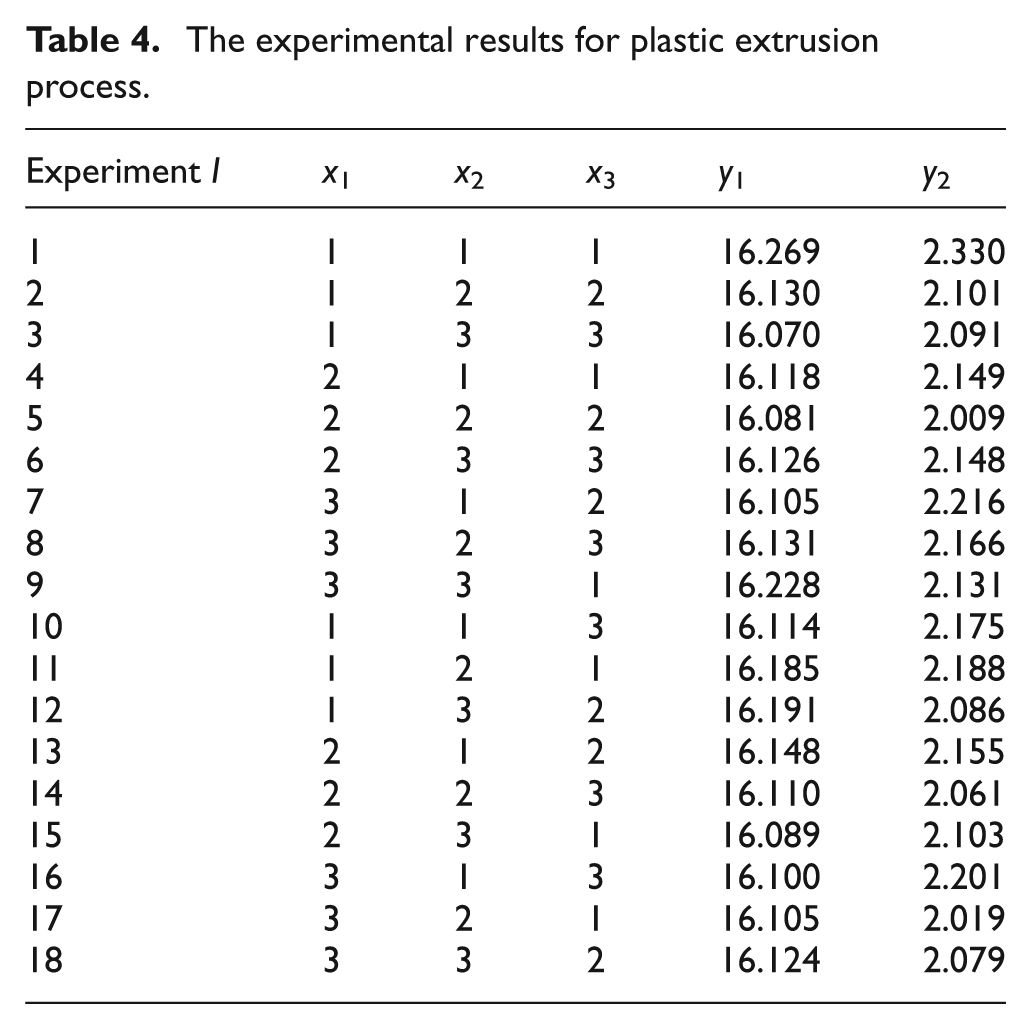
This cases study is conducted to validate the efficiency of the proposed approach in optimizing plastic extrusion process with two main pipes’ responses: diameter (y1, NTB, mm) and thickness (y2, NTB, mm). Based on the process knowledge, three process factors are selected, including temperature (x1, °C), motor speed (x2, r/min), and vacuum (x3, bar). The
The experimental results for plastic extrusion process.
The multiple regression equations for y1 and y2 are estimated, respectively, as
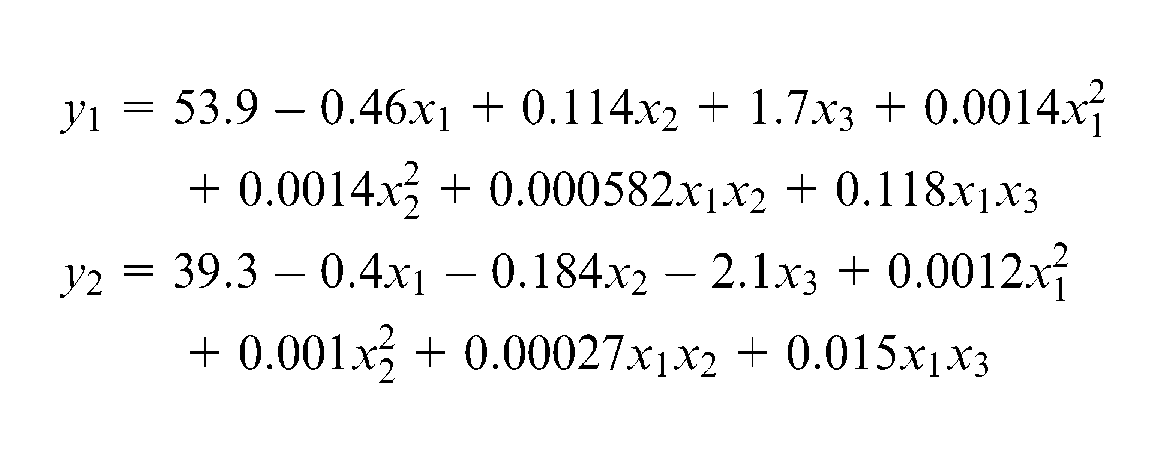
The value of gy1 equals to 16 mm, and the values of
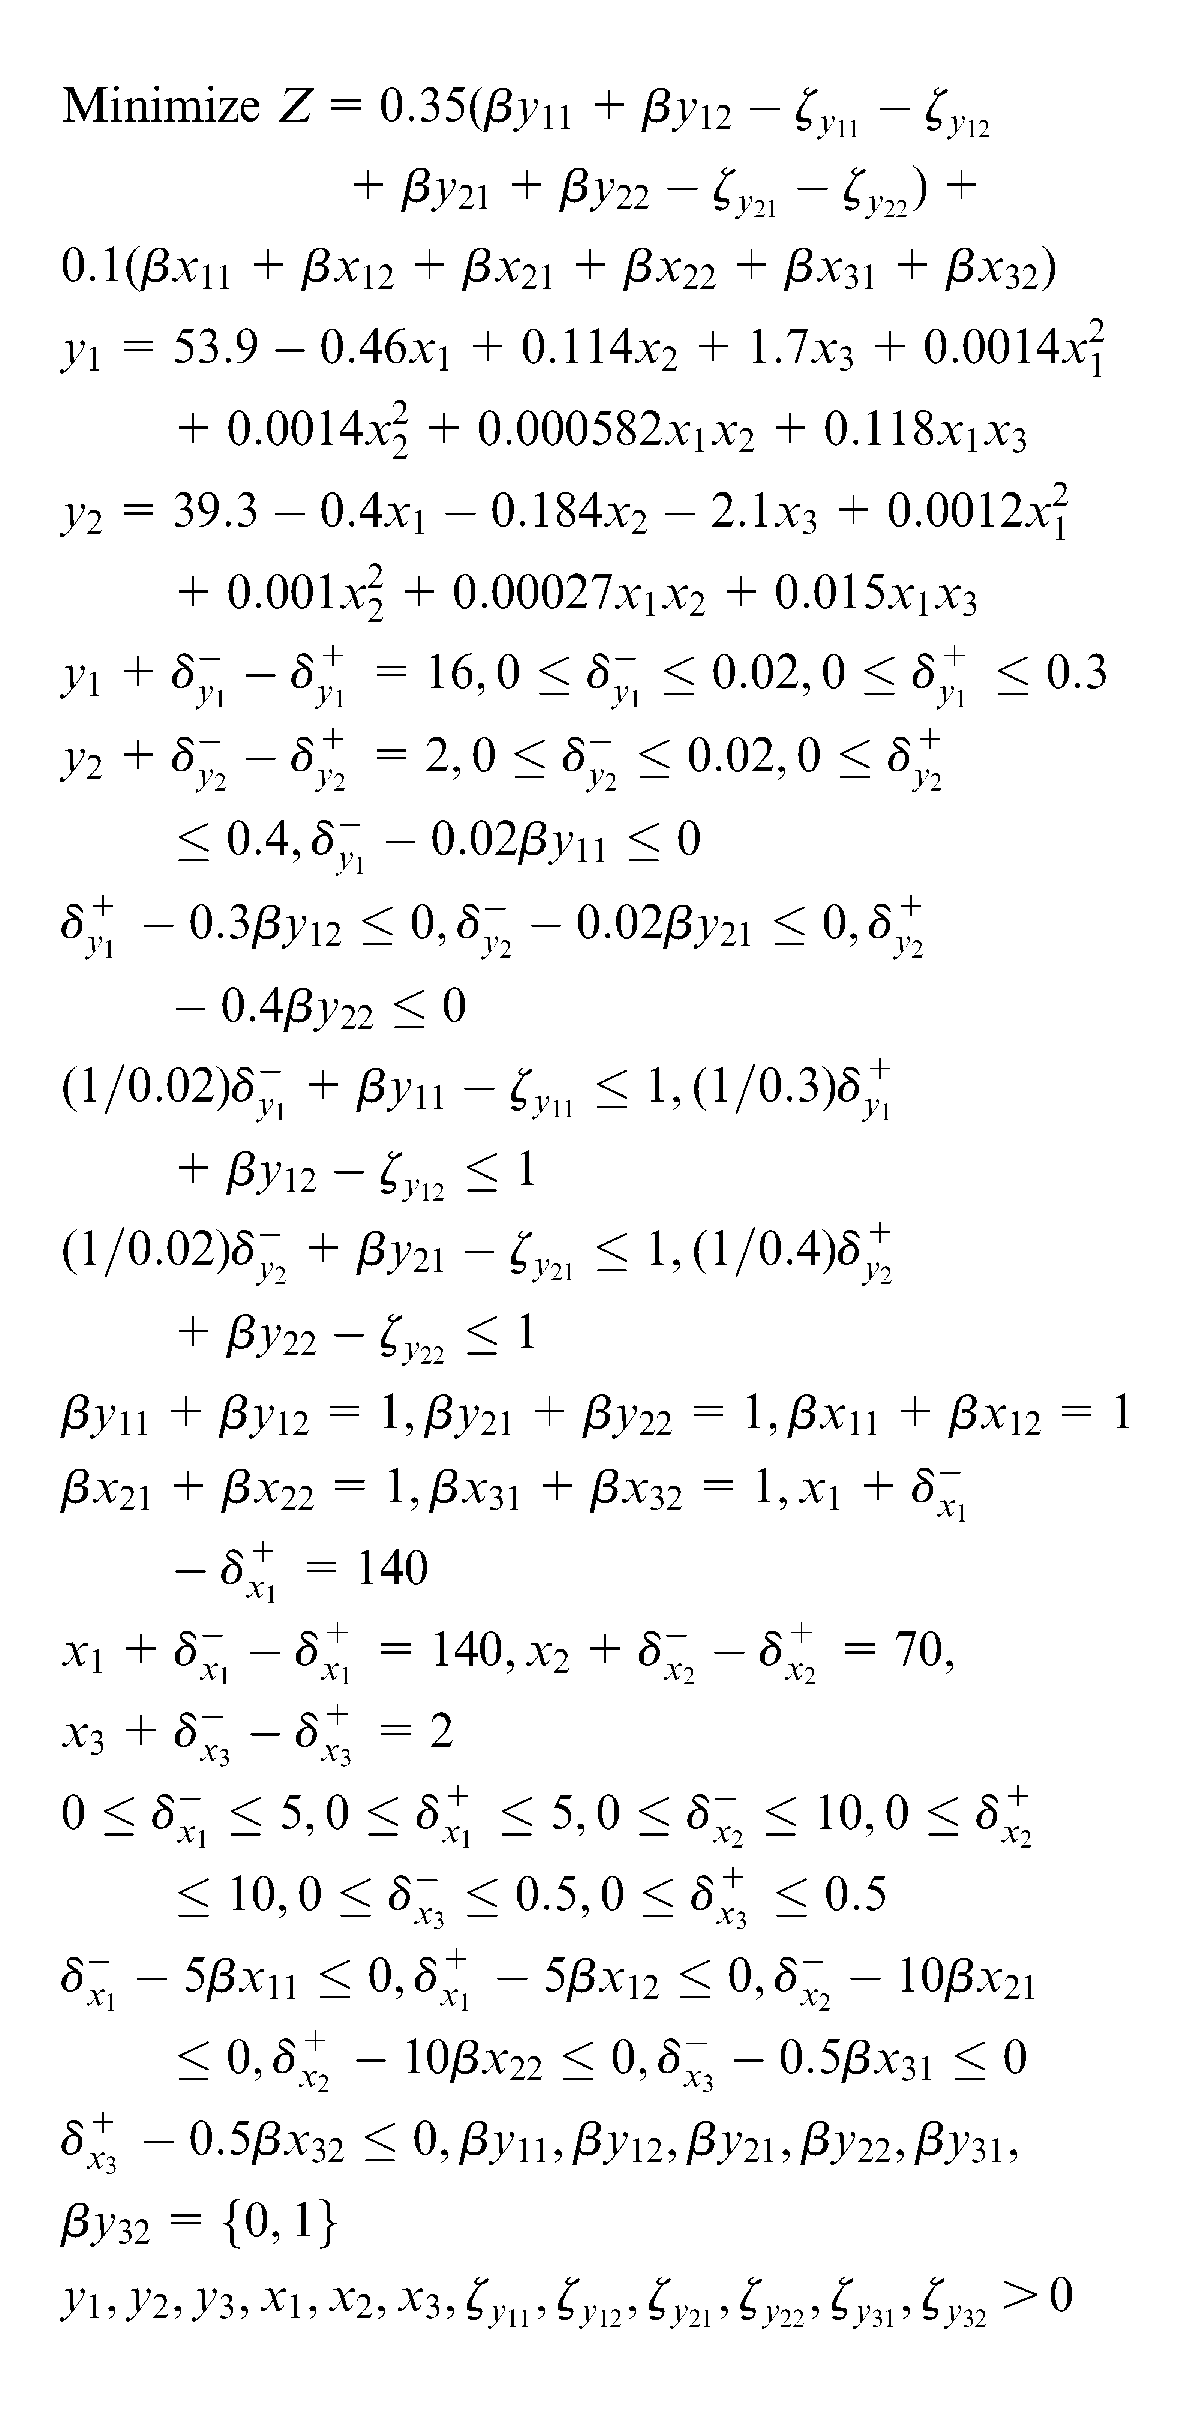
The optimal process settings are found as follows: the temperature (x1 = 140.0 °C), motor speed (x2 = 63.7 r/min), and vacuum (x3 = 2.5 bar).
Optimization results
The improvement analysis for the three case studies is presented in the following.
Results for thermoplastic injection process (case study I)
A comparison of the optimal results with the initial values and the gray-fuzzy analysis results 4 are shown in Table 5. In Table 5, it is obvious that y1 (LTB) is significantly improved from 75.4 (at initial settings) to 95 (optimal settings), while y2 and y3, which are both STB responses, are improved slightly from 0.012 and 8.51 to 0.011 and 8.39, respectively. Comparing the anticipated improvements between gray-fuzzy and proposed approach, it is obvious that the proposed approach (= 35.74%) provides much larger total anticipated improvement than gray-fuzzy analysis (= 24.88%).
Anticipated improvements for thermoplastic injection process
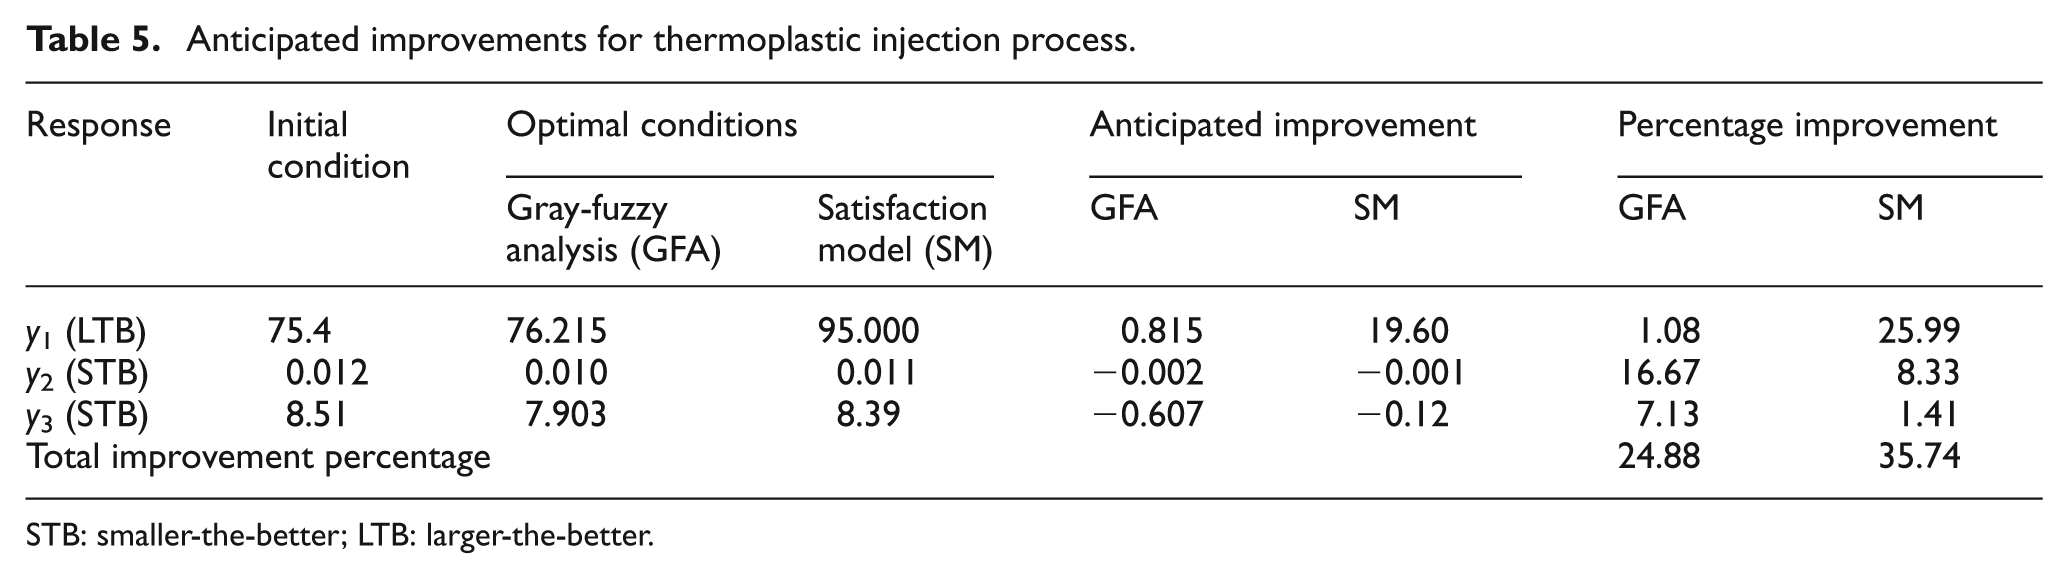
STB: smaller-the-better; LTB: larger-the-better.
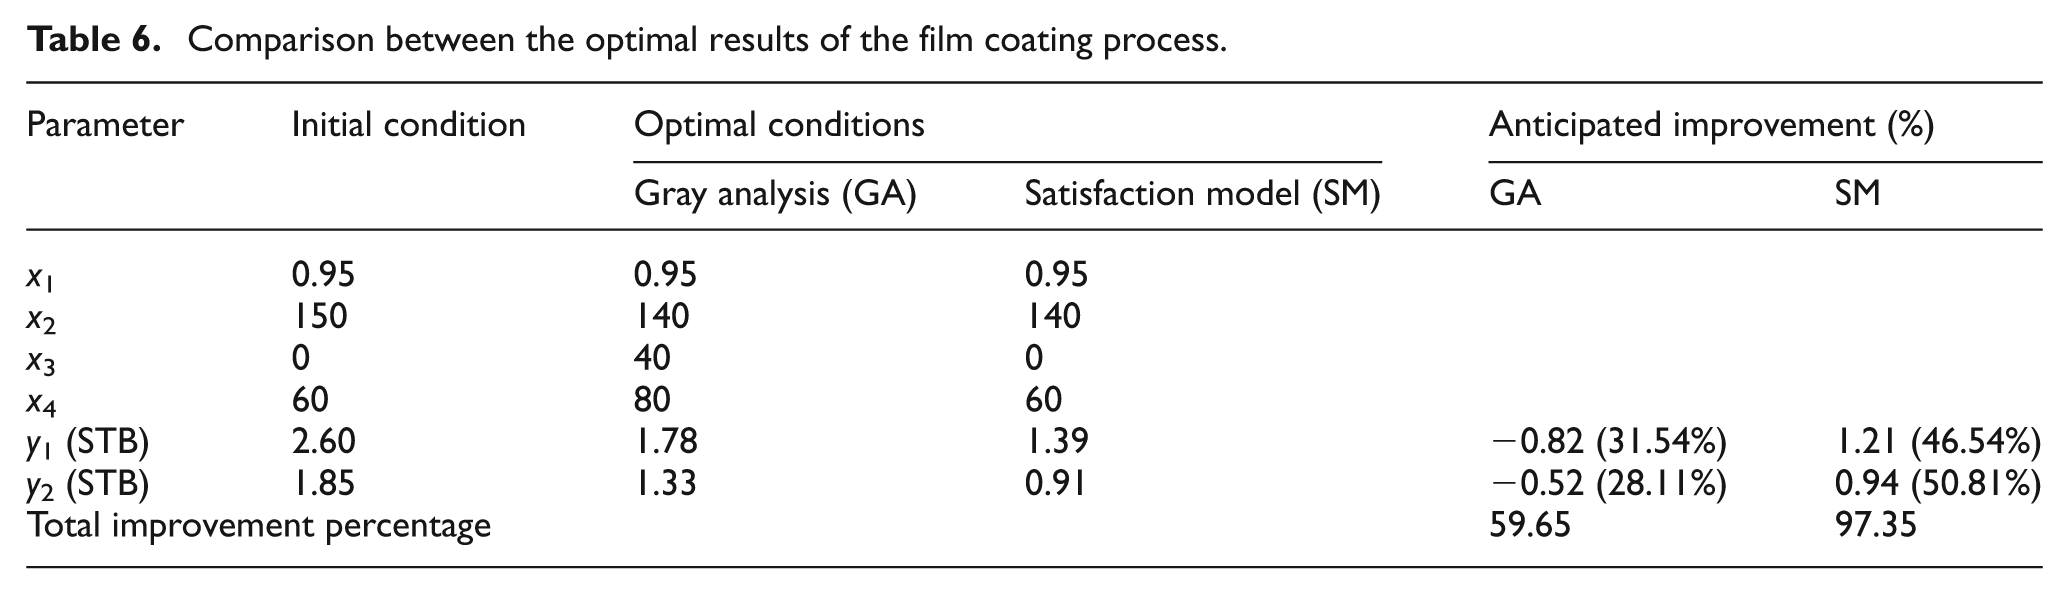
Results for film coating process (case study II)
Table 6 provides a comparison among the obtained optimal results, the initial values, and the gray analysis results. 3 In Table 6, it is obvious that y1 and y2 are improved significantly by setting process factors at optimal levels. That is, using the proposed approaches y1 and y2, which are both STB responses, are decreased from 2.6 and 1.85 to 1.39 and 0.91, respectively. Furthermore, comparing between gray analysis (=59.65%) and proposed approach (= 97.35%), it is clear that the proposed approach provides larger total percentage of anticipated improvements.
Comparison between the optimal results of the film coating process.
Results for plastic pipes extrusion process (case study III)
Table 7 displays a comparison between quality responses at initial and optimal factor settings for plastic pipes extrusion process. The obtained initial (optimal) response values are found as the diameter 16.2139 mm (16.0579 mm) and thickness 2.1758 mm (2.0 mm). The percentages of improvement in y1 (NTB) and y2 (NTB) are 0.96% and 8.08%, respectively. The total improvement percentage is 9.04%. The improvements in the three case studies indicate the efficiency of the proposed approach in improving process performance while considering engineer’s preferences about process factor settings.
Improvement analysis for plastic extrusion process.
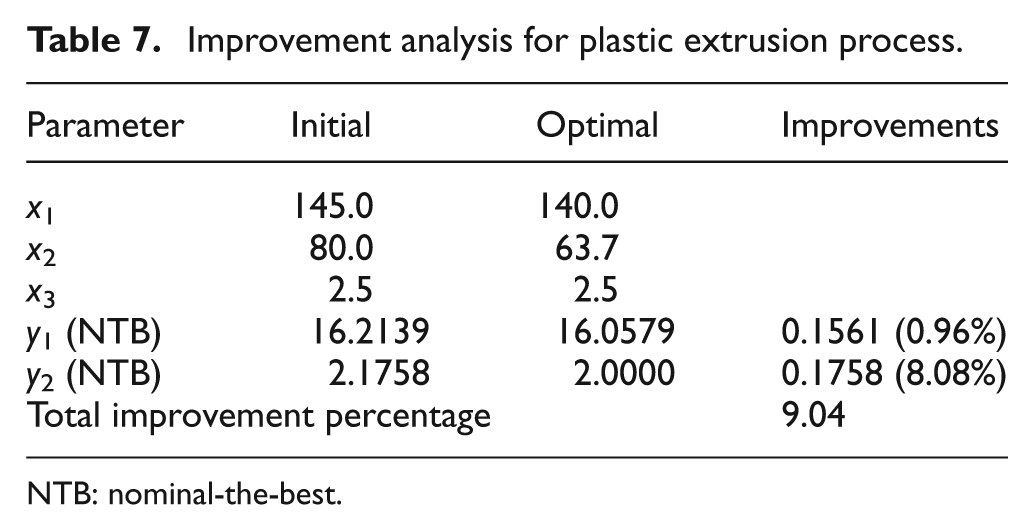
NTB: nominal-the-best.
Conclusion
This research illustrates a proposed approach for optimizing multiple responses in the application of the Taguchi method. The relationships between each response quality and process factors are first estimated. Then, a proper satisfaction function is selected to represent each response and process factor. A complete optimization model is developed. Three case studies are provided for illustration; in all of which the proposed approach provides the largest improvement percentages while considering process engineers’ satisfaction about process factors. The proposed approach shall provide practitioners a great assistance in optimizing performance with multiple responses while considering their preferences about responses as well as process factor settings.
Footnotes
Declaration of conflicting interests
The author declares that there is no conflict of interest.
Funding
This research received no specific grant from any funding agency in the public, commercial, or not-for-profit sectors.