
Abstract
In machining, there exist different quality characteristics that define overall process quality. These quality characteristics are controlled by different input process parameters. Thus, for best possible process quality, optimization is required. The resultant quality characteristics have different weightage of preference depending upon the requirements of the individuals or group. If in a group, the individuals have conflicting interests, it becomes difficult to take decisions. In this article, a new hybrid approach for multi-criteria optimization has been proposed based on the user’s opinion/preference while defining quality characteristics. Accordingly, the new technique may be termed as ‘User’s Preference Rating’ method for optimization. The major advantage of this method is that any number of opinions of the individuals can be considered for calculating the weights. Furthermore, in this technique, it is not essential to specify relationship between all quality characteristics. The implementation of the technique has been illustrated using data during ultrasonic machining of titanium.
Introduction
Quality and productivity are two important issues in the area of manufacturing. 1 To achieve balance between the both, proper input parameter selection is must. The levels of input process parameters are equally important, which result in best possible results. Manufacturing industries usually deal with a number of machining operations for every machined component. After the machining processes, a number of quality characteristics (QCs) are obtained. The QCs usually measured in machining are material removal rate (MRR), tool wear rate (TWR), surface roughness (SR), wear ratio (WR) and so on. To get the desirable result, that is, acceptable level of quality in machined component, these QCs are optimized by a number of optimization techniques. Invariably, acceptable level of quality is defined by multiple QCs. Thus, multi-criteria optimization is used to obtain the best setting of these input parameters. The subsequent section presents a brief account of existing multi-criteria optimization techniques.
The multi-criteria optimization methods have been classified into three types. 2 These methods are with the following
A priori articulation of preferences – where the user specifies the degree of relative importance between different objectives.
A posteriori articulation of preferences – where preference is given to a single solution obtained from a set of mathematical solutions.
Progressive articulation of preferences – where the user may not be able to clearly specify the preferences.
A good number of multi-criteria optimization techniques come under these categories, each having their own advantages and limitations as discussed by many authors.2–4 Some of the techniques can be quite simple but do not provide much information. Others are quite complex, require extensive computation but are informative. In order to optimize these QCs of machining, preferences are specified generally by facilitating the use of a priori articulation of preference methods. The most commonly used multi-criteria optimization technique that comes under this category is the weighted summation technique. 2 Although weighted summation is easy to apply, it has certain limitations in comparison to other techniques. First, it could not be used in cases where the criteria transformation is non-linear. 5 Second, the decision regarding calculation of weights has been an important issue as the final outcome depends upon it. The evenly distributed weights may lead to uneven results. 5 A good number of techniques are available for calculation of weights. 2 But the application of these techniques becomes complex due to rigorous calculations involved. Thus, for the sake of simplification, constant numbers are generally selected as weights. However, such constant numbers or prior selection of weights may lead to biased results of optimization. The earliest technique developed for calculation of weights is known as analytic hierarchy process (AHP). 6 The disadvantage of this technique was the inability to handle the uncertainty decisions.7,8 Similar to the AHP process, the analytic network process (ANP) involved extensive pairwise comparisons, 9 making it time-consuming. 10 To extend the scale rating for comparison of attributes, the fuzzy versions of AHP and ANP were introduced.8,11 These fuzzy systems provided a wider scale for pairwise comparison; however, their use increased complexity.12,13
In multi-criteria problem, one needs to find the optimum combination of input parameters in order to obtain the best process performance. Literature reveals an extensive use of Taguchi’s methodology for design of experiments. Taguchi’s methodology directly cannot be used for multi-criteria optimization as the outputs do not have the same measuring units. Thus, utility concept (simplest form of weighted summation) was used to optimize multi-criteria optimization problem.14–17 The utility function is used to transform the estimated response of each QC into a common index.
In the utility concept, first, the outputs were normalized, and later, weights are allocated to obtain the final utility values, which are used to obtain optimized results. Literature reveals that during the application of utility concept, the criterion for selection of weights was based upon choice of user/researcher.14–17 This criterion, that is, constant number as weights, may be biased. Furthermore, a possibility exists that different users have different views regarding preference of QCs. The problem arises when weights are to be calculated by considering the viewpoints of all users because everyone has different choice. Further in the group, users may be unable to differentiate or specify the order of preference between some QCs, which leads to incomplete information.
Considering the limitations of all the existing techniques discussed above, a new method has been used for calculation of the weights. This has been further incorporated for multi-criteria optimization of process parameters of ultrasonic machining (USM) using utility concept. The method used is an addendum to an existing decision-making technique known as ‘Customer preference rating’. 10 However, for sake of application in manufacturing environment, this technique for calculating weights has been integrated with utility concept for multi-criteria optimization of process parameters. This technique may be called a ‘User’s preference rating’ method for optimization. The main advantage of this method is in using incomplete information that is converted into quantitative data for calculation of the weights. Also, this method is simple and requires less processing calculations. This technique has been validated by taking USM of Titanium as a case study. The details of the ultrasonic drilling process and the effect of various process parameters have been discussed in subsequent section.
USM is a non-thermal machining process, which has been used for machining non-conductive, hard and brittle materials. The material removal is caused due to interactions between the workpiece and abrasive particles, which are hit by a tool oscillating at a very high frequency. USM of titanium has been studied by a number of researchers, and some inferences made have been shown in Table 1.
Ultrasonic machining work done on titanium.
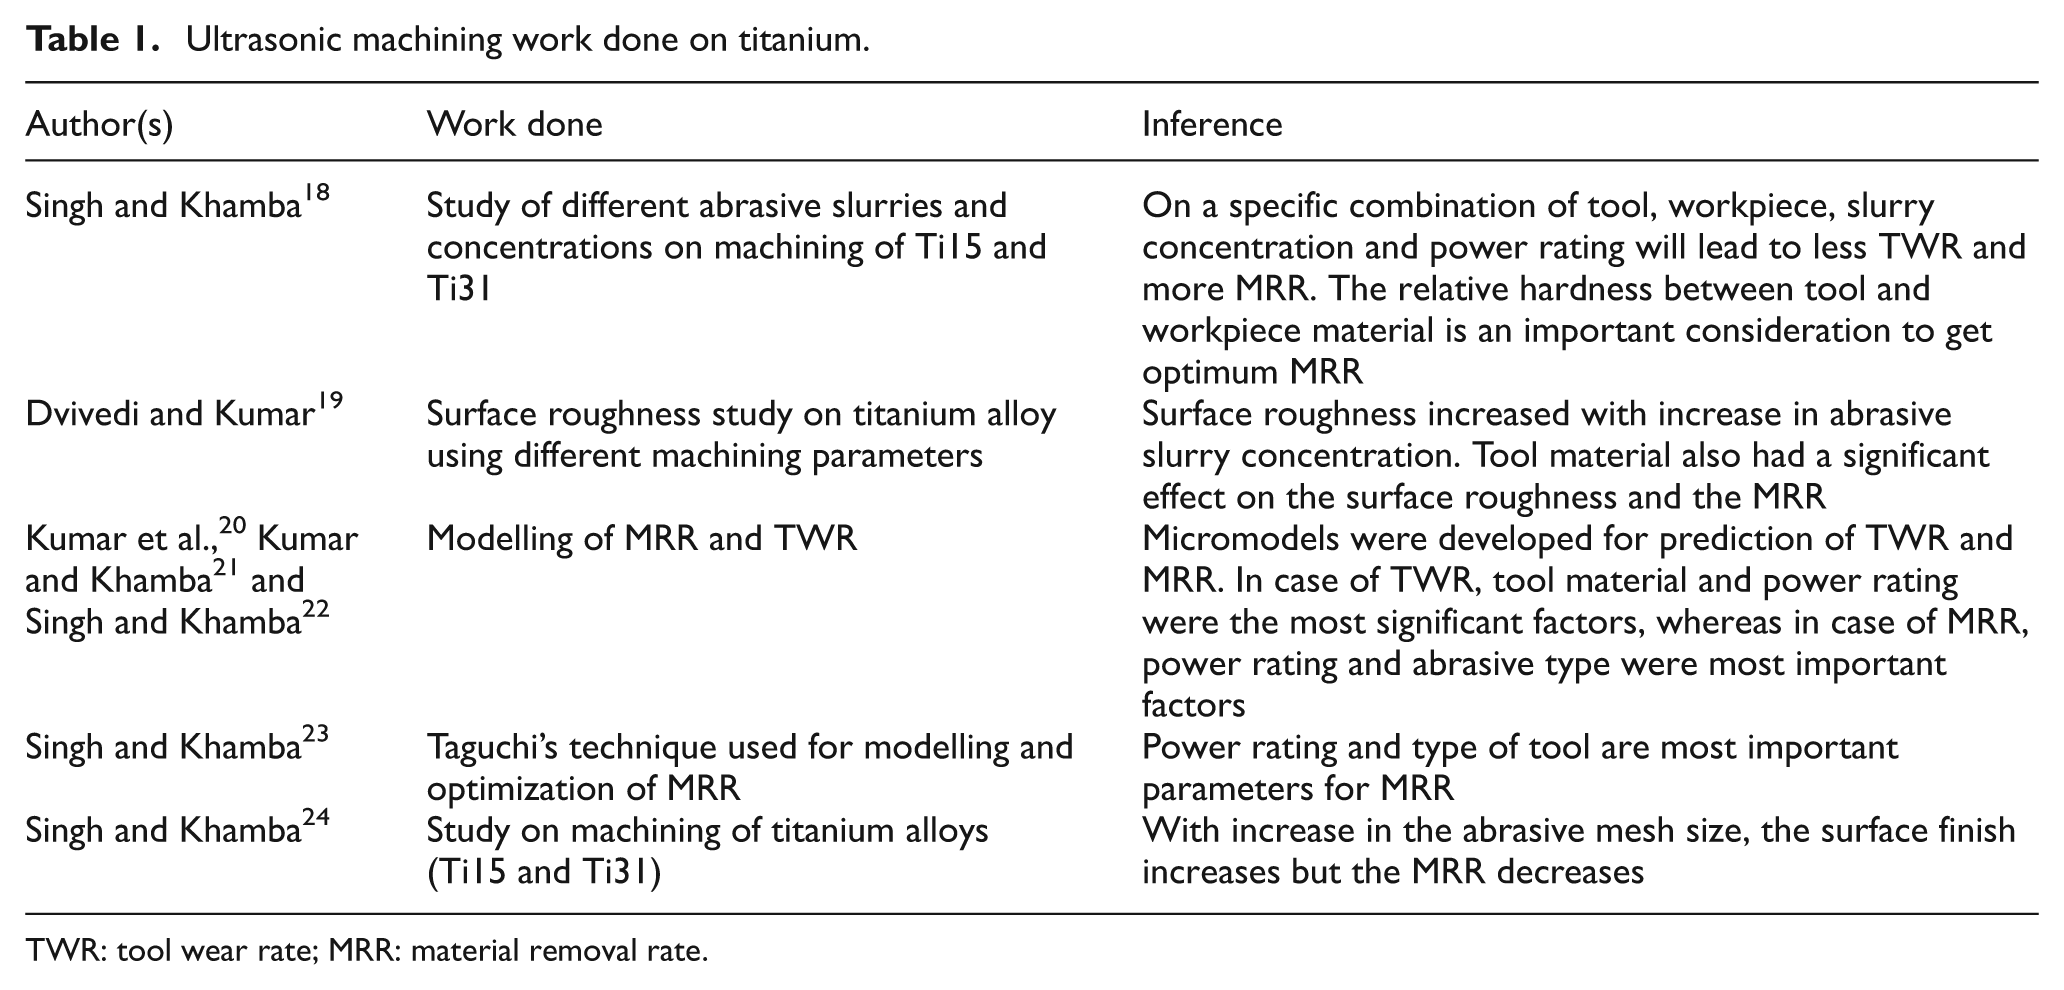
TWR: tool wear rate; MRR: material removal rate.
Different researchers have used different experimental designs to optimize the single QC. Very few have discussed the optimization of a number of QCs, and ambiguity can be seen between the results of different researchers inferred in Table 1; moreover, this ambiguity has led to unsatisfactory results for determination of the ultrasonic drilling mechanism for many years. The method for calculation of weights has not been discussed in case of multi-criteria optimization.
MRR, SR, TWR, WR and hole oversize (HO) were the various QCs measured in ultrasonic drilling of titanium. These outputs decide the overall quality of the process. In the present case study, three QCs were considered – WR, SR and HO. It is interesting to note that in this method of optimization, any number of QCs and preference viewpoints of different users can be taken into consideration according to the requirement. Before the selection of weights, the voice of the user is to be conquered into a mathematical form. For this purpose, the incomplete perceptions of human beings have also been represented by graph theory technique known as ‘preference graphs (PGs)’. 25 PGs explain the different viewpoints of users in the form of a schematic representation, which have been used in this article. One such graph theory–based technique, which considers the opinions of many people for establishing relationship between different variables, is the interpretive structural modelling (ISM) technique. 26 But in this technique, at the beginning itself, all opinions are merged into a structural self-interaction matrix (SSIM), tending to biasing of results. Furthermore, it does not give any weights associated with the variables. 26 Unlike to the user’s preference rating technique in which all opinions are dealt individually throughout the process (in the form of a PGs). This results in an outcome independent of particular individual (user’s) opinions. This article uses user’s preference rating method of optimization for determining the optimum combination of process parameters. The subsequent section discusses the utility concept along with the mechanism of derivation and computation of weights.
Utility concept
The performance assessment of any machining process is dependent on a number of QCs. Taguchi’s design alone, as indicated earlier, cannot be used for multi-criteria optimization because the measuring units are not the same. 17 Hence, in order to optimize these QCs in utility approach, a composite index is developed. The composite index represents utility (usefulness) of a product. The sum of utilities of various QCs is used to calculate the overall utility of the product. For example, in this work, the overall utility of a component machined by USM is the sum of each of the performance characteristics (e.g. WR, SR and HO). The explanation of the concept is given in the following.14,15
If Xi is the measure of effectiveness of an attribute i (QCs), then there are ‘n’ attributes in the outcome space. The joint utility function is represented by
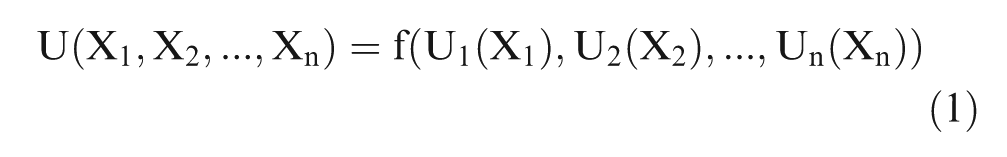
where Ui(Xi) is the utility of the ith attribute.
It is assumed that the attributes are independent. The overall utility function is given by the sum of the individual utilities and is given as
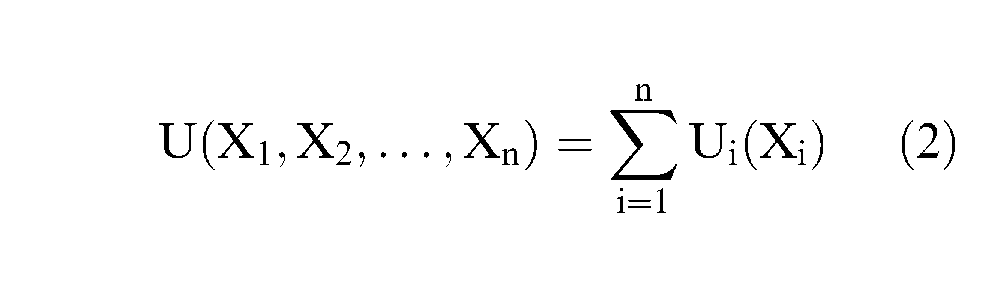
Depending upon the requirement, the attributes are given priorities. Later, weights are assigned to the individual utility to adjust the priorities. The overall utility function can now be explained as
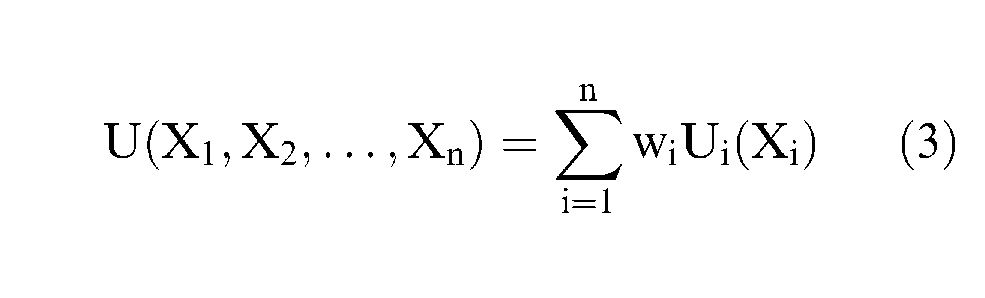
where wi is the weight assigned to the attribute. The weights are assigned such that

Calculation of weights
This work involves consideration for viewpoints of three different users with different opinions. The first opinion prefers SR as the most important requirement followed by WR and the HO. The second opinion prefers SR in comparison to HO and WR; however, there is no defined relationship between HO and WR. The third opinion, on the contrary, states that the SR and WR are more important than HO; however, nothing has been told about the relationship between WR and SR. All these individual requirements (IRs) have been used to construct the PGs shown in Figure 1(a)–(c). These PGs represent individual’s preference configurations of the QCs.
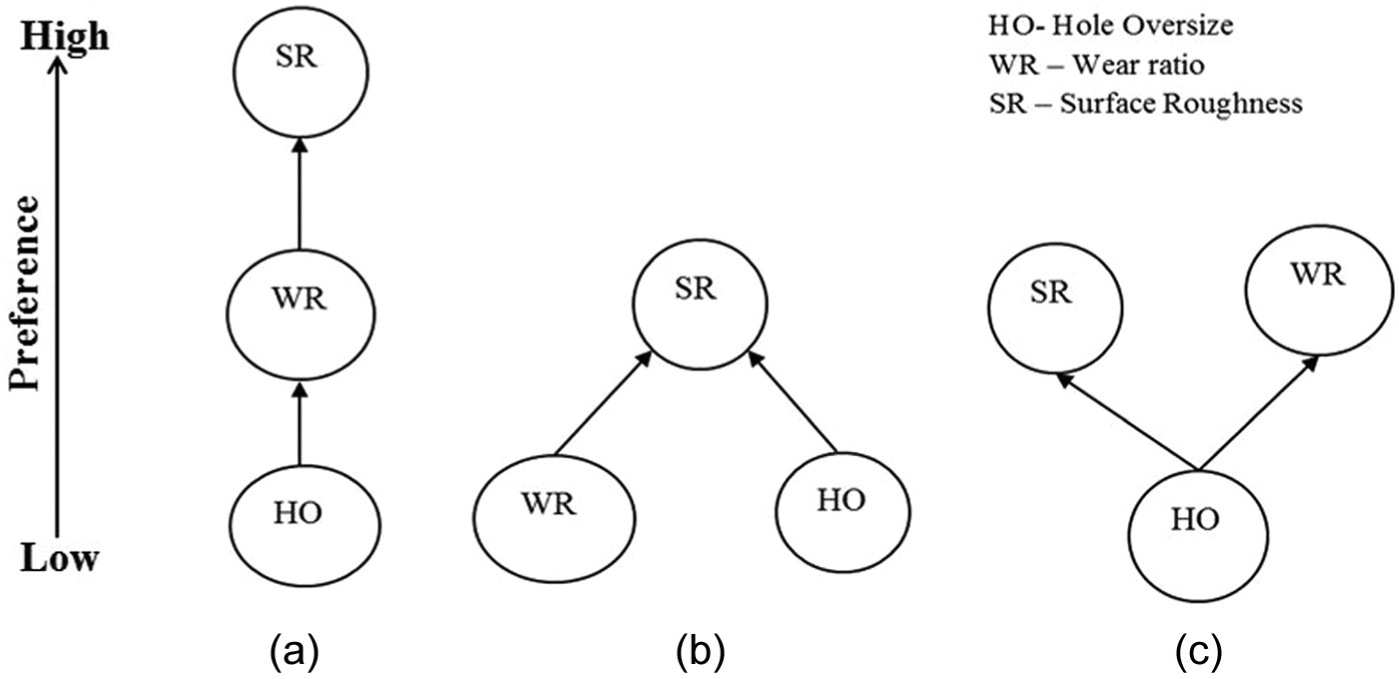
Preference graphs showing the relationships between the QCs according to different preferences of (a) first user, (b) second user and (c) third user.
These representations are to be converted into a mathematical form, which involves a number of steps. Following steps were followed for determination of weights. 10
Creation of the adjacency matrix
The adjacency matrix is used to represent the relationship of an individual’s PG in a matrix form. One number represents a relationship between the QCs. A general adjacency matrix can be represented as
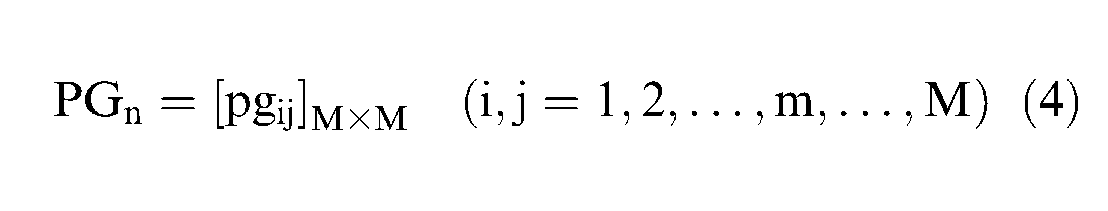
where n is the number of individuals, M is the number of characteristics and pgij gives the dominances of i over j in an M × M matrix.
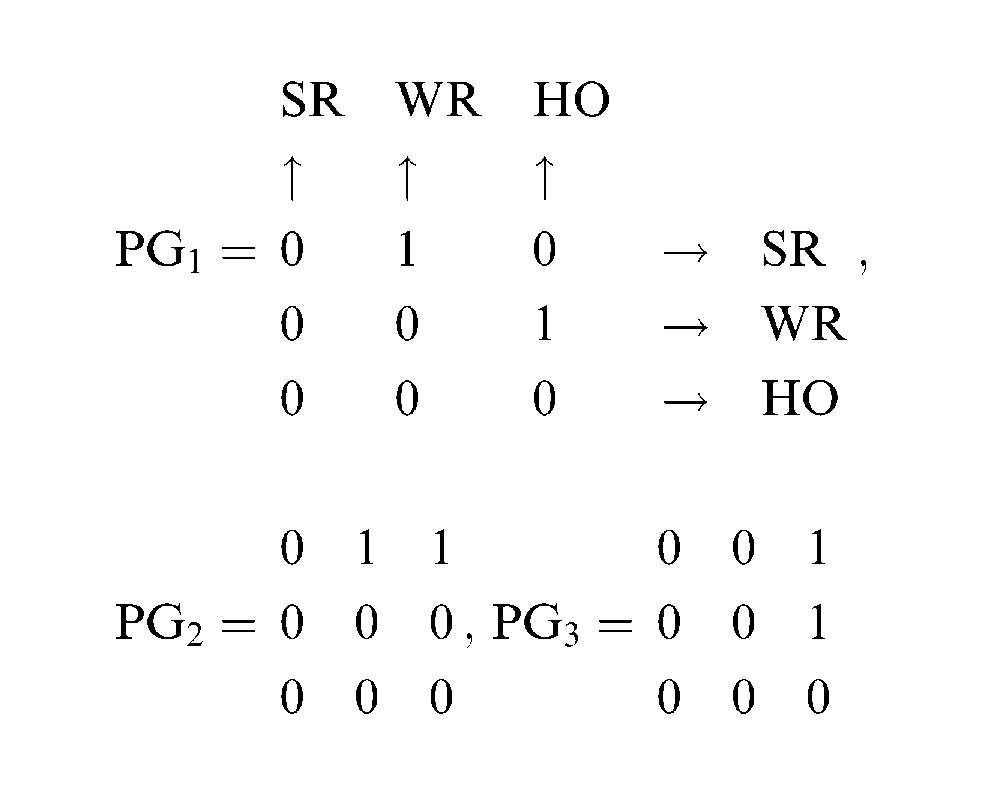
The adjacency matrix for different PGs (as shown in Figure 1) can now be constructed using equation (4) as
Calculation of dominance matrix
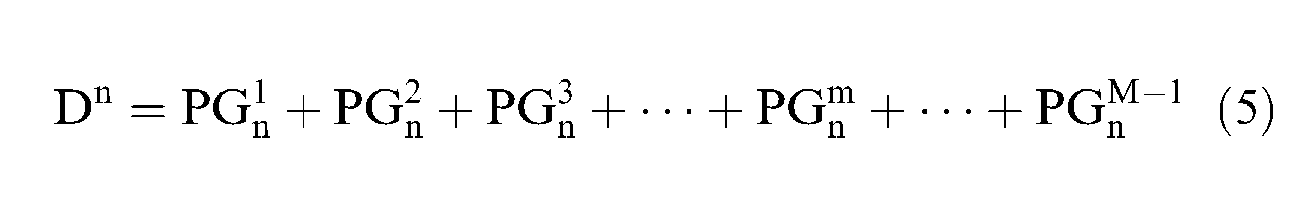
The adjacency matrices are then used to calculate the dominance matrix. Dominance matrix (Dn) for a particular PG tells about the number of ways a particular QC is more preferred over the other characteristic. This is represented by the following equation
Also
Using equation (5), in all cases, M = 3, so
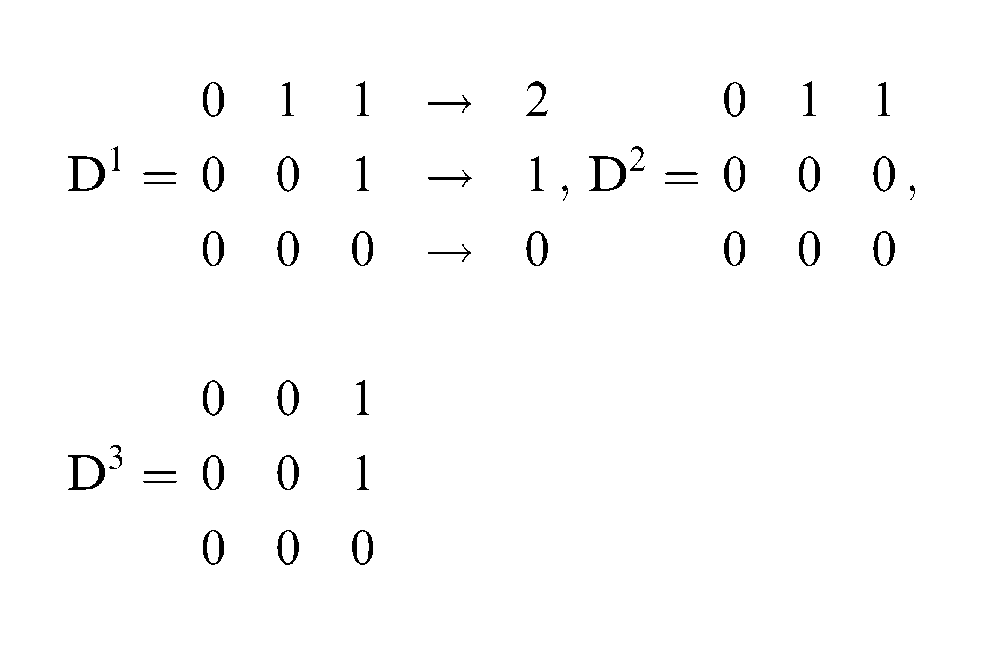
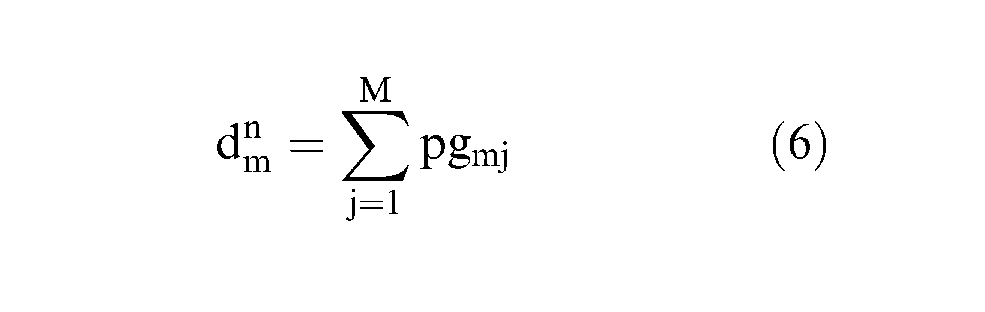
Using equation (6), from dominance matrix D
1
, the values are
Similarly, for D
2
matrix of PG
2
, values are
Calculation of relative degree of performance
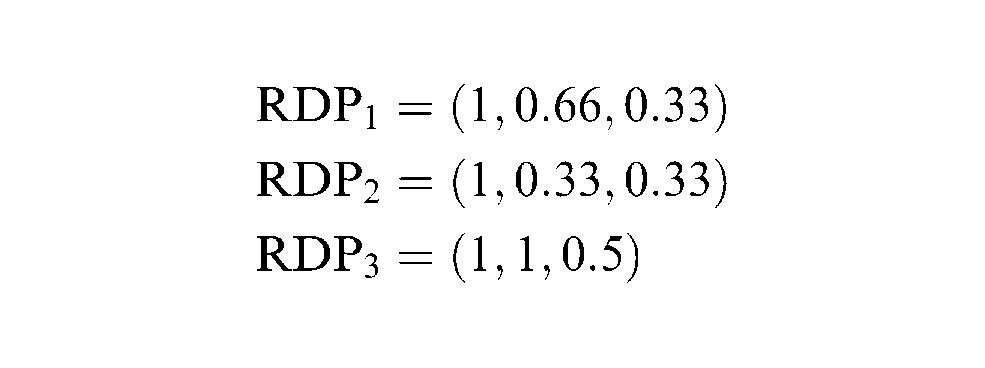
Relative degree of performance (RDP) tells about the relative comparison between different QCs of the same PG in a scale of 0–1. Preference as 0 cannot be possible; to account for its compensation, 1 was added to
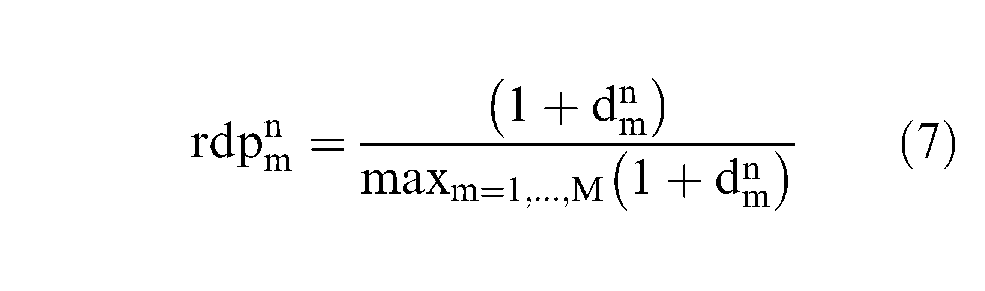
where n = 1, …, N. Thus,
RDP for each individual in the vector form can be given by
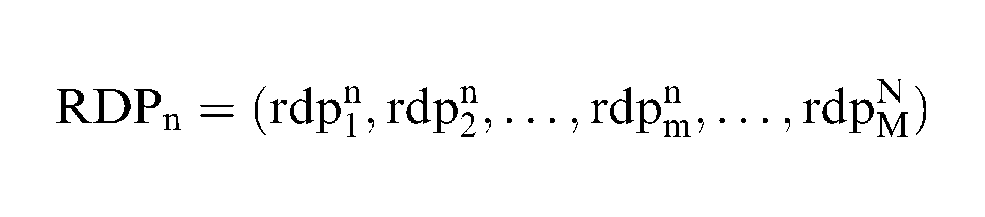
Accordingly, the RDPs calculated for dominance matrix D 1 , D 2 and D 3 are
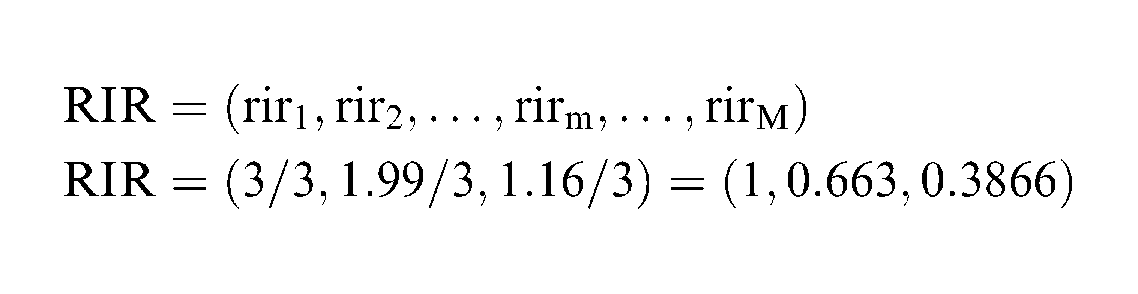
Calculation of relative importance rating
The RDP values obtained in step 3 were obtained for three different individuals. The combined views of three different individuals were taken into consideration for calculating the final rating, for which relative importance rating (RIR) was calculated. rirm represents the combined rating of a single QC considering the views of three individuals. It can be given by
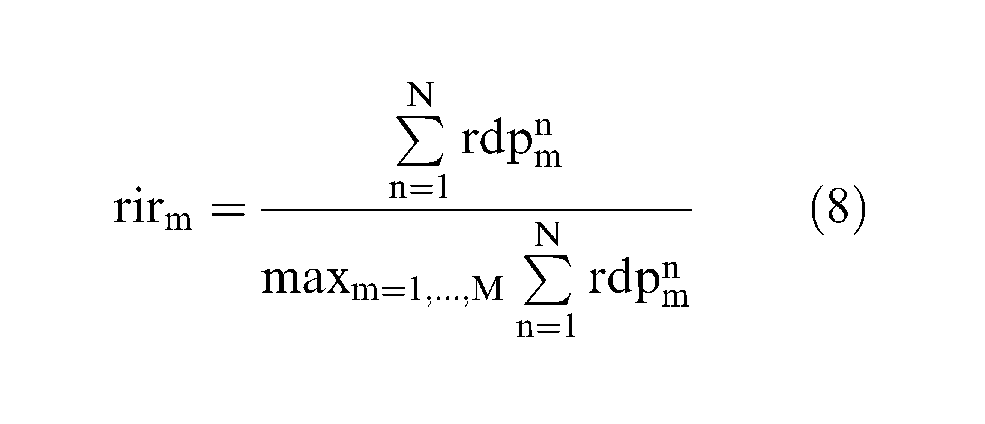
where
Calculation of weights
To satisfy the condition
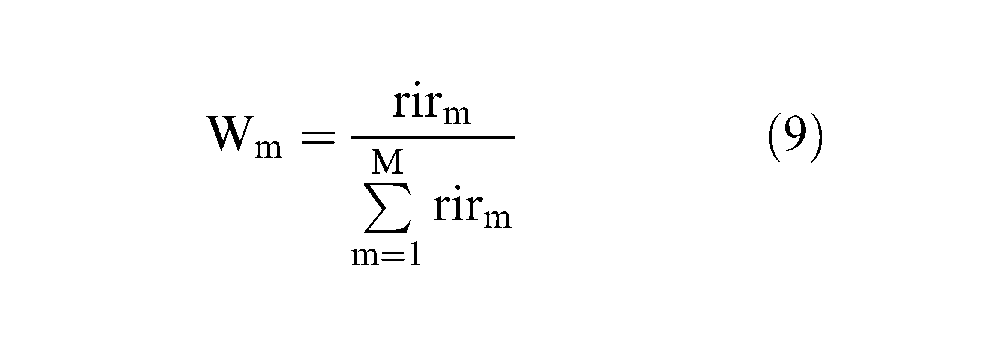
where Wm = (1/2.0496, 0.663/2.0496, 0.3866/2.0496) = (0.488, 0.323, 0.189). Final weights (Wm) from equation (9) are 0.488, 0.323 and 0.189. The method was validated by applying the same to the data obtained during an USM of titanium material as explained in the subsequent section.
USM details
The experiments were conducted on a Sonic-Mill® ultrasonic machine (AP 500). The various process parameters were identified, and their levels are shown in Table 2. Pilot experimentation was carried out on the basis of one factor at a time approach to determine the ranges; then, the levels for the design were set. An L18 orthogonal array was chosen for the design of experiments. 27
USM process parameters and there levels.
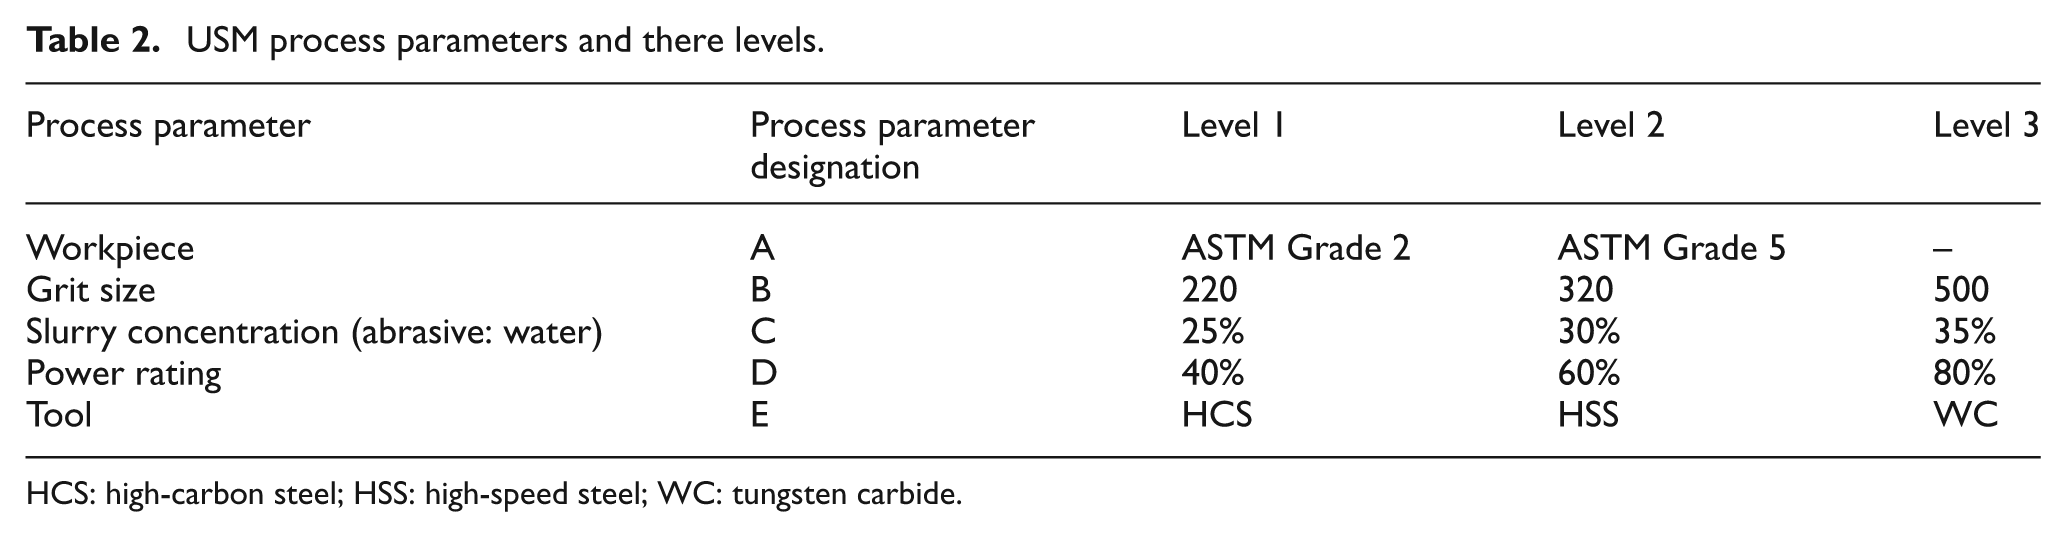
HCS: high-carbon steel; HSS: high-speed steel; WC: tungsten carbide.
Materials used
Commercially pure titanium (American Society for Testing and Materials (ASTM) Grade 2) and titanium alloy (ASTM Grade 5) were used as workpiece materials. The controllable process parameters and their chosen levels are given in Table 2. 27
Performance characteristic of USM
In order to evaluate the performance of the machining process, the QCs selected were (1) SR, (2) WR and (3) HO. WR in this case has been defined as the ratio of MRR to TWR. This WR is also responsible for good surface quality (surface geometry). The WR is of ‘higher the better’ type of QC. However, SR and HO are of ‘lower the better’ type of QCs.
The results obtained from the L18 orthogonal array of experiment are shown in Table 3. 27 These results have been used as a basis for optimization of the multi-objective problem. R1, R2 and R3 represent the results for three different trials at same input conditions.
Output results obtained.
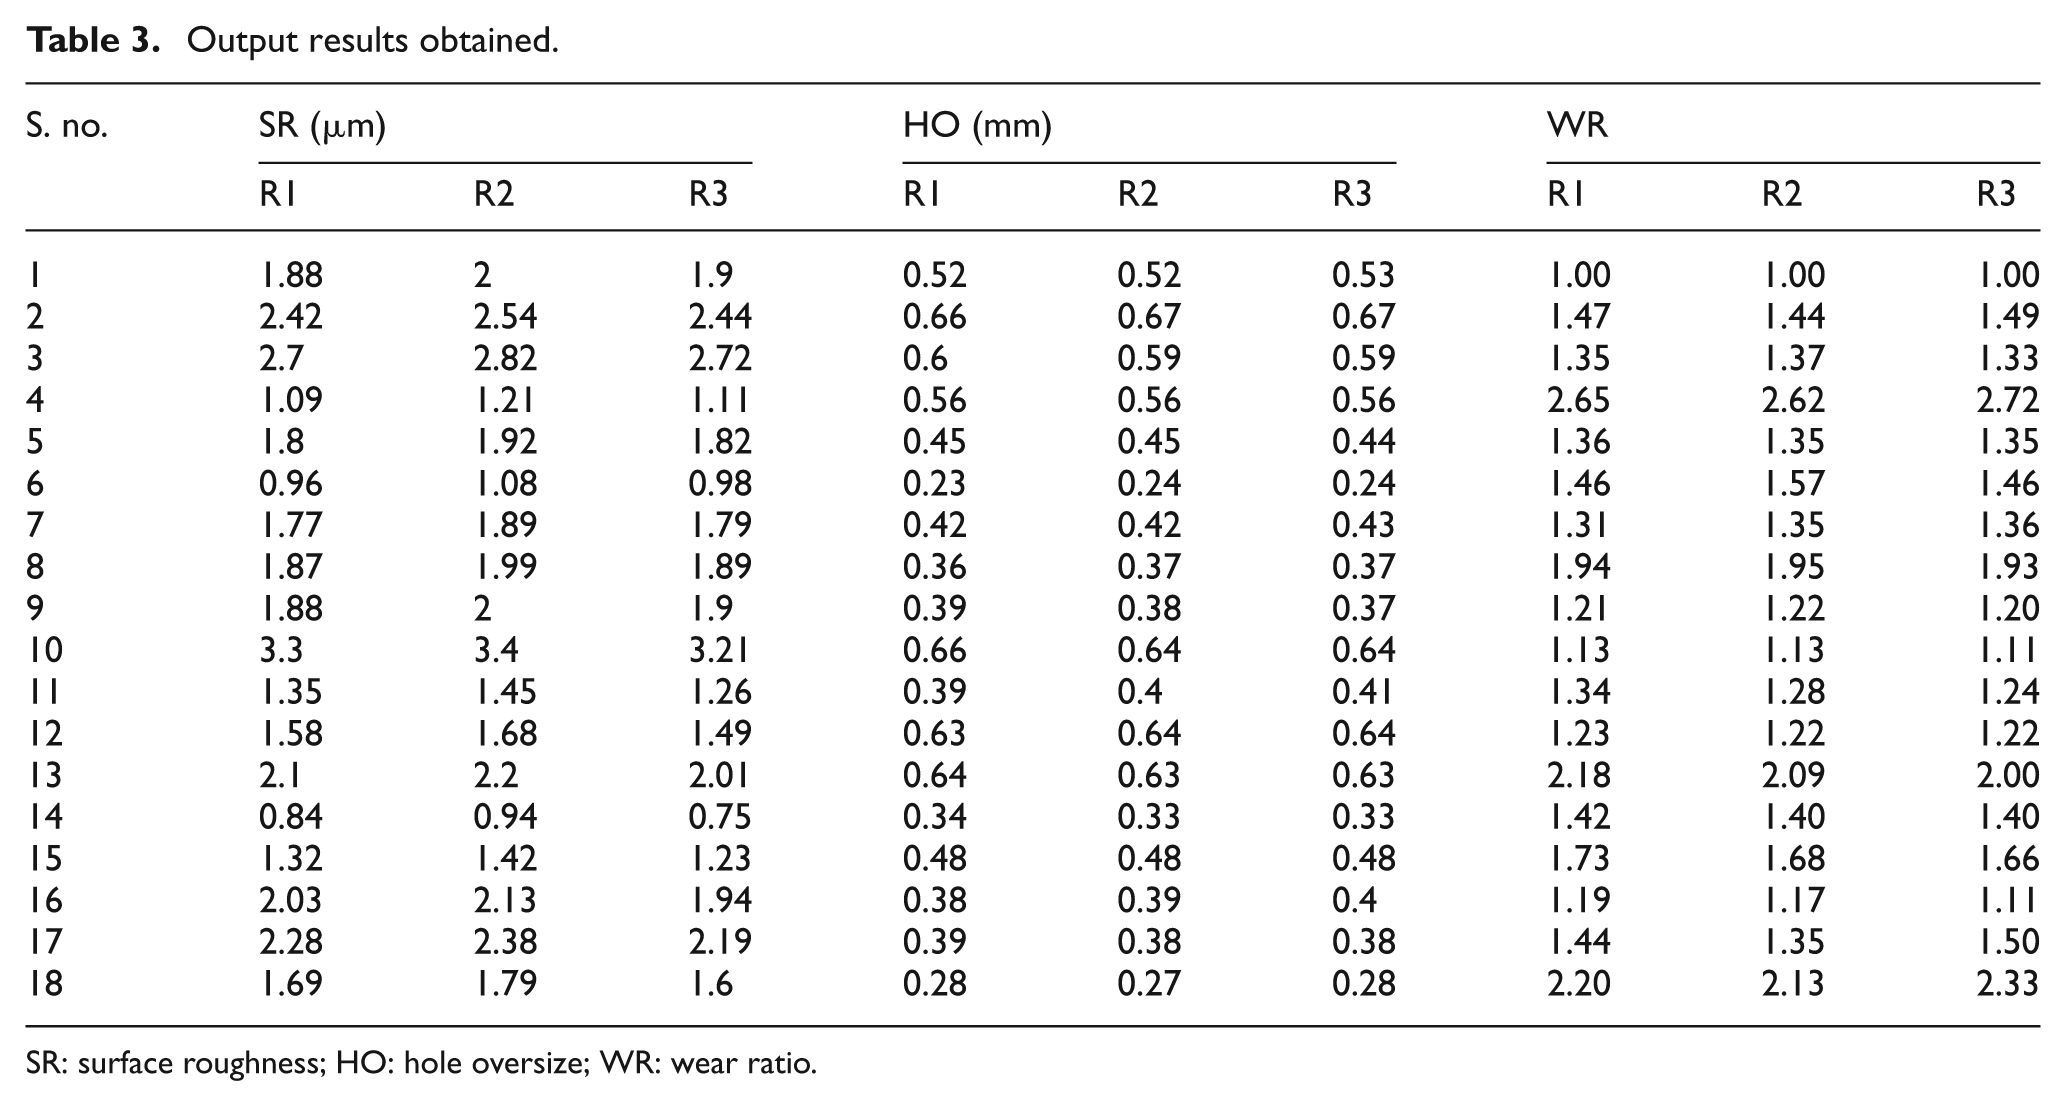
SR: surface roughness; HO: hole oversize; WR: wear ratio.
Preference scale construction
This preference scale construction is the second step of utility concept. In order to obtain the utility value, a preference scale for each QC is constructed. In this scale, 0 and 9 are chosen as the preference number for the minimum and the maximum acceptable levels for each QC, respectively. The optimum values derived from Taguchi’s analysis are shown in Table 4. These values have been used to derive the constant. Logarithmic scale has been used in this study, which is given by 14
Optimum values of Taguchi’s analysis.
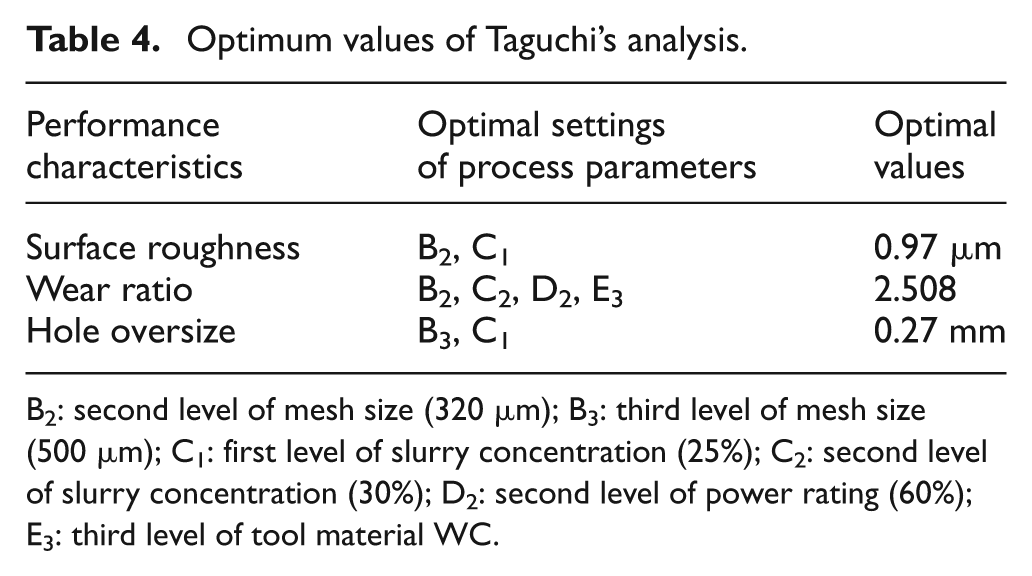
B2: second level of mesh size (320 µm); B3: third level of mesh size (500 µm); C1: first level of slurry concentration (25%); C2: second level of slurry concentration (30%); D2: second level of power rating (60%); E3: third level of tool material WC.
Preference scale formulae for SR, WR and HO.
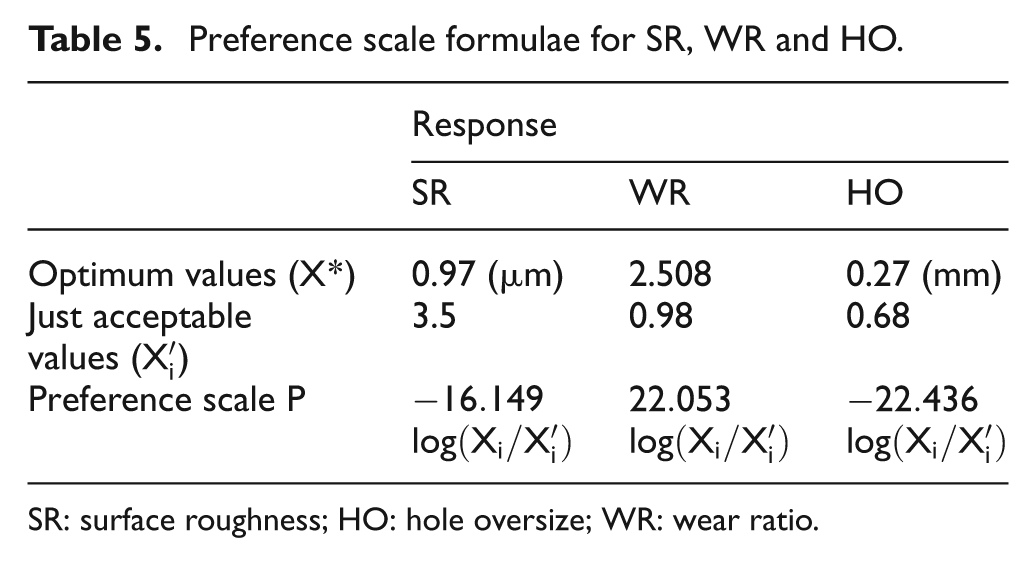
SR: surface roughness; HO: hole oversize; WR: wear ratio.
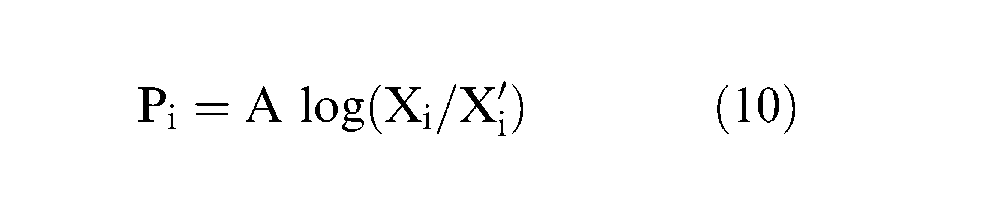
where Xi is the value of attribute characteristic or attribute I,
The value of A can be calculated by substituting Xi = X* in equation (10). X* is the optimum value, which has been derived from Taguchi’s analysis.
The preference scales for various QCs are shown in Table 5. The utility values are finally calculated by the following expression
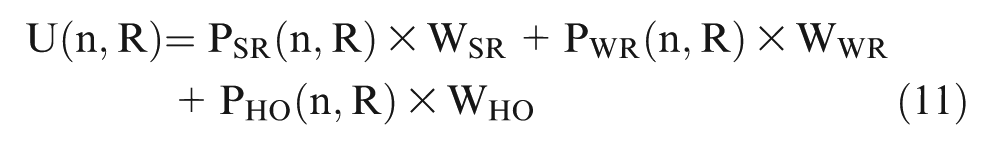
where n is the trial number and R is the repetition number. WSR, WWR and WHO are the weights arrived at the step 5 as shown in section ‘Calculation of weights’. The weights selected are 0.488, 0.323 and 0.189, respectively. On the basis of these weights, the utility values calculated by equation (11) are given by U1, U2 and U3, respectively, as given in Table 6.
Utility values obtained on the basis of QCs (SR, WR and HO).
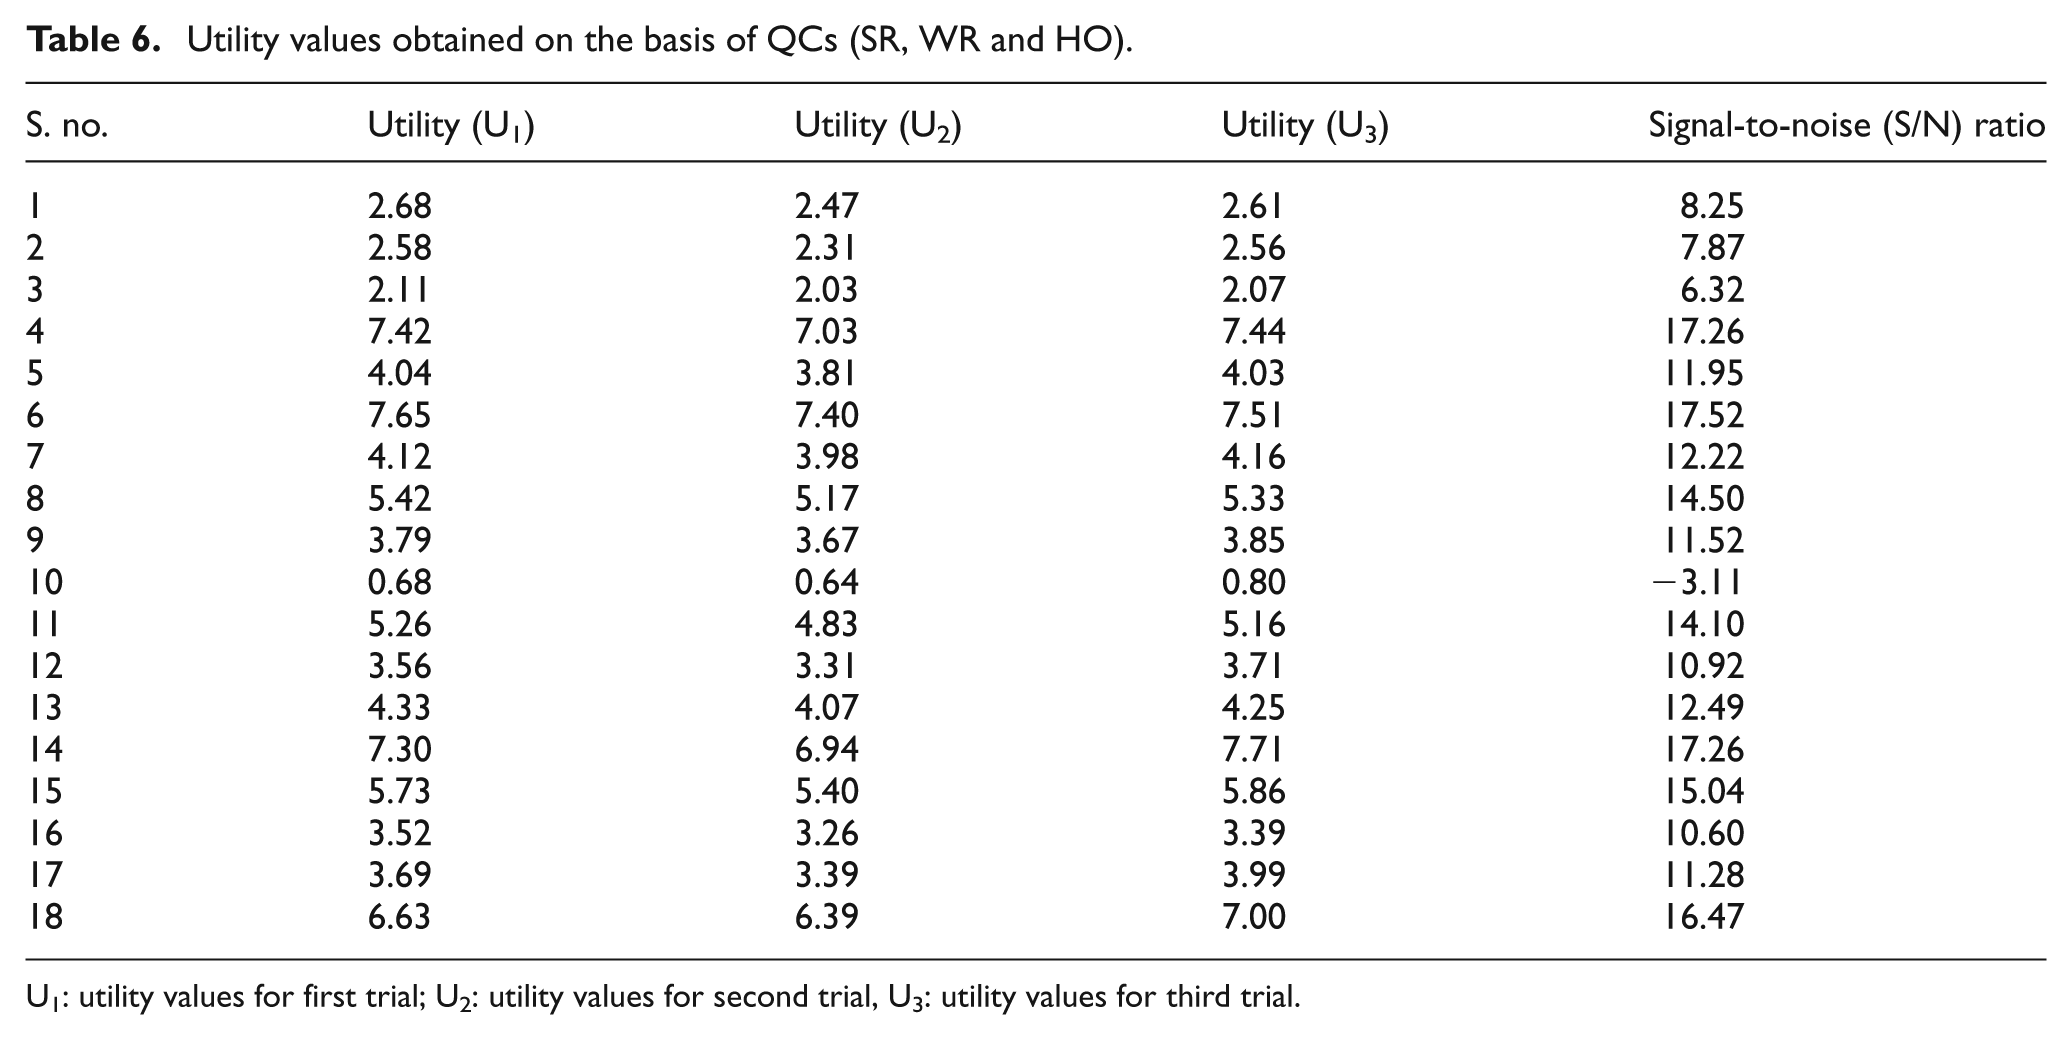
U1: utility values for first trial; U2: utility values for second trial, U3: utility values for third trial.
Analysis of utility data for optimal settings
The mean responses of utility raw data and signal-to-noise (S/N) ratio of various parameters have been plotted in Figure 2. ‘Higher the better’ condition was chosen for S/N ratio of utility value. It can be observed from the response curves that the first level of workpiece (A1), second level of mesh size (B2), first level of slurry concentration (C1), second level of power (D2) and third level of tool (E3) yield the maximum level of utility values.
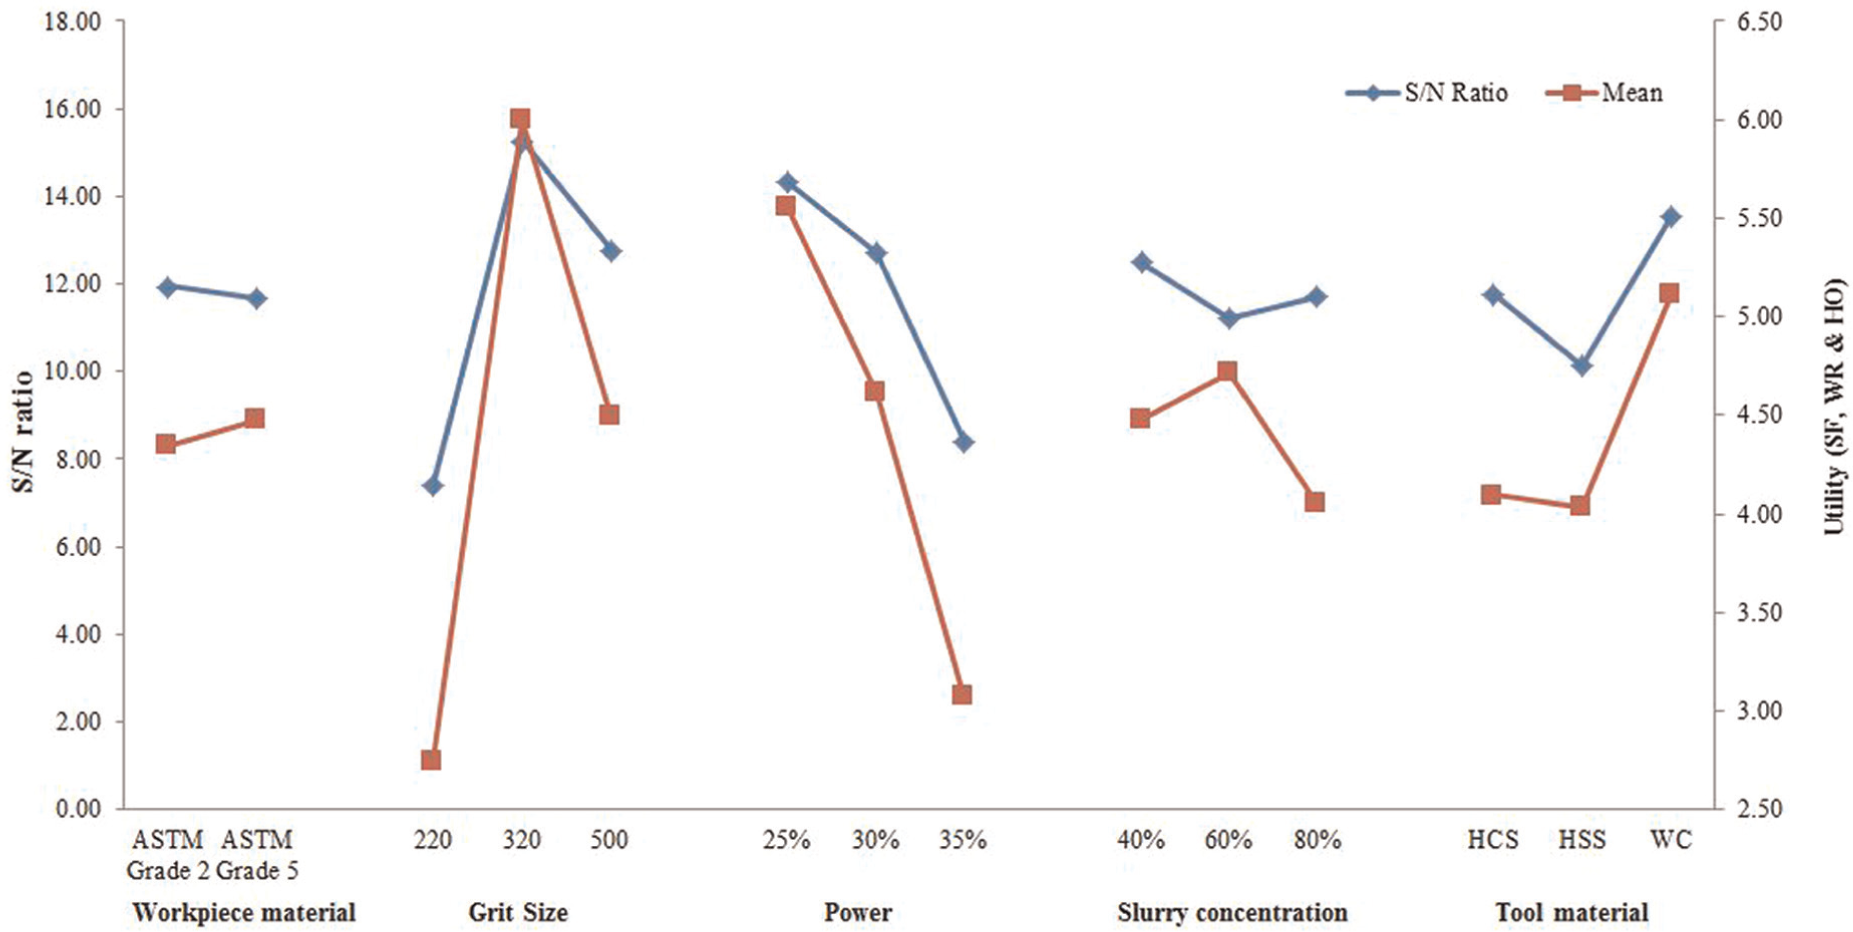
Effect of individual process parameters used in the USM process.
The pooled version of analysis of variance (ANOVA) for raw data and S/N ratio (Tables 7 and 8) indicates that the process parameters like mesh size followed by slurry concentration are the most significant parameters. Slurry concentration and tool material are less significant, whereas workpiece material is insignificant.
Pooled ANOVA (raw data).
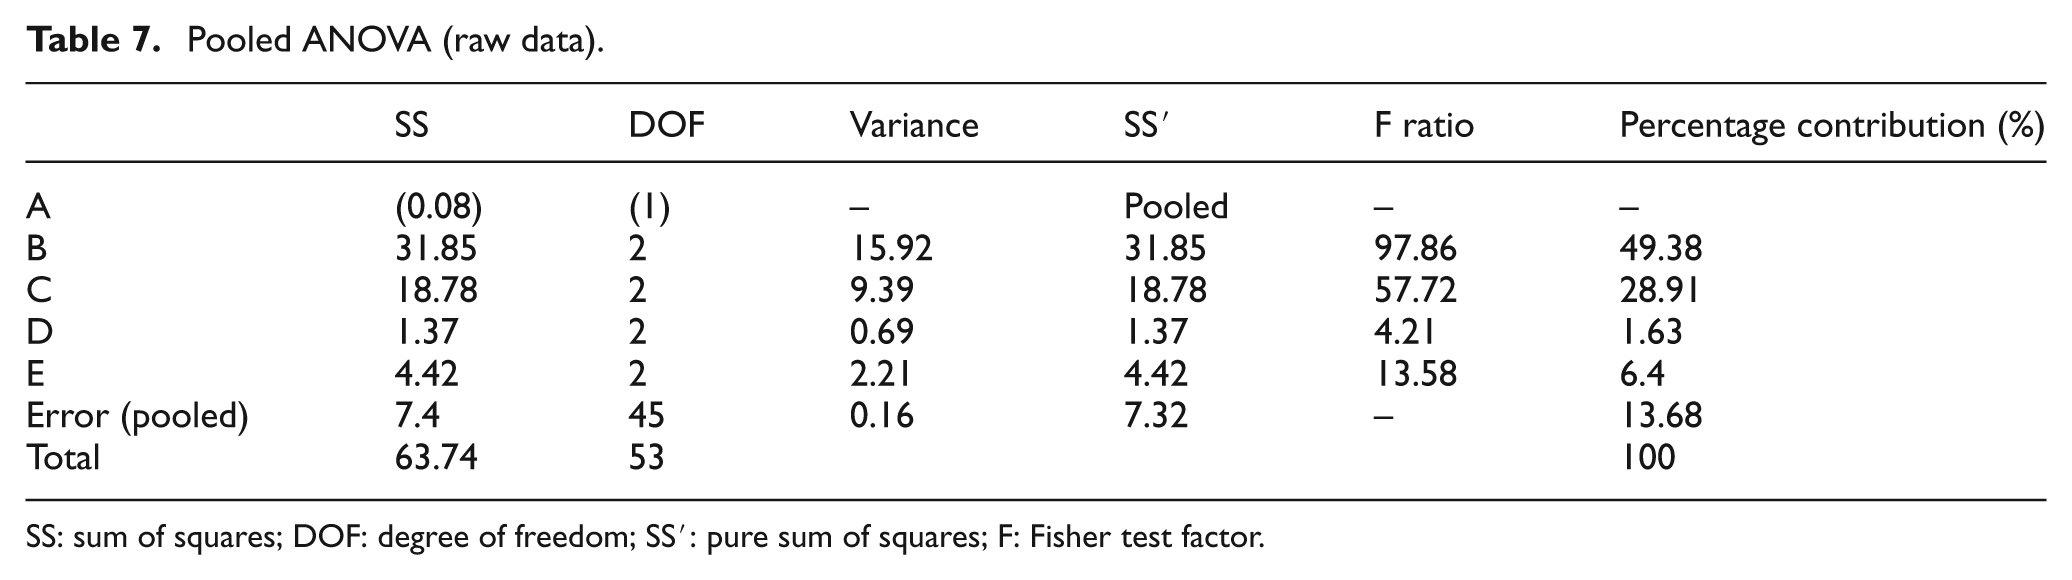
SS: sum of squares; DOF: degree of freedom; SS′: pure sum of squares; F: Fisher test factor.
Pooled ANOVA (S/N ratio).
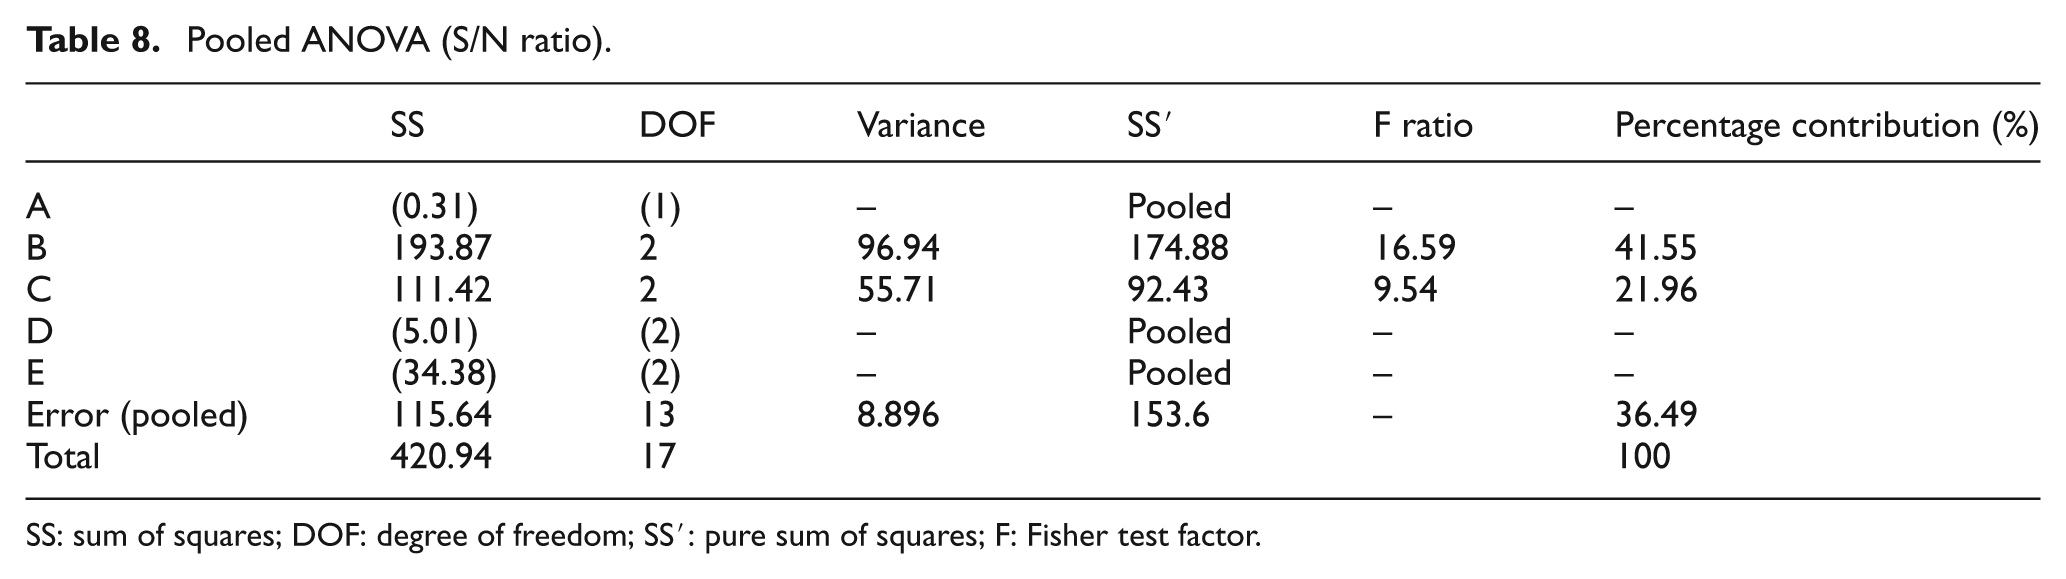
SS: sum of squares; DOF: degree of freedom; SS′: pure sum of squares; F: Fisher test factor.
Optimal values of QCs
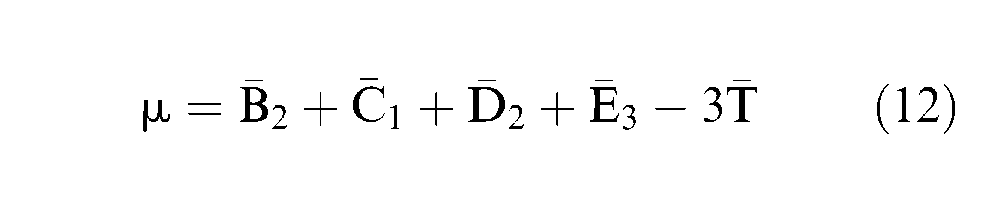
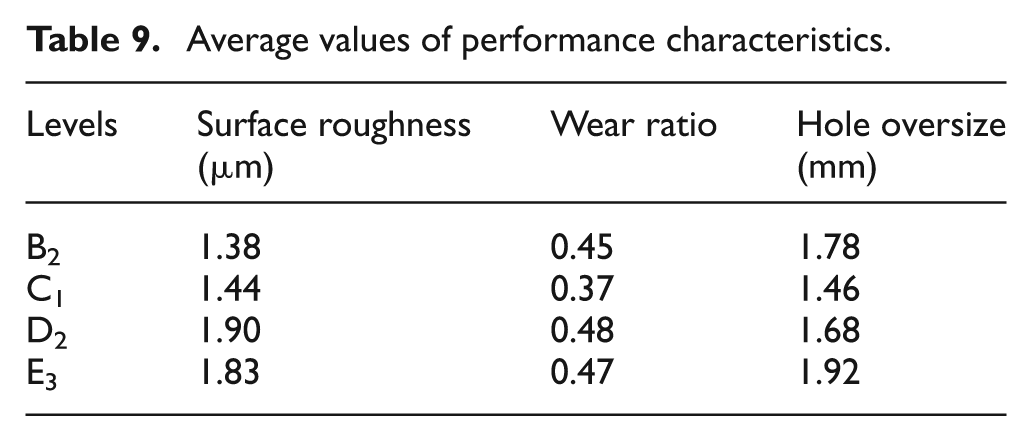
The average optimal values of the QCs corresponding to utility function are shown in Table 9. The following equation was used to predict the mean (µ) 28
Average values of performance characteristics.
The 95% confidence interval for confirmation experiments (
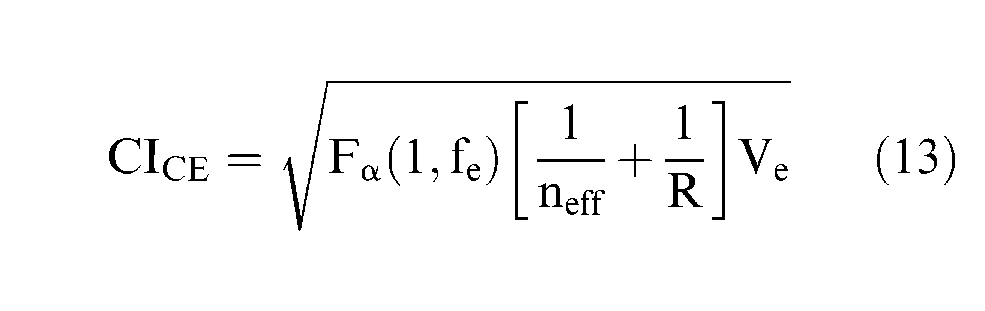
where
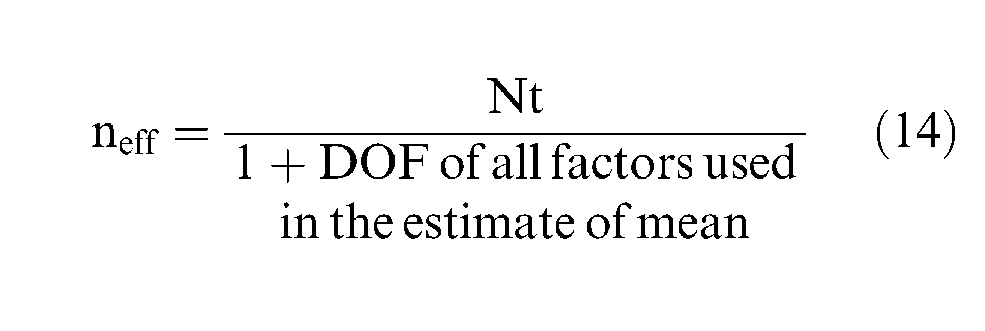
where Nt = total number of trials and R = number of repetitions.
SR
The predicted mean of the SR given by equation (12) is
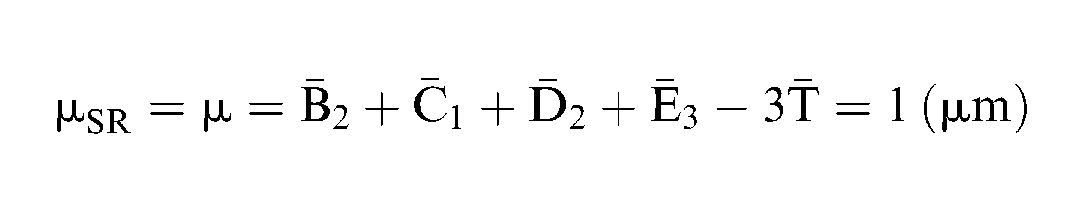
where
WR
The predicted mean of the WR given by equation (12) is
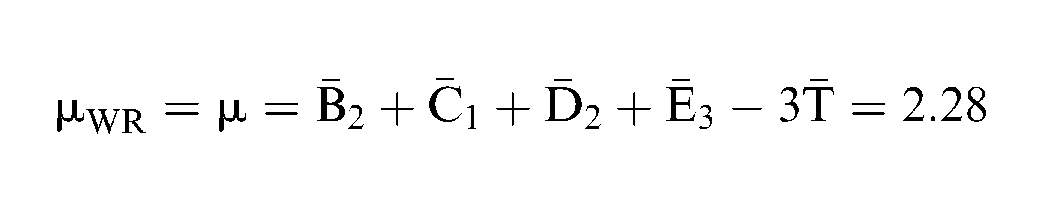
where
HO
The predicted mean of the HO given by equation (12) is
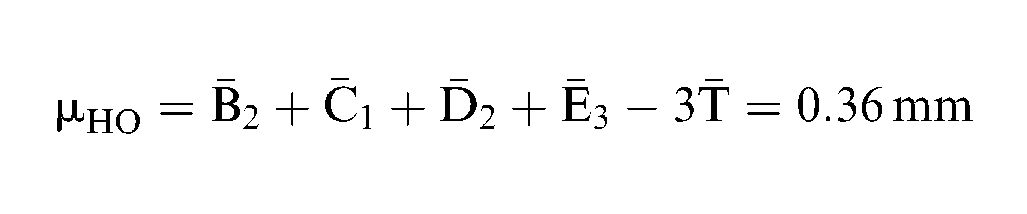
where
Confirmation experiments
Three confirmation tests were carried out by taking the optimal settings of the parameters obtained from Taguchi analysis of utility value. In this case, titanium ASTM Grade 2 was selected for confirmation experiments. The results are shown in Table 10. It can be observed that values from confirmation experiments lie within the range of 95% confidence interval. The values exhibit the validity of the utility approach with weight calculation used in this work.
Confirmation experiments.
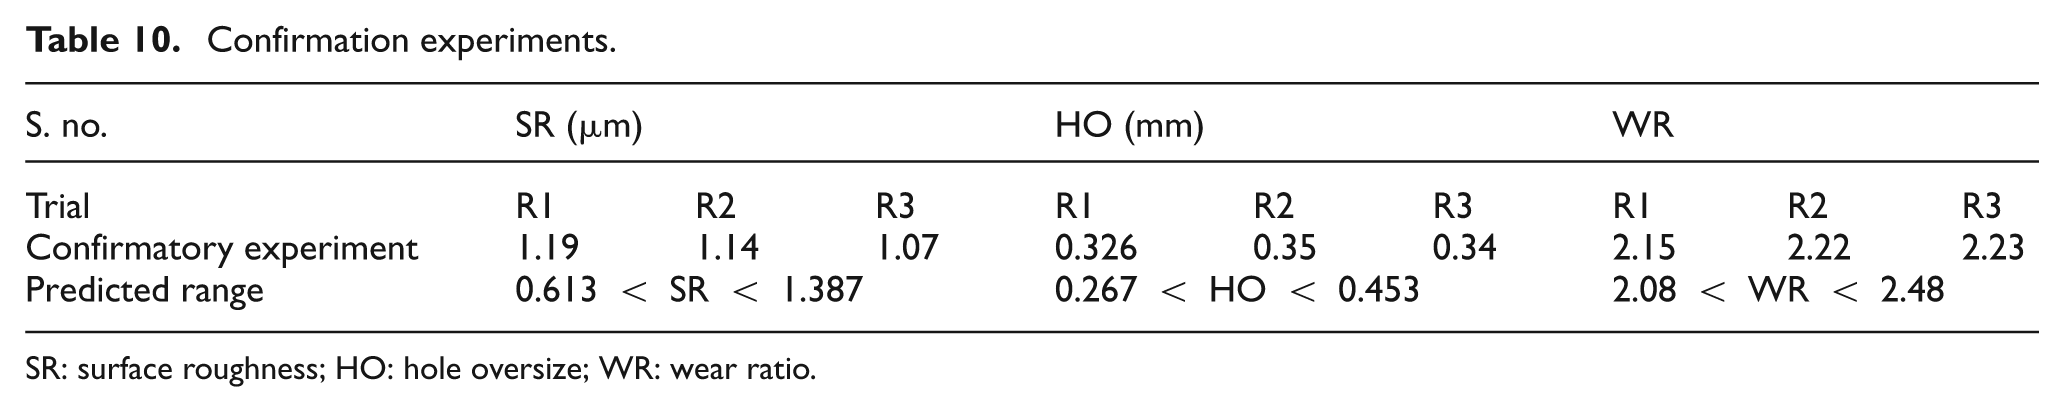
SR: surface roughness; HO: hole oversize; WR: wear ratio.
Authors have implemented this technique of multi-criteria optimization on rotary electric discharge machining (REDM) elsewhere. 29 REDM is a process variant of electric discharge machining (EDM), which is stochastic in nature. 30 The ‘user’s preference rating’ method of optimization was applied on this, and it was found that the results lied within the predicted range. From this case study, it can be observed that this method can be applied to a number of multi-criteria optimization problems in other manufacturing processes also. The technique provides a logical and systematic approach for calculation of weights.
Conclusion
In this article, a novel method for calculation of weights has been presented. In an industry, there might be a number of machining processes with different optimal settings. Different operators may have different opinions regarding the best input parameter setting. To reach a consensus between different users/operators and to derive the best quality, user’s preference rating method of optimization can be an effective solution. The PGs have been used to represent the opinions of different users. The other advantage of this method is that it is not necessary to specify relationship between all the QCs. Ultrasonic drilling of titanium was used as a case study for implementation of this technique. The optimized results have been obtained through ‘user’s preference rating’ method of multi-criteria optimization. Based on the developed methodology, the summary and major conclusions are as follows.
The developed technique is an addendum to the existing ‘customer preference rating’ technique, which was used to prioritize customer’s requirements.
The combination of customer preference rating and utility concept was done to develop ‘user’s preference rating’ method of optimization. Furthermore, this method was applied for multi-criteria optimization of process parameters in ultrasonic drilling of titanium.
The advantage of this technique is that it acts as a consensus between viewpoints of different users, any number of opinions can be considered while calculation of weights.
This technique calculates weight even if incomplete information is provided, that is, if no direct relationship between different outputs is given.
The results of optimization reveal that the mesh size contributes maximum to the overall utility value (49.38%) followed by power rating (28.91%).
The optimized values of the confirmation experiments lie within the range of the predicted values. This validates the new approach for calculation of weights. The technique can thus be a good candidate to be used for multi-criteria optimization in manufacturing processes.
The methodology of calculation of weights can be coupled with many optimization techniques such as grey relational analysis and utility analysis to get optimized results.
Footnotes
Declaration of conflicting interests
The authors declare that there is no conflict of interest.
Funding
This research received no specific grant from any funding agency in the public, commercial or not-for-profit sectors.