
Abstract
Rheopressure die casting is one of the newest casting processes of present era for manufacturing of near-net-shaped cast components with improved mechanical properties and high-dimensional accuracy. Rheopressure die casting demands especially prepared semi-solid alloy slurry having nearly globular primary Al phase. In this study, a cooling slope has been employed to produce semi-solid slurry of Al-Si-Mg (A356) alloy and successively cast in a metallic mould. Image texture analysis techniques have been implemented for accurate evaluation of the primary phase morphology of cast samples. In this research, efforts have been made to apply fractal analysis and run-length statistical analysis techniques for automatic characterization of optical micrographs of cast samples produced at different processing conditions.
Introduction
Becoming a potential manufacturing technology for automobile, aviation, electronics and machine tool industries, the semi-solid processing (SSP) of metals (alloys) enables manufacturing of near-net-shaped components with good mechanical and tribological properties along with high-dimensional tolerance.1,2 Stir casting, electromagnetic stirring, mechanical or ultrasonic vibration, low pouring temperature (PT) and partial remelting, stress-induced and melt-activated (SIMA) process, thermomechanical processing, magnetohydrodynamic (MHD) stirring and cooling slope are the available processes for preparing semi-solid alloy.3–5 However, the cooling slope process outperforms the other techniques to prepare the semi-solid slurry for thixocasting and rheocasting in terms of simplicity and cost-effectiveness. In SSP of aluminium (Al) alloy by cooling slope technique, temperature of superheated molten alloy drops below the liquidus temperature, and α-Al crystals start to nucleate at the time of flow of molten alloy over cooling slope. Solid crystals appear in the region due to inevitable undercooling for solid nucleation caused by initial contact with cold surface of the slope. 6 Henceforth, α-Al crystals form globular equiaxed grains, and the melt becomes semi-solid slurry up to the end of slope. Minimization of macrosegregation, solidification shrinkage and reduction of forming temperature are the significant advantageous features of SSP over conventional casting processes. These features improve formability of semi-solid alloys into complex shapes. 7 Again, non-dendritic morphology of primary phase in microstructure is creating thixotropic flow behaviour at semi-solid temperature, 8 which allows formability of semi-solid alloys into complex shapes, which are not possible with conventional die-casting technique. 9 A series of investigations2,10–13 have also been carried out for in-depth study of primary phase morphology of the microstructure.
Taghavi and Ghassemi 2 and Legoretta et al. 10 performed a series of experiments to investigate the effect of cooling length and tilt angle of the slope on thixotropic microstructure evolution in the case of A356 Al alloy. Das et al.11,12 performed a numerical simulation technique to optimize the process parameters to obtain the best microstructures for SSP of A356 alloy using cooling slope method. They also validated their results with optical micrographs by computing grain diameter (GD) and the degree of sphericity. However, the microstructures of semi-solid slurry are of complex morphology, which is very difficult to evaluate using the Euclidean geometry. 13 So, image texture analysis is an way for quantitative evaluation of micrographs accurately and automatically. Arunachalam and Ramamoorthy 14 proposed a method to monitor the condition of a grinding wheel using image texture analysis techniques, specially using fractal analysis. Jeulin 15 proposed a concept of morphological and moment-based statistical analysis of micrographs of porous heterogeneous material for correlating the extracted features with mechanical properties. According to Hornbogen, 16 the morphological characteristics and distribution of different phases are creating scaling and fractal-like behaviour in microstructure. Huang and Froyen 17 proposed a method by calculating the volume fraction from microstructures to define recrystallization and grain growth phenomena in annealing. Hussain et al. 18 developed a graphical user interface (GUI)-based software to determine the first-order statistical texture features of microstructures. They tested the developed software using atomic force microscopic (AFM) and transmission electron microscopic (TEM) images of polysilicon gate microstructures of complementary metal–oxide–semi-conductor (CMOS) devices and flow morphology of polyamide–carbon blends. However, the second- or higher-order statistical texture analysis techniques are required to extract more information from microscopic images of microstructures. Hoque et al. 19 applied the Canny edge detection and blob analysis techniques for evaluating the metallographs and scanning electron microscopic (SEM) images of cutting tool microstructures after cryogenic treatment. Wu et al. 20 studied the recrystallization behaviour and phase transformation of high-strength steels by observing the diffraction pattern quality of microstructures. However, a costly optical set-up for producing diffraction pattern was used for this technique. Tarafder et al. 21 analysed the SEM images of copper-strengthened high-strength low-alloy (HSLA) microstructures using fractal analysis technique. Alonso et al. 22 extracted a feature by applying run-length analysis technique on SEM images of pharmaceutical pellets obtained from extrusion–spheroidization process and found a correlation of that feature with the pore size and distribution of pores. However, SEM, AFM and TEM are quite costly image acquisition systems in comparison with optical microscope. Time of image acquisition is also less for the later case. However, noise (strain mark) present in a micrograph is disadvantageous for automatic characterization of optical micrographs. Therefore, an improved preprocessing technique is essential to reduce the noises. In this regard, Peregrina-Barreto et al. 23 proposed an automatic threshold-based edge detection technique for determination of grain size of optical micrographs. However, any method regarding the determination of grain distribution or shape of grain was not present in their technique.
Qin and Fan 24 introduced fractal dimension (FD) for estimating solid particle structure. Fan and Chen 25 used experimental results of Sn-15% Pb during continuous cooling to estimate FD. Liu et al. 13 studied primary phase morphology of semi-solid slurry of A356 alloy produced by stirring method using FD. They evaluated FD of optical micrographs using box-counting technique. They considered stirring power as process parameter and evaluated the microstructures obtained from central, transition and edge zones. However, stirring technique for SSP is quite costly and lacks repeatability compared to that of cooling slope processing.
In this study, semi-solid slurry of A356 alloy has been produced using cooling slope technique with a fixed slope angle by varying PT and wall temperature. Optical micrographs of the samples, cast at semi-solid condition, have also been analysed using fractal analysis and run-length analysis techniques after required preprocessing of micrographs. Five features have been extracted for quantifying the microstructures. Also, the extent of linear correlation of extracted features with GD and degree of sphericity has been evaluated.
Experimental set up
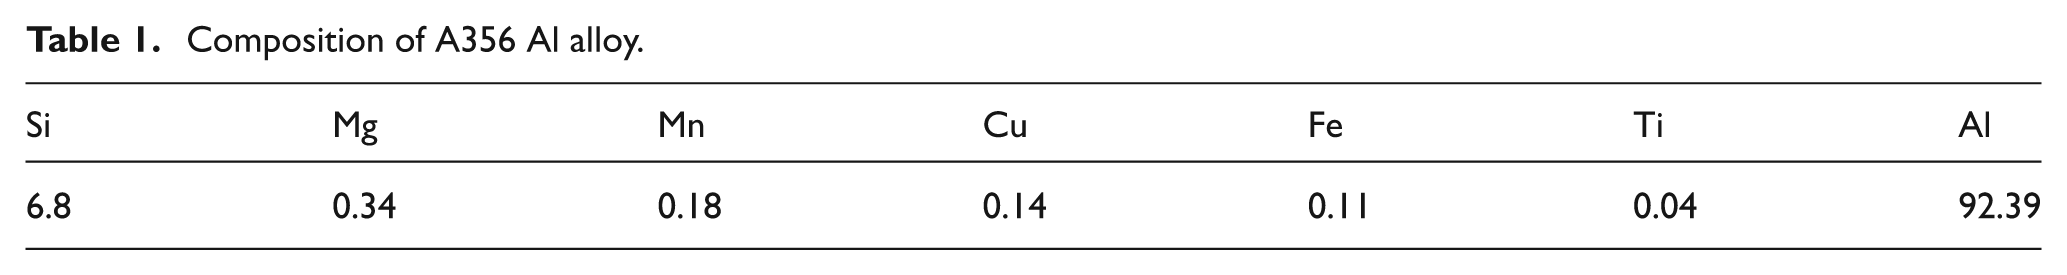
Semi-solid slurry of A356 Al alloy (composition shown in Table 1) has been produced in this study using cooling slope at 60° slope angle.
Composition of A356 Al alloy.
Dendritic structure has been observed in the case of A356 Ingot (Figure 1(a)). Figure 1(b) shows the optical micrograph of low-superheat (10 K) cast samples, directly poured into metallic mould, of A356 Al alloy. Still dendritic microstructure has been observed in the case of directly poured melt but is of smaller size (Figure 1(b)), which is attributed to lesser superheat of the melt and enhanced cooling rate of the metallic mould.
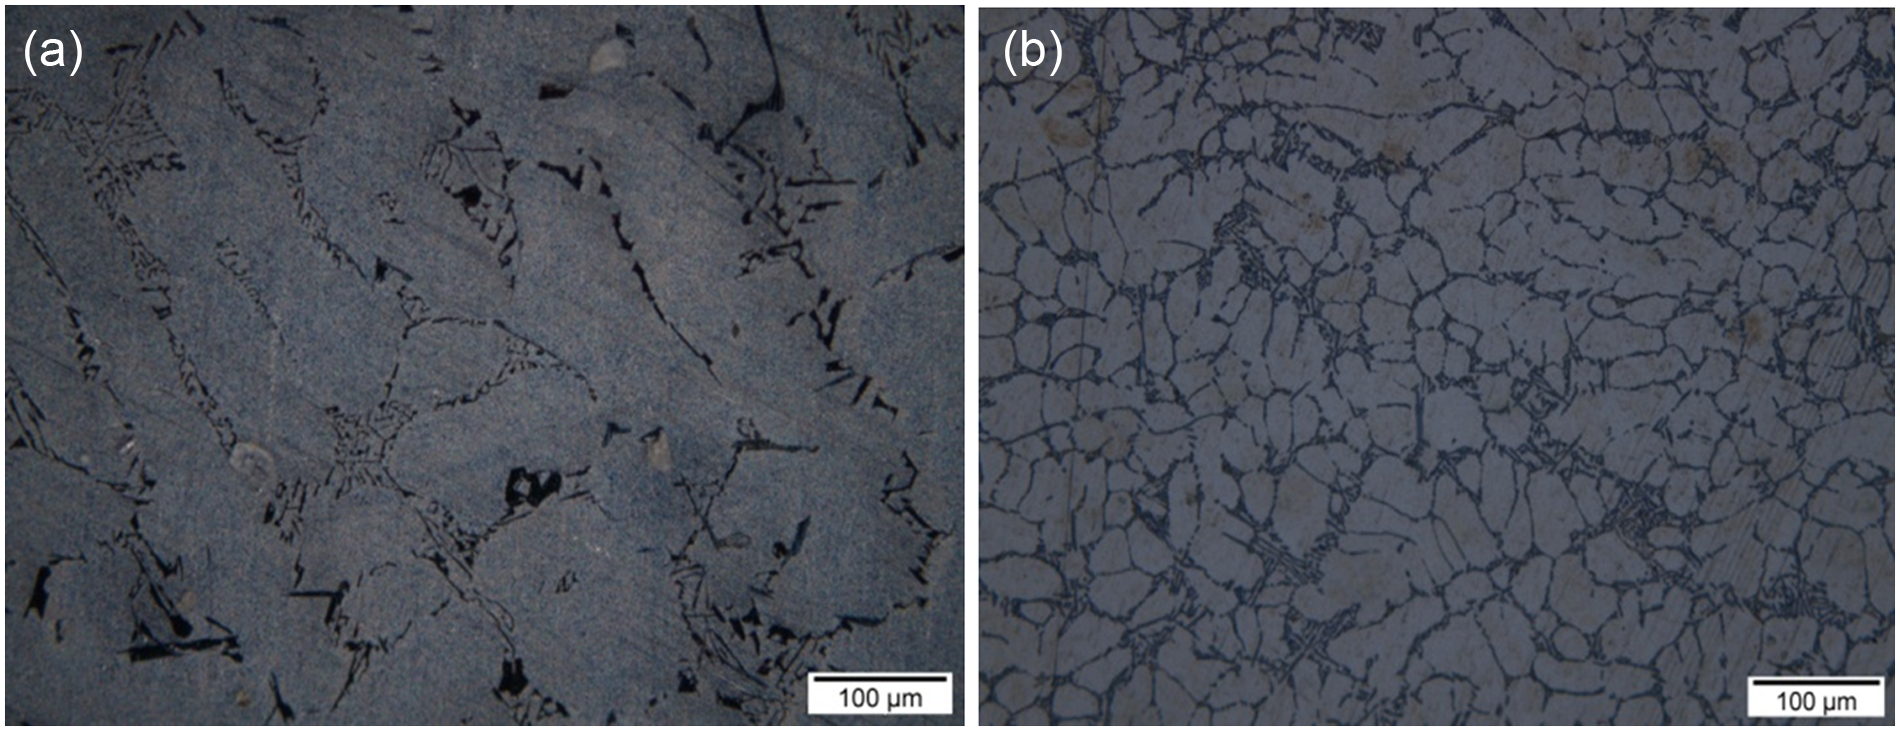
Microstructure of (a) A356 Ingot and (b) low-superheat cast sample.
So, to replace the dendritic primary phase with a globular one, cooling slope casting process has been employed here. Schematic diagram and the actual experimental set up for SSP of A356 Al alloy are shown in Figure 2(a) and (b), respectively.

Experimental set up: (a) schematic diagram and (b) original photograph.
A cooling slope with stainless steel body has been employed to produce semi-solid slurry26,27 in the present study. A356 Ingot has been melted at 1023 K in a resistance heating furnace having 5 kg capacity. For performing the experiment, 2 kg of A356 alloy has been melted in a silicon carbide crucible located within the resistance furnace. Degassed melt has then been allowed to cool up to desired PT, and that melt has been poured along the slope. Plate surface has been coated with a thin layer of boron nitride for facilitating a smooth flow by avoiding sticking of the molten alloy at plate surface. A 10-mm hole with a stopper arrangement at the bottom of the silicon carbide crucible has enabled bottom pouring at a controlled rate. The slurry from the cooling slope has filled a mild steel mould, preheated to 100 °C and then it has been allowed to cool in air. All experiments have been performed for different PTs. Temperature has been monitored along melt stream at three different locations of the cooling channel using K-type thermocouples, and their output has been recorded using a data acquisition software, SCADA.11,12 After experiments, test samples have been cut from the middle section of the cast billets, and the samples have been prepared for metallographic investigation. The samples have been etched by Keller’s solution. Keller’s solution used in this study is composed of 25 mL methanol, 25 mL hydrochloric acid, 25 mL nitric acid, 1 drop hydrofluoric acid and 25 mL distilled water.
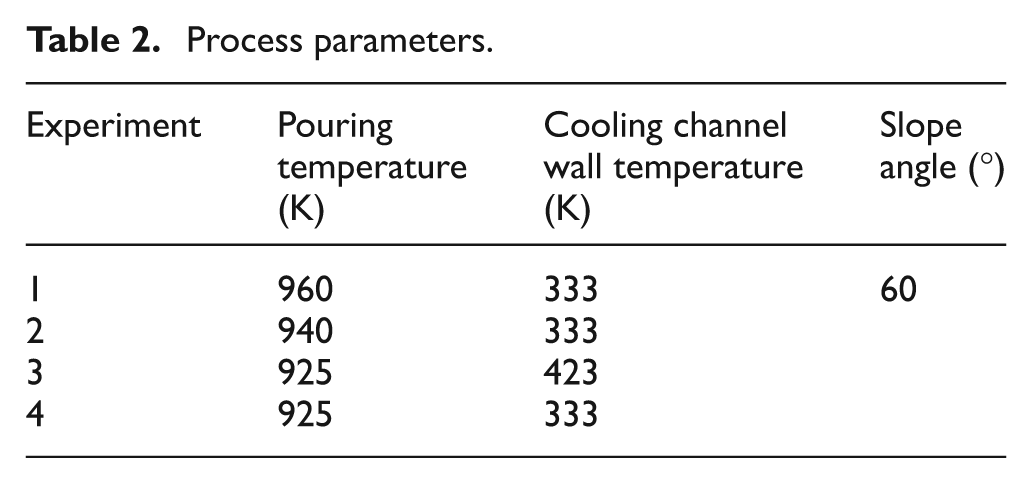
Mechanical properties of cast components of the present alloy are determined largely by the shape and distribution of Si particles in the matrix. In order to reveal the highly branched morphology of the eutectic phase and investigate the possible presence of Fe-rich intermetallic phases, metallographic samples have been etched using Keller’s solution28,29 in the present study. The etched samples have been examined using an Olympus optical microscope, and optical micrographs have been captured using a digital camera attached with the microscope. The experimental parameters along with the experiment numbers are shown in Table 2.
Process parameters.
Methodology
Grain size, distribution of grains, eutectic Si particle distribution and degree of sphericity are varying along with the variation of process parameters, which are depicted in Figure 3(a)–(d). Thus, this change in primary phase morphology can be analysed using the image texture analysis techniques.
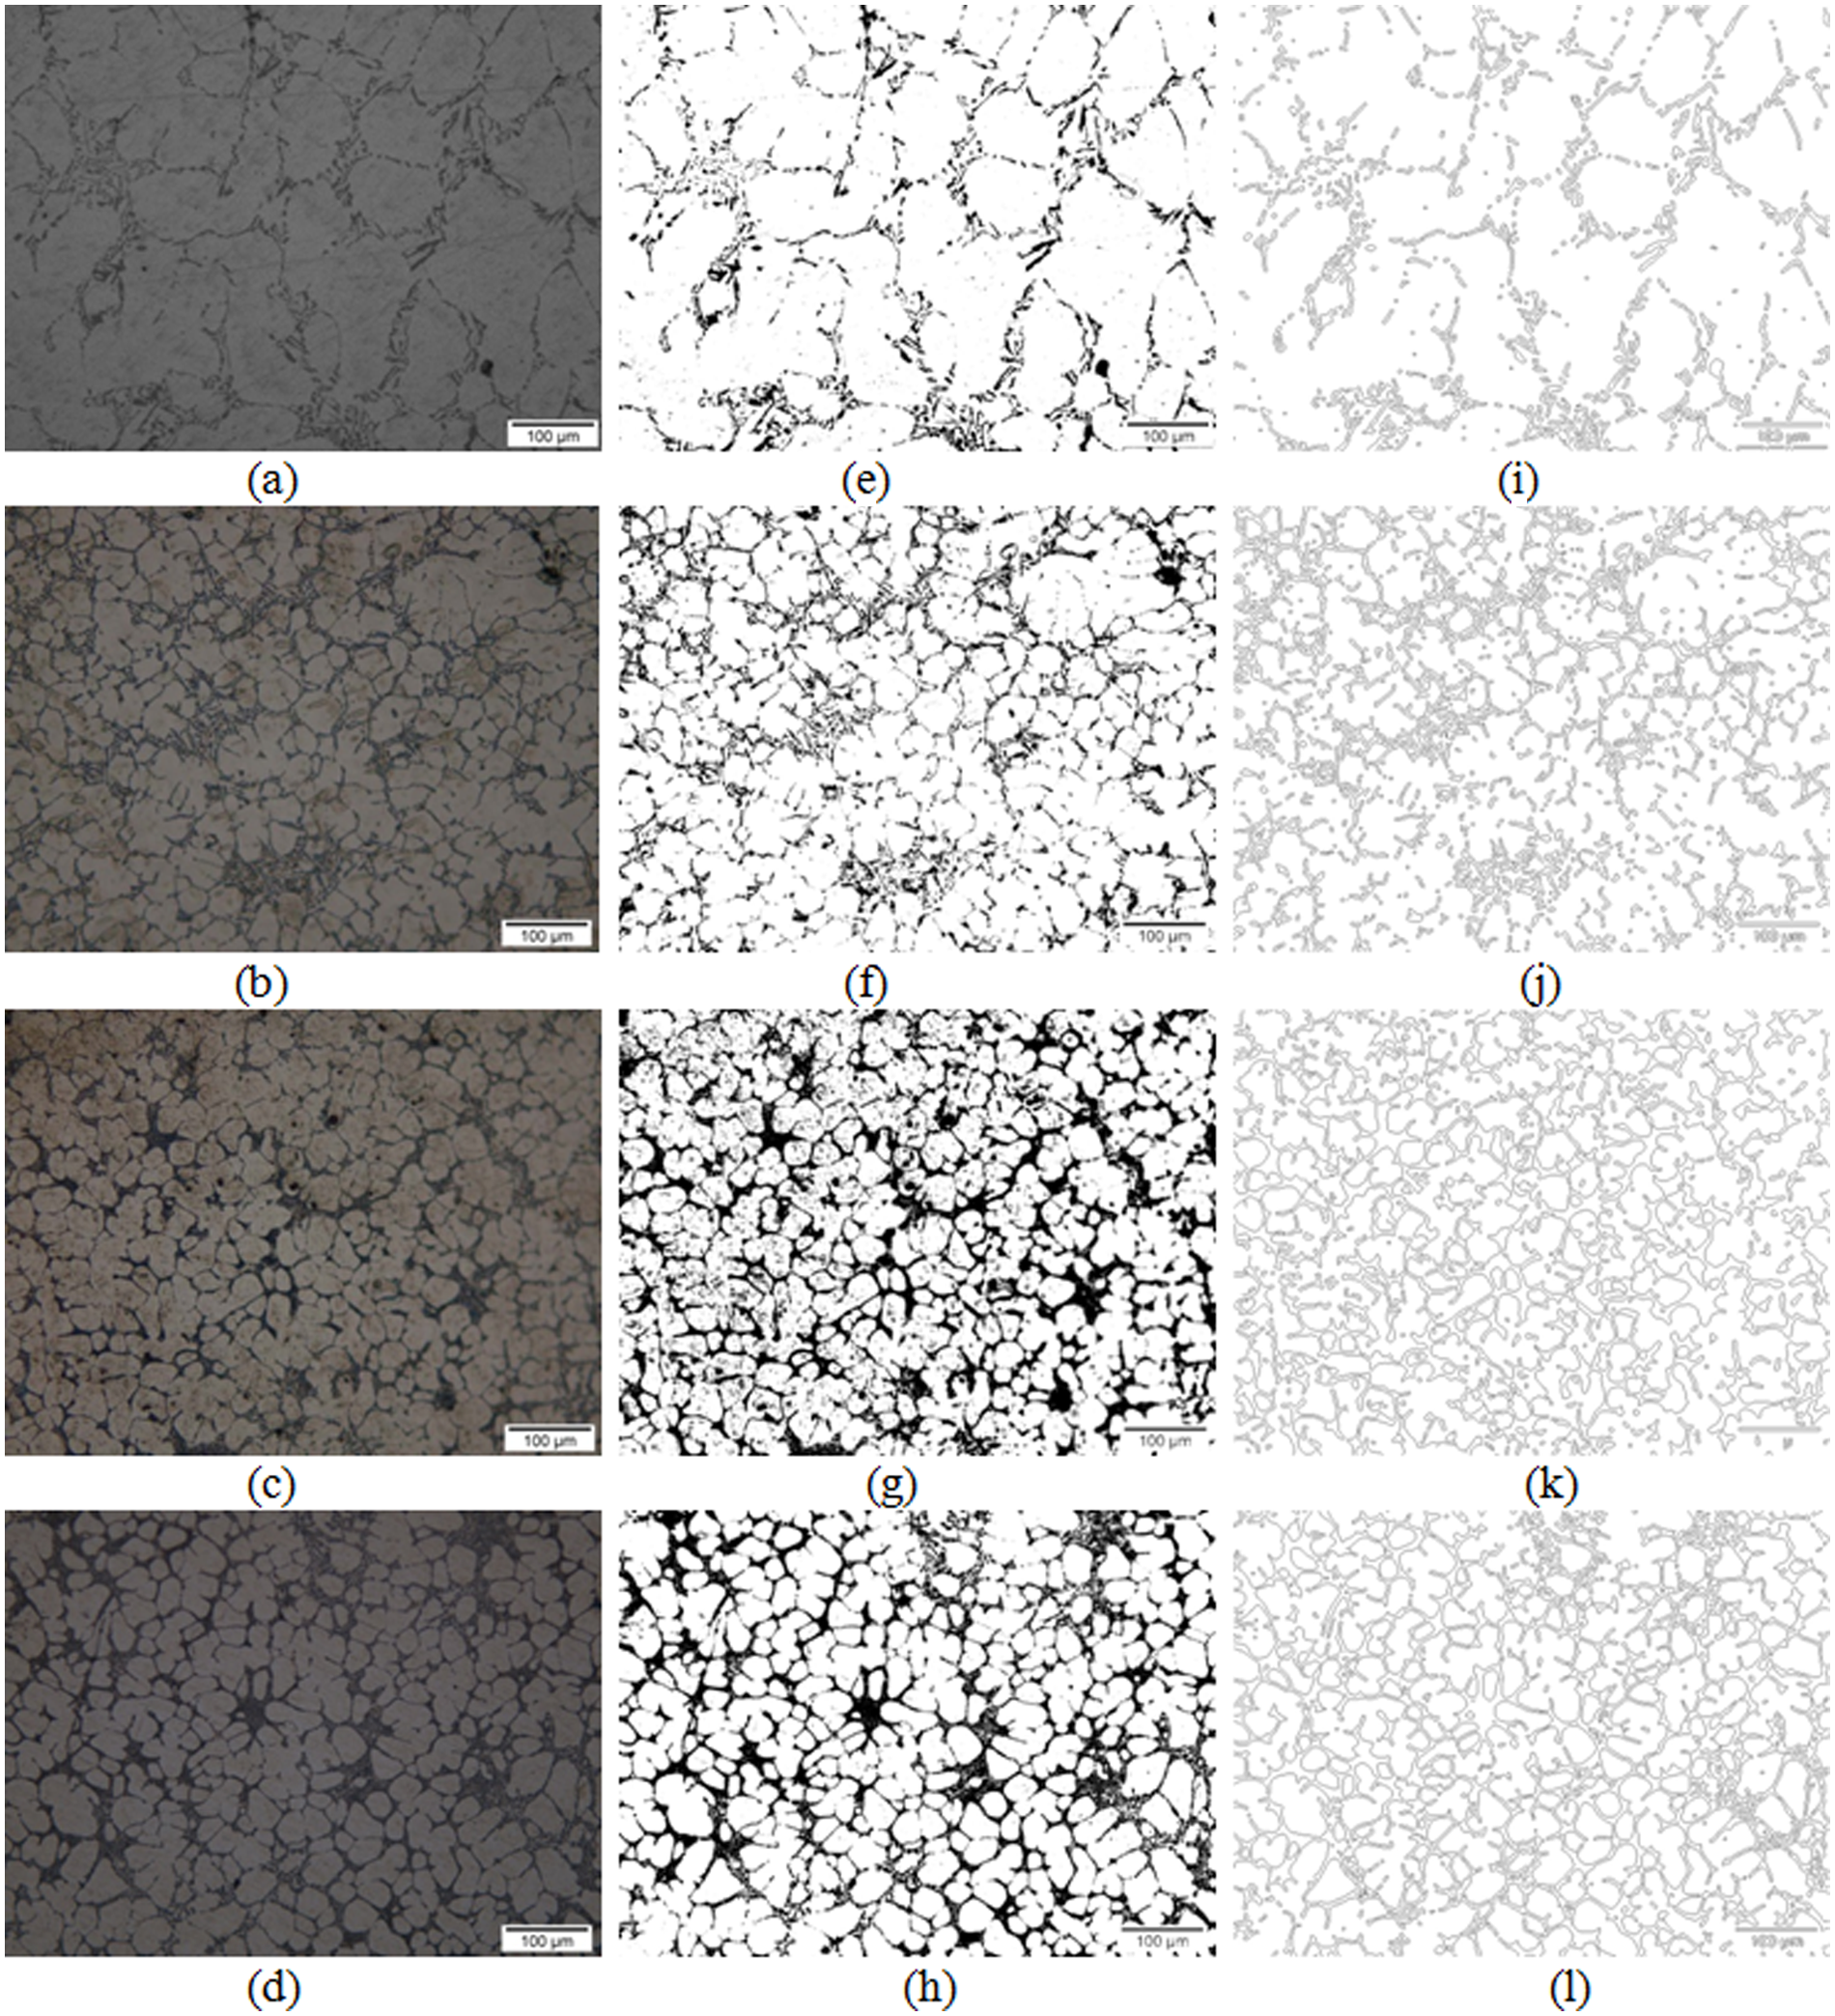
(a–d) Optical micrographs of semi-solid slurry of A356 Al alloy produced at (a) 960 K PT, 333 K wall temperature; (b) 940 K PT, 333 K wall temperature; (c) 925 K PT, 423 K wall temperature; (d) 925 K PT, 333 K wall temperature; (e–h) corresponding illumination compensated images and (i–l) corresponding Canny edge detected images.
Preprocessing
Illumination compensation
Prior to applying image texture analysis, micrographs have been compensated from inhomogeneous illumination to bring them in a common platform by eliminating the brightness variation, which occurs during image acquisition using optical microscope. For the above-mentioned purpose, a method, proposed by Beyerer and León, 30 has been adopted in this study. An image model can be stated as equation (1)
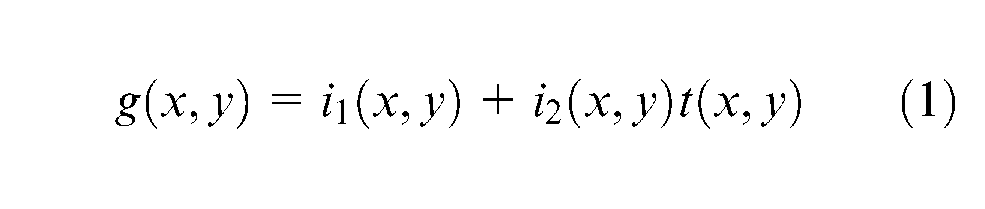
where
Each original image has been recovered from inhomogeneous illumination using equation (2)
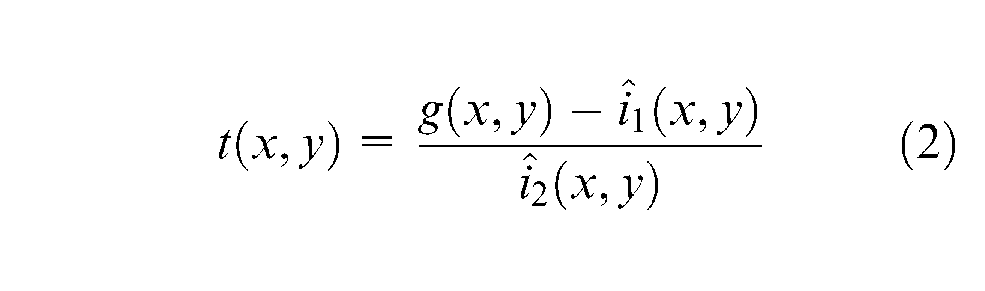
where

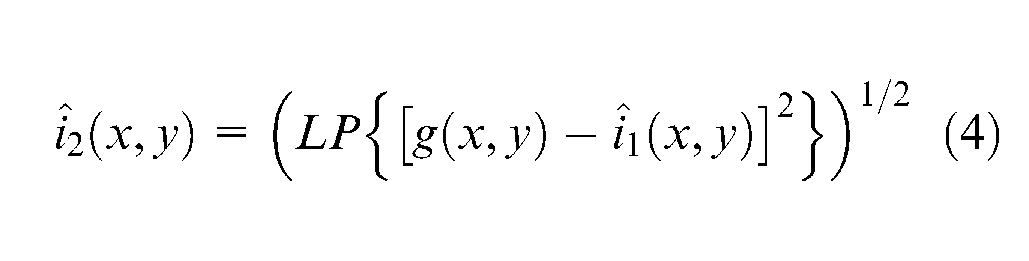
where LP is a low-pass filter, and here, a Gaussian filter has been designed as a low-pass filter. Figure 3(e)–(h) shows the illumination compensated images of Figure 3(a)–(d), respectively. This technique has also been helped to eliminate the noises.
Edge detection
The most important information of micrographs has been carried by the edges. The shape, size, perimeter and so on can be extracted from the edge information of micrographs. Thus, a Canny edge detection algorithm has been applied on the illumination compensated images. Canny edge detection algorithm consists of four steps. First, the image is smoothen by a two-dimensional Gaussian filter; second, the presence of edges has been enhanced by taking the gradient of the image in X and Y directions; third, the points are suppressed where the gradient value is not maximum (non-maximal suppression) and finally, a two-level thresholding and edge thinning has been done to extract the optimal edge image. 31 This method outperforms the other edge detection methods. 32 Figure 3(i)–(l) represents the edge detected images of Figure 3(e)–(h), respectively.
Fractal analysis
Self-affine structures with complex shapes are characterized by fractal analysis technique. FD, extracted by applying fractal analysis on an image, is used to define the self-affinity of an image. FD becomes larger for the structures having higher self-affinity. FD has a very high research importance in the field of machine vision for automatic characterization of texture.
33
In this study, a box-counting algorithm for computing the FD of the edge detected images of the micrographs has been utilized. The length and width of the box,

(a) Example for box counting and (b) plot to find FD.
Run-length statistical analysis
Run-length statistics is a higher-order statistical texture analysis technique, which is applied to the micrographs. This technique was proposed by Galloway. 34 Consecutive pixels of the same grey intensity value or level in horizontal, diagonal or vertical direction constitute a run. In this investigation, the runs of the run-length matrix (RLM) are evaluated in the diagonal direction to cover more heterogeneity present within the microstructure. For example, a RLM (Figure 5(b)) is constructed from an image fragment matrix (Figure 5(a)).
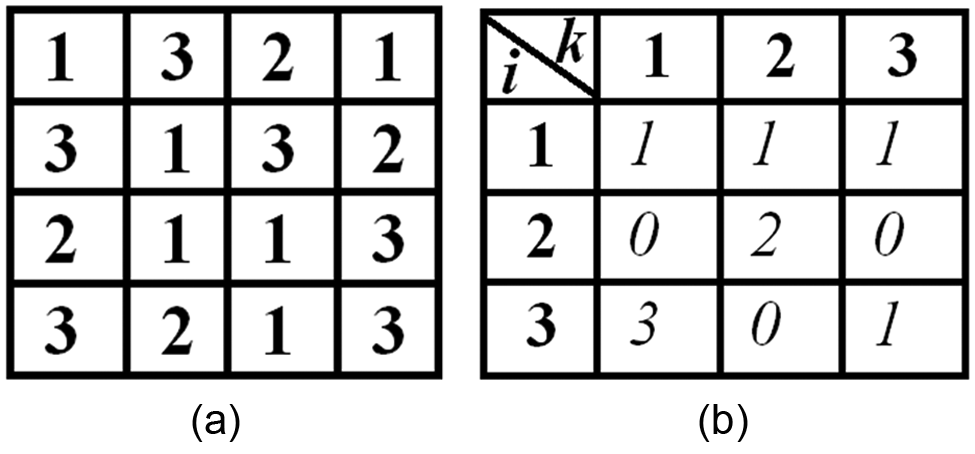
(a) Image fragment matrix and (b) corresponding run-length matrix.
The grey-level intensity value of 1 occurs 3 times diagonally; thus, the length of run is 3, and the run-length value of 3 when grey-level intensity value of 1 occurs 1 time in the image fragment. Thus, the third element of first row of RLM is 1. In Figure 5(b), grey-level intensity values are denoted by

Contour plot of run-length matrix of optical micrographs obtained from (a) Experiment 1 and (b) Experiment 4.
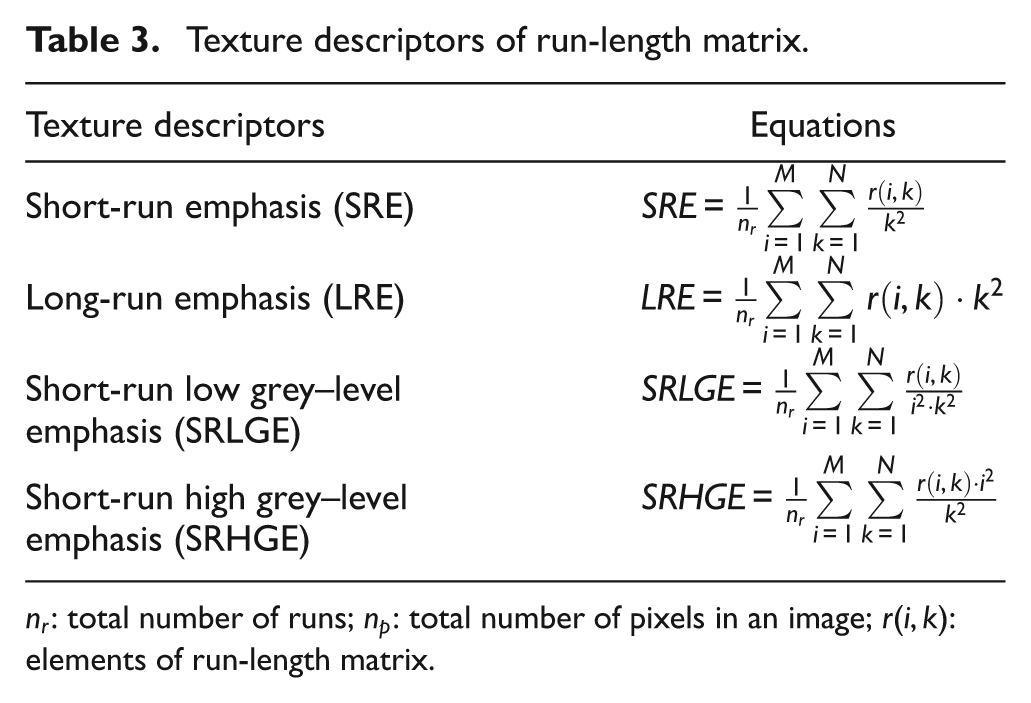
Texture descriptors of run-length matrix.
Results and discussion
Primary phase morphology of semi-solid slurry gets affected negatively for higher melt PT. With more superheat, the required cooling time for initiation of nucleation increases, resulting in less residence time for the α-Al primary particles to globularize due to lesser shear during the flow of semi-solid slurry along the slope. Figure 3(a) and (b) corresponding to PTs of 960 and 940 K, respectively, depicts more dendritic and rosette-like structure of the primary phase, as compared to the globular microstructure with a PT of 925 K (Figure 3(d)).
Wall temperature of 333 K (Figure 3(c)) is responsible for optimum result of grain size and sphericity of primary phase among the experiments performed with 60° slope angle. Further decrease in wall temperature causes solid skin formation over cooling slope, whereas increase in wall temperature causes lesser shear during melt flow through the slope and in turn helps the primary phase to agglomerate, which is responsible for reduced sphericity of primary particles.
For calculating grain size and sphericity of primary phase, two parameters, such as GD and shape factor (SF), have been determined, manually, using standard image analysis software Image J. GD and SF or degree of sphericity are calculated according to the following equations


where Aα and Pα denote the area and perimeter of primary α-Al phase, respectively.
It may be noted here that each globule is treated as a separate grain. For optimum SSP characteristics, the SF should be as close to 1 as possible. As the parameters of SSP, namely, PT and wall temperature with fixed slope angle, varied, the morphology of microstructure has also been varied. According to Das et al., 11 the microstructures formed at 940 and 960 K were more rosette-like and dendritic structures compared to the microstructure formed at 925 K at same slope angle and wall temperature. Since the least GD and highest degree of sphericity have been obtained in the case of microstructure (Figure 7) produced at 60° slope angle, 925 K PT and 333 K wall temperature, it has been identified as ideal processing condition in the present study.
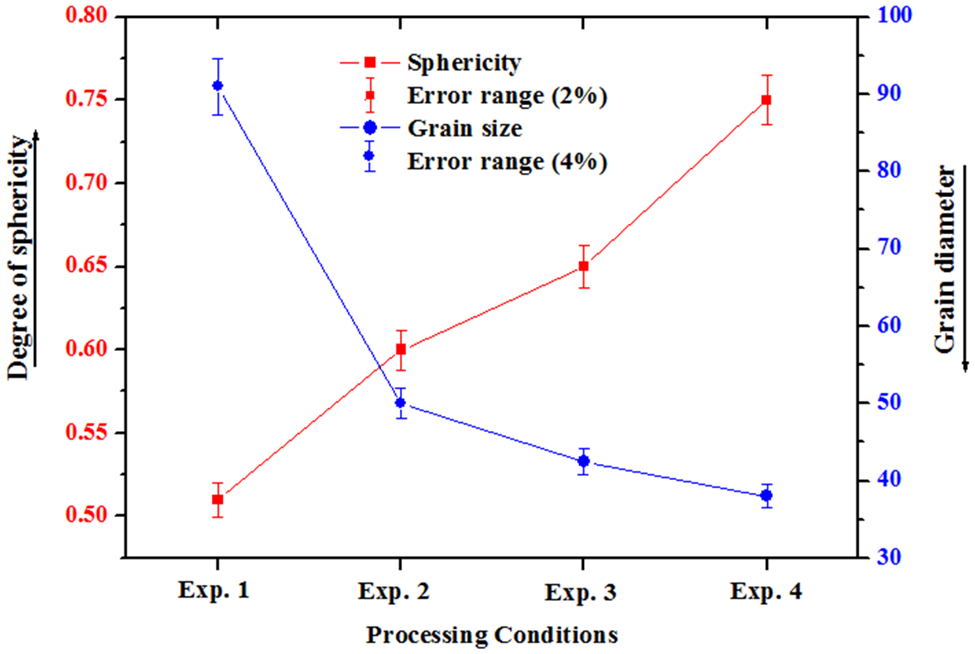
Plot of degree of sphericity and grain diameter versus experiment numbers.
Fractal characteristics of binary images of microstructure have been normalized within 0–1 and plotted against normalized values of GD and degree of sphericity in Figure 8(a) and (b). In this context, it should be mentioned that the experimental validations are carried out for some chosen cases from the set of numerical studies. The details about numerical studies may be seen from the earlier published literature of this research group.11,12 According to Figure 8(a), FD reduces with an increase in GD. As the morphology of the microstructure is complicated, the grain size reduces with increasing self-affinity. Thus, the FD is increasing with reducing grain size. The FD increases with an increase in degree of sphericity, which is depicted in Figure 8(b). As the GD reduces, the degree of sphericity increases accordingly, and thus, the FD is increasing. However, the plot of FD versus GD has been fitted linearly, and the fitting coefficient, adjusted R 2 is 0.98 with a slope of −1.04. Thus, there exists a linear correlation between variation in GD vis-a-vis FD.

Plots of (a) FD versus grain diameter and (b) FD versus degree of sphericity.
Four features, namely short-run emphasis (SRE), long-run emphasis (LRE), short-run low grey–level emphasis (SRLGE) and short-run high grey–level emphasis (SRHGE), have been extracted as run-length features by applying run-length analysis technique on the illumination compensated images of optical micrographs. The number of short edges increases with a reduction in GD and an increase in degree of sphericity. Thus, the normalized values of short-run–related features, namely, SRE, SRHGE and SRLGE, increase with the reduction in normalized GD and increase in normalized degree of sphericity, which are depicted in Figure 9(a) and (b), respectively. Similarly, normalized value of LRE reduces with the reduction in normalized GD and increases with normalized degree of sphericity (Figure 9(a) and (b)). The coefficient of linear fitting for SRE, LRE, SRHGE and SRLGE against degree of sphericity is 0.92, 0.99, 0.94 and 0.97, respectively, and the slopes of fitted straight lines are 1.04, –1.01, 1.02 and 0.97, respectively. Since the degree of sphericity varies linearly with change in edge morphology of the obtained micrographs compared to the GDs (which varies non-linearly), therefore, the run-length features are found to have a linear fit with the degree of sphericity. Hence, the variation of degree of sphericity can be predicted using the run-length analysis technique.
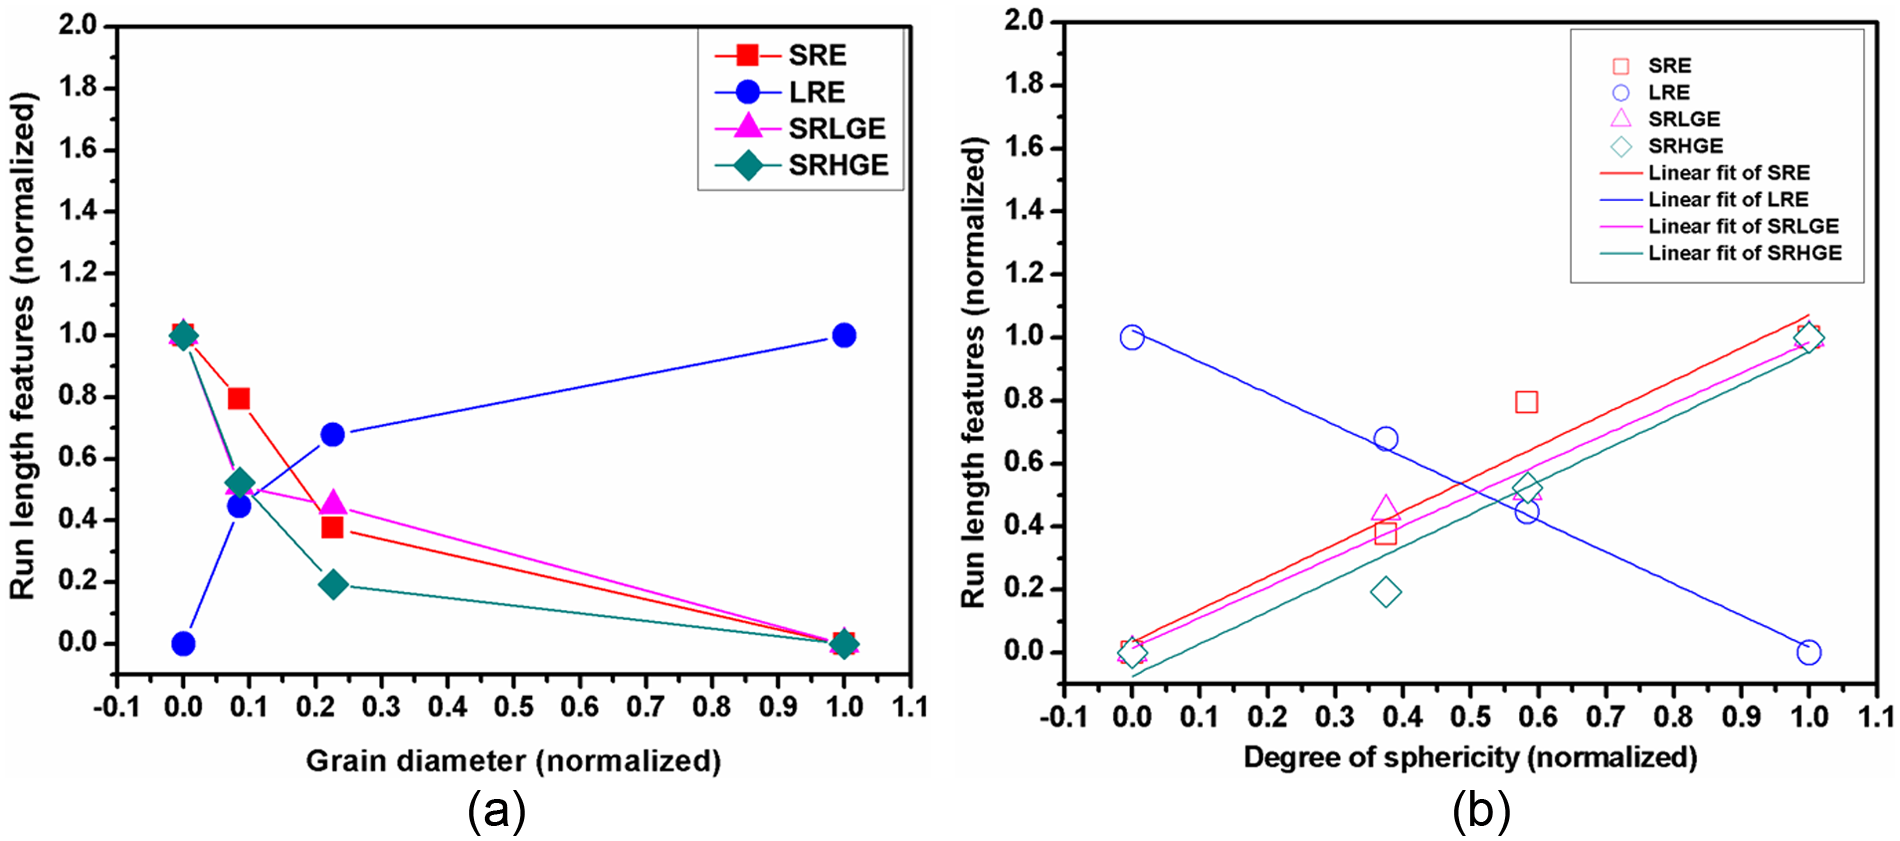
Plots of (a) run-length features versus grain diameter and (b) run-length features versus degree of sphericity.
Conclusions
This study describes about semi-solid slurry preparation of A356 aluminium alloy with desired primary phase morphology using cooling slope as well as the automatic characterization of primary phase morphology using image texture analysis. Morphology, that is, shape and size of primary Al phase, is of outmost importance towards mechanical properties of rheocast parts. Here, micrographs of the rheocast (using cooling slope) samples of A356 Al alloy have been analysed using image texture analysis techniques, which enables automatic characterization of the micrographs, which in turn ensures the quality of the cast parts.
Out of the case studies performed, the best processing condition has been identified as 60° slope angle, 925 K PT and 333 K slope wall temperature. These processing conditions result in a maximum degree of sphericity of 0.75 and minimum grain size of 38 µm of the primary α-Al phase, evaluated experimentally.
As the phase morphology changes with the change in process parameters of SSP, the FD and run-length features systematically vary, which enables automatic characterization of optical micrographs. FDs are behaving more linearly with GD because of its nature of self-affinity. Four run-length features namely, SRE, LRE, SRHGE and SRLGE, are behaving linearly with the degree of sphericity due to the nature of emphasizing the edges or runs.
In this study, grain size and degree of sphericity of primary Al phase serve as the quality characteristics of the cooling slope rheocasting process and automatic characterization of the above-mentioned features ensure the quality of the cast parts. This study is dedicated towards the development of a robust algorithm, which can evaluate quality characteristics (grain size and degree of sphericity) accurately and operator intervention to measure them can be avoided, as operator intervention serves as the source of variability of results.
Conventionally after casting, a metallographic sample is prepared from the cast part and then it undergoes investigation using optical microscope as the microstructural features of the cast part describe about the quality of it. The microstructural features are investigated manually using image analysis software. As like the present case, the grain boundaries are often ill-defined in practical cases, so operator intervention to calculate microstructural features may give misleading results, whereas the algorithms developed in this study can withdraw the operator intervention to analyse microstructural features and ensure repeatability. The proposed algorithms are capable of giving accurate results in a shorter time, which will aid to improve the rheocasting process in terms of automation and also in terms of standardization of the processing conditions.
Footnotes
Acknowledgements
The authors express their heartfelt gratitude to Prof. (Dr) Gautam Biswas, Director, CSIR–CMERI, Durgapur, for his continuous encouragement and all the members of Foundry group for their cooperation for successful completion of this research study.
Declaration of conflicting interests
The authors declare that there is no conflict of interest.
Funding
This study was financially supported by the Department of Science and Technology (DST), New Delhi, India.