
Abstract
Large-aperture lenses are widely used to improve optical resolution and enlarge field of view of a precision optical system, and reasonable mounting can result in higher optical performance. Flexure mounts are usually utilized to minimize distortion of the lens under its own weight and must be accurately assembled so as to provide uniform support loads for the lens. The supporting loads produced by flexure mounts are difficult to be identical because of various uncertainties during assembly process, such as human operation and tool resolution. These nonuniform supporting loads may generate asymmetric deformation of the lens and deteriorate its performance. It is essential to explore the influence of uncertainty supporting loads on the optical performance. A Monte Carlo analysis method is proposed to investigate the optical performance of a lens under uncertainty supporting loads at different load levels. Patran Command Language is used for repetitive calculation of finite element model with random sample of supporting loads. The optical performance responses, such as the surface peak-to-valley and root-mean-square errors and Zernike coefficients, are calculated by fitting the surface deformation data, and their stochastic properties are researched by statistical testing. Consequently, the critical variation range of uncertainty supporting loads considering assembly process can be determined based on Three Sigma theorem with specific optical performance requirement. The results can be used to assign appropriate tolerance of flexure mounts during assembly and to optimize the supporting system of a high-precision optical system.
Keywords
Introduction
With the increasing demand of finer optical resolution, higher imaging quality, and larger field of view, large-aperture lenses are widely used in many applications, such as semiconductor lithography apparatus, solid-state laser facilities, and space telescopes.1–3 These lens systems must be very accurate and must minimize distortion of each lens after assembly. However, large aperture usually results in large gravitational sag of a lens under its own weight, which induces wave front errors into the lens system and further deteriorates its optical performance. Fortunately, reasonable mounting can decrease the surface deformation and improve optical performance of the lens. 4
The optical performance of the lens system is significantly influenced by the surface deformation of the lens due to the supporting loads after assembly. For minimizing mechanical effects on optical performance, the most promising mounting configuration utilizes flexure mounts to apply both stiffness to support a lens and compliance to isolate lens from the mechanical disturbances.5,6 So far, lots of novel flexure mounts have been engineered to achieve desired performance of the optical systems.7–10 Optical designers are usually concerned about the surface distortion of the lens with deterministic mechanical loads to decide the related dimensional variations but do not pay much attention to its uncertainty distortion caused by assembly variations, for example, the uncertainty supporting loads produced during assembly.11,12 Cheng et al. 13 and Lin and Cheng 14 stated that the traditional optomechanical tolerances scarcely considered the real manufacturing and assembly processes and proposed a novel model of a lens system that integrated the relevant variations determined by manufacturing. Traditional tolerance analyses usually rely upon rigid body assumption for all components. However, there is considerable deformation of the lens after assembly, which can significantly degrade optical performance. Dimensional tolerance of such compliant assemblies is extensively studied, for example, sheet metal assemblies in the automotive and aerospace industries. 15 As for the lens assembly, dimensional and assembly variables (e.g. geometric parameters, location, tilt) induce rigid body displacements that can be compensated or corrected by kinematic adjustments, while supporting loads cause lens distortion and further introduce wave front error that cannot be compensated. Thus, distortion of the lens is paid more attention by the large-aperture lens designer. This article mainly concerns about the deformed surface shape caused by the nonuniform supporting loads during assembly process without considering the other errors.
Supporting loads of a lens produced by multiple flexure mounts are difficult to be identical because of various uncertainties during assembly process, such as human operation and tool resolution. The nonuniform supporting loads may generate asymmetric distortion of the lens, which induces additional wave front error into the lens system. Peak-to-valley (PV) and root-mean-square (RMS) values are typically used to quantify a discrete set of surface displacements, and Zernike polynomials are used to interpret the surface data, whose terms are related to the classical Seidel aberrations. The optical performance responses, such as surface PV, RMS, and Zernike coefficients, are discussed to explore the influence of the uncertainty supporting loads on optical performance through finite element analysis (FEA). Su et al. 2 investigated the distortion of a square optical element with the nonuniformity and asymmetry axis loads in each edge contacted with steel frame, and the resultant surface deformation is varied in the submicron region. In practice, the uncertainty supporting loads, caused by flexure mounts during assembly process, are worse than the above axial loads. Genberg et al. 16 utilized Monte Carlo technique to determine mount flatness tolerances based on the optical requirement of mirror surface RMS and Zernike coefficients, which is embedded in the SigFit software (developed by Sigmadyne Inc., New York, USA). Genberg calculated the surface deformation caused by geometrical displacement but did not refer the stochastic properties of the surface deformation with uncertainty mechanical loads after assembly. Youngworth 17 emphasized the stochastic nature of tolerance, investigated further intuition of the optical performance statistics, and advanced to lose optical tolerance for manufacture.
The uncertainty of supporting loads determined by assembly process becomes a primary issue to align flexure mounts in a lens assembly for achieving high-precision optical performance. This article focuses on the optical performance of a lens with respect to the surface deformation under uncertainty supporting loads during assembly process. A Monte Carlo analysis is proposed and can be used to determine the critical load level of supporting loads within specific optical performance requirement. The nonuniform supporting loads are treated as random variables, and the optical performance is researched in a stochastic way. A series of random samples under several defined load levels are generated, Patran Command Language (PCL) is used for repetitive calculation of FE model with random sample of supporting loads. The optical performance responses, surface PV, RMS, and Zernike coefficients, are calculated by fitting the surface deformation data with the first 37 terms of Fringe Zernike polynomials. The stochastic properties of the optical performance are explored by doing statistical testing, so that the relationship between the optical performance responses and the load levels of uncertainty supporting loads is obtained. As a result, the critical variation range of uncertainty supporting loads can be determined based on Three Sigma theorem with specific optical performance requirement. The obtained results are significant to tolerance appropriately the assembly variables for the precision optical system, and optimize the supporting system.
The article is divided into five sections. Section “Uncertainty in supporting assembly with flexure mounts” discusses the lens mounting configuration and the uncertainty supporting loads produced by flexure mounts during assembly process. Considered nonuniform supporting loads as random variables, a Monte Carlo analysis is illuminated in section “Monte Carlo analysis method.” Section “Case study” gives a case study, the relevant results are discussed. Section “Conclusion” concludes the article.
Uncertainty in supporting assembly with flexure mounts
The most promising mounting configuration utilizes flexure mounts to minimize distortion of a lens due to its gravity, an instance of which is illustrated in Figure 1. The lens is bonded to the barrel at three seats placed 120° apart for a symmetric design by using adhesives. Flexure mounts are added and evenly spaced annularly in a lens barrel to counteract the effects of gravity and reduce the sag of the lens between three seats. Flexure mounts shown in Figure 1 are assembled from blade flexures, bolts, adjustment plates, and so on. Blade flexures can be adjusted by applying appropriate preload and deformed within a desired fraction under lens gravitational load, so that the tip of blade flexure becomes coplanar with three seats. Ultimately, the bottom surface of the lens is contacted with the tips of blade flexures and fixed on the seats. The calculation of the lens deformation is based on the following simplifying assumptions:
The surfaces of the lens are perfectly spherical in initial state.
Dimensional variations of all components are not included, and the supporting loads of the lens are mainly determined by the assembly uncertainty, for example, the uncertainty supporting loads caused by human operation and tool resolution.
Constrains are used as three seats are not included in the lens model, and vertical loads are considered when flexure mounts are not modeled. The reason is that the contact areas between the lens and the adhesive and blade flexures being very small, the contact stresses only effect local displacement of the lens.
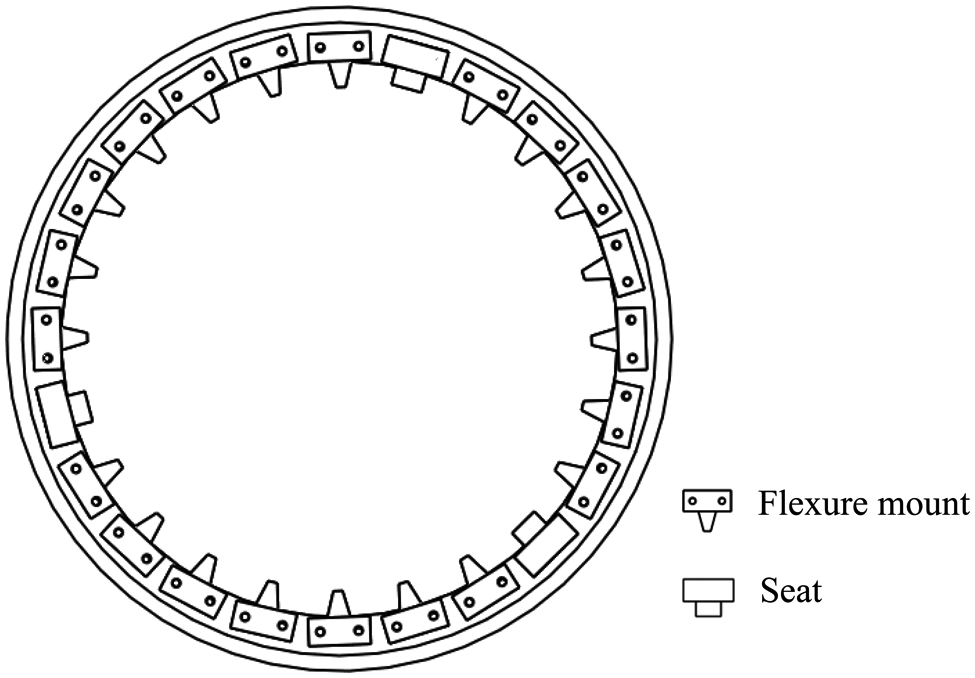
The sketch of a lens mounting assembly.
Theoretically, the weight of the lens is carried equally by all seats and flexure mounts. Supposing the supporting load of flexure mount is
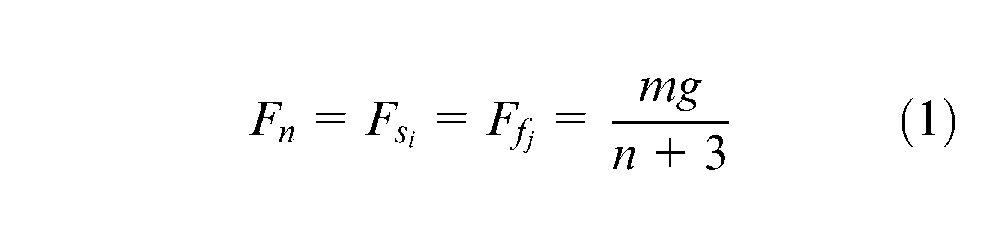
where
The supporting loads
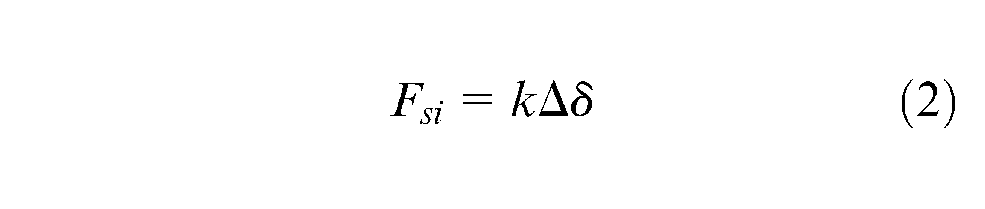
where
In practice, the supporting loads of a lens produced by flexure mounts can be hardly measured and generally evaluated from the preload or the displacement of the flexure mounts during assembly. For example, the preload of the bolt applied by assembler with a torque wrench is shown in Figure 1. Because of various uncertainties during assembly process, such as human operation and tool resolution, the supporting force
The reaction force
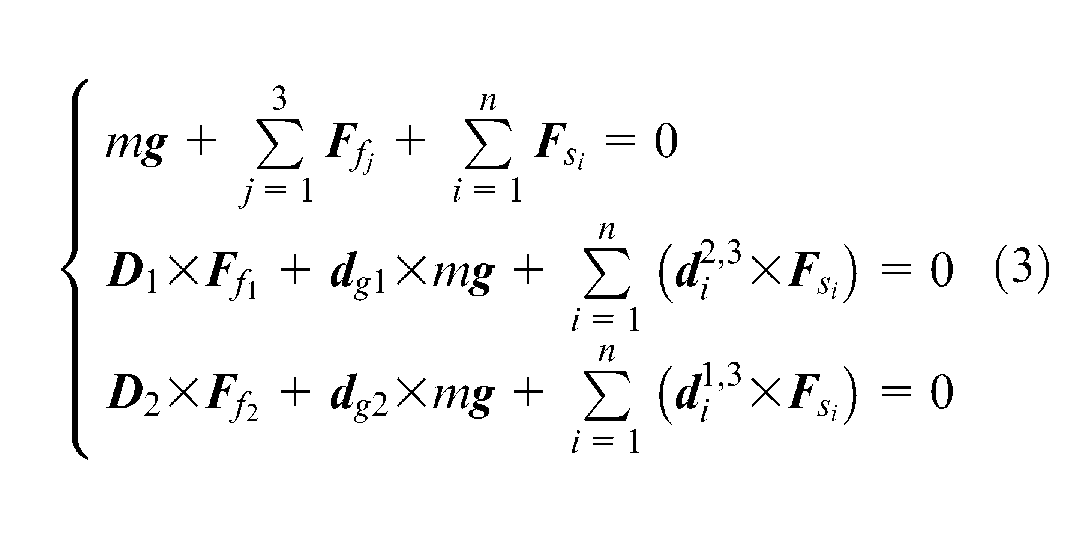
where
Monte Carlo analysis method
The supporting loads can decrease wave front error caused by lens gravitational deformation, but its uncertainty also results in considerable variations to the optical performance. According to the specific requirements of the surface deformation of the lens after assembly, it is needed to explore the effects of the uncertainty supporting loads on the optical performance and to determine its critical variation range. The nonuniform supporting loads are considered as random variables in this study. The proposed Monte Carlo analysis method is carried out according to the following six steps detailed in this section.
Generate random supporting loads under the defined load levels.
Calculate the displacements of the lens surface through FEA with random samples of supporting loads.
Perform Zernike fitting for surface displacement data and calculate the corresponding optical performance responses.
Conduct statistical testing of the optical performance response under each load level.
Predict optical quality with specific optical performance requirement.
Determine critical variation range of the supporting loads based on Three Sigma theorem.
A lens supported by 21 flexure mounts and three seats, as shown in Figure 1, is taken as an example to illuminate the proposed analysis method.
Random sample generation for uncertainty supporting loads
The ergonomics with statistical method can be utilized to obtain the stochastic properties of the supporting loads produced by flexure mounts during assembly, which are assumed to be uniformly distributed in this study. Variation factor p is defined to represent the deviation of the supporting load
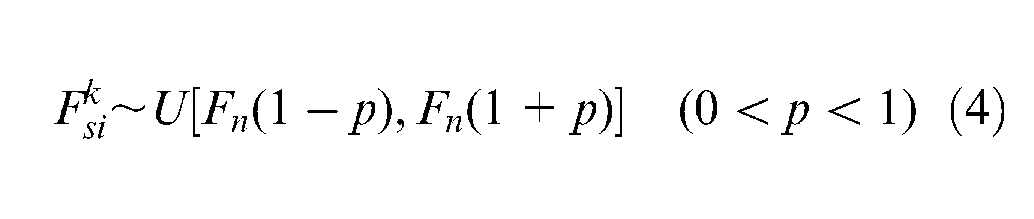
where
Random samples of the supporting loads at each load level are generated by using the congruential method
18
implemented in MATLAB. The following recursive relationship is utilized to produce a sequence of integers,
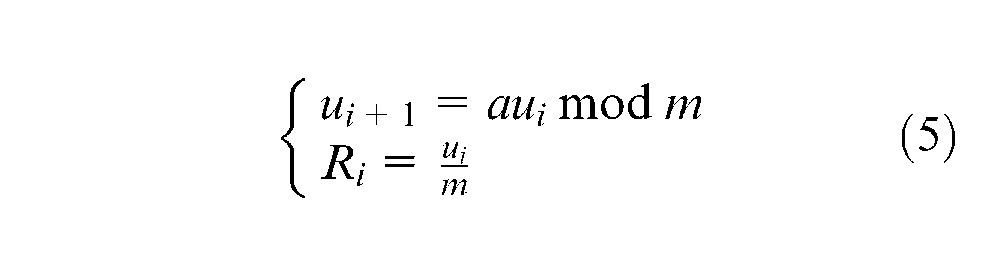
where
The pseudorandom numbers are converted to random numbers to simulate the supporting loads in
FE model setup and surface deformation calculation
The lens is meshed with radial grids to achieve better orthogonality in deformation data than irregular automesh. The seats and flexure mounts are not modeled to simplify FE calculation. All degrees of freedom of the nodes where three seats are located are constrained, and the nodes where the tips of blade flexures are located are applied on vertical random supporting loads generated as in section “Random sample generation for uncertainty supporting loads.” They are reasonable because the contact areas between the lens and the adhesive and blade flexure are very small. FE model is shown in Figure 2. PCL is used for repetitive calculation of FE model with every set of random samples and to access NASTRAN database to gain lens surface displacement data.
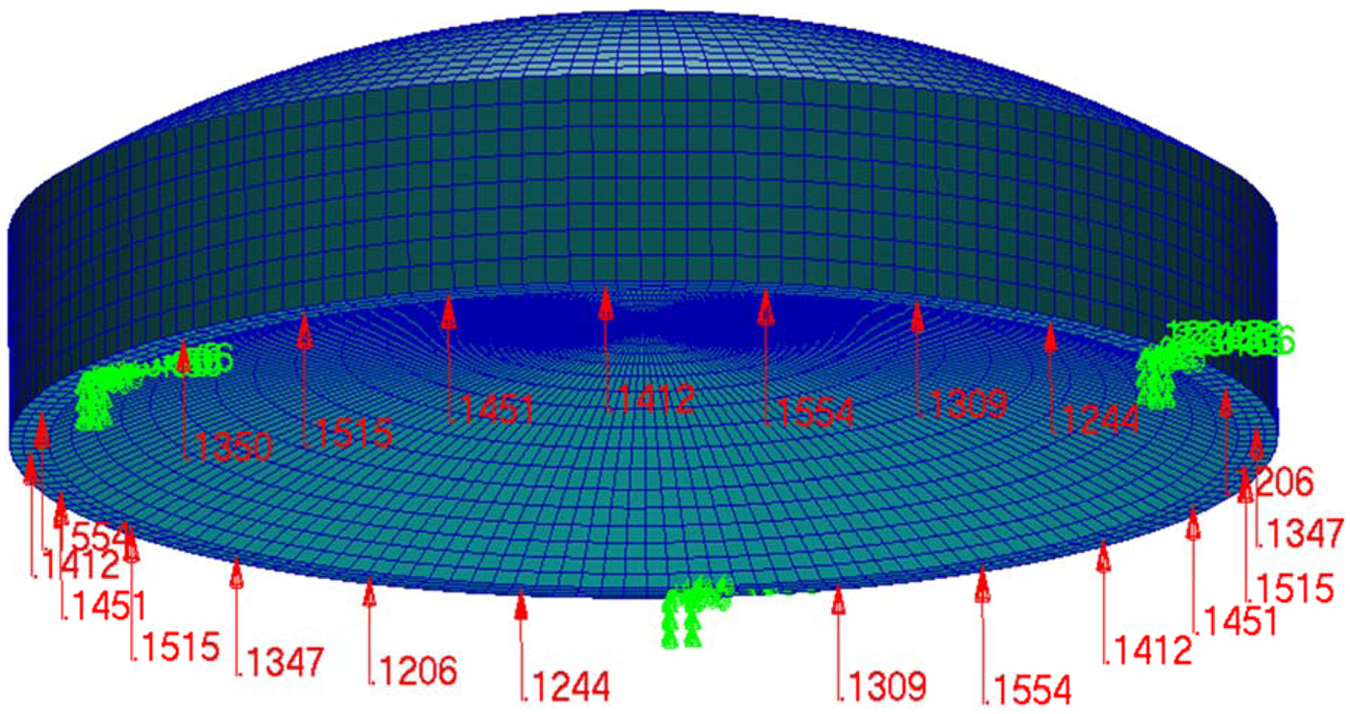
FE model of the lens applied with random supporting loads.
Optical performance response calculation
It is difficult to directly measure the degradation of the optical performance by the surface deformation data from the NASTRAN. Zernike polynomials are usually used to represent FEA deformations of the lens surface, 19 so that the optical performance responses under different load level, such as surface PV and RMS and Zernike coefficients, can be calculated.
The surface deformations include the rigid body motion and higher order surface deformation. Because the rigid body motion can be corrected by the active control or compensating elements, the higher order surface deformation and its stochastic properties are discussed in this study. The homogeneous coordinate transformation and the least square method are used to remove the rigid body motion from the deformation data, and the least square method is also used to fit Zernike coefficients based on the sag displacement. 5 A computer program is developed in MATLAB to fit the first 37 terms of Fringe Zernike polynomials for every set of surface deformation data. Therefore, the optical performance responses under different load levels of uncertainty supporting loads are calculated.
Statistical testing of optical performance responses
Statistical testing is applied to explore the stochastic properties of optical performance responses under the same load level of uncertainty supporting load by using MATLAB’s statistics toolbox. Kolmogorov–Smirnov test is performed to check the tested distribution function with significance level of 0.05. 20 Several kinds of statistical distributions, such as Normal distribution and Gamma distribution, are used for parametric estimation, and Gaussian kernel function is used for nonparametric estimation. As a result, the relationship between the optical performance responses and the load levels is established. It is primary to evaluate the optical performance with respect to the uncertainty supporting load as well as to determine the critical load level with specific optical performance requirement.
The effect of uncertainty supporting loads on optical performance
According to specific optical performance requirement, the performance evaluation function related with the optical performance response can be established. Taking a lens of wavelength 193 nm as an example, additional surface deformation of the lens should be less than λ = 0.01, caused by uncertainty supporting loads; that is, the surface PV should be less than 1.93 nm compared with the surface PV caused by the uniform supporting load
Based on the statistical distributions and their parameters obtained in section “Statistical testing of optical performance responses,” the probability that the optical performance response at different load levels satisfies the performance evaluation function can be estimated by using Monte Carlo simulation. As a result, the optical performance is related to the load level of uncertainty supporting loads in a statistical way.
Determination of the critical variation range for the supporting loads
The statistical basis of product quality, such as Three Sigma theorem, demands that the optical performance is 99.7% good. According to the relationship between the optical performance responses and the load levels of uncertainty supporting loads, the optical performance responses of 3 standard deviations of the mean can be obtained. Consequently, polynomial fitting is utilized to get the critical load level with the required optical performance responses of 3 standard deviations of the mean, as well as the variation range of the supporting loads to align flexure mounts.
Case study
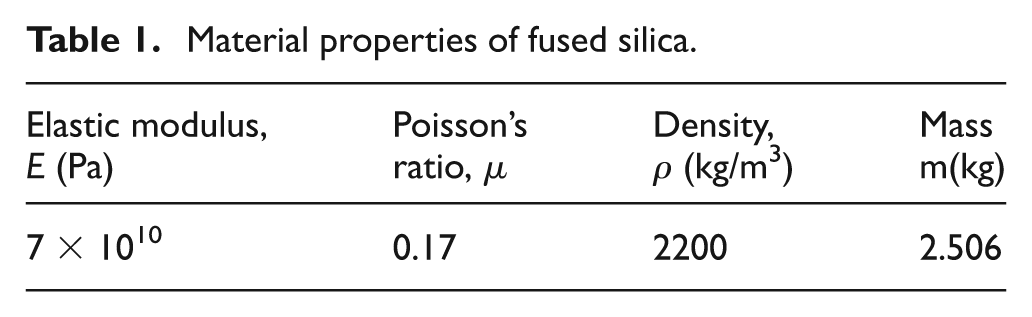
The example lens is made up of fused silica, and its aperture is 200 mm, which can be utilized for 193 nm exposure system in semiconductor lithography. The geometry and dimension are shown in Figure 3, and the material properties of fused silica are given in Table 1. The lens is supported by 21 flexure mounts and three seats, as shown in Figure 1. The lens with 193 nm wavelength requires that additional surface deformation should be less than λ = 0.01 caused by uncertainty supporting loads after assembly. The surface PV with the uniform supporting loads is 14.24 nm and should be less than 16.17 nm with the nonuniform supporting loads. The proposed Monte Carlo analysis is performed to learn the stochastic properties of the optical performance of the lens under uncertainty supporting loads and to determine the critical load level of supporting loads within the required surface PV. The analysis process and relevant results are illustrated in this section.
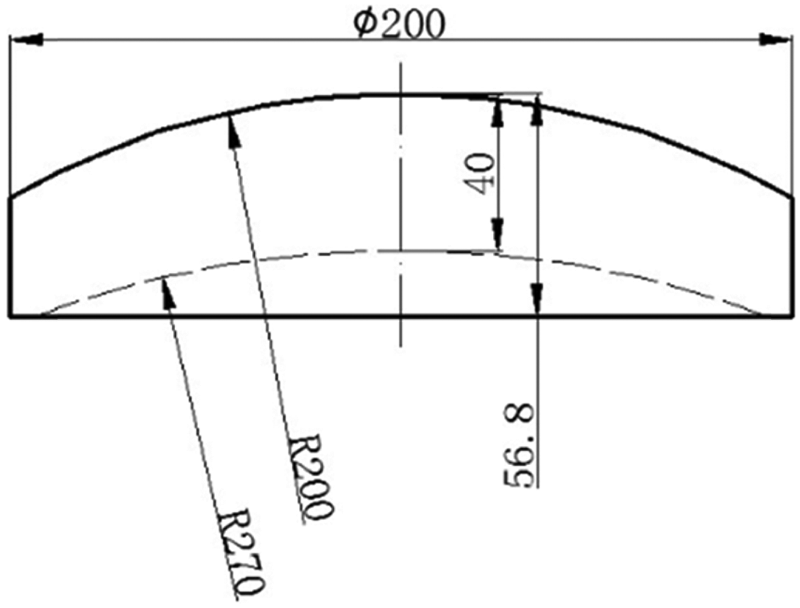
The geometry and dimension of the example lens.
Material properties of fused silica.
Random samples with different load levels for uncertainty supporting loads
Supposed there are five load levels of supporting loads
The variation range of supporting loads at each load level.
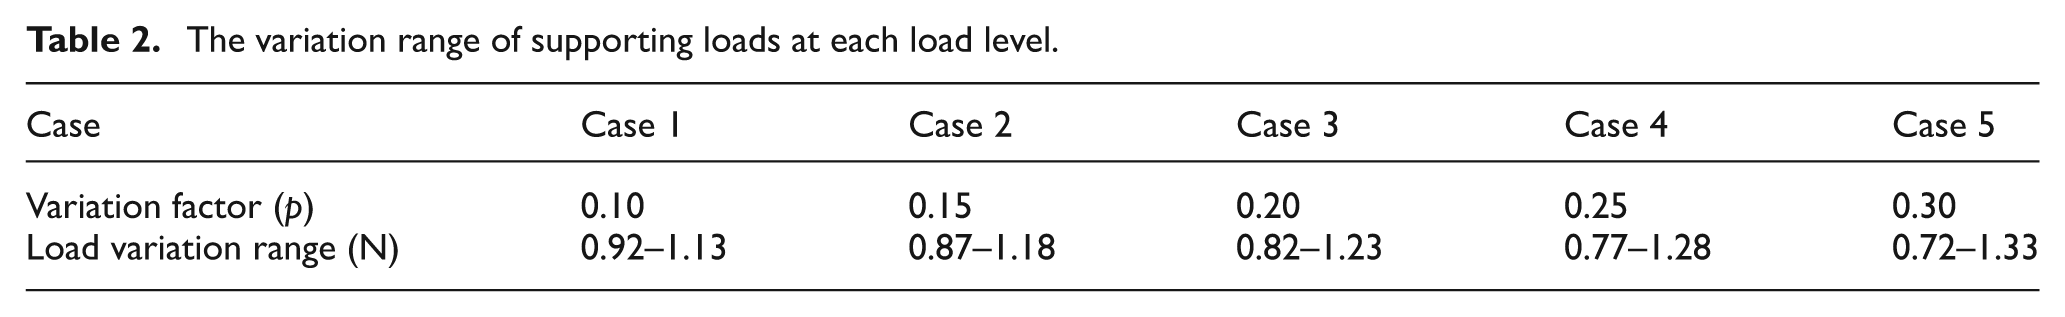
Each set of random samples
The optical performance responses under different load levels
FE model with radial grids has 28,224 elements, as shown in Figure 2. The surface deformation of the lens can be obtained by FEA with NASTRAN, only the top surface deformation is discussed in this study. Figure 4 shows the cloud picture and contour map of the deformed surface with one set of random supporting loads. It can be seen that the deformation at the edge of the lens is large and uneven because of the nonuniform supporting loads.
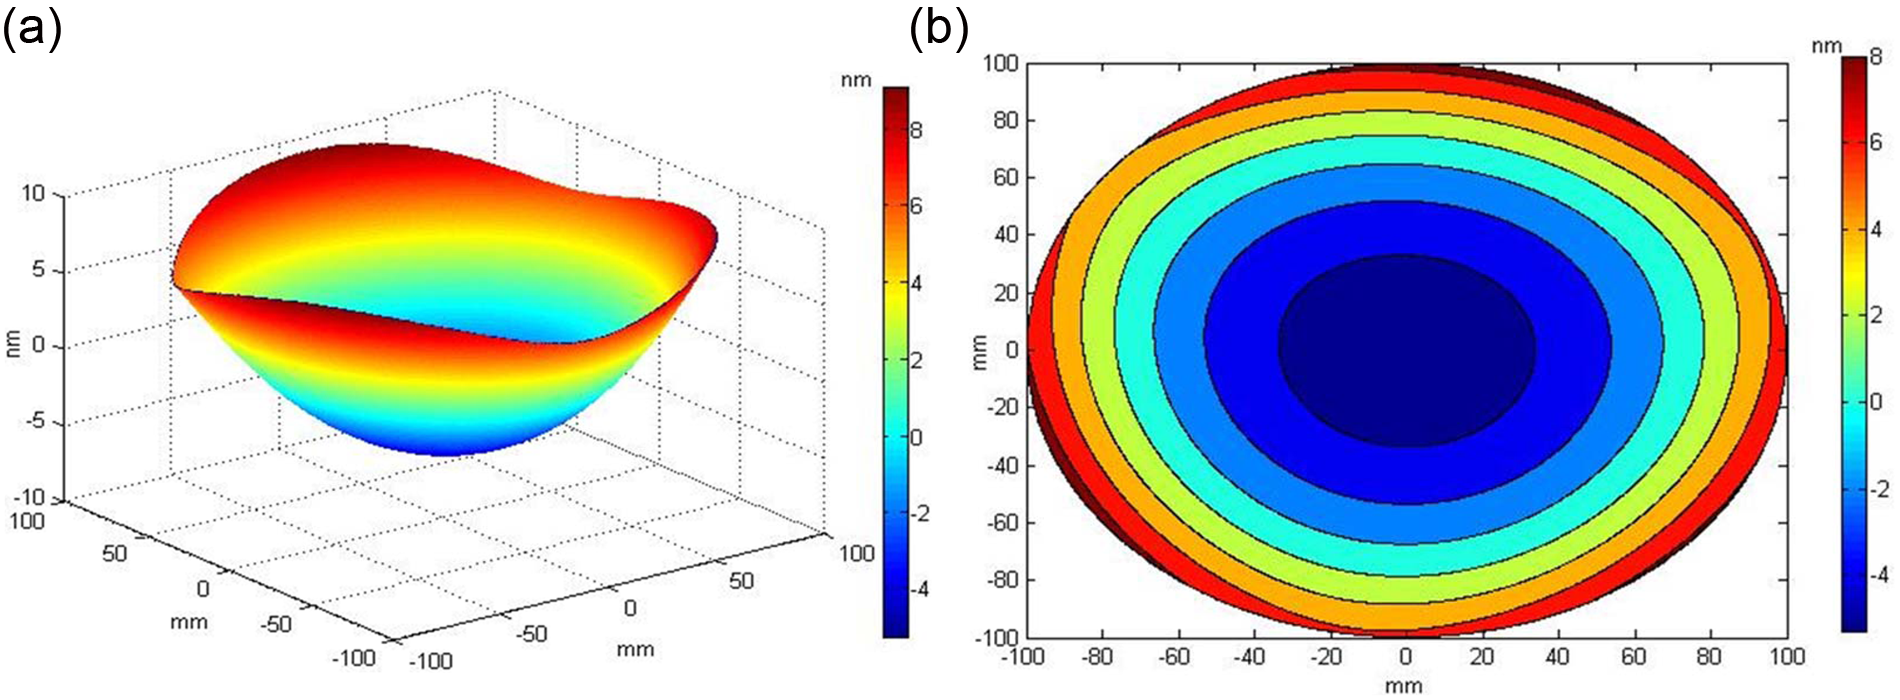
The top surface deformation of one simulation: (a) cloud picture and (b) the contour map.
Zernike fitting is performed, and the optical performance response, such as surface PV and RMS and Zernike coefficients, are obtained by implementing in MATLAB. Figure 5 shows 100 surface PV and RMS values at each load level; it can be seen that the scatter range is increased as the nonuniformity is aggravated from Case 1 to Case 5. Statistical testing is then performed to learn more about stochastic properties of the optical performance responses under different load levels.
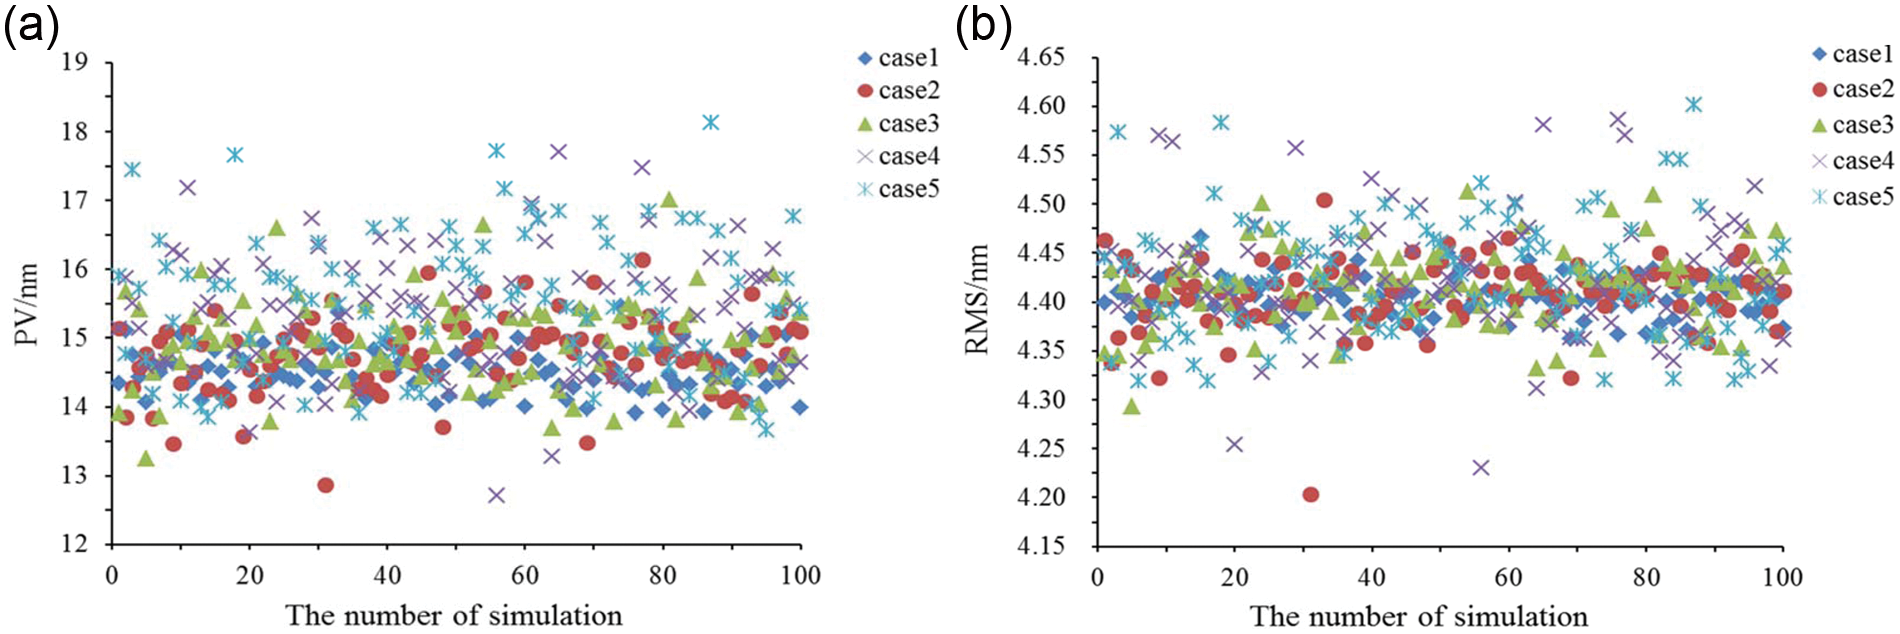
The resulting PV and RMS of the top surface: (a) surface PV and (b) surface RMS.
The stochastic properties of surface PV under different load levels
Statistical testing is performed to learn stochastic properties of the 100 obtained surface PV values under different load levels, and Kolmogorov–Smirnov test is performed to check the tested distribution. The distribution function histogram of surface displacements and the fitted distribution function from parametric and nonparametric estimation are shown in Figure 6, and the related distribution parameters are listed in Table 3. P is the least significance level to reject the tested distribution.
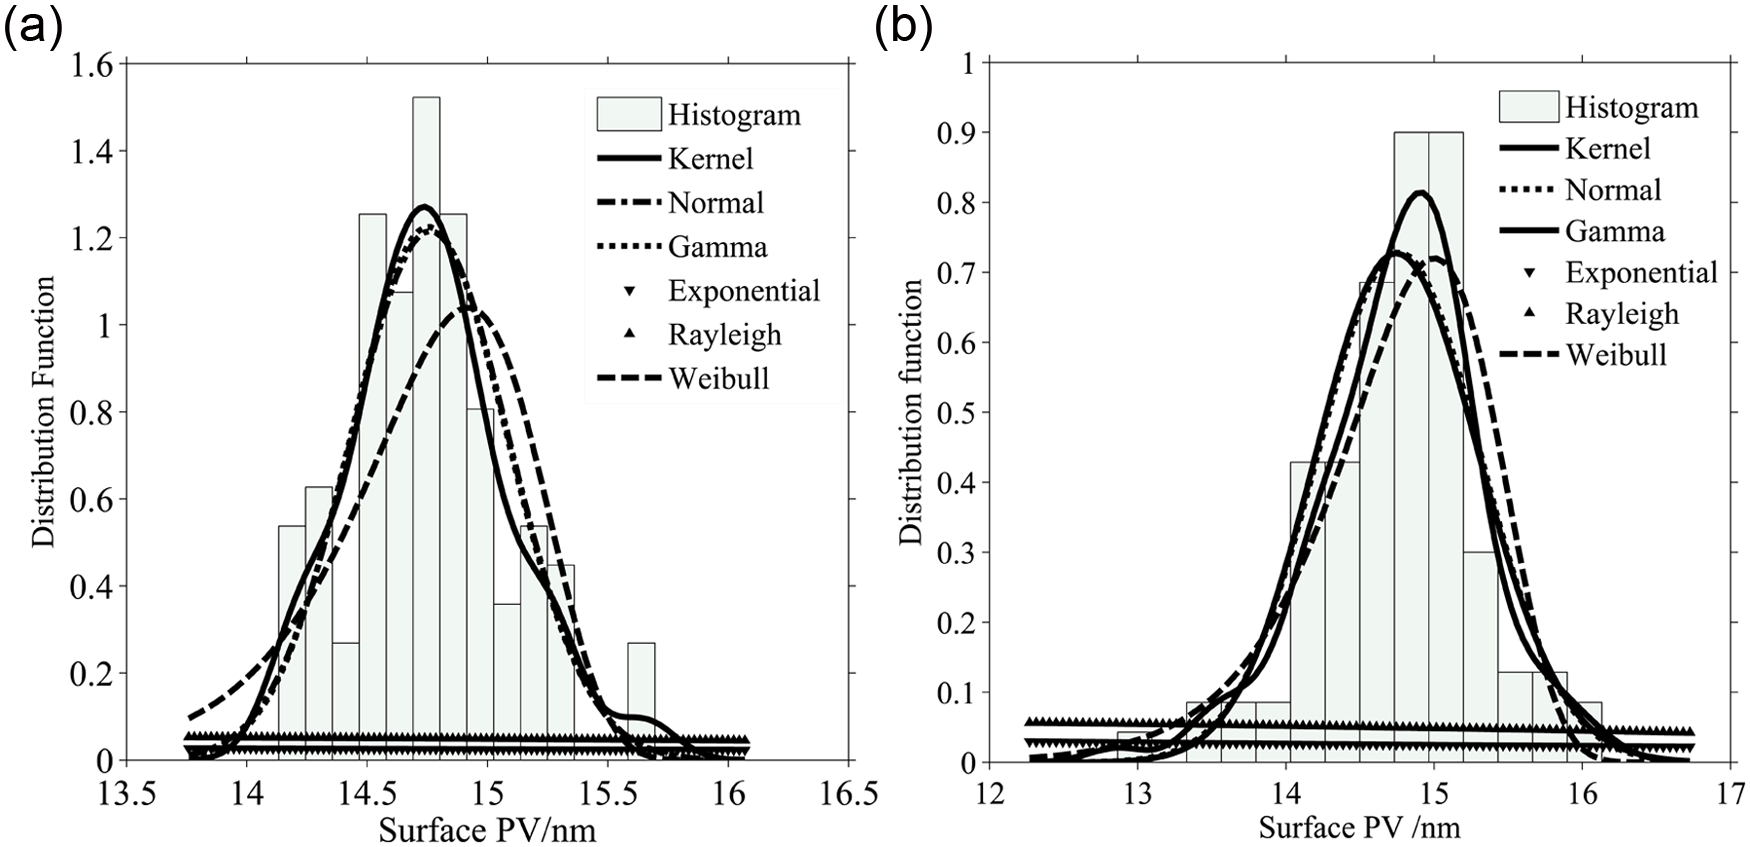
Distribution estimations of the top surface PV under (a) Case 1 and (b) Case 2.
Distribution estimation and hypothesis testing results of top surface PV.
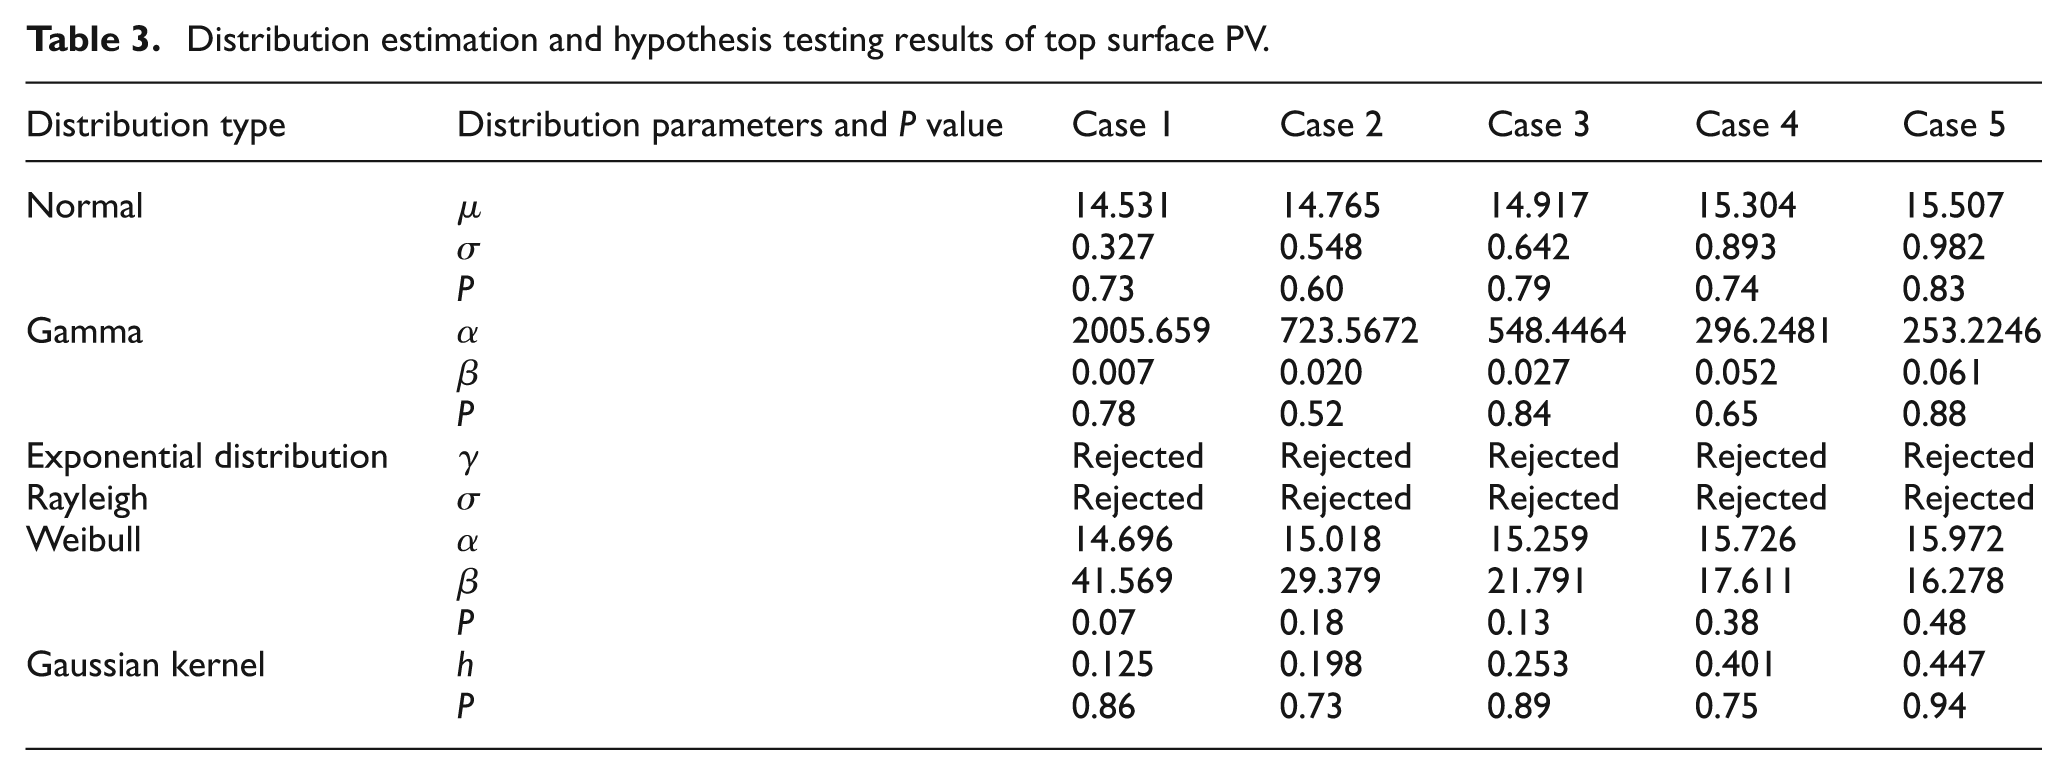
From Table 3, it is indicated that Gaussian kernel function of the nonparametric estimation is the best estimation, followed by Gamma and Normal distributions. The following is noted
From the parameters of Normal distribution, it is clear that both the mean
From the parameters of Gamma distribution, the shape parameter
From the kernel nonparametric estimation results, the optimal bandwidth
The above parameter variations of the tested distribution agree with the appearance of 100 surface PV in Figure 7. Because Normal distribution is commonly used throughout statistics, the surface PV is assumed to follow Normal distribution in the following analysis. The 90 percentile of the surface PV can be calculated based on the obtained Normal distribution function as given in Table 4. It is also obtained that the variation range of the surface PV become larger as the load level is increased. So far, the relationship between the surface PV and the load level is learned and can be used to evaluate the optical performance with specific optical performance requirement.
The top surface PV at 90 percentile.
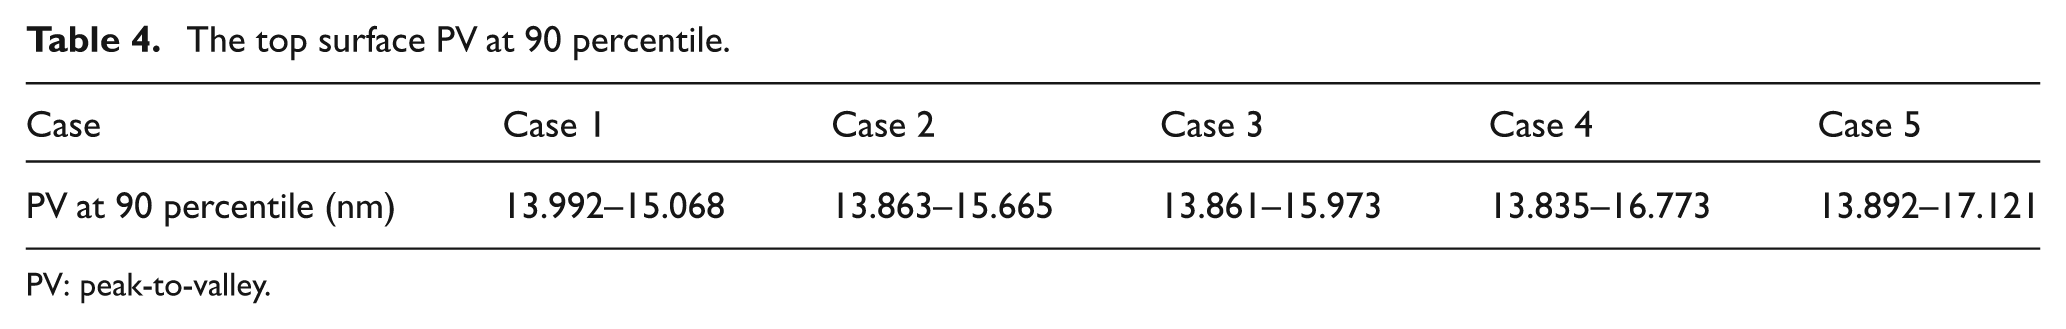
PV: peak-to-valley.
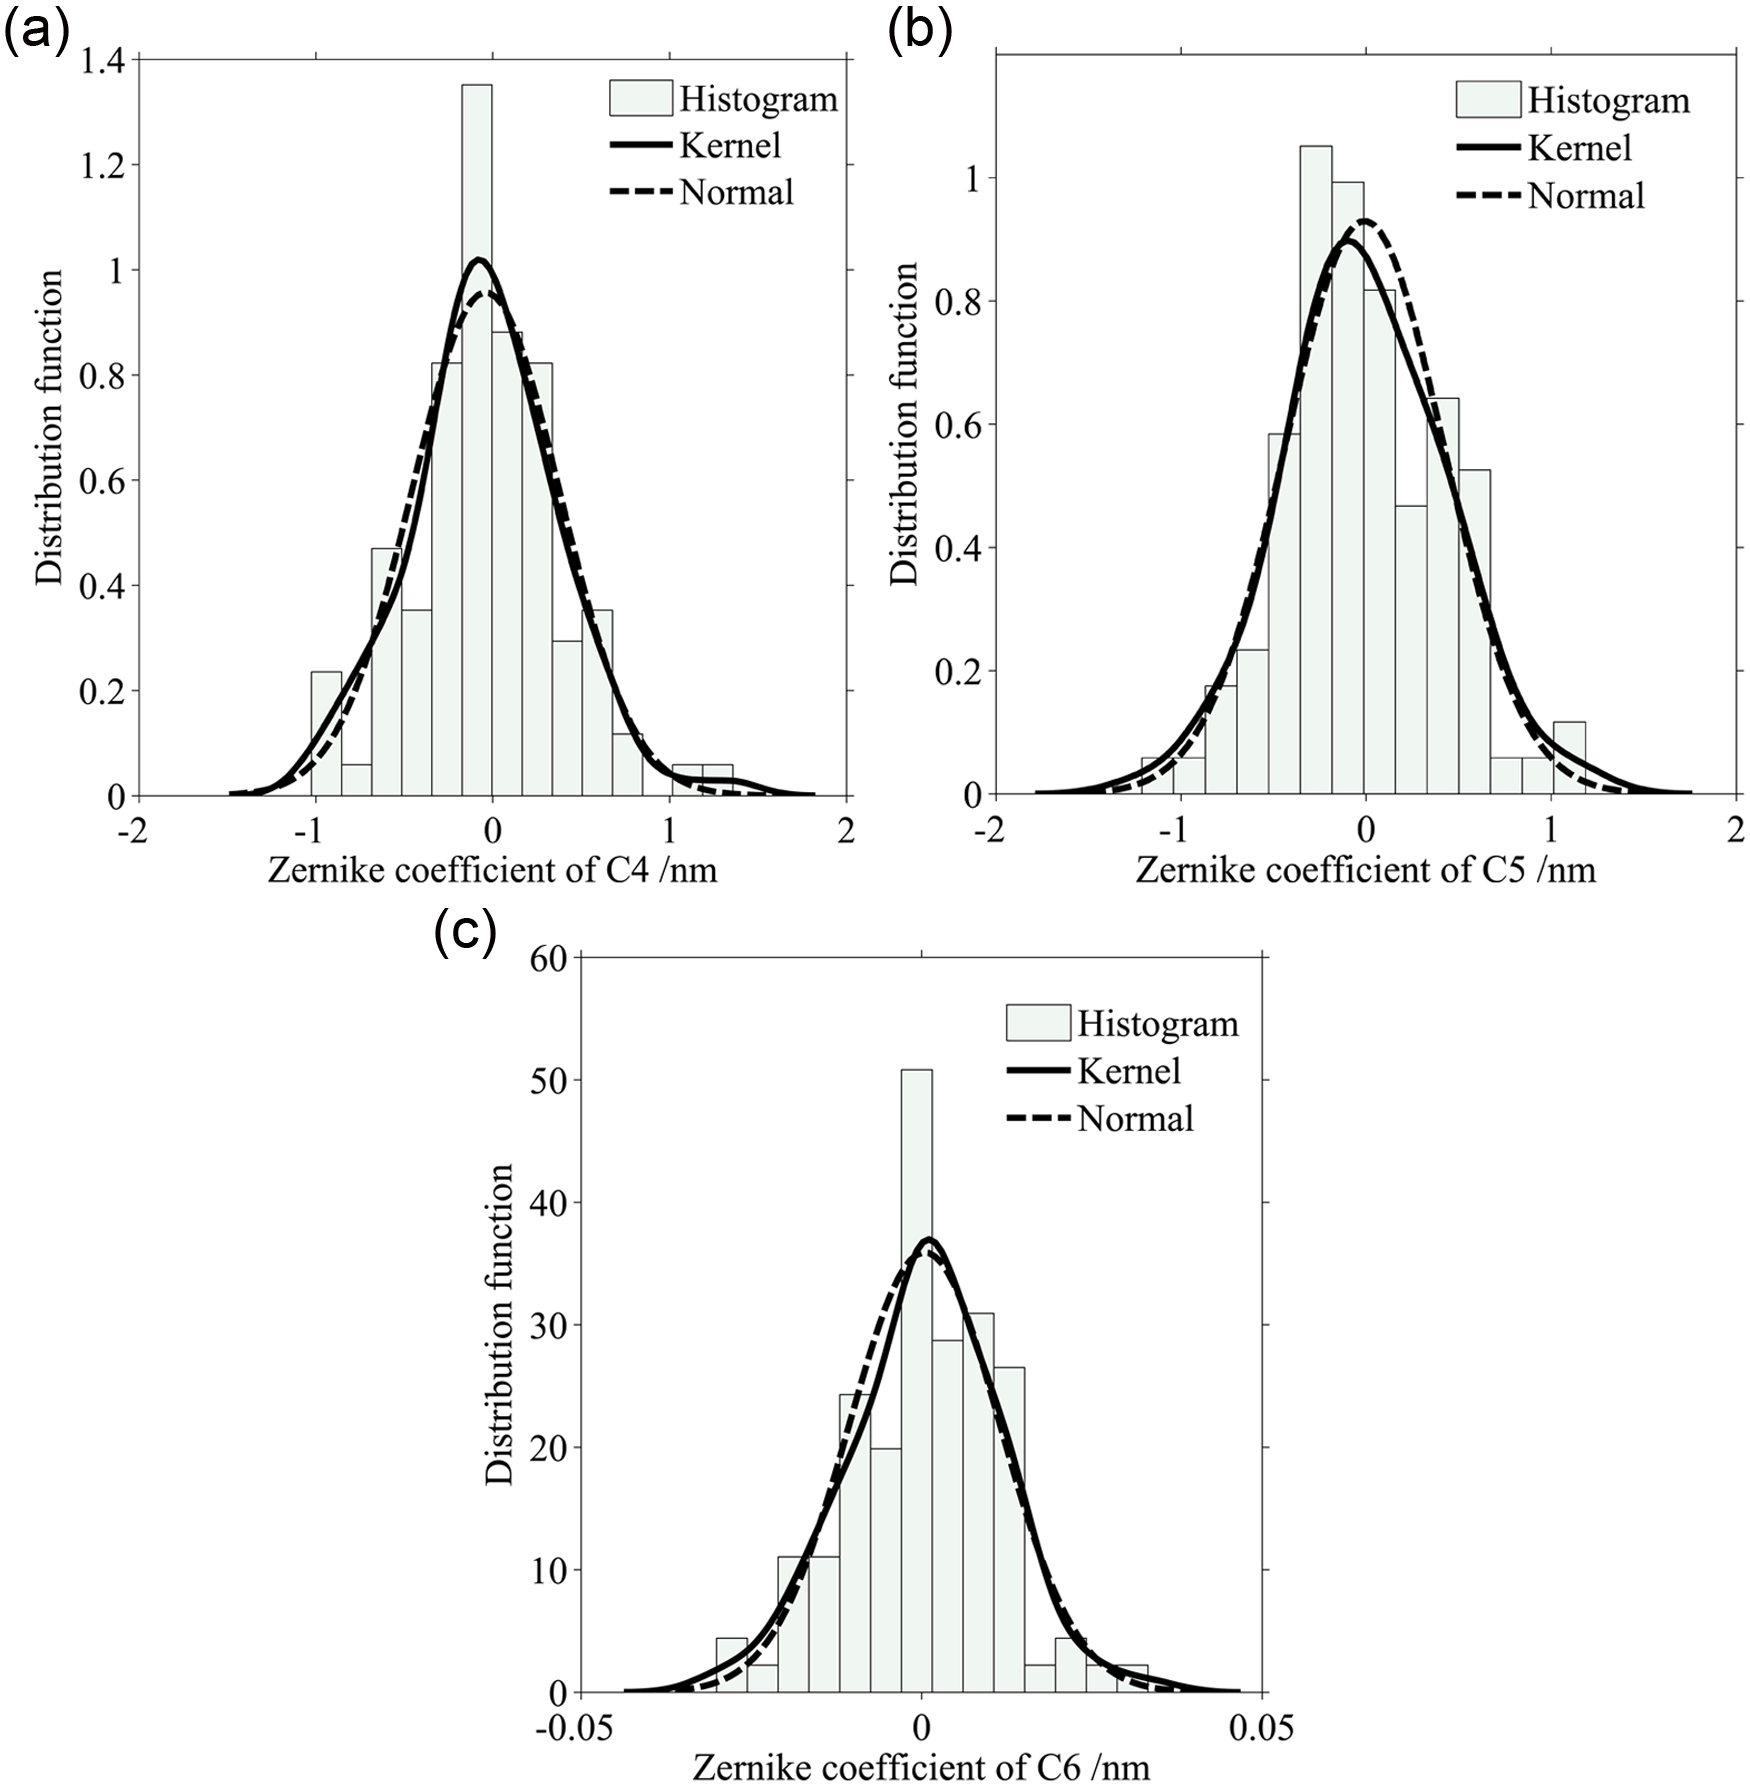
The distribution estimation of the Zernike coefficients under Case 2: (a) distribution estimation of
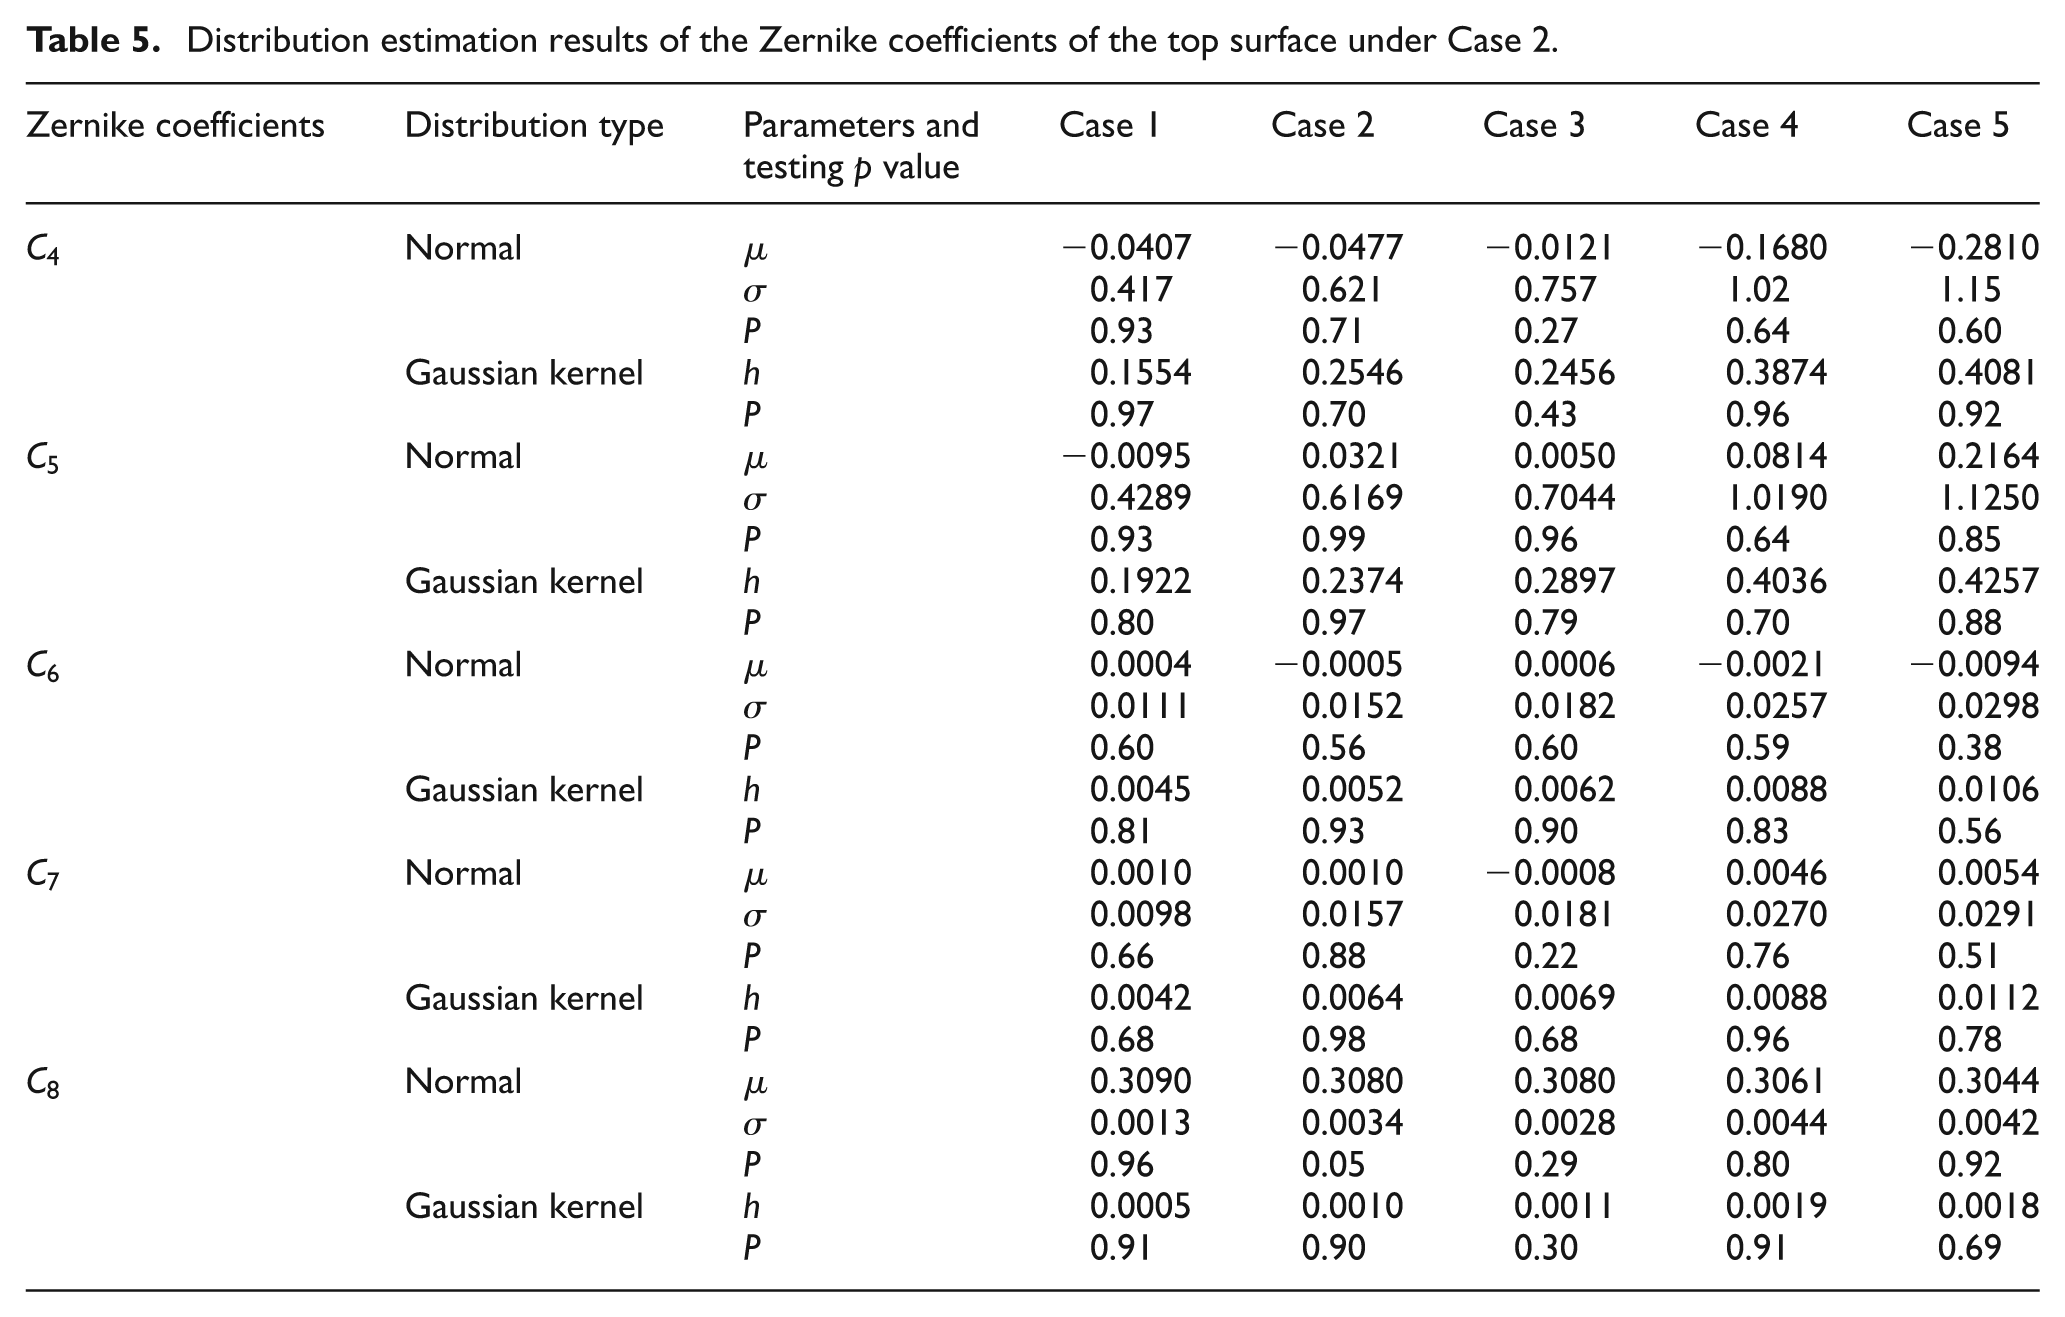
The stochastic properties of Zernike coefficients under different load levels
The low-order coefficients of Zernike polynomials are related with primary optical aberration. The terms from
Distribution estimation results of the Zernike coefficients of the top surface under Case 2.
The critical variation range of supporting load
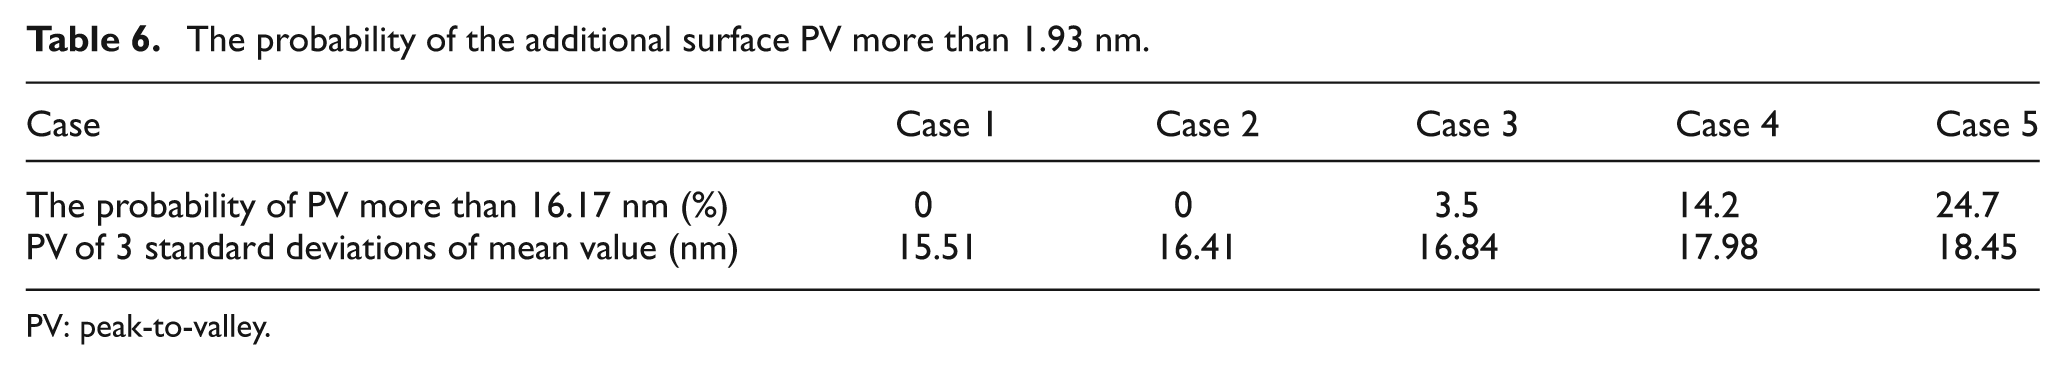
The critical load level of supporting loads is important to align flexure mounts by assemblers. With the required surface PV of the example lens, the critical load level of supporting loads for flexure mounts can be determined based on the obtained relationship between the surface PV and the load level in section “The stochastic properties of surface PV under different load levels.” A total of 1000 random samples followed by a Normal distribution for each load level are generated, and the probability of the surface PV more than 16.17 nm is calculated, as listed in Table 6. The table indicates that the load level should be more than 0.15 and less than 0.20.
The probability of the additional surface PV more than 1.93 nm.
PV: peak-to-valley.
Based on Three Sigma theorem, polynomial fitting is utilized to get the critical load level. The surface PV of 3 standard deviations of the mean can be calculated from the obtained Normal distribution function in section “The stochastic properties of surface PV under different load levels,” as given in Table 6. Polynomial fitting to such PV and the load levels is performed, and the critical load level corresponding to the required surface PV of 16.17 nm of 3 standard deviations of the mean can be obtained.
By doing polynomial fitting, it is determined that the critical load level is 0.152, namely, the critical variation range of supporting loads of flexure mounts can be varied from 0.86 to 1.18 N based on equation (5). As a result, the critical variation range of the supporting loads is obtained. These results are significant to tolerance the lens assembly and to optimize the design of flexure mount.
In order to verify the critical variation range of supporting loads, the critical load level 0.152 is used to perform the above analysis again. The mean of the surface PV at load level 0.152 is 14.61 nm, its variance is 0.51, and P value is 0.92, which satisfy the requirement of Three Sigma theorem.
Conclusion
A Monte Carlo analysis method is proposed to relate the optical performance of a lens system to the uncertainty supporting loads produced by flexure mounts during assembly. FEA is utilized to calculate the surface deformation, the first 37 terms of Fringe Zernike polynomials are obtained by least square fitting. By doing FEA and Zernike fitting, the optical performance responses, surface PV and RMS and Zernike coefficients, are calculated under random samples of the uncertainty supporting loads. Parameter and nonparametric estimation of such optical performance responses are applied to explore their stochastic properties, and the tested distribution functions are verified by Kolmogorov–Smirnov testing. As a result, the relationship between the optical performance response and the load level of the uncertainty supporting loads is established in a statistical way and can be used to determine the critical load variation with specific optical performance requirement based on Three Sigma theorem. The results of a case study show that Gamma distribution function is best fitted for the surface PV, and Normal distribution function is best fitted for low-order Zernike coefficients. Gaussian kernel function of the nonparametric estimation is well fitted for both the surface PV and the lower order Zernike coefficients. The critical variation range of uncertainty supporting loads is from 0.86 to 1.18 N within the required surface PV to align flexure mounts during assembly. The results can be used to assign appropriate tolerance of flexure mounts during assembly and to optimize the supporting system of a high-precision optical system.
Footnotes
Declaration of conflicting interests
The authors declare that there is no conflict of interest.
Funding
This work was partially supported by the Major State Basic Research Development Program of China (973 Program) (grant number 2009CB724205).