
Abstract
In this work, an analytical model for transient temperature distribution during submerged arc welding for joining two steel plates is presented. The conservation of energy equation is used to represent the thermal behaviour of the submerged arc welding process. A three-dimensional double-paraboloid shape for volumetric heat source with Gaussian distribution is considered for electric arc during welding, and a parabolic-shaped cross section for the weld pool is considered. A set of experiments is conducted to determine the geometric parameters. The final analytical solution considers effect of the electric arc, convective heat transfer from the exposed surface and heat of molten electrode material. Subsequently, the prediction is compared with experimentally predicted temperatures where a good agreement is found.
Introduction
In arc welding process, the distribution of temperature has a significant impact on residual stress, distortion and strength of a welded structure. Thus, for a superior weld structure, the evolution of temperature during welding is essential and is an emerging research field since last few decades. The mathematical modelling for predicting the temperature during welding is an ever-increasing method as the experimental prediction is very expensive. Among mathematical models, the analytical model is a pioneering route in industry for online monitoring of the process as it requires minimum computational time. Accordingly, this work considers prediction of temperature distribution analytically during submerged arc welding (SAW). The process involves addition of energy in the form of electric arc, deposition of molten electrode material on the workpieces and heat transfer from exposed surface by convection. In an analytical model, the incorporation of all these phenomena is necessary.
In literature, several analytical models are reported by Rosenthal 1 for fusion welding considering point, line and plane heat sources for predicting temperature field during processing. These models considered an infinite temperature at the heat source location, and the material properties are also considered as temperature independent. Eagar and Tsai 2 considered a two-dimensional (2D) Gaussian distribution–based heat source and developed a solution for travelling heat source in a semi-infinite geometry. The conformal technique of mapping is used by Jeong and Cho 3 for prediction of temperature field of a fillet weld analytically. Nguyen et al.4,5 described an analytical solution for transient temperature distribution of a semi-infinite body subjected to three-dimensional (3D) heat density of a semi-ellipsoidal source and a double-ellipsoidal heat source. In the solution, an infinite/semi-infinite heat kernel is applied, which is derived by Image Method. In such a case, a problem of singularity occurs at and around the location of heat source, which implies a difficulty in application of the boundary conditions. The Laplace transform method is used by Roshyara et al. 6 to avoid this problem of singularity and to find a robust approximation of real solution for the temperature field. Winczek 7 developed a model to compute temperature field in a half-infinite body caused by a heat source of changeable direction of motion. The analytical temperature field was predicted by considering an increase in temperature connected to action of the heat source and self-cooling of the area heated up earlier. Moreover, in the case of fusion arc welding, Rykalin and Nikolaev 8 reported that the transient temperature distribution depends on variable thermal properties, latent heat of fusion and pattern of heat distribution. However, incorporation of the latent heat of fusion and convective heat transfer from work surface in an analytical solution is rarely found in the literature. In addition, the temperature distribution also depends on the shape of the heat source. Thus, in this work, an analytical solution is presented considering a paraboloid shape of heat source, latent heat of fusion and convective heat loss. Finally, the estimated temperature is compared with the experimental data.
Experimental prediction
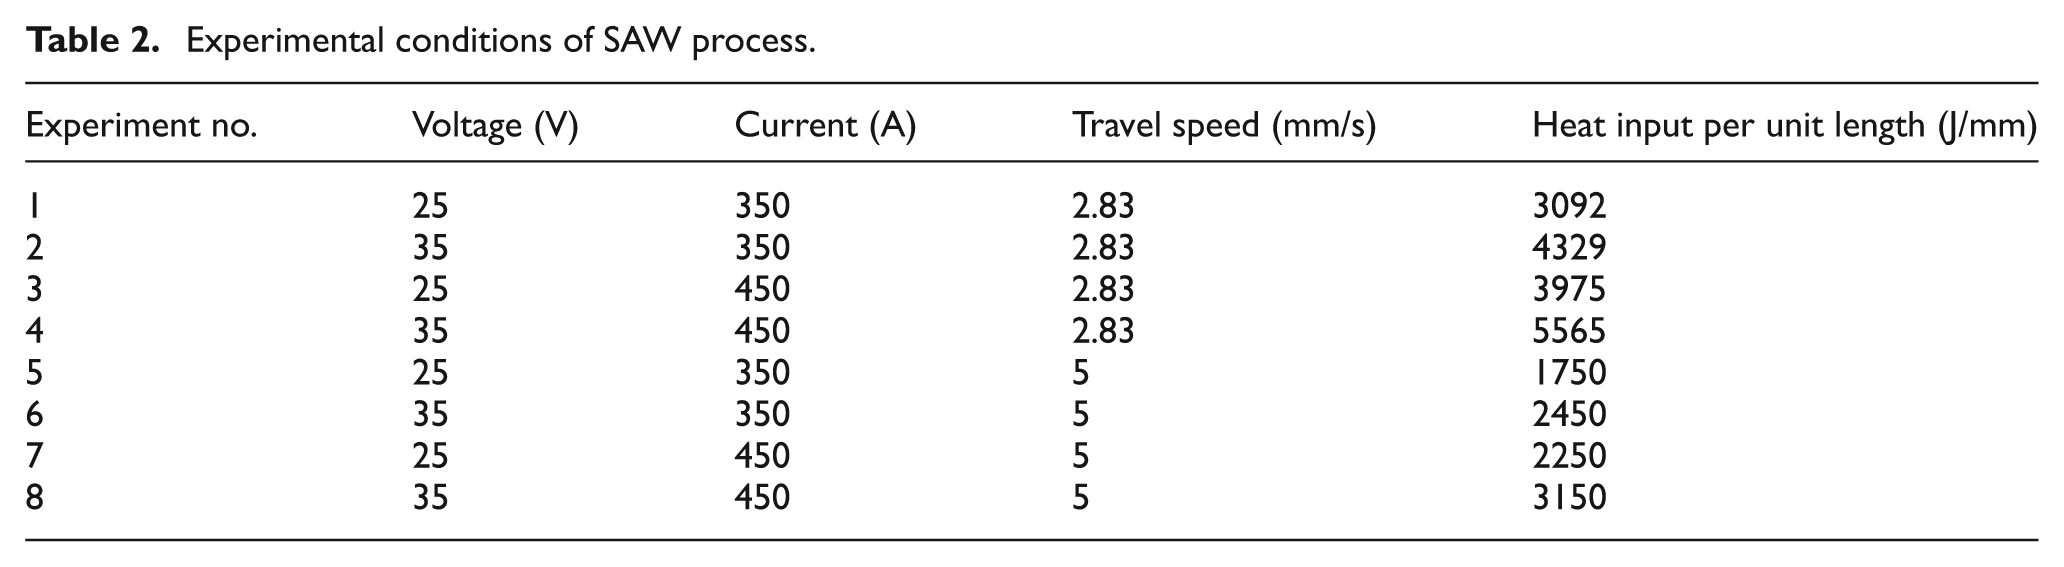
A semi-automatic welding machine with constant voltage and rectifier-type power source of 1200 A capacity is used to join two steel plates of size 30 × 15 × 2 cm3 for each of the plates. The corresponding composition of the steel is given in Table 1. A copper-coated electrode of 0.315 cm diameter in coil form and fluoride type granular flux are used for joining the plates during experiments. The experiments are conducted for three variables: current, voltage and weld speed at two levels (e.g. 350 and 450 A) for each of the variables. Thus, the Taguchi design of matrix consists of a total of 23 numbers of experiments, 9 and the corresponding consideration of the variables is depicted in Table 2. The heat input per unit length for each experiment is also tabulated in Table 2, which is calculated as total power (V×I) divided by the weld speed. Both the workpieces are cut, and a V-groove of 60° angle is prepared keeping 1-mm root opening between the plates. The plates are placed horizontally and firmly fixed on a base plate using clamps. Figure 1 shows a schematic position of the plates where a Cartesian coordinate system is referred. During welding, the electrode is placed perpendicular to the plates and moves along the x-axis. The electrode is connected to a positive terminal, whereas the workpieces remain as negative polarity. Finally, the welding process is carried out similar to a butt joint configuration. The temperature on surface of the work is measured at points P1 (25, 20, 0), P2 (25, 25, 0), P3 (25, 34, 0) and P4 (25, 63, 0) using infrared thermometers (range: 2482 °C, accuracy: ±2 °C and response time: 10 ms). Finally, the measured temperature is compared with analytically predicted temperature.
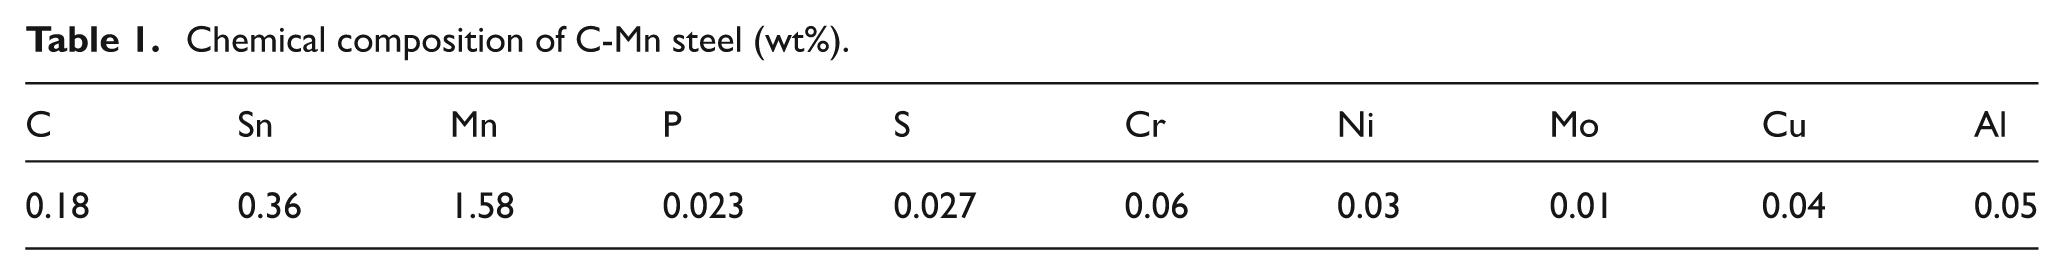
Chemical composition of C-Mn steel (wt%).
Experimental conditions of SAW process.
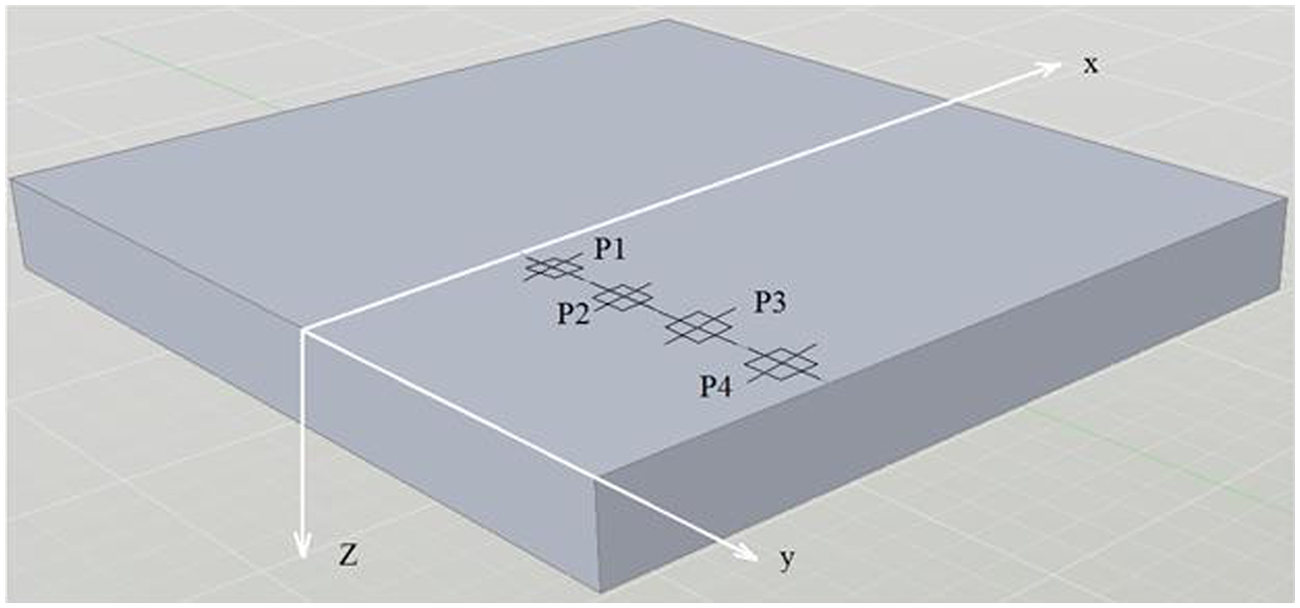
Representation of axes and identification of few points (P1, P2, P3 and P4) where time–temperature cycle is stored during SAW process.
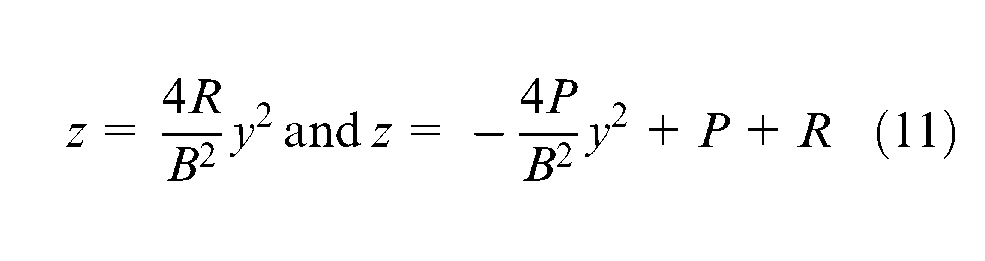
For each experiment, the welded plate is cut at three sections along x-axis to measure the weld dimension. Based on the experiments, consideration of a parabolic shape of weld bead 10 is most suitable. Figure 2 shows a typical shape of cross-sectional geometry of the weld pool where P, R and B indicate penetration, reinforcement height and bead width, respectively. These parameters (P, R and B) represent the dimensions of the weld pool, and the corresponding average values of the penetration, reinforcement height and width of the weld are measured. For all the experiments, the measured dimensions of the weld are presented in Figure 3. Comparing two alternate experiments (e.g. experiment no. 6 and experiment no. 8), it is found that both the penetration (P) and bead width (B) increase with supply current. At a high value of supply current, the weld pool becomes much wider. Subsequently, comparing all the experiments, it is found that the bead width (B) increases with increase in the supply voltage. It is found that the rate of increase in bead width (B) is higher than the rate of increase in depth of penetration (P) with increase in the supply current as well as the voltage. It is noted from the experiments that the variation in reinforcement height (R) is nearly same for all the cases.
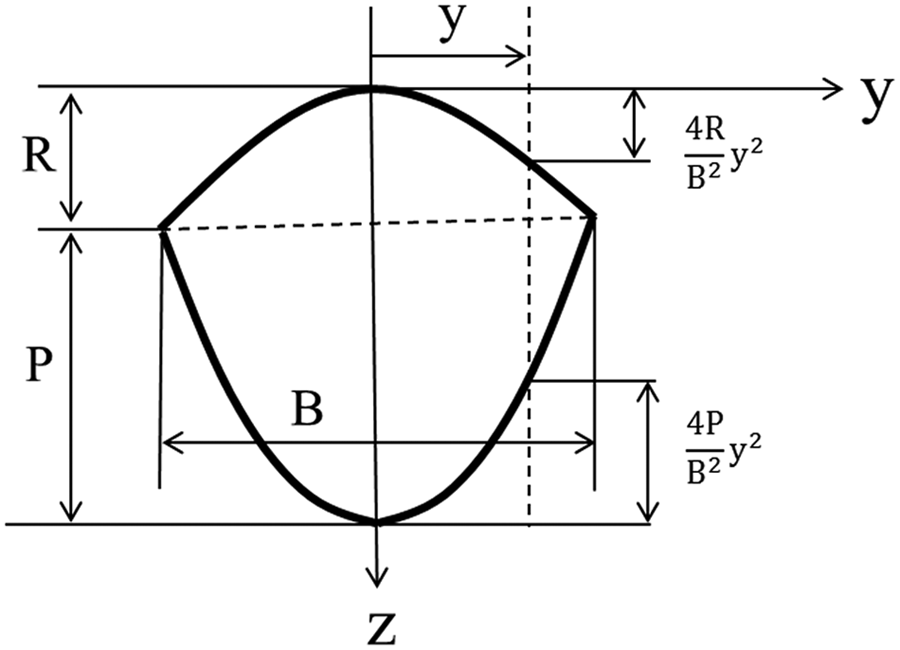
Cross section of the weld geometry.
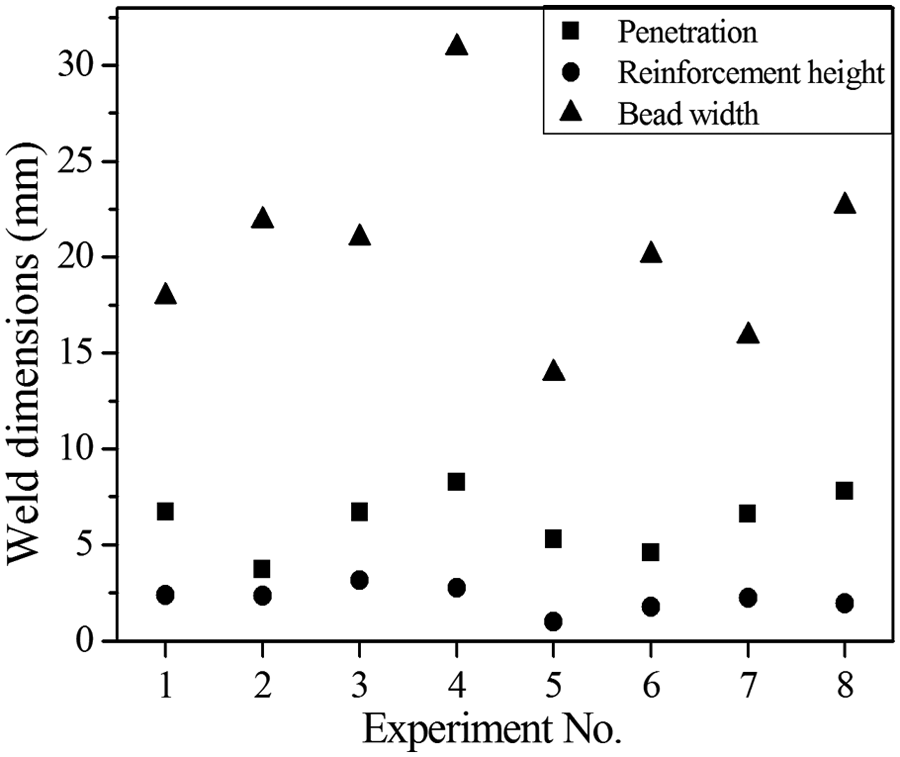
Experimental determination of weld dimensions in SAW process (based on the conditions given in Table 2).
Theoretical prediction
In this work, the conservation of energy equation (equation (1)) is used to represent the thermal behaviour of the SAW process. The corresponding temperature distribution as a function of space and time is obtained analytically from equation (1) in the fixed Cartesian coordinate system (x, y, z)
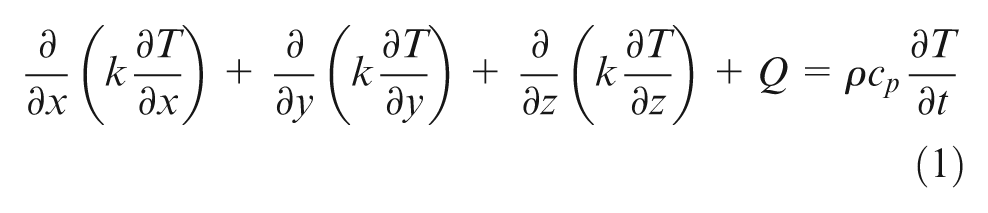
where k is the thermal conductivity, ρ is the density and cp is the specific heat of material. In equation (1), Q is the rate of volumetric heat generation due to the electric arc during welding. In the SAW process, the thermal behaviour also involves heat transfer from molten droplet of the filler material and convective heat transfer from surface of the work. The present temperature distribution is the arithmetic aggregate of all the effects. Hence, the general solution of the temperature field is expressed as
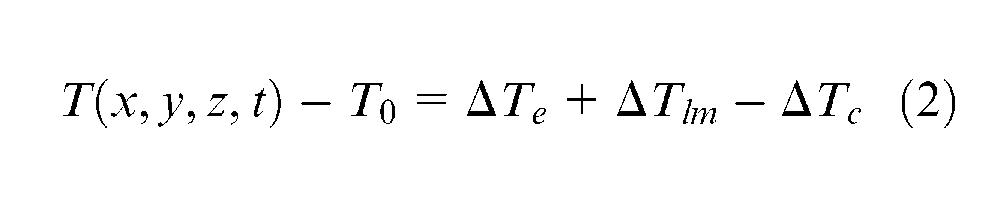
where
Temperature field from the electric arc
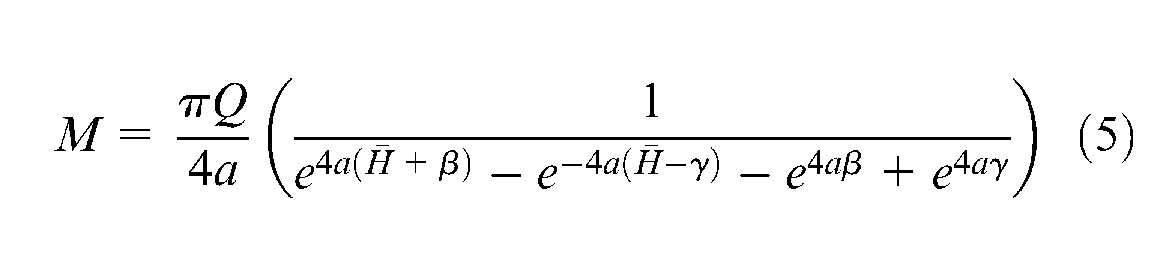
The distribution of heat flux from the electric arc is considered as a double-paraboloid shape of Gaussian distribution. It is assumed that the 3D double-paraboloid heat source is superposition of a series of instant point heat sources. The equation for the 3D double-paraboloid volumetric heat source at a point (x, y, z) is given as follows
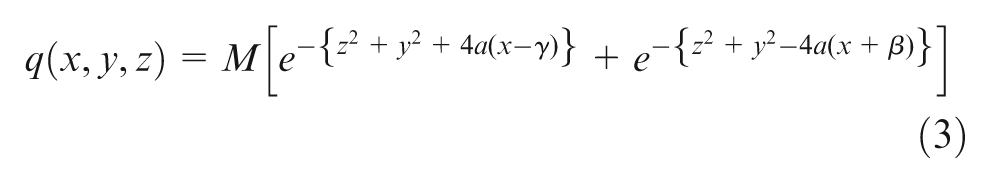
where M is the maximum heat density, the paraboloid passes through the points
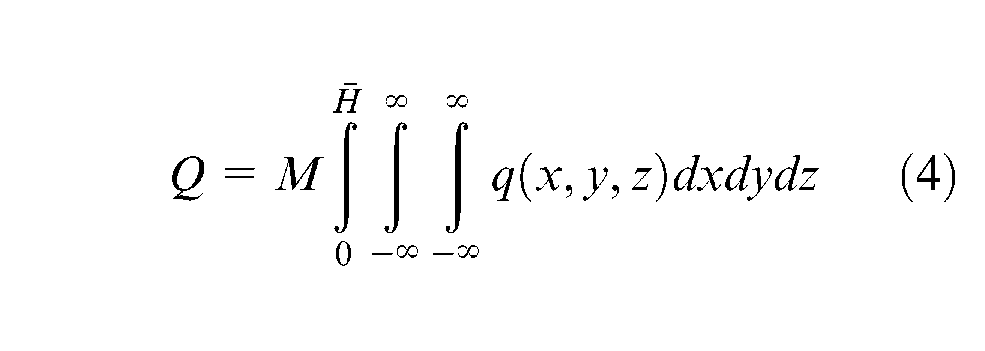
where
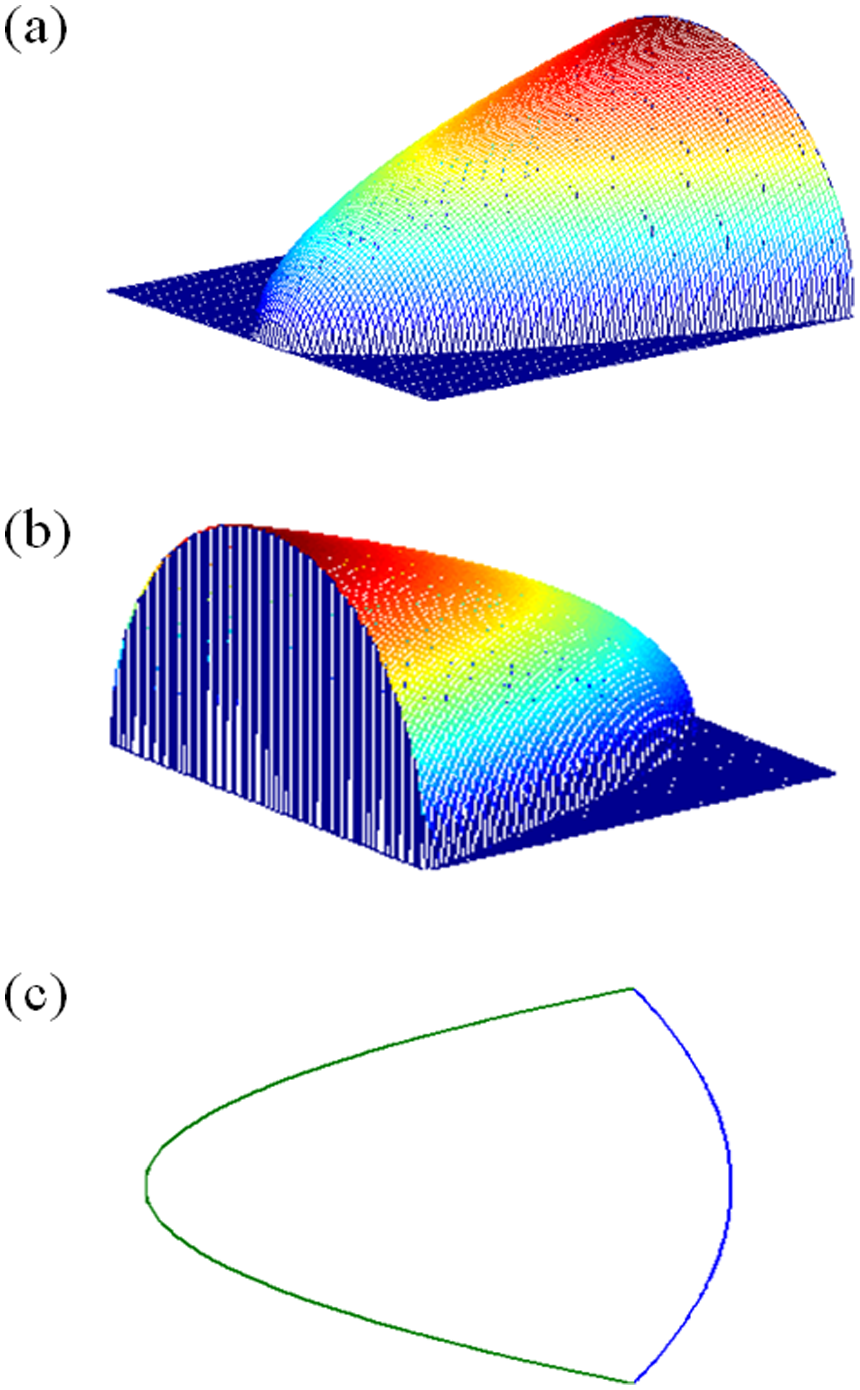
A 3D double-paraboloid shape of heat source: (a) back part of the paraboloid, (b) front part of the paraboloid and (c) 2D projection of the double-paraboloid heat source.
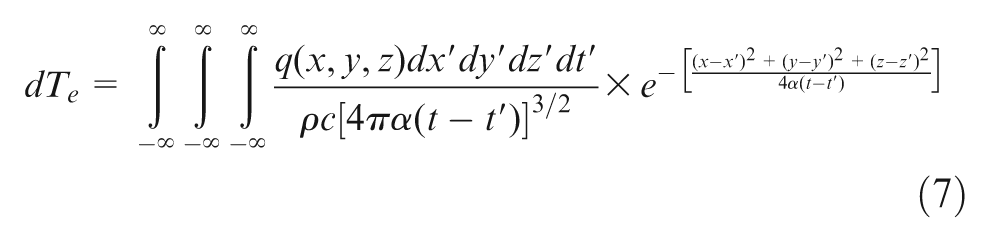
The temperature distribution of the semi-infinite body for a point heat source of dQ amount of heat that is placed at a position
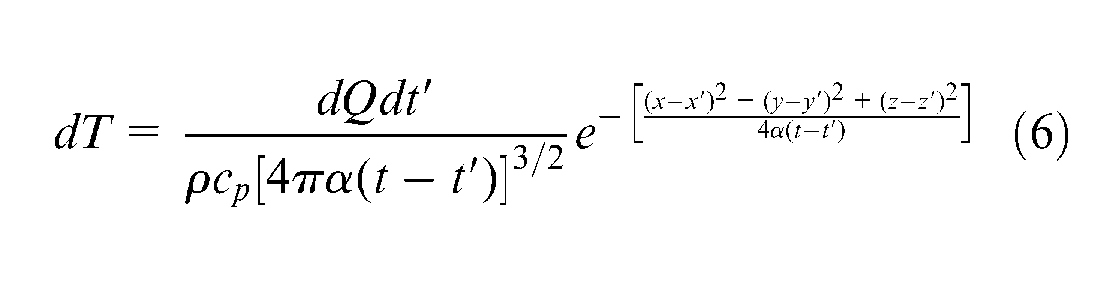
where dT is a temperature rise at point (x, y, z) at time t and α is the thermal diffusivity of the material. Hence, the final temperature distribution is obtained by considering equation (3) and integrating equation (6) as
Thus
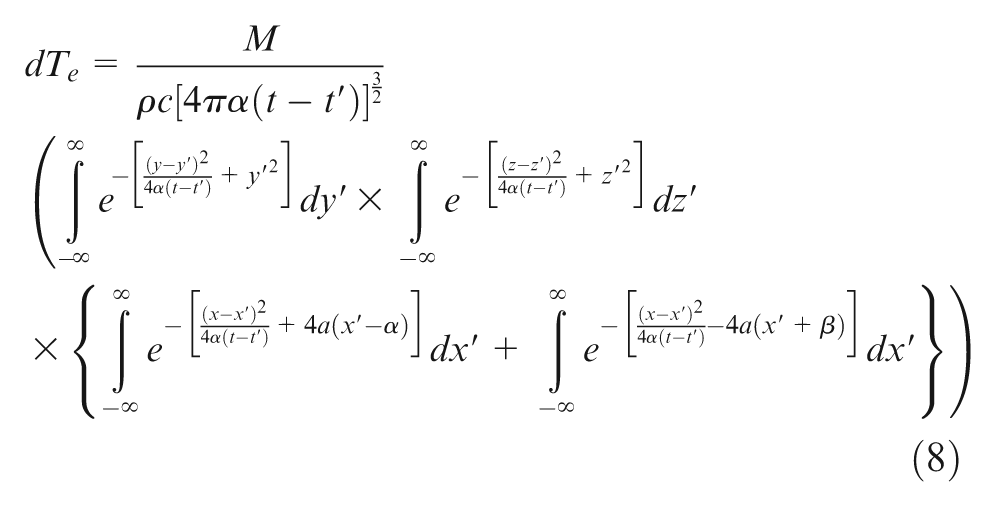
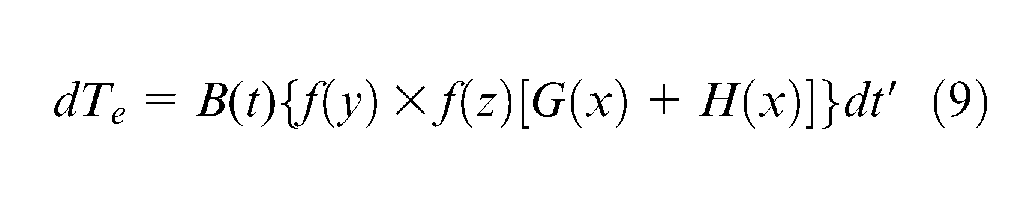
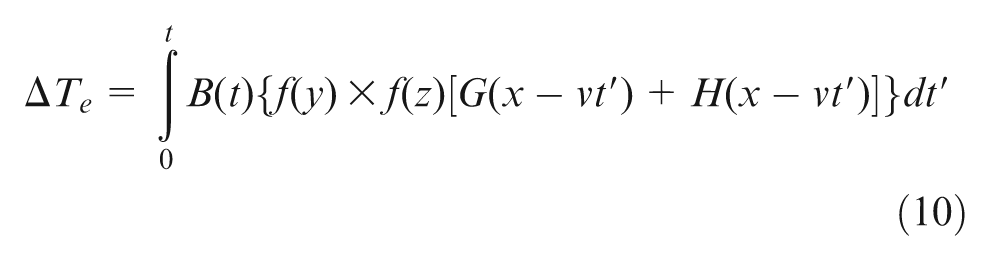
Corresponding functions of B(t), f(y), f(z), G(x) and H(x) are explained in Appendix 2. When heat source is moving with constant speed v from time t′ = 0 to t′ = t, the increase in temperature during the time is given as
Temperature field from the electrode material
The temperature distribution is also affected by the heat energy of liquid electrode material. In this work, accordingly, an increment of
The total amount of delivered heat from the molten electrode is expressed as
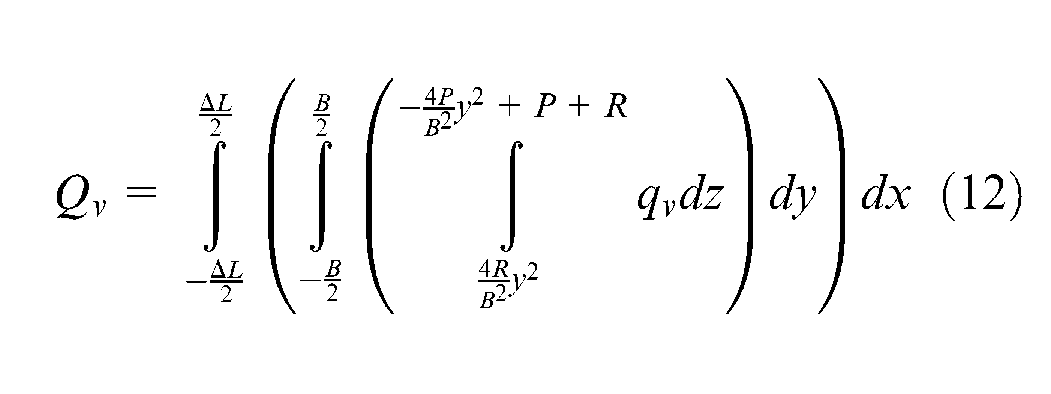
where qv is the volumetric heat of molten electrode. If the volumetric heat (qv) is applied at the point
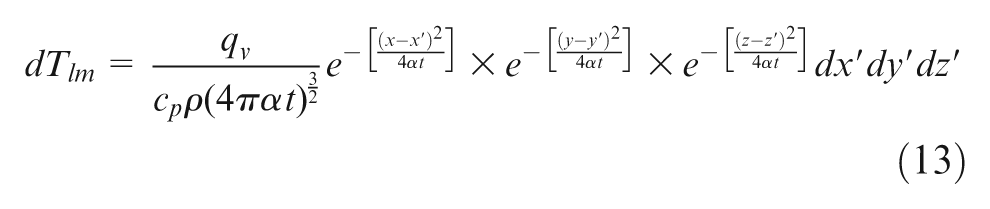
Therefore, the increase in temperature due to deposition of the electrode material for a length of
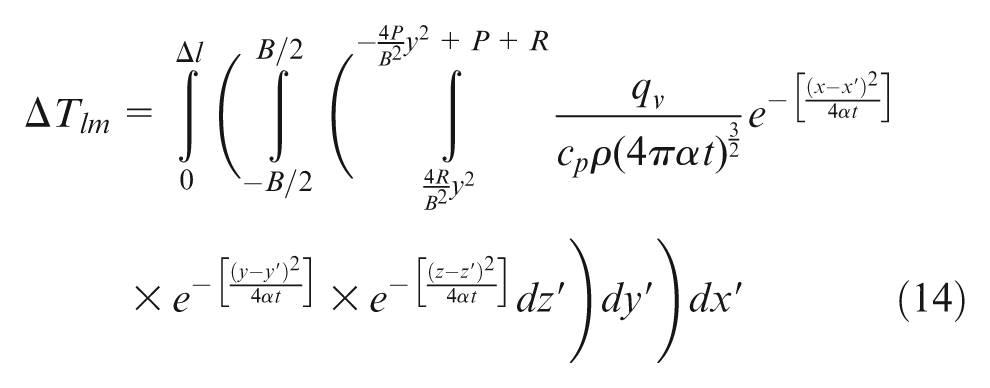
In equation (14),
where
Temperature drop due to the convective heat transfer
During welding process, due to convective heat transfer from the surface, there is a temperature drop of dT in the differential time interval of

where h is the convective heat transfer coefficient and

where
Results and discussion
The transient temperature distribution is estimated using the MATLAB platform. The predicted temperature is compared with experiments. In experiments, the temperature is recorded using infrared thermometers focused on different locations (P1, P2, P3 and P4) on surface of the welded plate (also see Figure 2).
Figure 5 shows a comparison of the transient temperature predicted analytically with the temperature obtained from the experiments (corresponds to experiment no. 1 in Table 2). The material properties are considered from Biswas and Mandal. 11 The melting temperature for both the welded plate and the electrode is considered as 1495 °C, 11 and the eutectoid temperature is considered as 723 °C. 11 Density has been considered as 7806 kg/m3. It is seen from Figure 5 that the temperature of a point increases with time when the heat source approaches towards the point and gradually decreases when the heat source moves away from the point. As P1 is near to the heat source, the temperature of the point P1 is greater than that of the other points. On the whole, a good agreement is found between the measured and predicted temperatures.
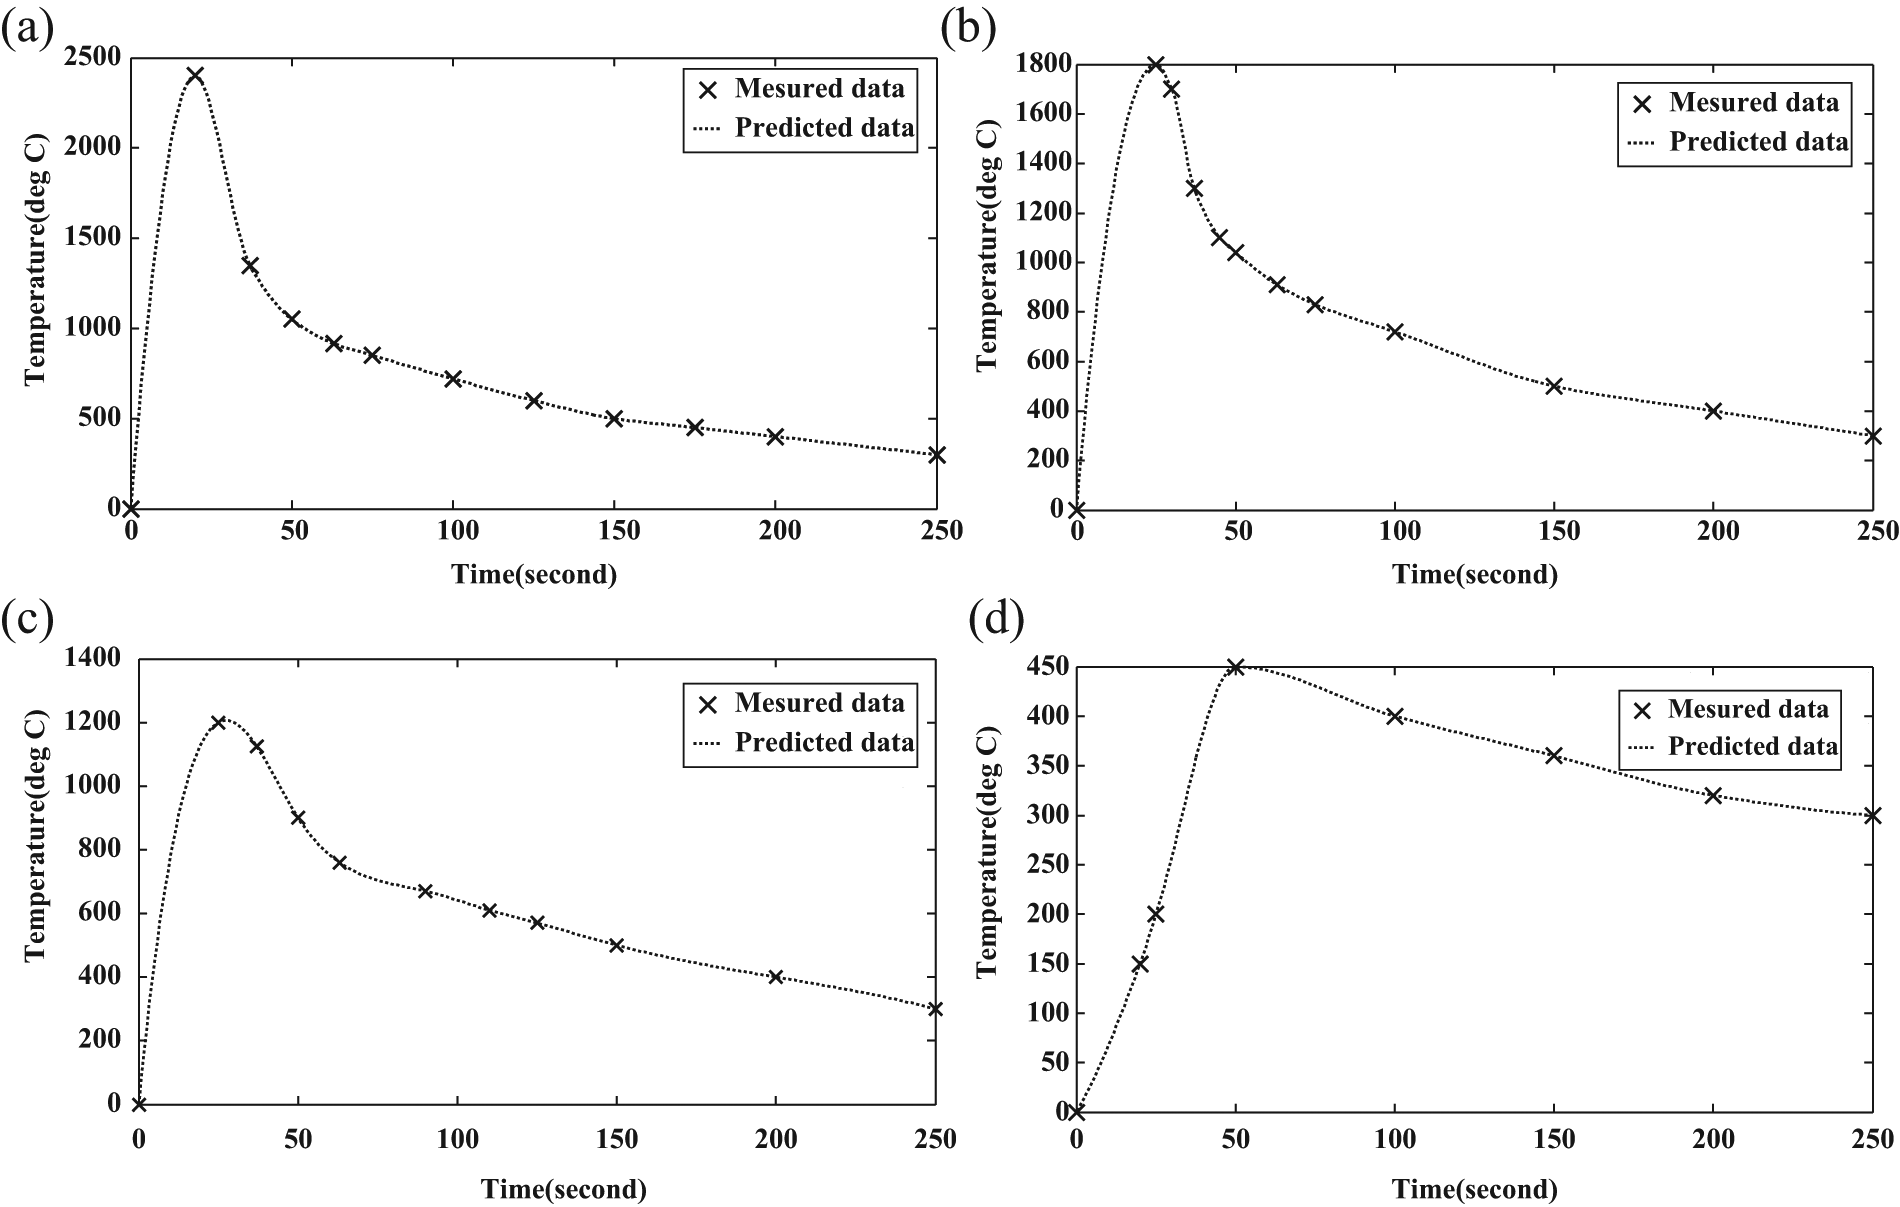
Comparison of the predicted temperature with experimental data (experiment no. 1 in Table 2) at the points (a) P1, (b) P2, (c) P3 and (d) P4. In y-coordinate,
Subsequently, the work predicts the effect of convective heat loss on the temperature distribution during welding. Figure 6 shows the comparison between measured temperature (experiment no. 1 in Table 2) and the calculated temperature when convective heat loss is neglected. It is observed that about 15% deviation in the temperature distribution is found.
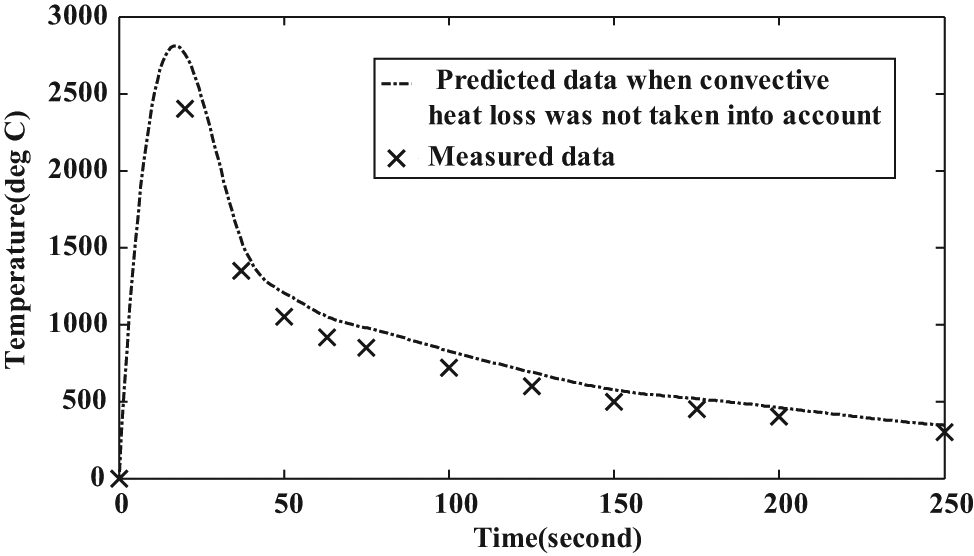
Comparison of predicted and measured temperature distributions (experiment no. 1) at point P1. In y-coordinate,
Conclusion
In this work, transient temperature during SAW process is analytically predicted. The prediction agrees well with the experimental data, and there is a deviation of about 15% in temperature distribution if the convective heat transfer from the surface is neglected. Experimental results show that the penetration and bead width increase with increase in supply current as well as with supply voltage. It is found that the rate of increase in bead width is higher than the rate of increase in depth of penetration with increase in the supply of current and voltage. The variation in reinforcement height is nearly same for all conditions. As analytical model for welding process provides quick estimation of the temperature during welding, the present analytical model may also be used for controlling the SAW process.
Footnotes
Appendix 1
Appendix 2
where
where
For
Declaration of conflicting interests
The authors declare that there is no conflict of interest.
Funding
This research received no specific grant from any funding agency in the public, commercial or not-for-profit sectors.