
Abstract
In this article, numerical modelling of friction stir welding of copper plates is presented. The aim of this study is to implement DEFORM-3D for developing the numerical simulation. Material flow patterns are extracted using point tracking method, and mechanical/metallurgical properties of workpiece are analysed. Simulation results suggest that material particles in front of the tool pin tend to pass and settle behind the pin from the retreating side. Based on the results, a new classification of distinctive zones in the stirred zone is presented. The stir zone shape in friction stir welding is divided into five distinctive zones. In friction stir welding of copper metals, the stir zone does not lean completely towards any sides of the welding line, which was found to compare favourably with experimental observations.
Keywords
Introduction
Welding of copper is often difficult by conventional fusion welding techniques due to high thermal diffusivity, high melting point and good thermal conductivity of copper, which is 10–100 times higher than that of steels and other alloys. Therefore, higher heat input is required for welding of copper compared to steel or aluminium. In friction stir welding (FSW), parts are mated together, rigidly fixed and joined in solid state by forcing a rotating tool into the joint and traversing that tool along the joint. This process creates weld with properties comparable to those of the base metal and in most cases are superior to properties that are achieved with traditional fusion welding techniques. FSW of aluminium alloys and steel has been reported in many studies, but few studies have been done for the welding of copper and its alloys.
The Swedish Nuclear Fuel and Waste Management Company (SKB) is responsible for managing and disposing all radioactive waste from Swedish nuclear power plants in such a way to secure maximum safety for human beings and the environment. The copper canisters are placed in crystalline basement rock at a depth of about 500 m, embedded in bentonite clay. The canisters are nearly 5 m long and over 1 m in diameter. They weigh between 25 and 27 ton when filled with spent nuclear fuel. The outer casing is a 50-mm-thick layer of copper to protect against corrosion. The canister is designed to withstand corrosion and any mechanical forces caused by movements in the rock, earthquakes and future ice ages. In 1997, SKB decided to investigate the potential of FSW on 50-mm-thick copper. The development program showed that 50-mm-thick copper plates and 50-mm-thick copper rings cut from tubes could be joined with FSW, and a welding tool was developed that could last a full weld cycle. However, during longer weld cycles, the developed welding procedure with constant input parameters could not keep the process within its process window. 1
When it comes to copper and its alloys, only one industrial FSW application is documented. Hitachi Cable Ltd and Hitachi Copper Products Ltd applied FSW to water-cooled copper backing plates in Japan due to the low distortion and excellent mechanical properties from the welding process. Grooves are machined in up to 70-mm-thick copper plates, and these water channels are covered with copper sheet that are friction stir welded to the plate. 2
Most problems governed by differential equations can be solved by approximating the problem with a numerical method and formulating a solution based on that method. Simplistically, numerical modelling is the division of a geometrical domain into a finite number of nodal points and elemental volumes, the approximation of the governing boundary physics affecting each nodal point and its neighbourhood points and the solution of the system of equations resulting from this approximation. The FSW process incorporates a challenging set of physical phenomena. These phenomena include very large non-linear material deformations, highly temperature-dependent material properties and thermal heating from coupled frictional and mechanical shear deformation. Therefore, a careful study of numerical modelling approaches must be conducted to properly select the appropriate method of analysis. Some researchers made efforts to develop numerical codes for FSW process.
Previous FSW researchers have applied various combinations of the finite element, finite difference and finite volume approaches to model the FSW process. These approaches have been implemented in Lagrangian, Eulerian and arbitrary Lagrangian–Eulerian (ALE) formulation, each with strengths and weaknesses. Several researchers developed the process with a fully three-dimensional (3D) domain, while others have elected focusing on a two-dimensional simplification of the geometry. Each of these modelling attempts incorporates simple assumptions for the weld material, the frictional contact interface and the geometry. Therefore, the principal motivation for this research was to capture the FSW process as accurately as possible by reducing the number of simple assumptions utilized in the modelling process.
Bendzsak et al. 3 modelled the FSW process in three dimensions; however, they assumed that the material to be a fluid with a viscosity equal to that of the material at the eutectic temperature. This viscosity was experimentally determined by equating input spindle torque through several experimental tests. Ulysee, 4 similar to the Bendzsak model, utilized a fluid material representation in the 3D FSW model. Each of these approaches attempted to tackle the fundamental challenge of FSW modelling: the 3D nature of the process. However, assumptions were implemented in each of these models, such as fluid material models, and frictional boundary assumptions left room for improvement.
Several authors have modelled the tool as a non-mechanical moving heat source in an effort to remove the thermo-mechanical and weld material modelling challenges. These authors tended to focus on capturing residual stresses and exploited the weld line as a symmetry boundary. Khandkar and Kahn 5 assumed that 98% of the heat generation takes place at the shoulder–weld material interface and modelled the tool as a moving heat source. The study of Khandkar et al. 6 is another example of this symmetric weld-line approach, which models the FSW process with a non-mechanical moving heat source. All these researchers focused their efforts on non-mechanical models, seeking a fundamental understanding of the microstructure and the accompanying post-weld residual stresses. The removal of the thermo-mechanical effects of the FSW tooling does effectively remove the high material deformation challenge, which exists in modelling of the FSW process, but in doing so, the analyst must sacrifice the insight one would gain with a fully thermo-mechanical numerical model.
The reduction of the FSW problem to a two-dimensional plane has allowed the industry to fundamentally understand the FSW process. For example, Seidel and Reynolds 7 modelled a two-dimensional slice, perpendicular to the tool, far below the shoulder of the FSW tool. Although these models effectively study the planar flow of the material, they lack the ability to capture the 3D nature of the friction stir welded material.
Fully transient models of the FSW process are few. The challenge of these studies is capturing the weld formation and the weld process, and the extraction is a pot of gold for the industry. Approximations of the frictional boundary, the material flow properties and the heat flow characteristics make these models difficult to produce. Song and Kovacevic 8 also modelled the transient FSW process in three dimensions, assuming the heat generation input equal to experimentally determined values. Assumptions utilized in this model effectively reduce the complexity of the problem and the accuracy of the solution.
Frigaard et al. 9 modelled the FSW process with the purpose of examining the resulting microstructure. Heurtier et al. 10 focused on the optimization of the final microstructure in the FSW joint. We reviewed the results of each of these studies to fundamentally understand the challenges of FSW modelling.
Recently, Tutunchilar et al. 11 developed models to investigate material flow mechanism using the point tracking method, and their results showed that material on the advancing side (AS) experiences more plastic strain than that of the retreating side (RS).
Many studies have been done by researchers in the investigation of FSW of aluminium alloys and steels. However, the studies of FSW on copper are few, and so far, no simulation was performed for FSW of copper. Therefore, the purpose of this study was to investigate copper welding by modelling approach. For this, a 3D Lagrangian thermo-mechanical coupled incremental finite element simulation of the FSW was developed. Material flow patterns were extracted using the point tracking capability of software. The stir zone shape predicted by simulation corresponds with macrostructural photography.
Governing equations
First thermal model is used to successfully predict trends in temperature history and thermal profiles. In the second step of the analysis, the thermal histories predicted by the thermal model is used as an input for a mechanical model that ignores all other forces apart from those arising out of thermal expansion. In the current model, however, no mechanical forces are considered, and only the forces arising out of the volumetric thermal expansion are taken into account. As a result, it is only the thermal strain increment that contributes to the residual stresses. This thermal stress, however, can constitute both elastic and plastic components. Since the current mechanical model deals only with residual thermal stresses, the only forces considered were those caused by the thermal expansion of the workpiece material plus the downward force exerted by the tool shoulder.
Mechanical model
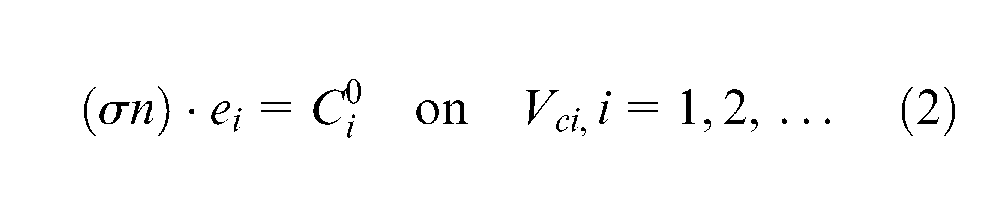
Neglecting inertia and body forces, the equilibrium equations in a volume

where
where

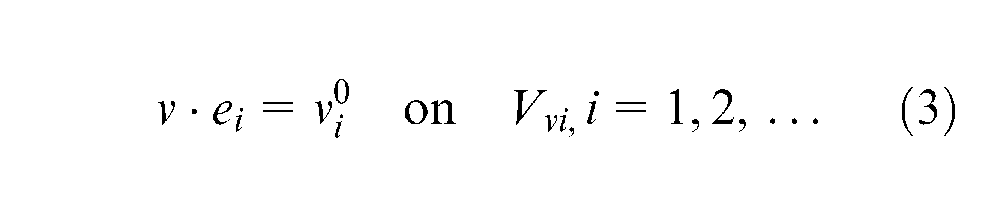
Continuity equation satisfies everywhere in

The deviatoric stress tensor
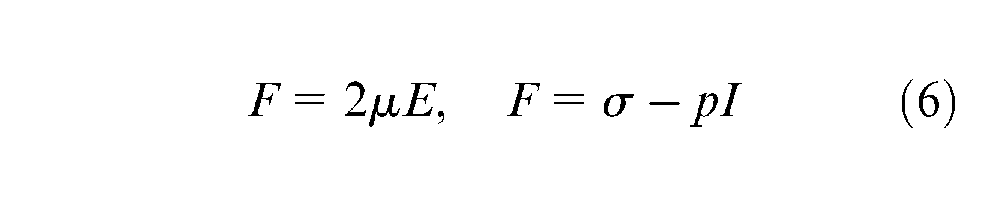

where


In this study, a rigid-viscoplastic material was assumed; it is represented by an inverse sine–hyperbolic relation as follows

where
Thermal model
Energy balance is expressed here as the conductive–convective, steady-state equation 12
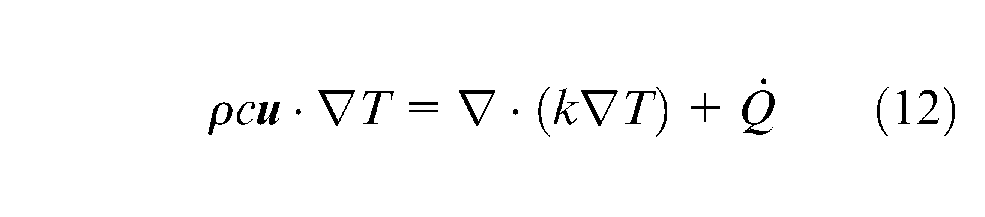
where
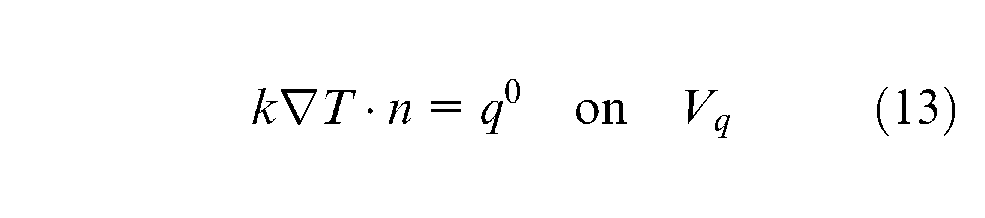
Fluxes


Numerical model details
FSW process was simulated with the ALE formulation. Also, we assumed the following: (1) the tool is rigid, (2) the friction factor is constant and (3) the thermal characteristics of the workpiece and tool are constant. All the free surfaces are surrounded by atmosphere at the ambient temperature. The workpiece was fixed in the bottom surface from all directions. Furthermore, simulation was done based on the following assumptions and conditions.
Workpiece and tool models
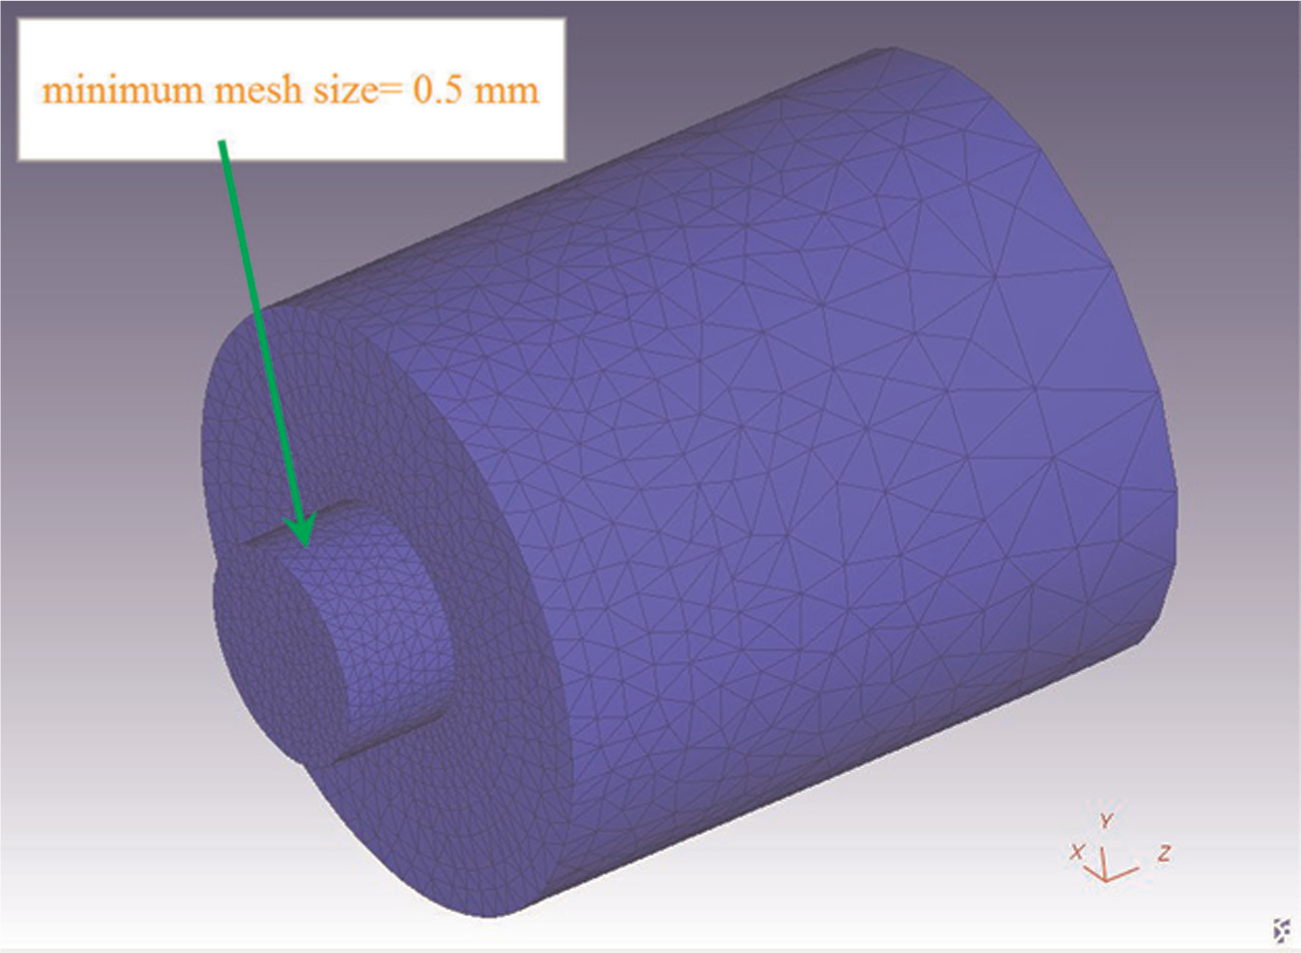
Two copper plates, 220 mm long, 75 mm wide and 4 mm thickness, were butt-welded along the rolling direction in a flat position. As shown in Figure 1, the smallest elements were placed in the tool pin, and when away from the pin mesh, the size becomes larger, and the minimum mesh size is 0.5 mm. The sheets were meshed with ∼42,000 tetrahedral elements. The smallest mesh was considered to be 0.8 mm, which is located under the tool shoulder, and by increasing the distance from this region, the size of the elements becomes larger. To prevent element distortion, automatic local remeshing was taken into account for the workpiece elements.
Schematic illustration of tool.
Material properties and welding parameters
Flow stress of the pure copper at different strain rates and temperatures was interpolated in logarithmic space of strain and strain rate and linear space of temperature. The relationship between flow stress and strain for material at temperatures of 500 °C, 800 °C and 900 °C and strain rates of 0.001–100 s−1 is illustrated in Figure 2. 13 Workpiece, tool and backing plate thermal properties were considered constant, and their values are specified in Table 1. Heat exchange between ambient air (with the temperature of 20 °C) and free surfaces of the workpiece and tool was taken into account (see Table 1). Simulation parameters (welding parameters such as rotational speed, traverse speed, tilt angle and plunge depth of shoulder) are given in Table 2.
Thermal characteristics of workpiece, tool and backing plate.
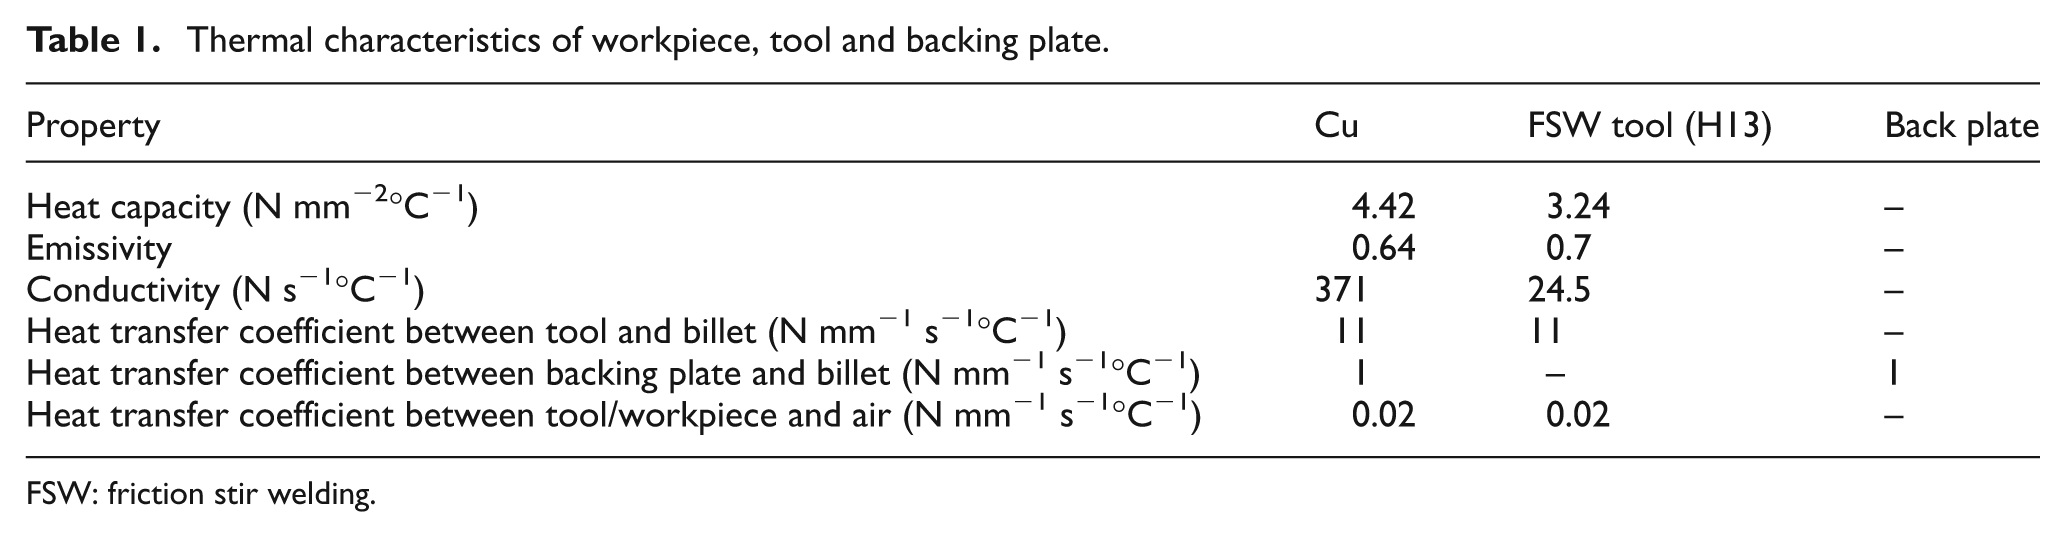
FSW: friction stir welding.
Process parameters used in the simulation.
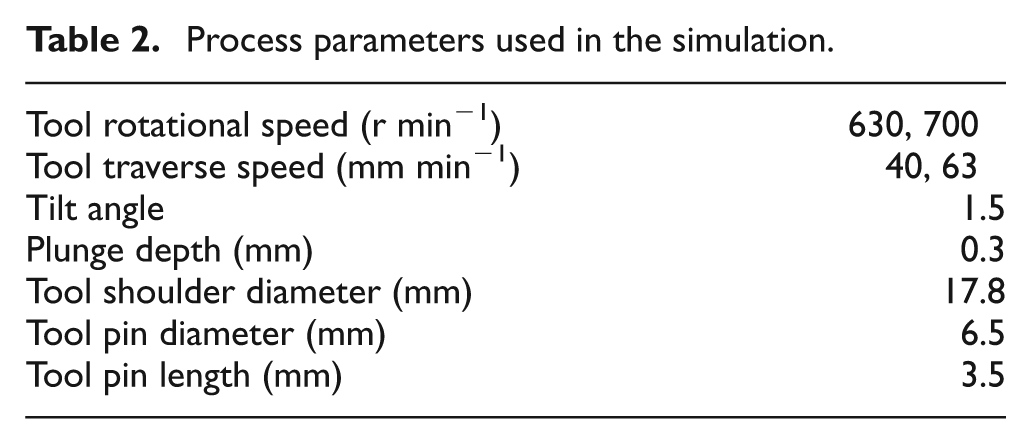
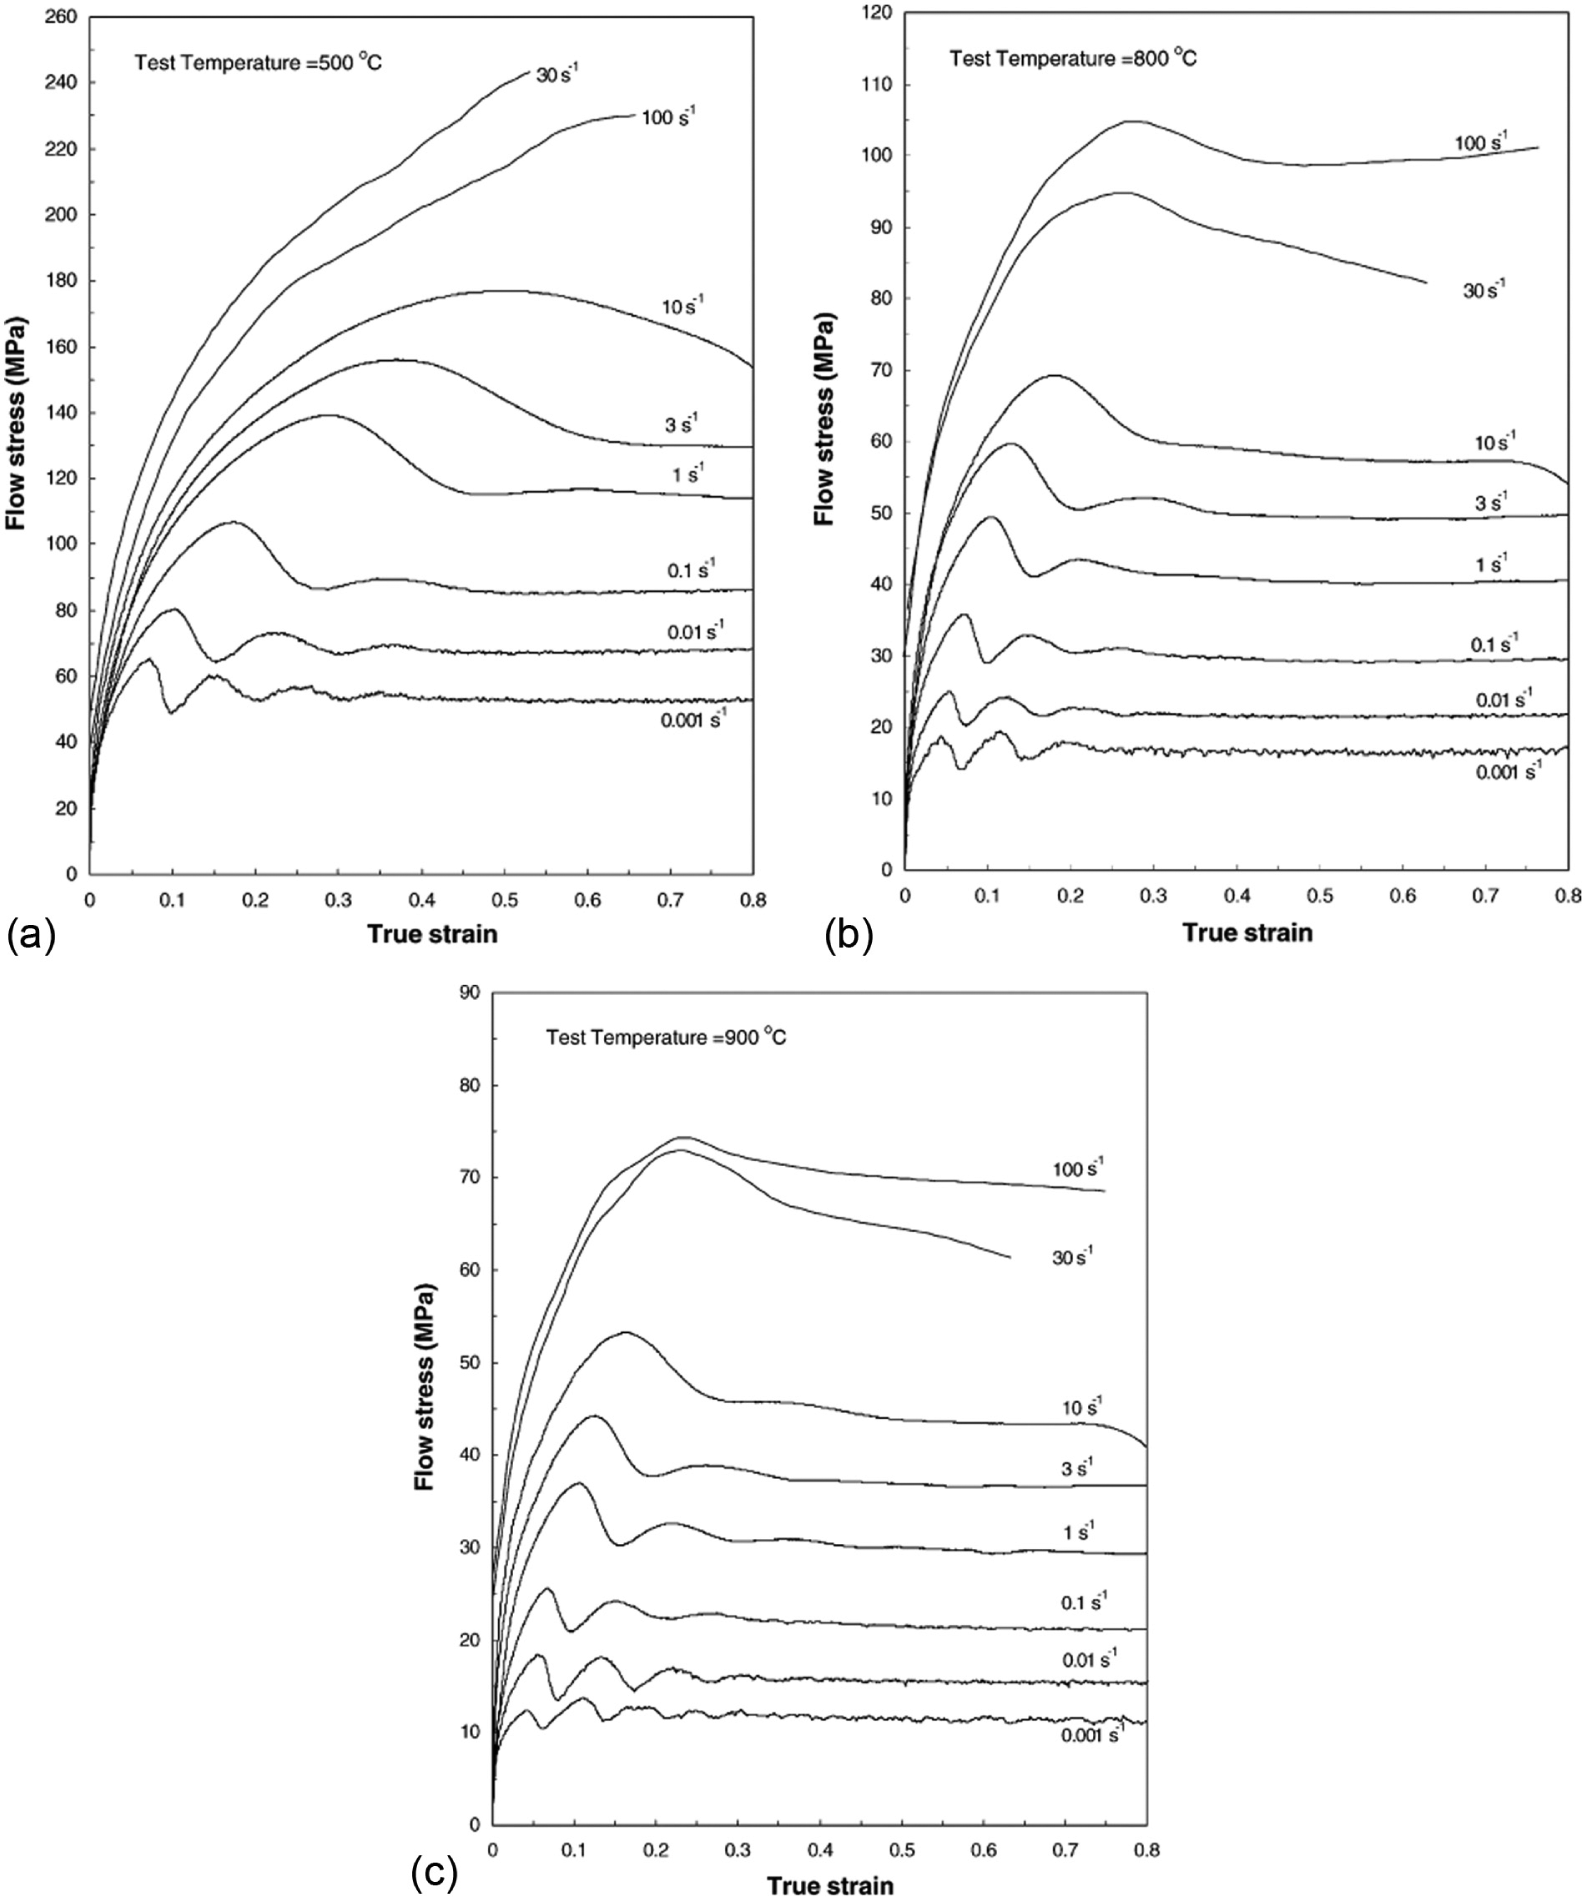
Flow stress–strain curves of base metal under different conditions: (a) T=500 °C, (b) T= 800 °C and (c) T= 900 °C. 13 .
Results and discussion
Temperature and strain distribution
In this section, temperature result of FSW process from finite element method (FEM) has been compared using the experimental data of Hwang et al. 14 To maintain consistency, the dimensions of the workpiece, material properties, welding conditions and boundary conditions used were the same as those used in the study by Hwang et al. 14 A comparison between measured temperature data of weld nugget from Hwang et al.’s study and the calculated results from FEM simulation is shown in Figure 3. These curves show thermal histories of the point with 6 mm distance from welding line. The calculated temperatures are then verified using the experimental data.
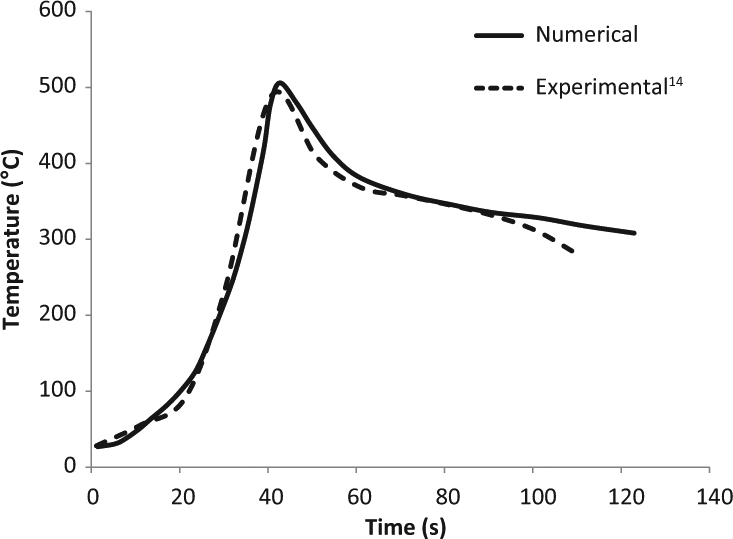
Temperature history derived from simulation and experiment 14 at 6 mm from the welding line.
Figure 4 shows the temperature contours of weld with different parameters. These counters were achieved at x = 30 mm. As seen in Figure 5, temperature distribution is not symmetric around the tool. Maximum temperatures of welds 1 and 3 are almost the same, but their difference with maximum temperature of weld 2 is about 35 °C.
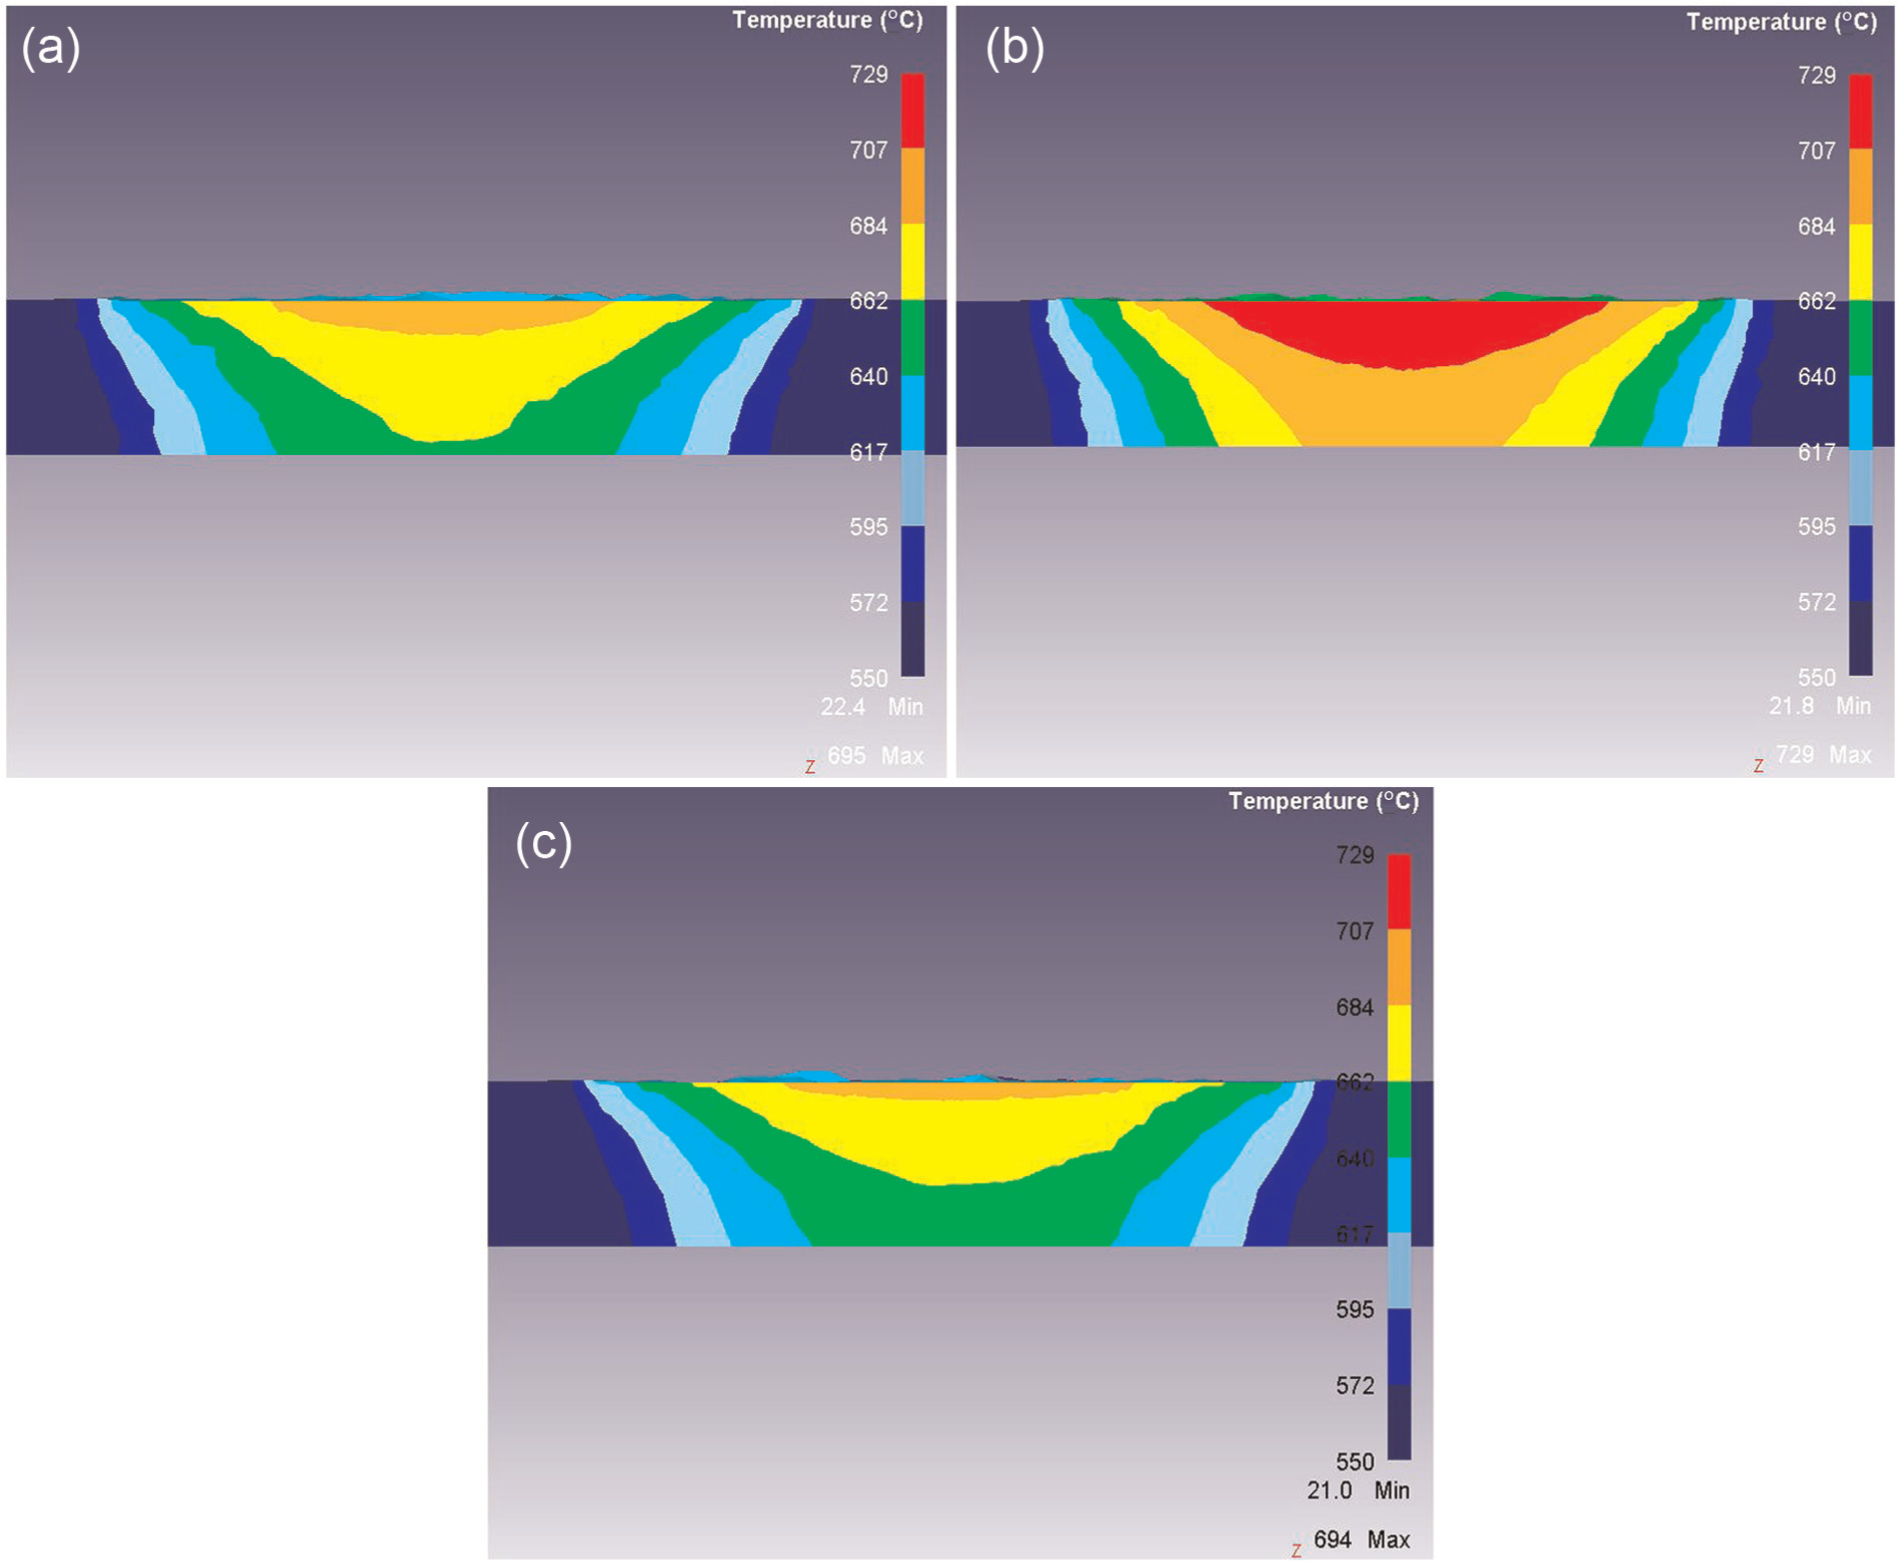
Temperature distribution at different welding parameters: (a) v = 40 mm min
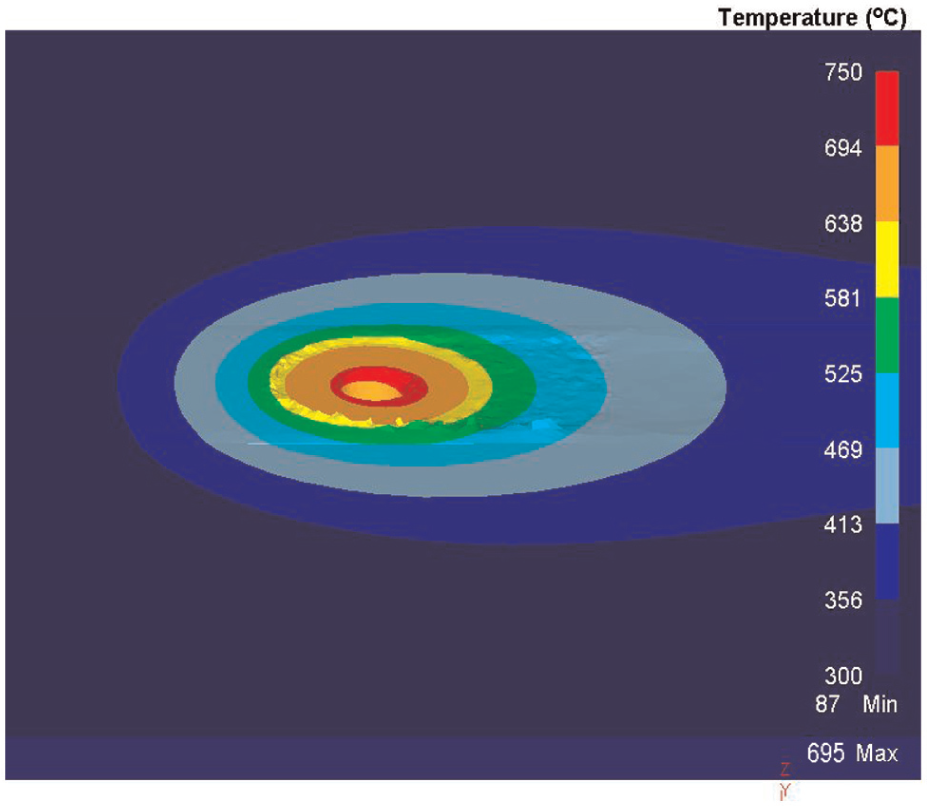
Temperature distribution around tool (v = 40 mm min
Figure 6 illustrates the effective plastic strain contours. Effective strain distribution around welding line is non-symmetric. This non-homogeneity in the strain distribution is the cause of asymmetric material flow.
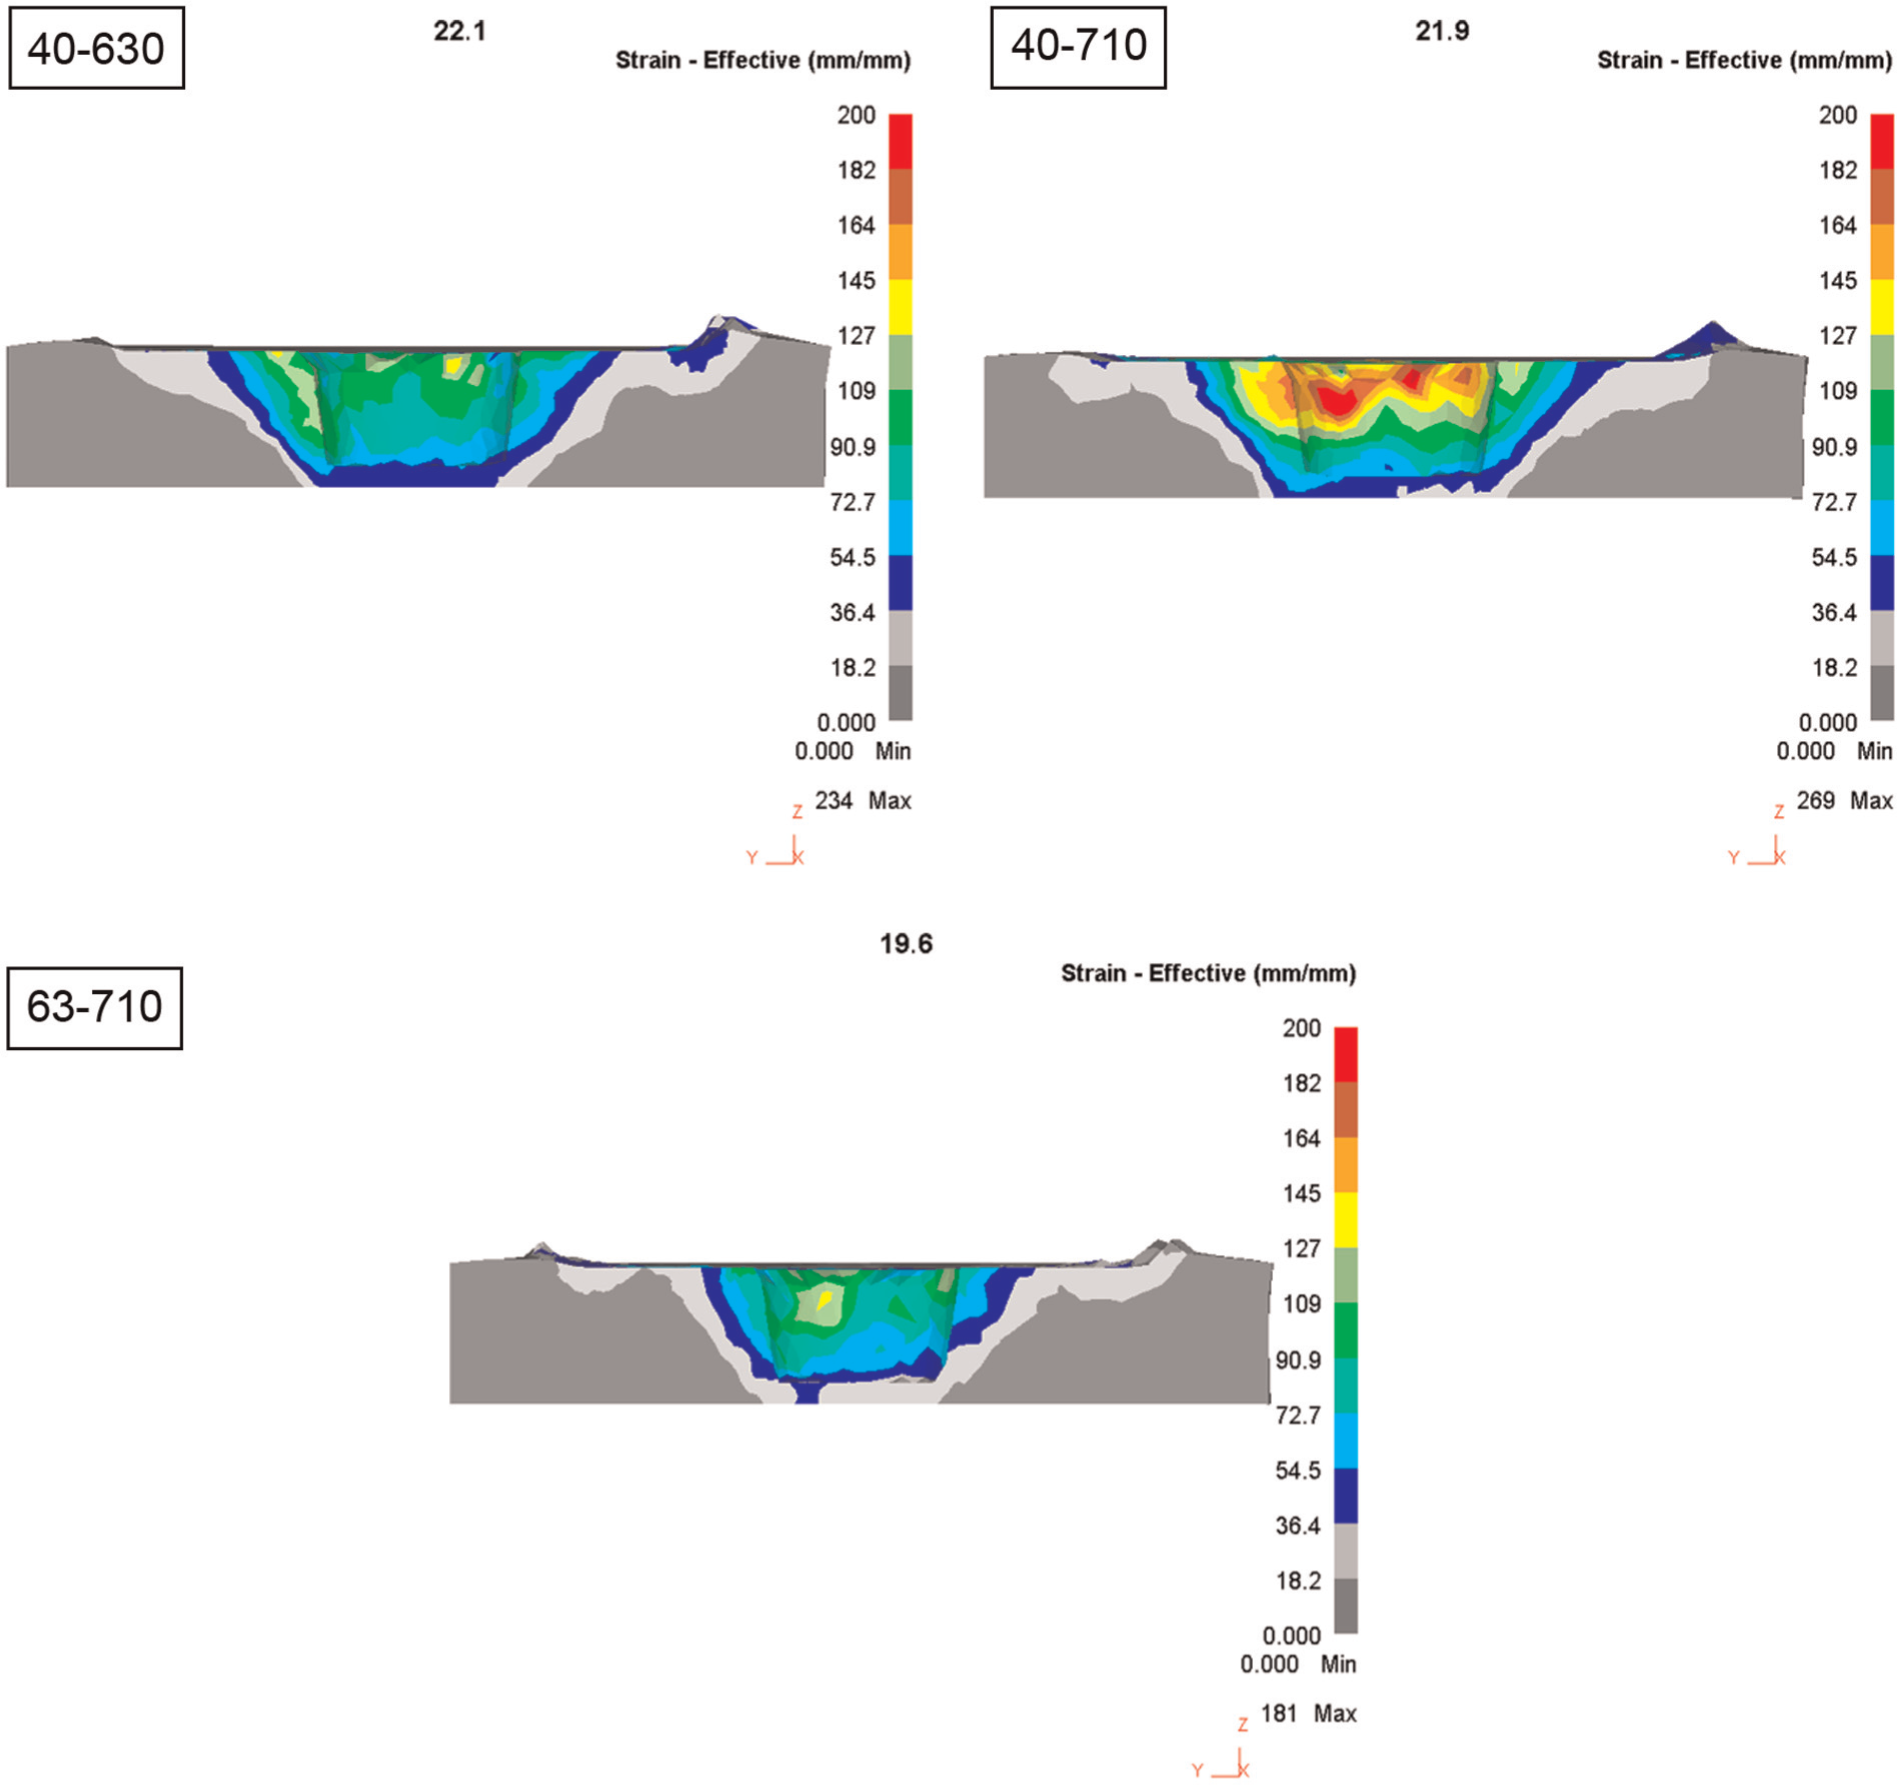
Effective plastic strain distribution at different welding parameters.
Microstructural investigation
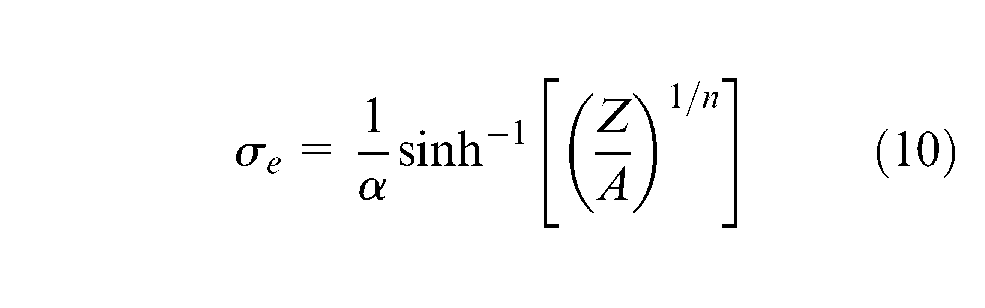
In thermo-mechanical processes such as FSW/friction stir processing (FSP), there is an effective connection between the grain size and temperature, strain and strain rate. According to the Zener–Hollomon parameter (equations (10) and (11)), the variations in temperature and strain rate display reverse influence on the grain size. In other words, an increase in strain rate or a decrease in temperature will increase
The point tracking option of software was chosen to extract the variation of
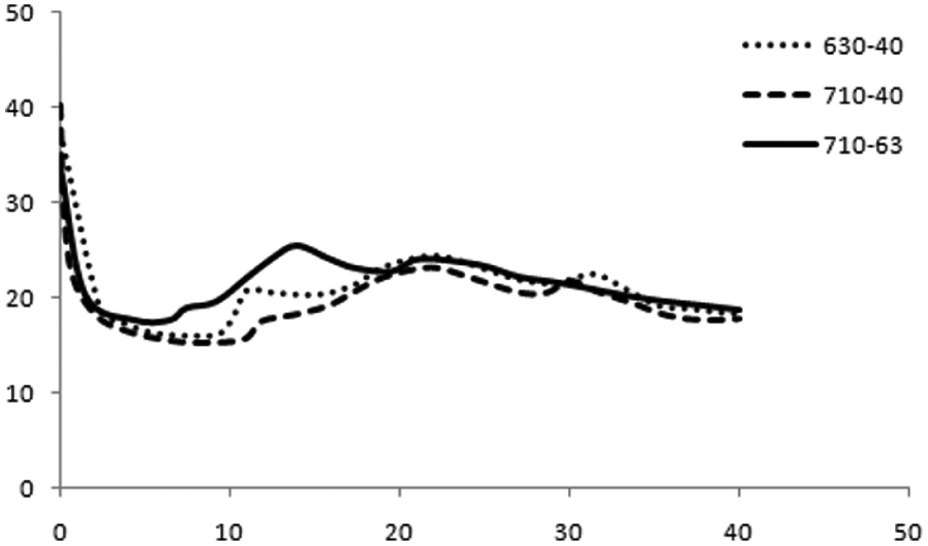
Variation of the Zener–Hollomon parameter for different welding conditions.
Processing parameters for FSW.
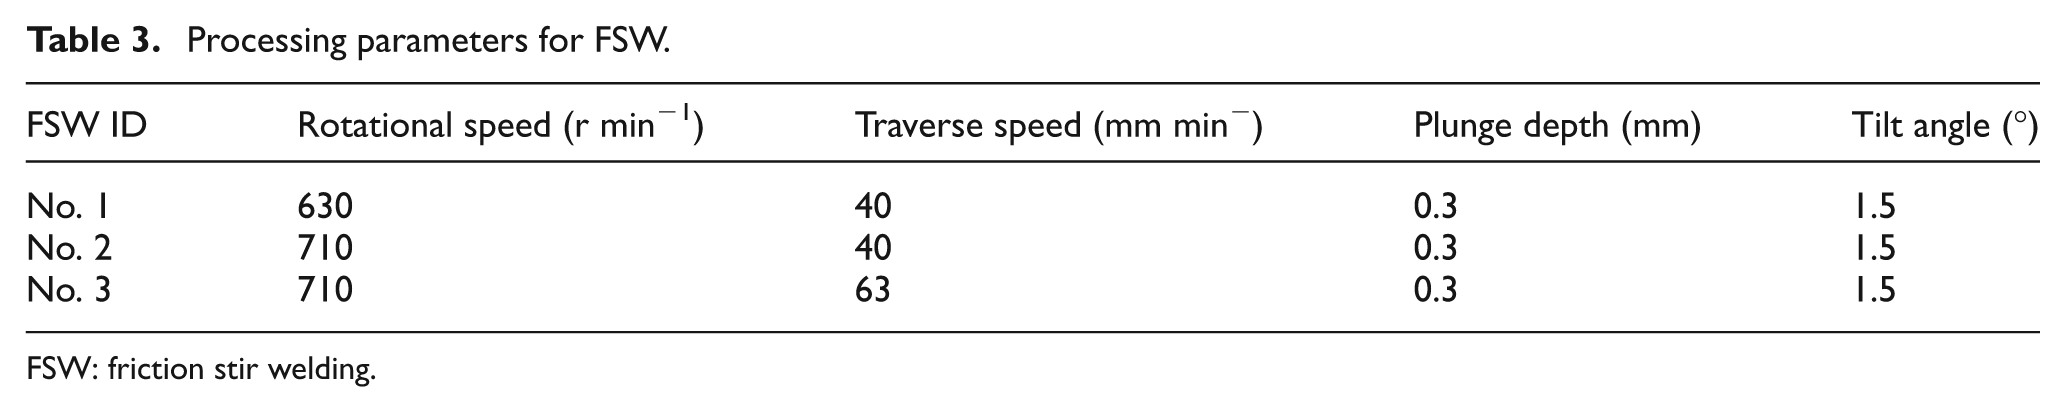
FSW: friction stir welding.
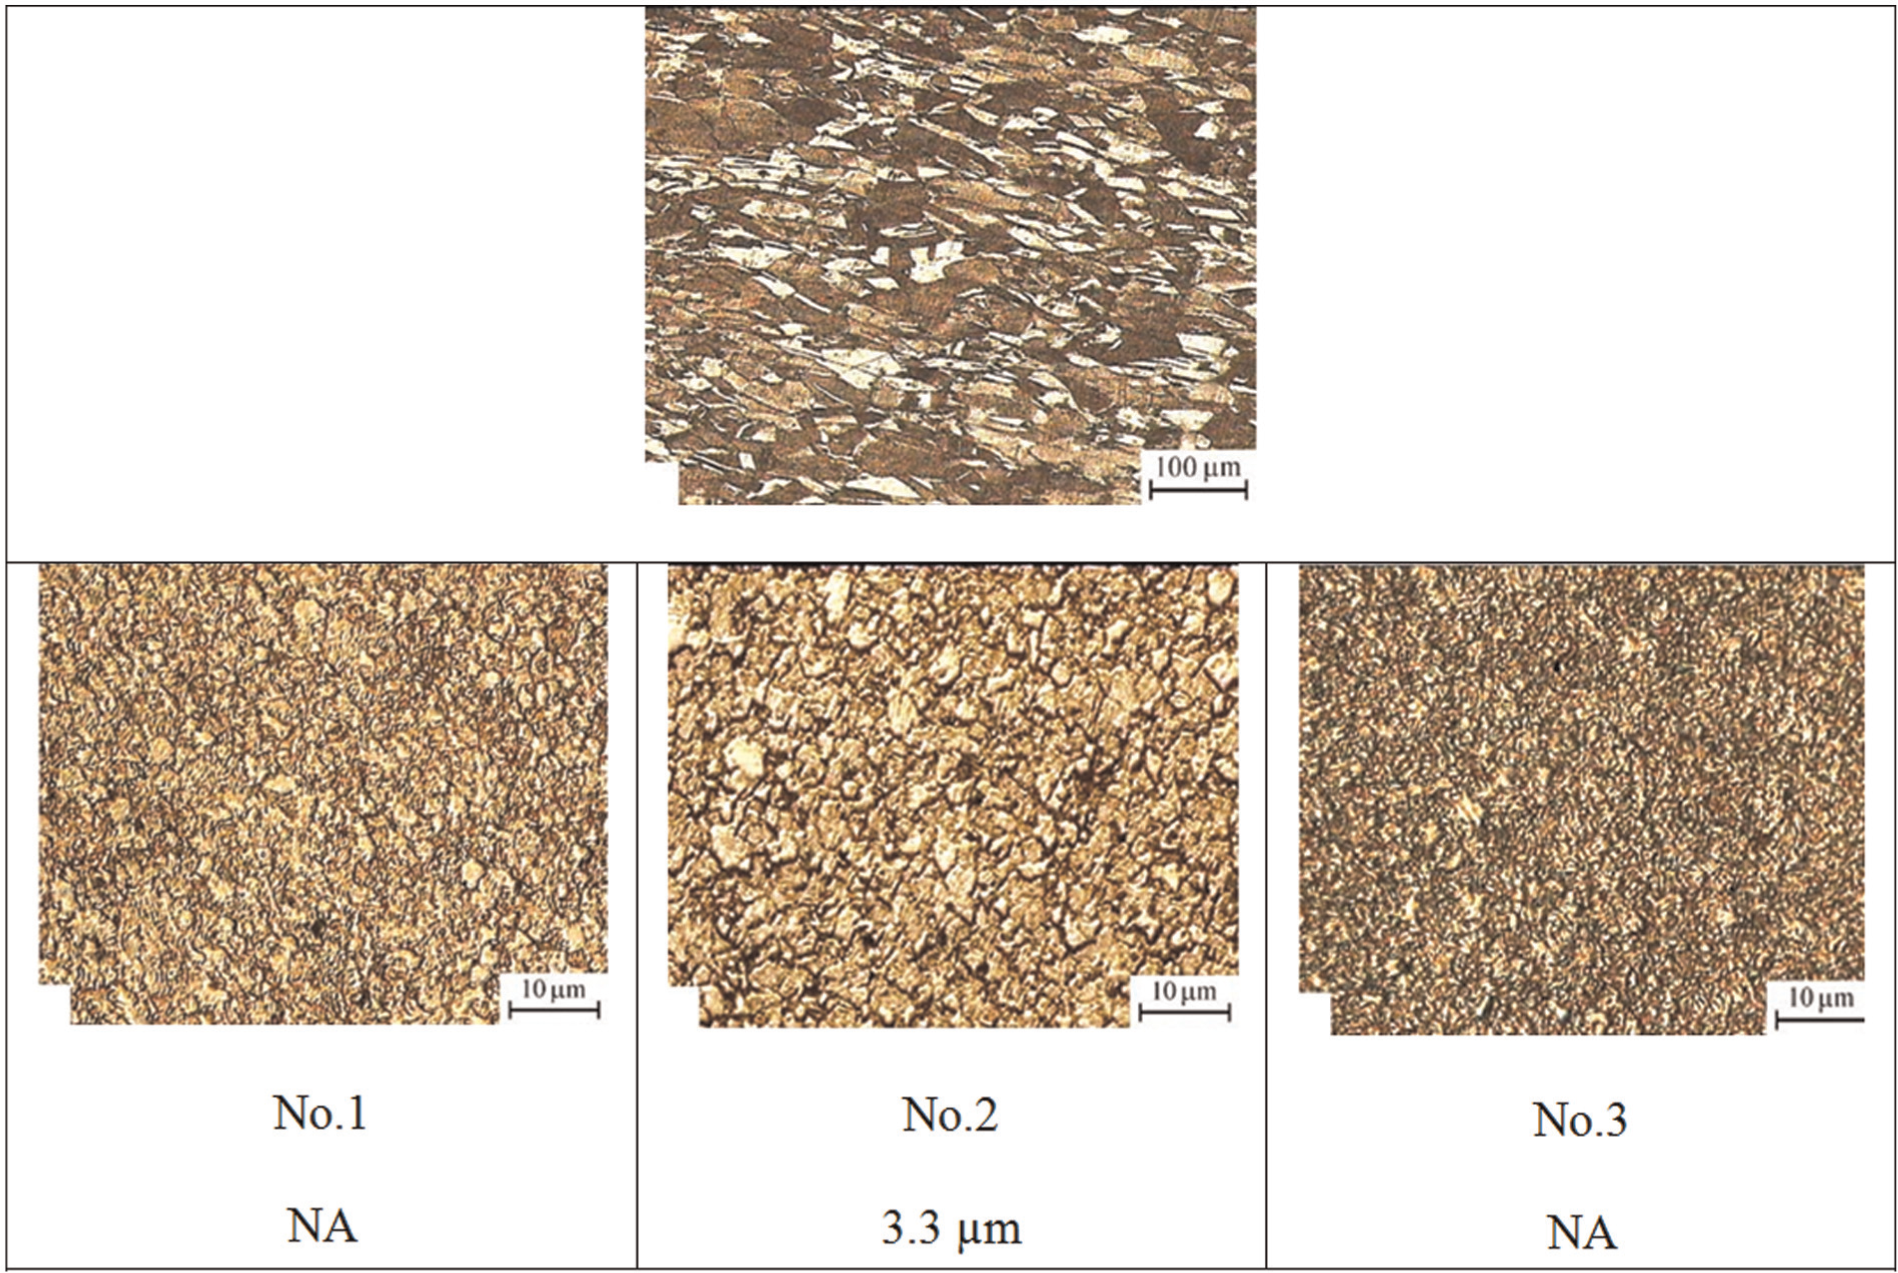
Micrographs of the base metal and the weld nuggets for three different parameters of welding, specified in Table 3.
Material flow behaviour
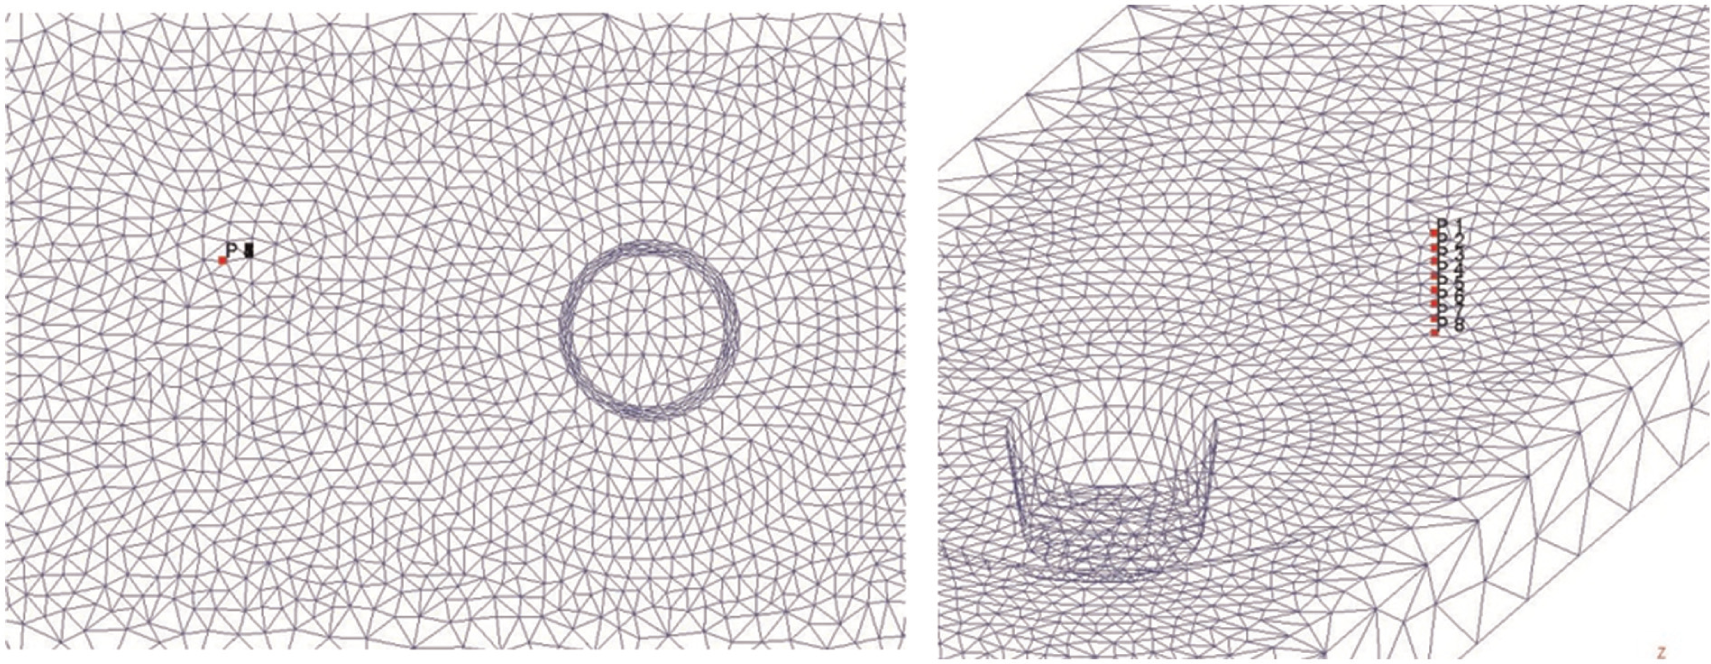
The material flow during FSW is complicated and directly influences the properties of friction stir welded workpiece. It is of vital importance to understand the deformation process and basic physics of the material flow for optimal tool design. To visualize the material flow phenomenon, tracer particle set was defined along the welding line to track the material movement. Eight tracer particles, numbered 1–8, were used, as illustrated in Figure 9. Points P1–P8 at their initial position are located on the weld centre line with 0.5-mm increment in depth from the top surface.
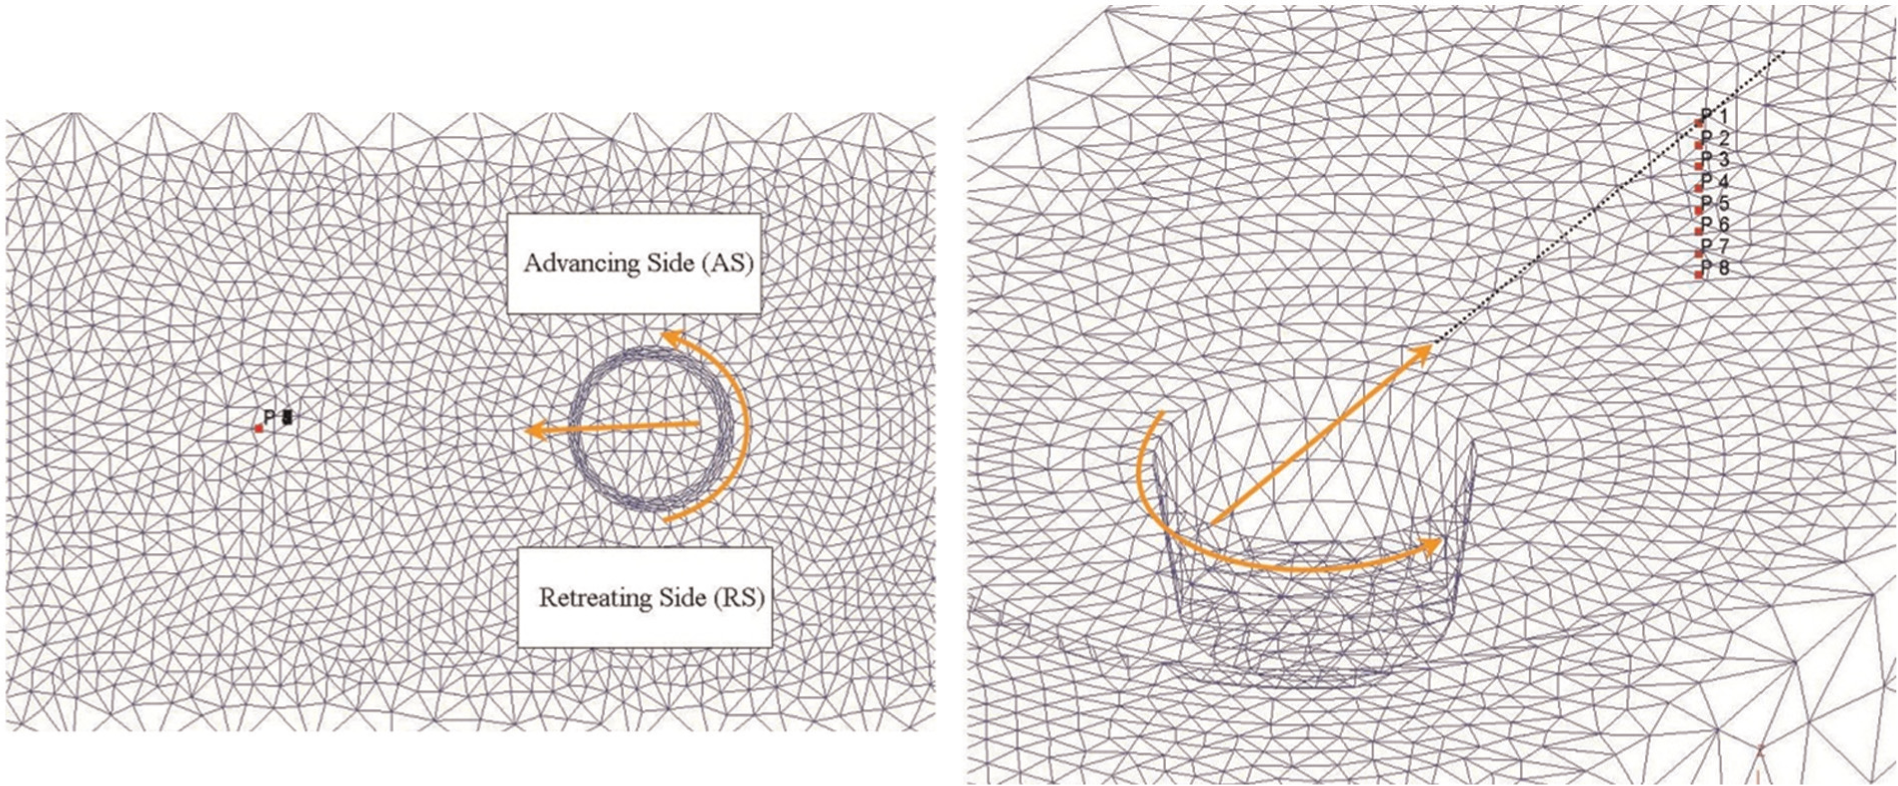
Initial position of the particles on the welding line that has been selected for material flow pattern.
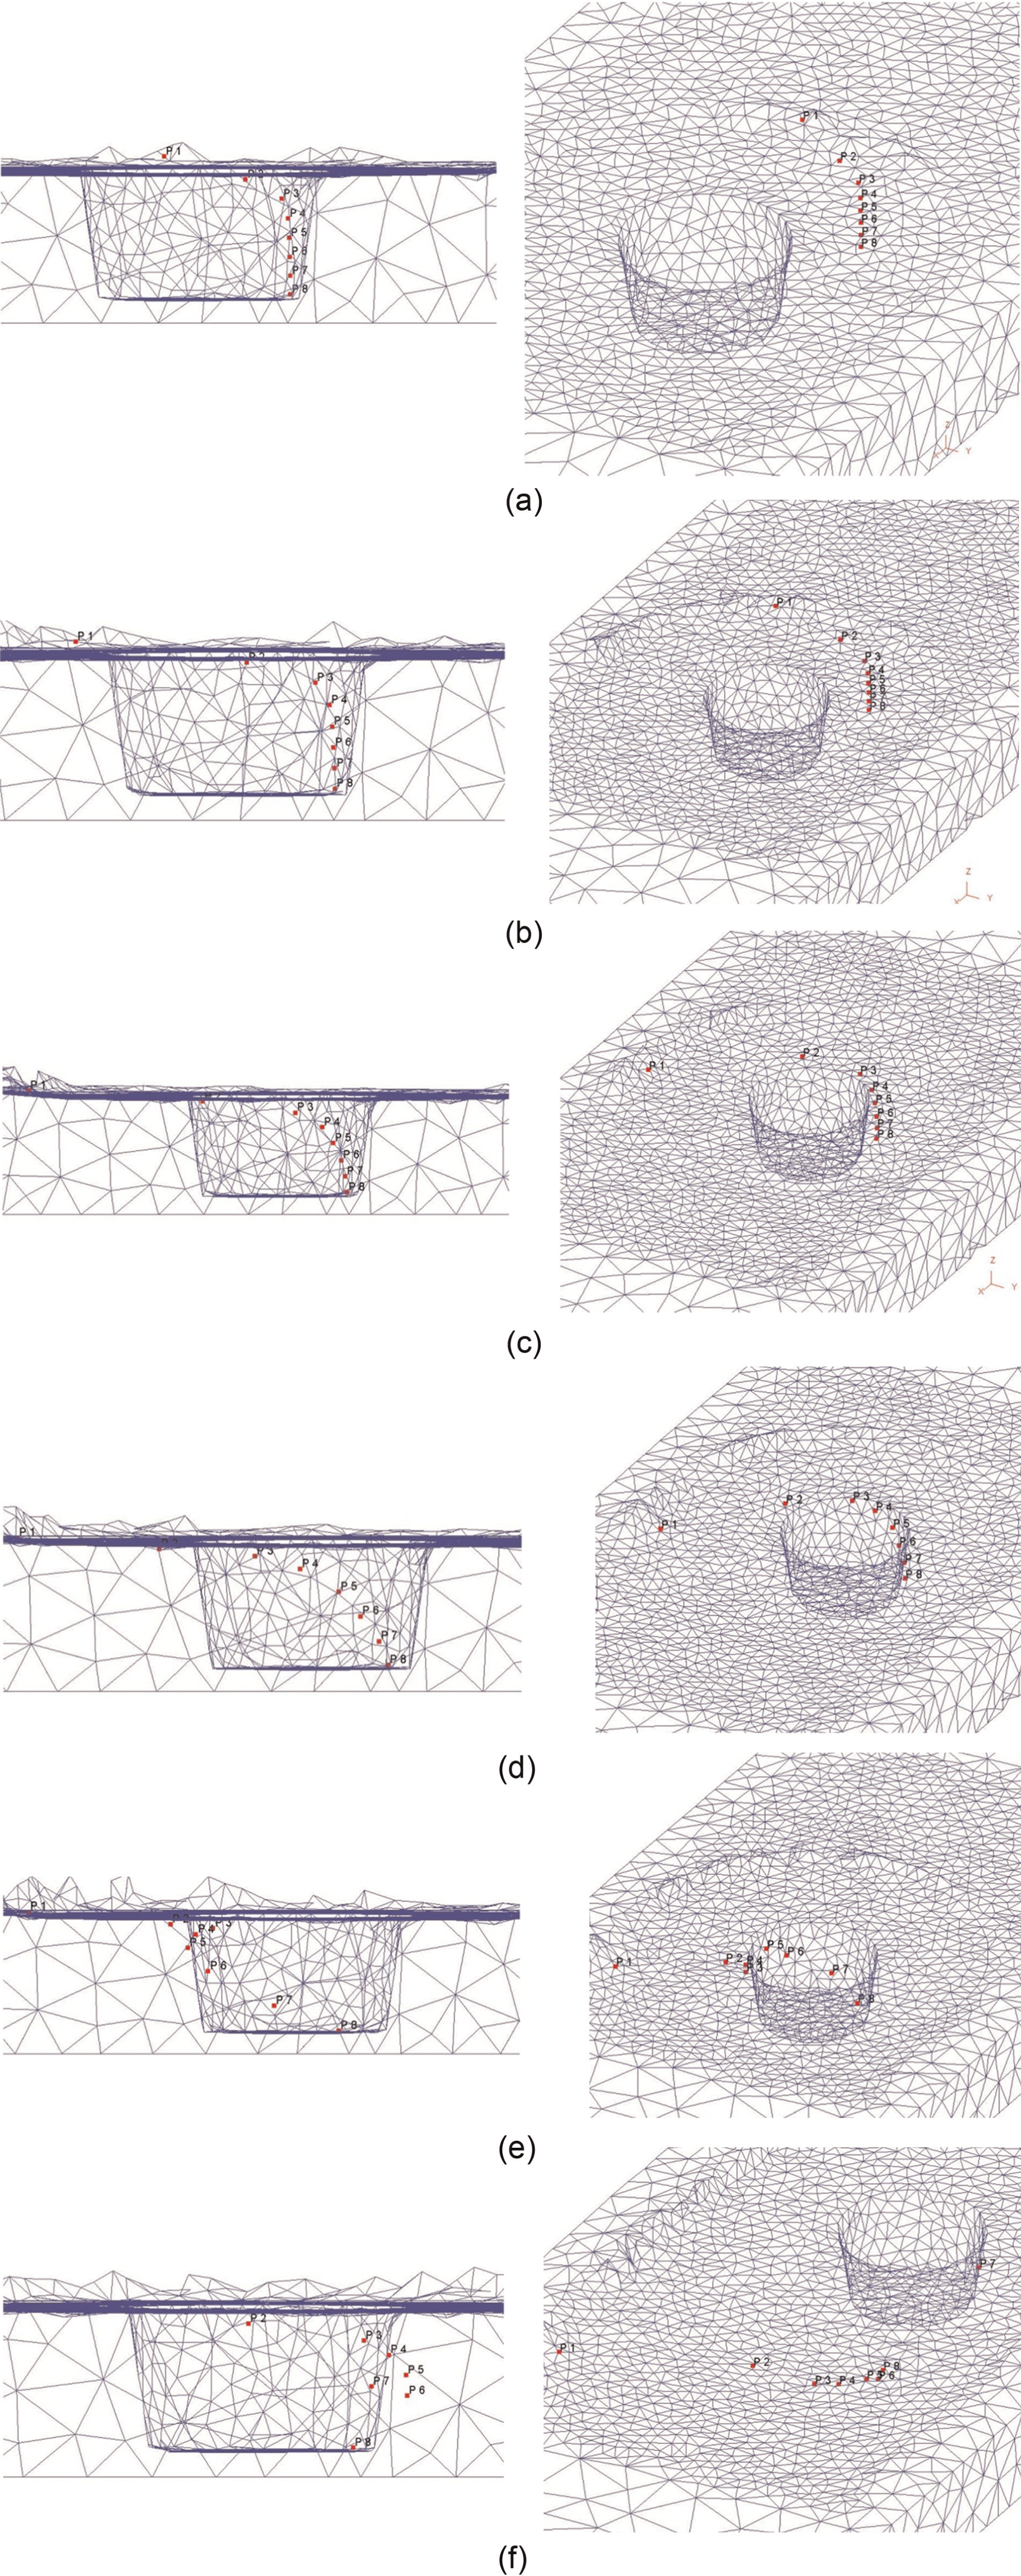
Figure 10 shows the material flow pattern on the centre of weld. Figure 10(a)–(d) shows the position of those points as the time elapses. Figure 11 shows the final position of the particles. Particle 1 starts to move around the pin with tool simultaneously towards RS. At initial stages of the process, it rotates in a zone with diameter more than that of pin, due to high stress and strain rate and severe deformation in the region exactly below the tool shoulder. However, as the process proceeds, it moves finally to a zone with a size equal to the pin diameter behind the tool pin. This behaviour is almost the same for particle 2, which was at first expelled from the region with size equal to the pin diameter, but finally, it resides in the same zone. It is interesting that these points reside finally behind the pin on the welding line and not behind the AS, which was reported in previous studies. 11 In fact, these particles enter the shoulder–workpiece interface, in a period of time and then are pushed into the zone with a diameter equal to the pin diameter. The lower particles including No. 3–No. 8 showed partially the same flow behaviour; however, these particles always move near/inside the zone with a diameter equal to that of pin. These points reside behind the pin, near joint line, and form an asymmetric flow pattern with other points. The interesting point is point No. 6, which showed a completely random flow manner. Also, this point is the only point that resides on the AS. The complicated material flow behaviour in FSW process is the reason for this case. Another important observation is that the height of the particles does not change considerably.
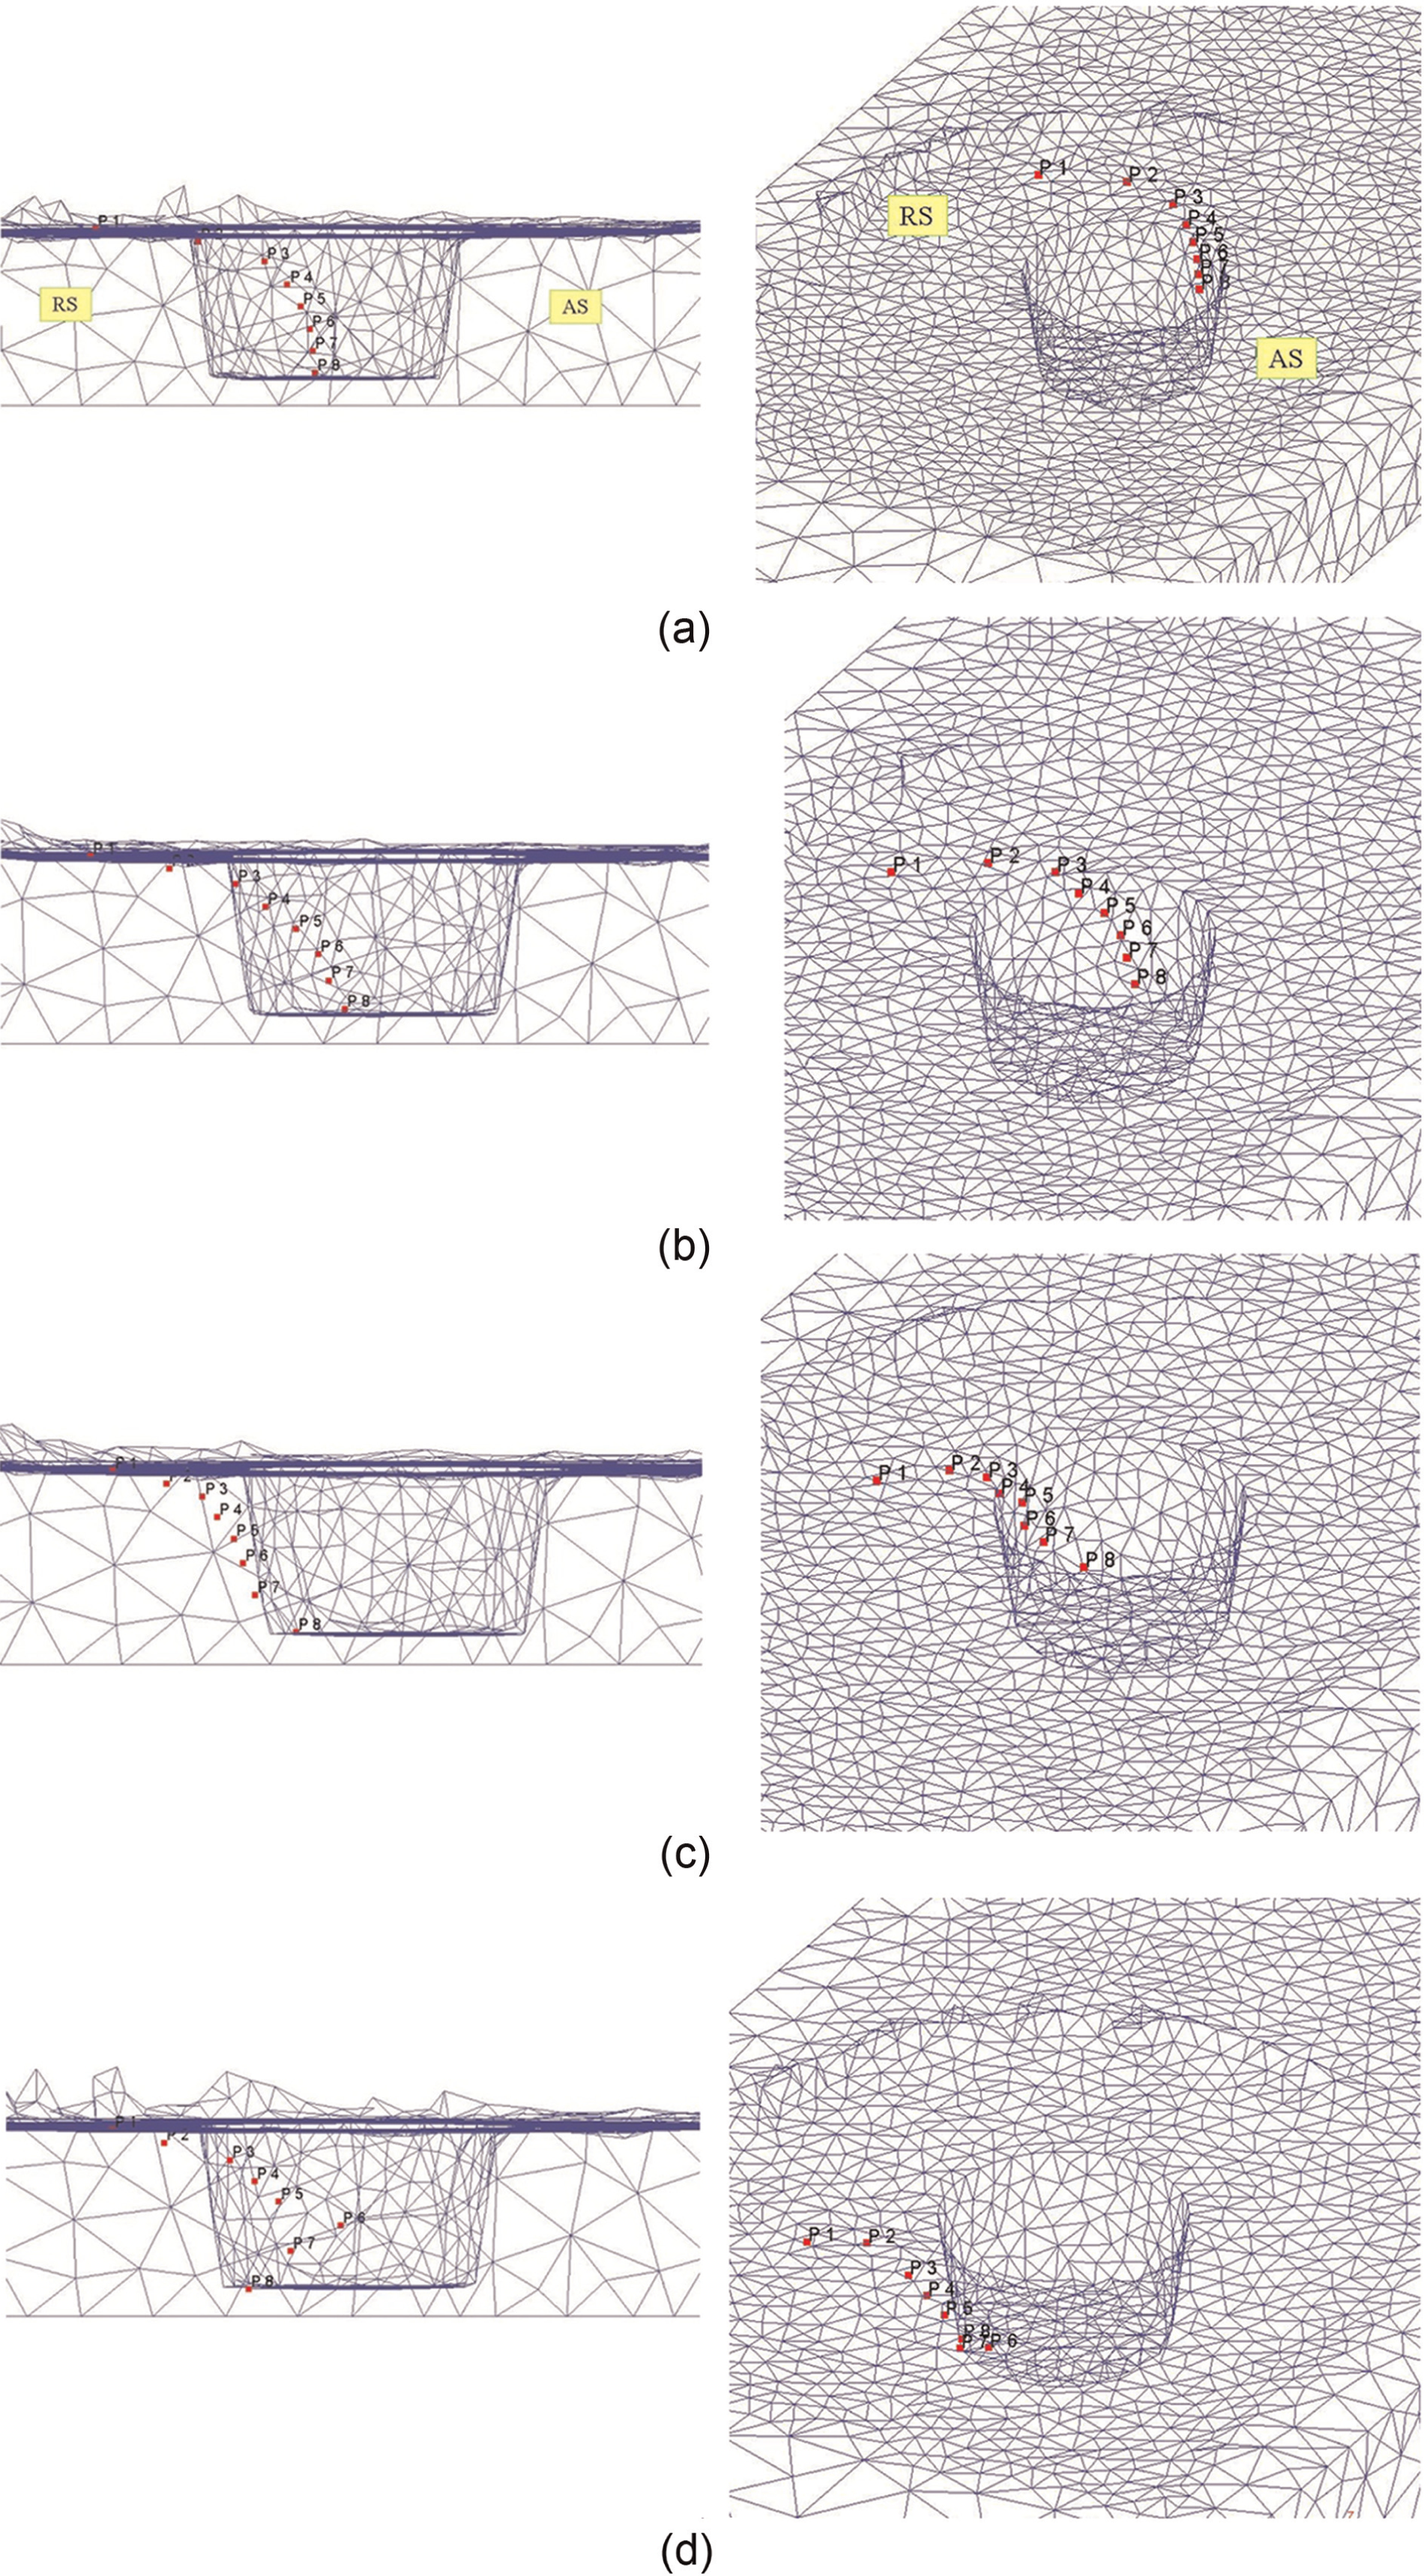
Material flow pattern on the centre line with tool advancing.
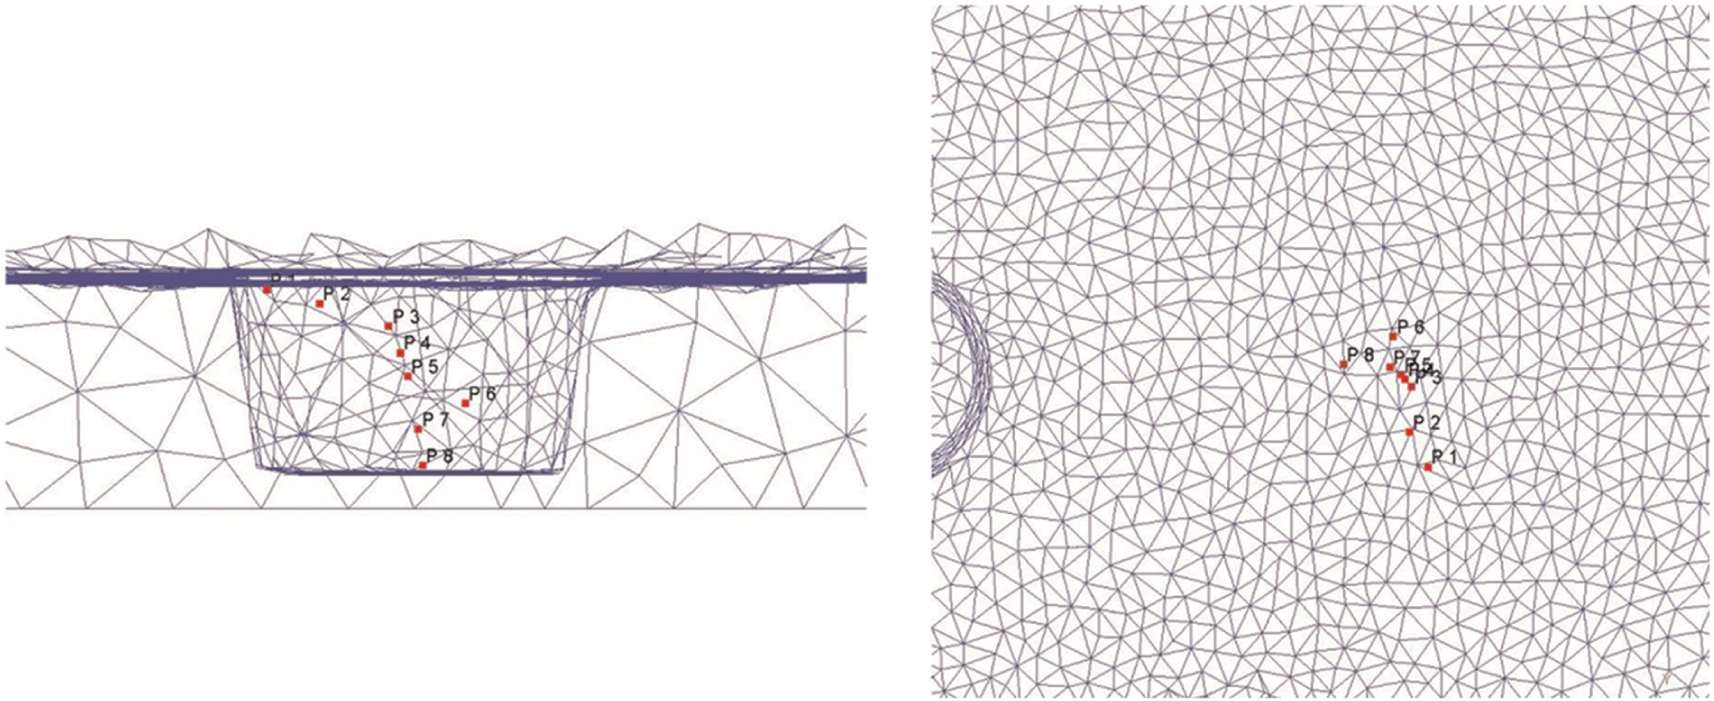
Final position of centre line points.
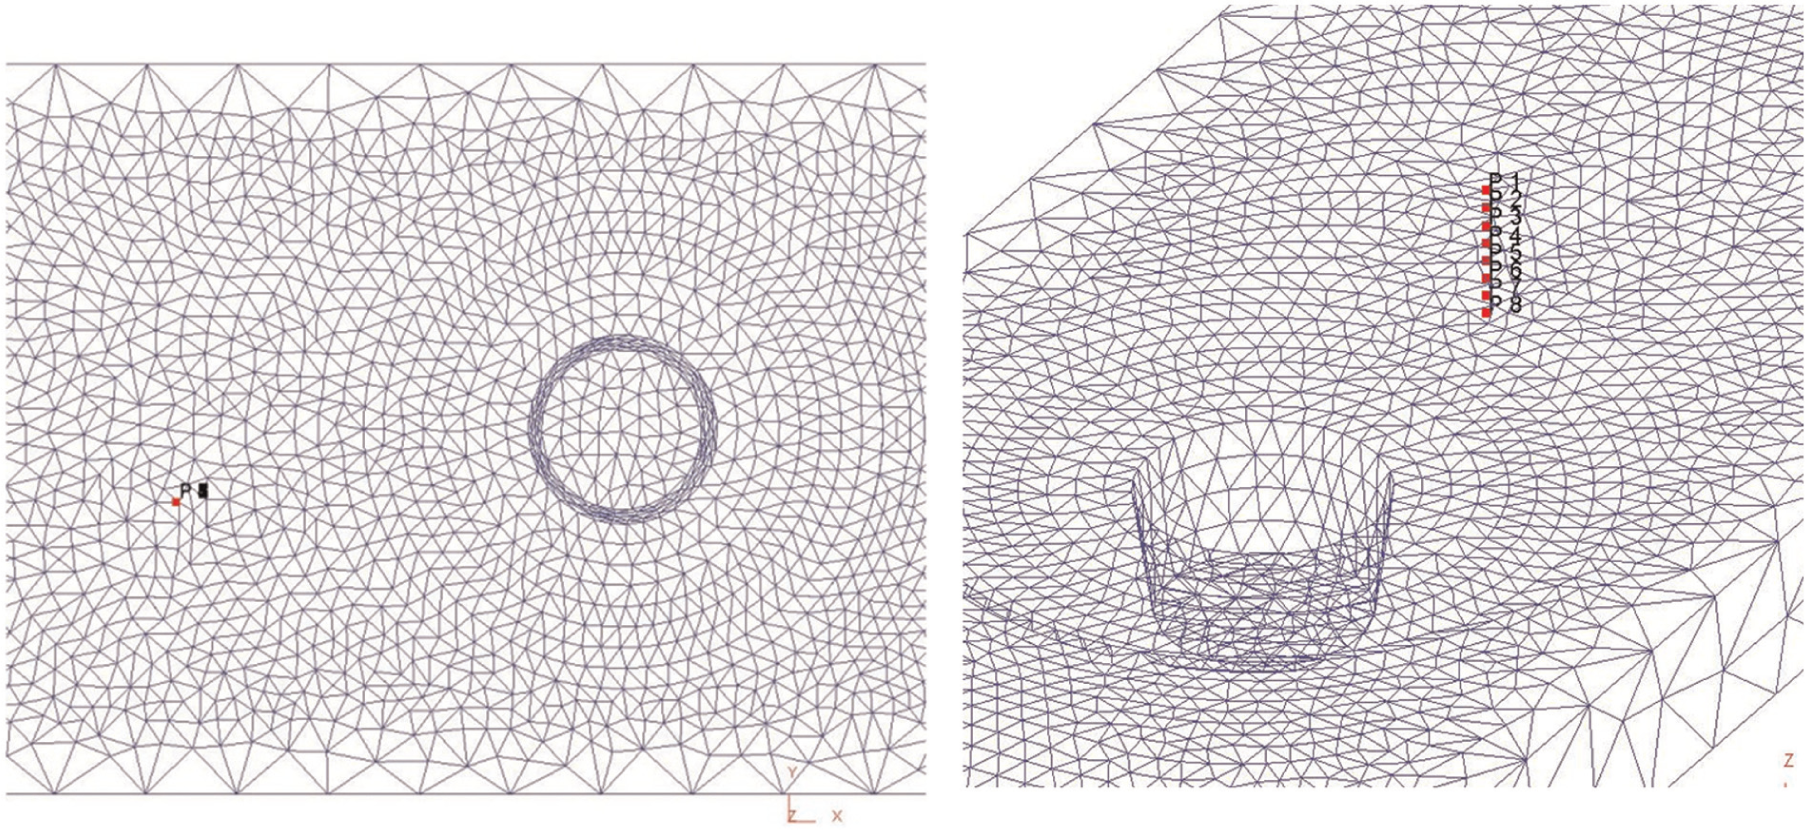
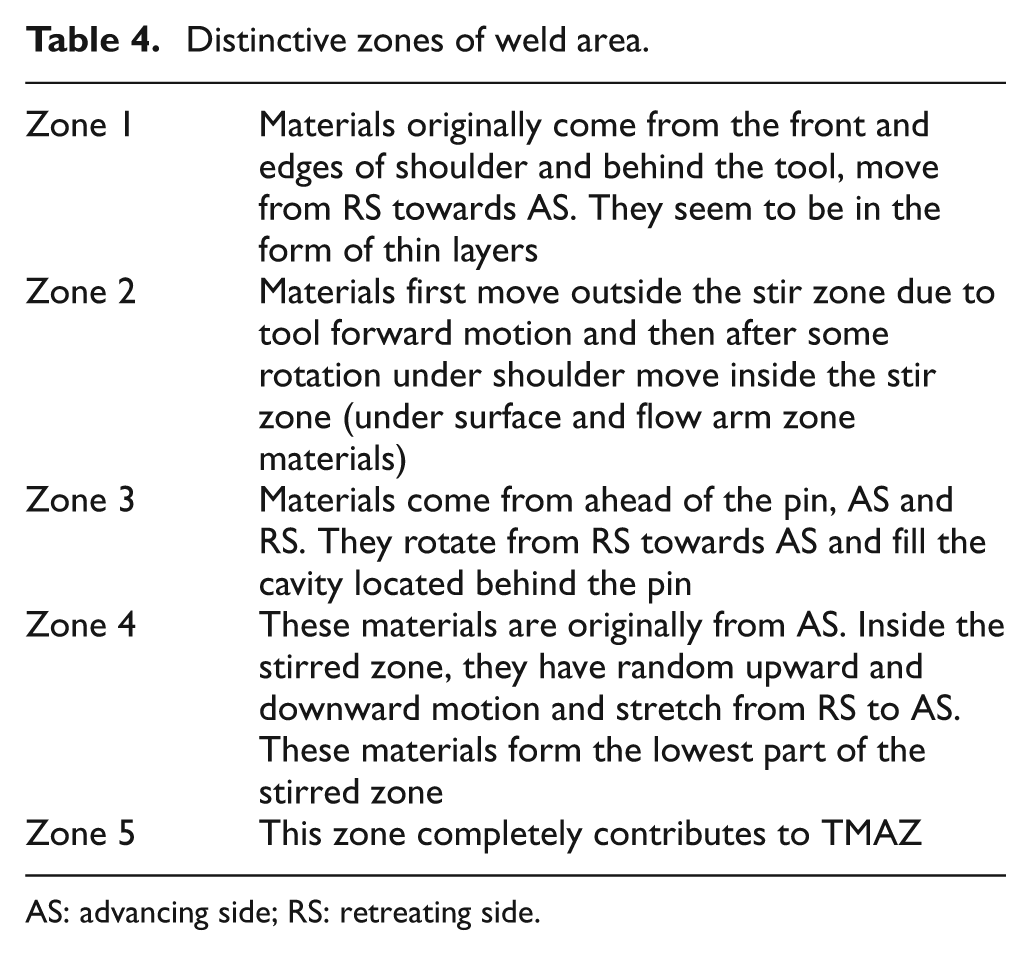
Material flow pattern on the AS is shown in Figures 12 and 13(a)–(f). Figure 12 illustrates the initial position of eight particles in the AS with 0.5-mm increment in depth from the top surface, and Figure 13(a)–(f) illustrates the position of the particles as the time elapses. Motion of the particles near the surface (P1 and P2) is mostly affected by tool shoulder and that of lower particles is mainly affected by tool pin. In fact, the force generated by shoulder is the key factor for material flow pattern in the zones near the surface, and the force generated by tool pin is the key factor for material flow pattern in the lower zones. Similar to the centre line particle flow mechanism, the particles near the surface (P1 and P2) move swiftly with shoulder (especially P1), as shown in Figure 13(a)–(c). Thus, they rotate along with the shoulder, and as tool proceeds, they speed down (Figure 13(d) and (e)) and finally reside behind the pin on the RS. Their motion in z-direction is very negligible. The lower particles start to rotate slightly, and as the tool moves forwards, their up-and-down motions occur. Behind the pin, they rotate from RS towards AS and finally reside near the joint line on the AS. The material flow mechanism on the AS has some difference with that of the centre line particles. First, some upper particles (P1) finally reside in a zone larger than the zone with size equal to the pin diameter. Second, they move upwards and downwards. Figures 14 and 15 show the initial and final positions of the particles, which were selected from the RS. All particles finally reside on the RS. An important observation from material flow mechanism on the centre, AS and RS is that all materials finally reside in a zone near the welding line. This illustrates that in FSW of copper, the stirred zone does not lean towards any sides of the welding line. This is in agreement with experimental macro photography of stirred zone in FSW of copper, which is illustrated in Figure 16, whereas it is completely different for Al alloys, in which the stirred zone leans towards the AS. 11 Based on the material flow mechanism characterized earlier, the stir zone in FSW can be classified into five distinctive zones, as shown in Table 4.
Initial position of the particles on the AS that has been selected for material flow pattern.
Material flow pattern on the AS with tool advancing.
Initial position of the particles on the RS that has been selected for material flow pattern.
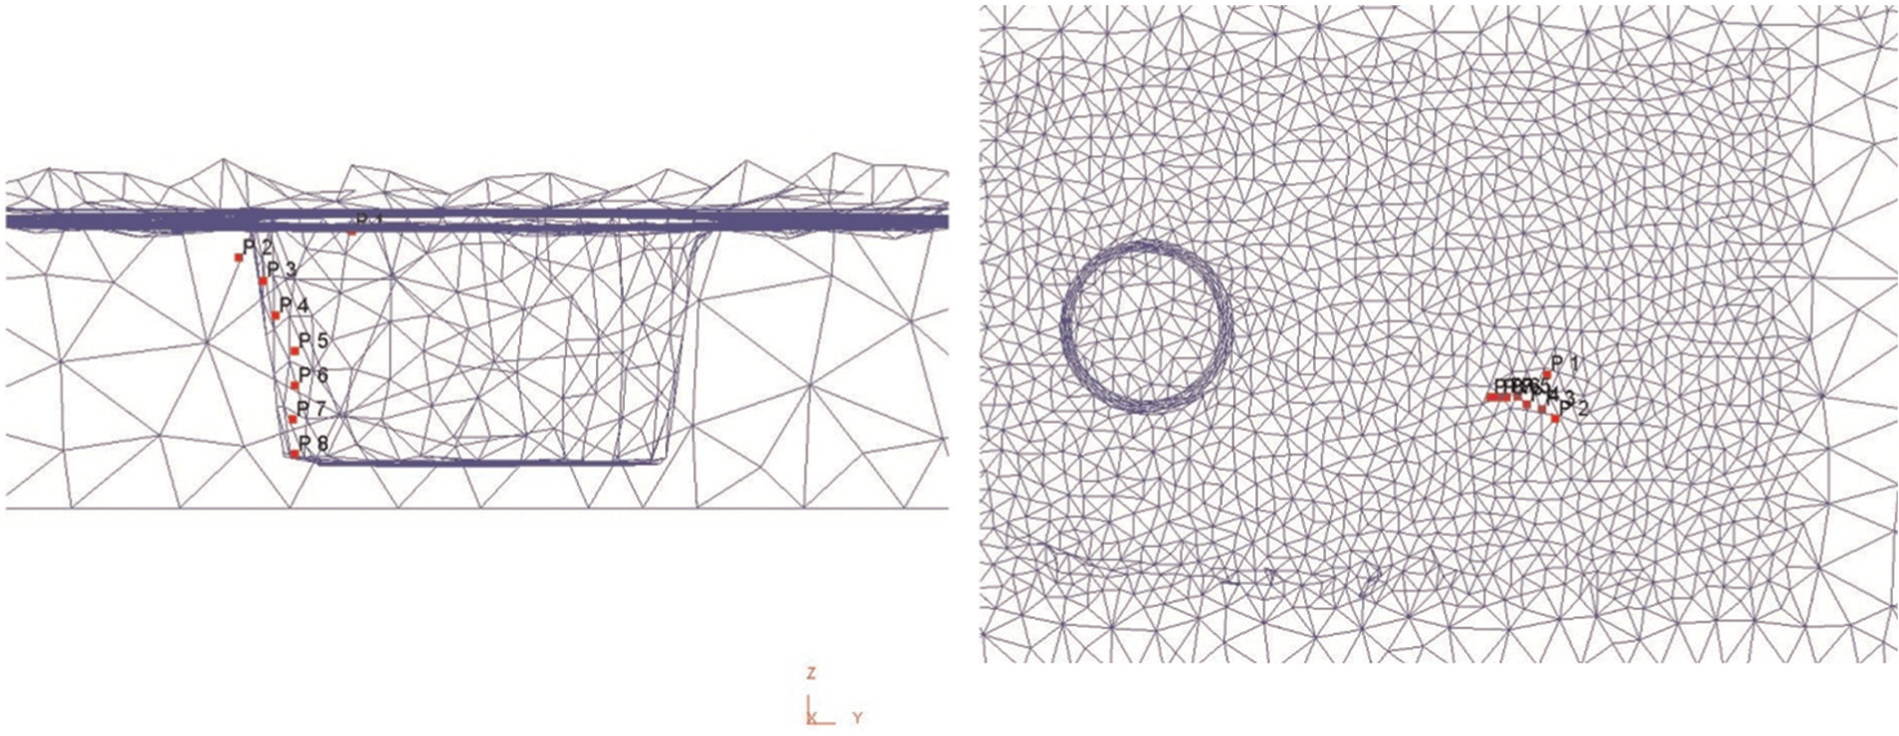
Final position of the particles on the RS that has been selected for material flow pattern.
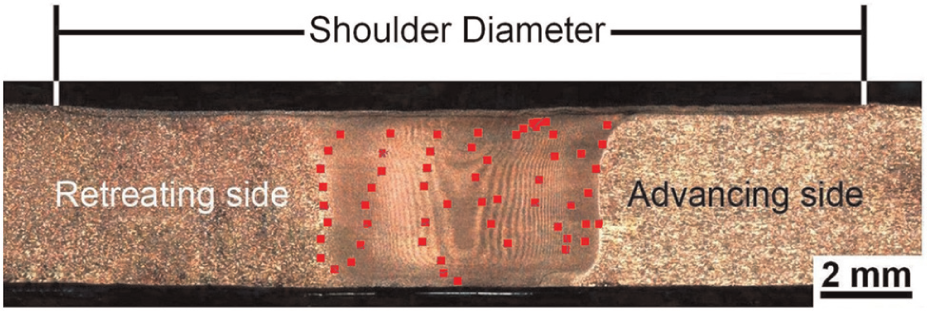
Macrostructural photography of fiction stir welded copper.
Distinctive zones of weld area.
AS: advancing side; RS: retreating side.
Conclusions
This study deals with numerical investigation on material flow pattern in FSW of a copper alloy. The main highlights are the following:
Temperature and strain distributions are not symmetric around the welding line.
Increase in the Zener–Hollomon parameter leads to a finer microstructure.
In FSW of copper, the stirred zone does not lean towards any sides of the welding line completely. This case is completely different for Al alloys.
Based on the material flow mechanism, the stirred zone in FSW can be classified into five distinctive zones.
Footnotes
Declaration of conflicting interests
The authors declare that there is no conflict of interest.
Funding
This research received no specific grant from any funding agency in the public, commercial or not-for-profit sectors.