
Abstract
This study aims at predicting the states transition of customer requirement to support product development department to generate products for future markets. Customer requirement analysis has long been recognized as one of the most crucial activities for the success of product development due to its significant impact on the downstream development activities. However, dynamic states transition of customer requirements has received less research attention. Most of researches only focus on static customer requirement analysis, which is not proper for developing competitive products in rapid changing market today. In order to manipulate this problem, a novel integrated approach for predicting customer requirement states is proposed. The novel approach integrates the strength of Kano model in customer requirement classification, the advantage of grey theory in trends prediction with fewer data and the merit of Markov chain in modeling local fluctuations of prediction. Finally, an application in prediction of customer requirement states for a mobile phone is provided to demonstrate the potential of the method.
Introduction
New product development (NPD) in the manufacturing company is an important activity including many risks and uncertainties (e.g. undesirable delays in schedules, market volatility and competition) due to highly turbulent market. Customers are the key source of information to reduce uncertainties inherent in NPD projects. 1 Customer requirement has significant impact on the downstream development activities, for example, product specification, product design, tool design, and so on. 2 Thus, customer requirement is the basis of product development. Understanding and fulfilling customer needs is one of the principal factors for product design and development to succeed in the market place.3–5 To well fulfill the current and future customer requirements, companies have to know the transition regularities of customer needs, and design the product with attributes that customers really need and expect. However, customer preferences, tastes and needs are in fast evolution in the 21st-century market. Customer requirements may vary in the temporal space between product conceptualization and market introduction. 6 The “attractive customer requirements” may gradually become “expected” even “must-be” attributes. 7 In this respect, the company’s product might not meet the customer needs as originally anticipated. For example, design specifications are usually frozen prior to production. Once customer requirements shift substantially without any prediction during the period between design freeze and market introduction, the final products may not satisfy the customers as expected. And, undesirable delays in schedules may also result if companies react to changing requirements by modifying design specifications to satisfy the changed customer requirements. Design changes made during the later phases can be very expensive. 8 Unfortunately, some companies are often hindered in customer requirements research by their limited resources and experience. 9 Furthermore, the traditional methodologies focus only on current situation and often do not contribute to the correct evaluation of future customer requirements. 6 In this respect, it is necessary to forecast the dynamic transition of customer requirements proactively to lower the inherent risks in developing products for fast shifting markets.
Therefore, this work is expected to explore the possibility to design a new integrated approach, which could well predict the transition trends (evolutions) of customer requirements. To well reflect the future trend of customer requirement, the authors integrate the strength of Kano model in customer requirement classification, the advantage of grey theory in trends description, and the merit of Markov chain in modeling local fluctuations of prediction. The final forecast results in the form of point estimation with interval and probability being more reasonable and accurate. With forecasting results from the proposed method, companies could know well the complex and rapidly changing states of customer requirement in advance, and design the right product at right stage to meet customer demand or even exceed their expectation to enhance customer satisfaction and loyalty. Furthermore, forecast of customer requirement states with the proposed approach may also help companies to well understand the psychological and behavioral characteristics of each market segment, and develop precise and effective marketing strategies in the new product introduction phase. To our knowledge, there is no method, or integrated method, to predict customer requirement state transition in the literature, until now.
The remainder of this article is organized as follows. Related works about Kano model, forecasting methods of customer requirement, and grey theory and Markov chain model are presented in section “Related work.” The suggested approach, which is an integration of Kano model, grey theory and Markov Chain, is explained in section “Customer requirements prediction with grey–Markov chain.” Then, the proposed approach is illustrated with a case study of the mobile phone in section “Case study: customer requirements forecast for mobile phone.” In section “Conclusion and suggestions,” conclusion and suggestions are remarked.
Related work
Kano model and customer requirements states
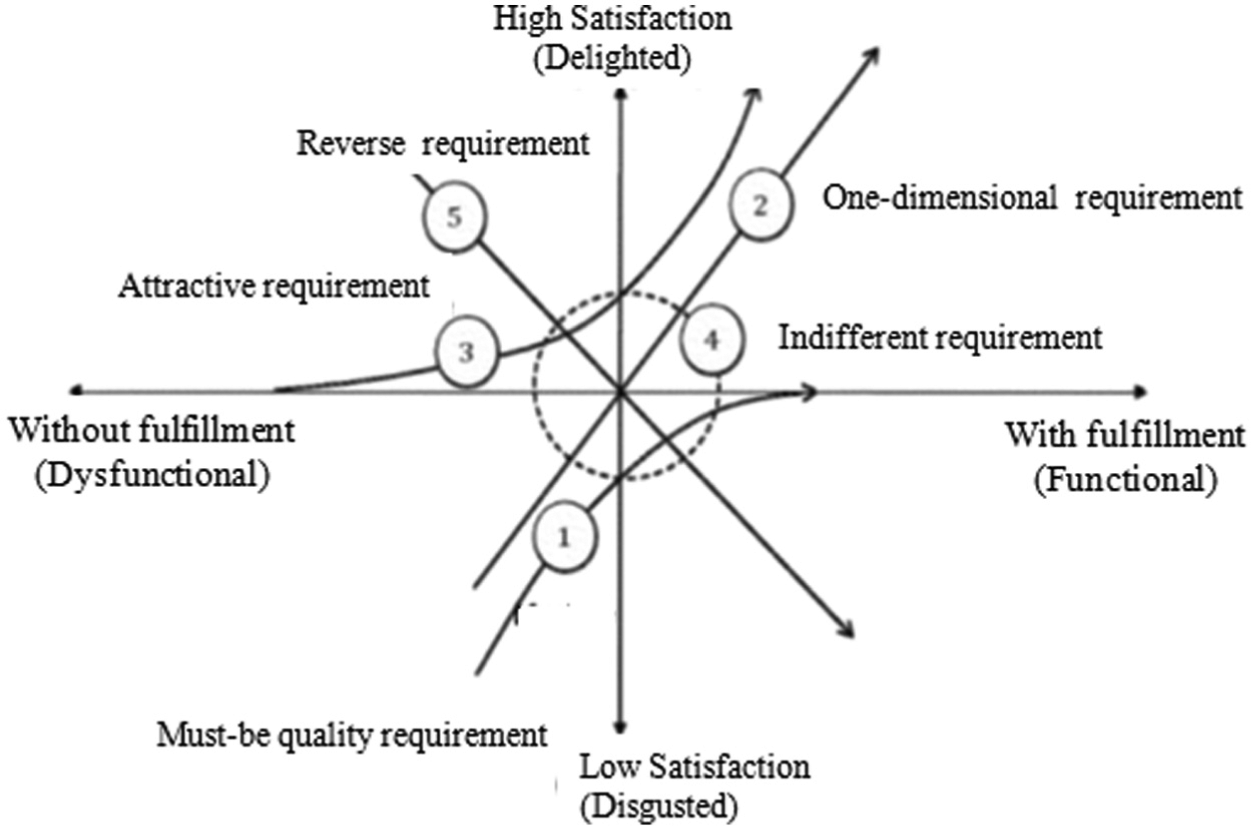
Inspired by the Herzberg’s Motivator-Hygiene Theory 10 in behavioral science, Kano et al. 7 studied the relationship between the product attribute and customer satisfaction to build a customer requirement classification model, namely, the Kano model. The publication of “Attractive Quality and Must-Be Quality” 7 marks the establishment of Kano Model theory and maturity of the attractive quality theory. Figure 1 shows Kano’s two-dimensional model, which reveals the relationship between the product attribute (customer requirement) and customer satisfaction.
Kano’s customer requirement classification model. 10
According to Kano et al., 11 customer requirements can be classified into five states (categories) based on the analysis of relationship between customer satisfaction and customer requirement fulfillment, that is, (1) must-be requirement (M), (2) one-dimensional requirement (O), (3) attractive requirement (A), (4) indifferent requirement (I), and (5) reverse requirement (R) (see Figure 1). Customers take “must-be” requirement fulfillment for granted. However, if the product does not meet this basic demand sufficiently, the customer may become very dissatisfied. As for the “one-dimensional” customer requirements, customer satisfaction is proportional to the level of fulfillment of this requirement—the higher the level of fulfillment, the higher the customer’s satisfaction and vice versa. “One-dimensional” is often used by companies to promote the product or service in the business competition. 12 However, “attractive” requirement (A) fulfillment could make customer become satisfied, but the customer can also accept the product without fulfillment for it is not expected by customers. 13 Customers may even be unaware of such product or service features. Obviously, in terms of attractive attribute, it is easier to exceed customer expectation, cultivate customer loyalty, and create competitive advantage. The “indifferent” requirement (I) refers to that the customer is not much interested in the feature, whether it is present or not. “reverse” requirement (R) means that the customers do not like the product attribute but expect the reverse of it. In the last two decades, the Kano model has received attention of researchers and practitioners in strategic thinking, business planning, and product development to provide guidance for product innovation, competitiveness, and product compliance, marketing, quality evaluation and control, and so on. 14 However, it is more of a classification method of customer needs, and it is inadequate in forecasting future customer requirements states.
In fact, the attribute that delights customer now may become unexpected in the near future. However, designers could not identify future state of customer requirements from the Kano model due to its lack of dynamic forecasting mechanisms. One customer requirement type can turn into another customer requirement over time (e.g. A→O→M→I). Based on empirical evidence from industry of remote-controller for television set, Kano 15 proposed that customer requirement followed certain life cycle, for example, indifferent→attractive →one-dimensional→must-be. Witell and Fundin 16 confirmed that e-service once was considered as an indifferent attribute before it became an attractive one, because ordinary people could not enjoy e-service, which belonged to a high-tech service at that time. Goh 17 pointed out that a Critical-to-Quality valid today is not necessarily a meaningful one tomorrow. Bergman and Klefsjö 18 also believed that the customers tomorrow will have different needs and expectations from that of present customers. Calantone and Sawyer 19 manifested the changing of consumer needs over time by demonstrating the instability of market segments. In addition, several investigations into the relationships between customer requirements and customer satisfaction in different phases of a markets evolution, 20 consumption process, 21 and customer relationship 22 have suggested that customer requirements, as well as customer satisfaction are all in the changing process. Thus, it is important to take into account dynamic customer requirements when using Kano’s model to collect the voice of customers (VOC). 23
Forecasting techniques for customer requirements
Some forecasting techniques have been developed to predict future customer needs in the macro level, but there are few methods for prediction of customer requirements states from a more specific respect, that is, the customer requirement inherent transition at different stages. Xie et al. 24 used method of double exponential smoothing to predict the importance levels of the requirements. However, determining the smoothing coefficient α in the method needs much subjective experts’ experience, which may lead to large sampling errors. The method is also limited to linear trend forecast. Shen et al. 25 proposed a method that involved seeking customers’ opinions on their future requirements. They exploited fuzzy trend analysis to forecast future VOC in Quality Deployment Development (QFD), but they took few considerations of external factors, which often leads to greater deviations of prediction when environment changes. The soundness of the results also hinges on the sampled customers’ abilities to forecast the population’s future requirements. Raharjo et al. 26 developed a method to prioritize quality characteristics satisfying future customer requirements in a dynamic QFD. But the method does not generate future customer requirement information. Also, Raharjo et al. 27 used compositional double exponential smoothing method to describe how future uncertainty in the weights of customer needs may be estimated and transmitted to the design attributes. In order to help companies to plan customer requirements in advance, Wu et al. 28 proposed a grey theory–based model to analyze future customer requirements that required only four past data points. Although grey theory is simple, practical, and accurate in prediction, its forecast error is relatively large when the sample data fluctuate too much. Wu and Shieh 29 applied Markov chain analysis in QFD to analyze customer requirements from probabilities viewpoints, but Markov chain requires the state having no after-effects and being of a smooth process. Shieh and Wu 30 applied a hidden Markov chain model in QFD to analyze dynamic customer requirements from probabilities viewpoints, which has oversimplified assumptions. To lower the inherent risk in developing products for fast shifting markets, Chong and Chen 31 used the principles of artificial immune and neural systems to forecast changing customer requirements, and defined a customer requirements analysis and forecast system for future markets. However, constructing a suitable network structure requires much expert knowledge. Chen and Wang 2 integrated clustering techniques and grey theory in trends analysis of dynamic customer requirements and functional requirements on the basis of consistency analysis of customer groups and product feature clusters. Clustering technique can help to get intuitive, concise conclusions, but it is difficult to obtain the clustering conclusion with the sample of larger size. Zhou et al. 32 proposed a fuzzy analytic network process (F-ANP) for measuring the customer service preferences. However, determination of the weight of index is more complex because the approach takes into account all the interactions between targets and feedbacks. Chen and Yan 33 analyzed customer preferences over a range of product options using radial basis function neural network. Ha 34 proposed a knowledge engineering technique to analyze and predict the shifting of customers across market segments.
Grey theory and Markov chain model
Grey theory, first proposed by Deng, 35 is mainly used for modeling uncertainty problems and incomplete information in analyzing systems. The grey theory is always adopted in the area of systems analysis, prediction, decision making and control and so on.36–39 According to the Deng, 40 in the field of information research, the black and white color represent that the information is completely unknown or clear. While the colors between black and white indicate systems that are not clear, such as social system or weather systems. The prediction model based on the grey theory uses a grey differential model to generate data series from the original data series of a dynamic system. The data series generated by the grey prediction model are converted back to the original data series by a reverse procedure to predict the performance of the system. Since the generated data series are more coherent than the original ones, the accuracy of the modeling is enhanced. Besides, the grey theory could find the information from the given data set, and mathematical manipulation of the grey theory prediction method is easily operated. It does not need to make strict assumptions about the data set, and it can be applied when the data set is as small as four. This simplifies data collections and allows for timely predictions to be made. The GM(1, 1), a single variable and first-order grey model, is most frequently used in grey prediction. 41 In GM(1, 1), the former “1” means one order and the latter “1” means that the model has one parameter, which often represents time interval. The grey model arrays the original data to find the orderliness among data, and then, a prediction model on future requirements is established based on differential equation. The detailed procedure of GM(1, 1) can be referred in reference of Deng. 42 The grey forecasting model adopts the essential part of the grey system theory, and it has been successfully applied in finance, 43 integrated circuit industry, 44 and the air travel market. 45
Markov chain model is useful in studying the system evolutions often in successive time periods when the system state is uncertain.46,47 Markov chain model is often used to study the behavior of certain stochastic systems. 48 It has been widely applied in market share analysis, customer loyalty, university enrollment prediction, and machines’ breakdowns. Markov process models assume that the system starts in an initial state that will be changed over time. Predicting these future states involves knowing the system’s probability of changing from one state to another. Transition probabilities, presented by the matrix, are used to describe the manner in which the system makes transitions from one period to the next. The matrix of transition probabilities is a matrix of conditional probabilities of being in a future state given a current state. 47 For readers who are less familiar with the Markov chain, Grinstead and Snell 49 provided a good explanation of the model.
Predicting the customers’ requirements type includes not only the imprise, unknown, and uncertain information. External market environment varies with time. Customers’ preference and taste are usually different in different market segments at different life cycles of a product. Therefore, it is difficult to determine a definite value for customer requirement in the real situations. In this respect, the customer requirement prediction is a grey system in nature. Thus, it is feasible to apply GM(1, 1) model to forecast future customer requirement types. However, the grey model prediction accuracy is lower when there are a lot of data fluctuations. On the contrary, the Markov chain model makes use of the transition probabilities to predict the evolution of stochastic system, which makes it suitable to predict the data sequence even with more fluctuations. Therefore, it is possible to integrate the grey prediction method and the Markov chain model together (namely, the grey–Markov chain) to forecast the future states of customer requirements.
Customer requirements prediction with grey–Markov chain
In general, customer requirements with different attributes (e.g. “attractive” and “indifferent”) are always not reflected in the conventional customer requirements analysis and prediction. This would lead to some customer requirements overestimated or underestimated. Furthermore, a large amount of customer requirement data are difficult to be acquired in the engineering practice, which would make it difficult to forecast the evolution tends of future customer requirements. Also, some fluctuations may exist in the transforming process of customer requirement. Therefore, it is necessary to develop a new prediction method to manipulate those problems. Kano model is a good static requirement classification tool but could not deal with the dynamic customer requirements transition. Forecast with grey theory is famous for its feature of requiring fewer data, easy operation, higher accuracy, and so on. However, grey theory is not efficient in processing sequence with fluctuations, which always leads to poor prediction accuracy. On the contrary, Markov chain theory can well reflect random fluctuations with transition probability matrix. Hence, this work is expected to first use grey theory model GM(l, 1) to describe future trends of customer requirements states from the Kano model. And then, Markov chain is exploited to predict the residual representing fluctuations in sequence of future customer requirements. Figure 2 shows the framework of the states prediction of customer requirement.
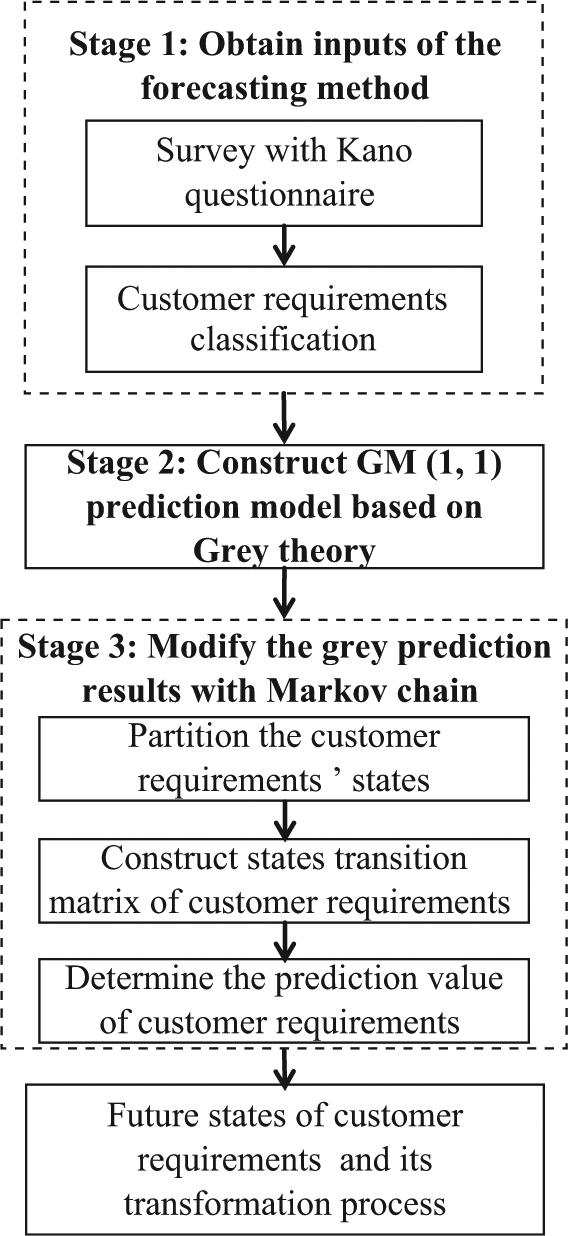
The framework of the states prediction of customer requirement.
Obtain inputs of the forecasting method
Customer requirements distribution T(CR m , k) is firsthand information from Kano questionnaire analysis, which is input of the model. T(CR m , k) stands for states value of the customer requirement “m” at time “k.” The following research is assumed to focus on certain selected customer segmentation (e.g. 18–25 years old, office workers), because focusing on certain customer segmentation would bring practical and specific guidance to industry. In this way, company is able to not only develop right products for right customer group but also develop more precise marketing strategies.
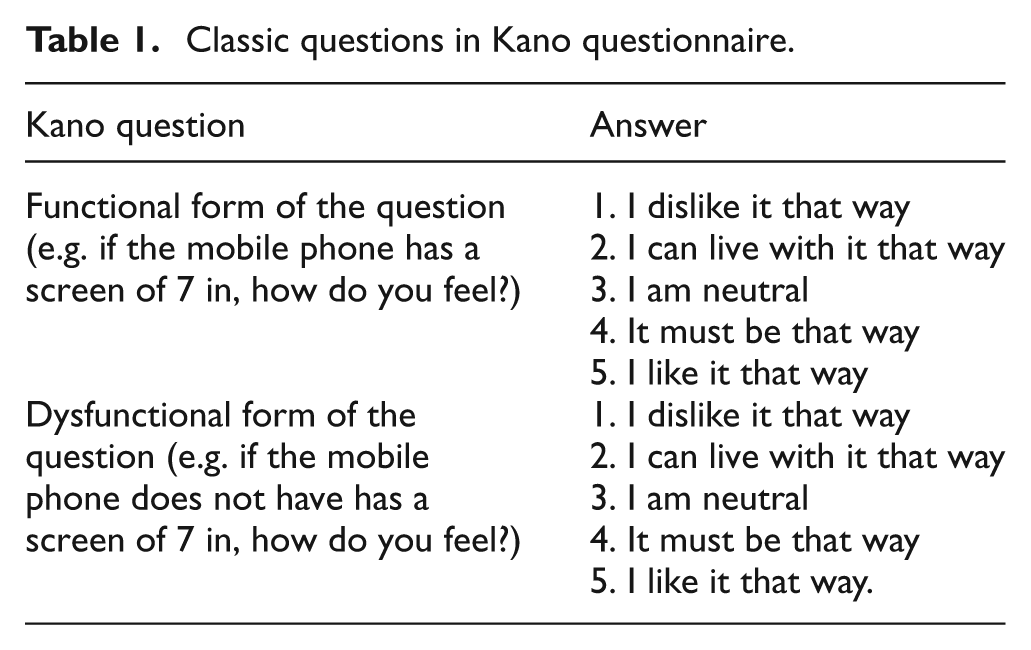
First, design Kano questionnaire based on the customer requirement of a particular product. Kano questionnaire (see Table 1) consists of questions both in functional form and dysfunctional form about customer requirements. For each part of the questions, customers are expected to select one of five alternative answers, which are described as “like,”“must-be,”“neutral,”“live-with,” and “dislike.” Then, select certain customer segmentation to conduct the survey.
Classic questions in Kano questionnaire.
In the second step, analyze data acquired from survey to get customer requirements states distribution according to Kano classification scheme (see Table 2).
Kano’s classification scheme. 10
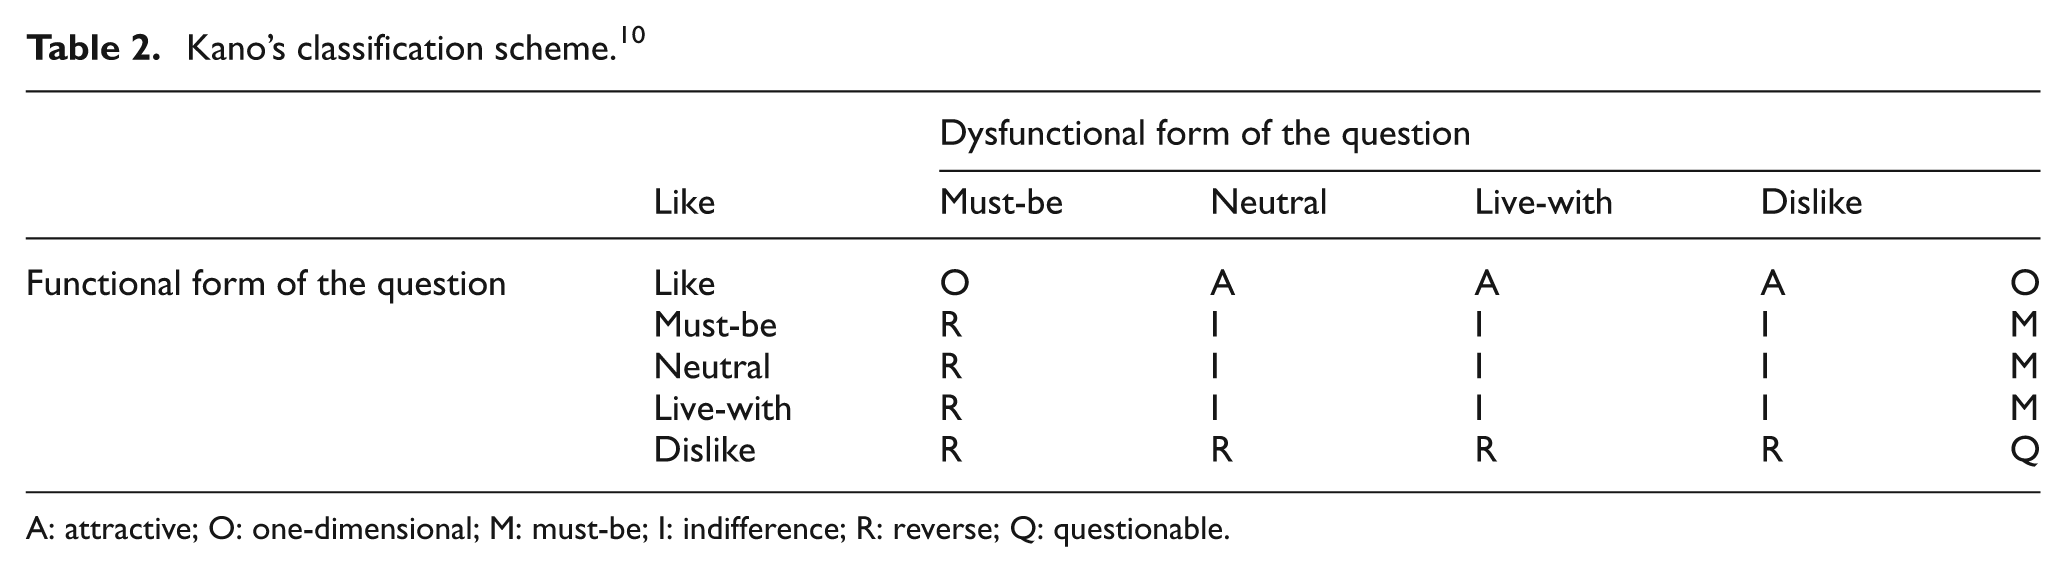
A: attractive; O: one-dimensional; M: must-be; I: indifference; R: reverse; Q: questionable.
Thus, we can get the distribution of customer requirements states T(CR m , k), for example, T(CR m , k) = {9, 35, 60, 10, 5, 1}, and we know that this customer requirement is in a state of “must-be” because 60 customers consider it as a must-be attribute.
Select suitable time interval for Kano survey according to characteristics of product, and repeat the above steps until the historical data are enough to forecast. Then, we get state distribution of different customer requirements in different past periods.
Construct GM(1, 1) prediction model for customer requirements states
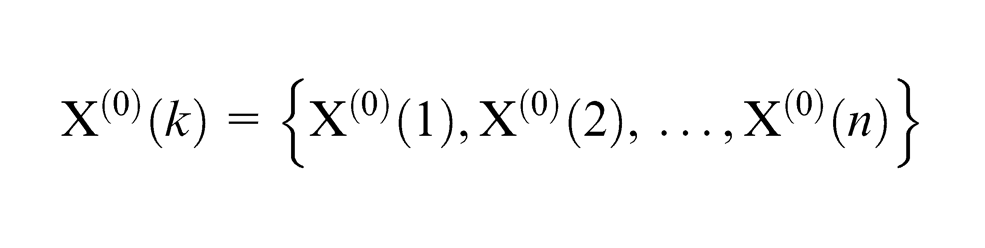
Assume the original nonnegative data series X(0) = {x(0)(1), x(0)(2), …, x(0) (n)}, n≥ 4. Use accumulated generating operation (AGO) to form a new data series X(1) = {x(1)(1), x(1)(2),…, x(1) (n)},
50
where
Then, we can derive the sequence of generated mean value of consecutive neighbors in the following, Z(1) = {z(1)(2), z(1)(3), …, z(1) (n)}, where
Then we get GM(1,1) model, a grey differential equation, as follows
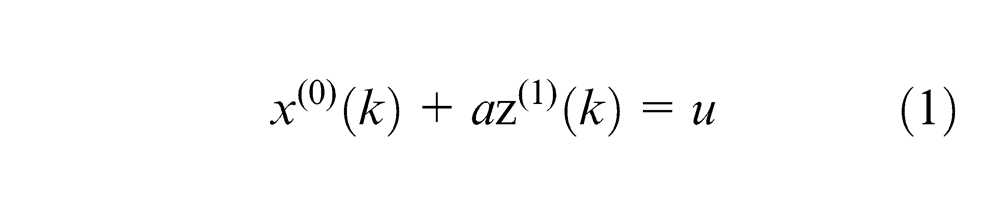
where a and u are grey parameters.
Since X(1) is monotonic increase sequence that is similar to the solution curve of first-order linear ordinary differential equation, the solution curve of following differential equation could represent the approximation of X(1)

where
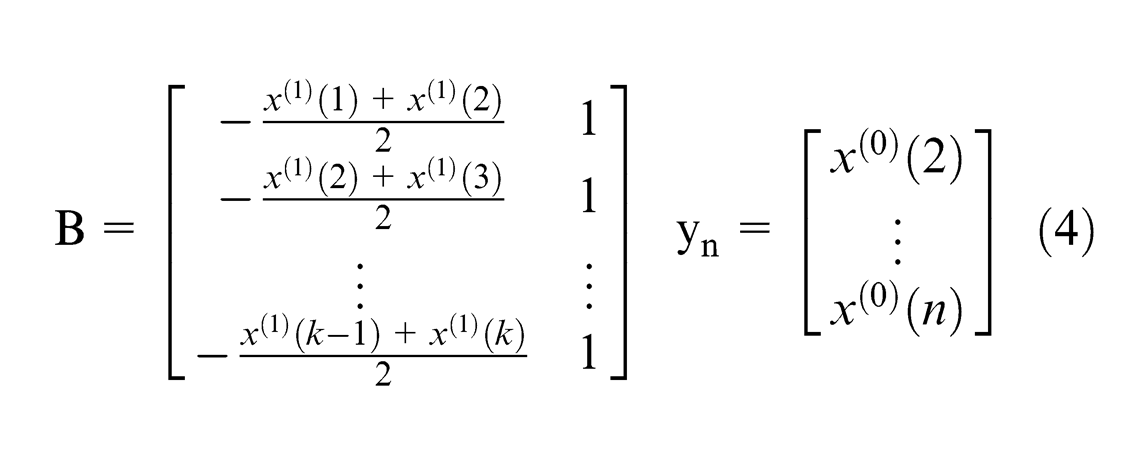
By using the least square method, 51 the model parameters a and u are
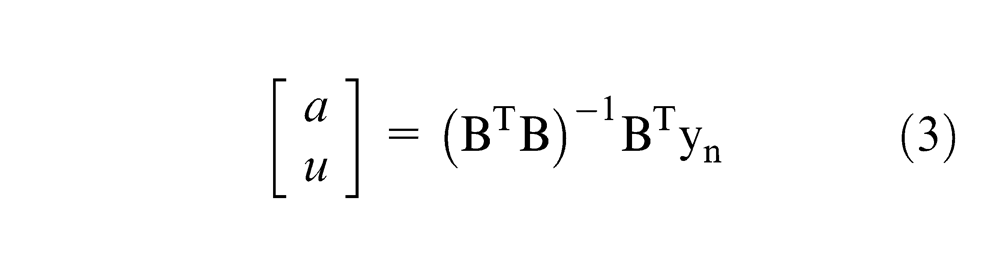
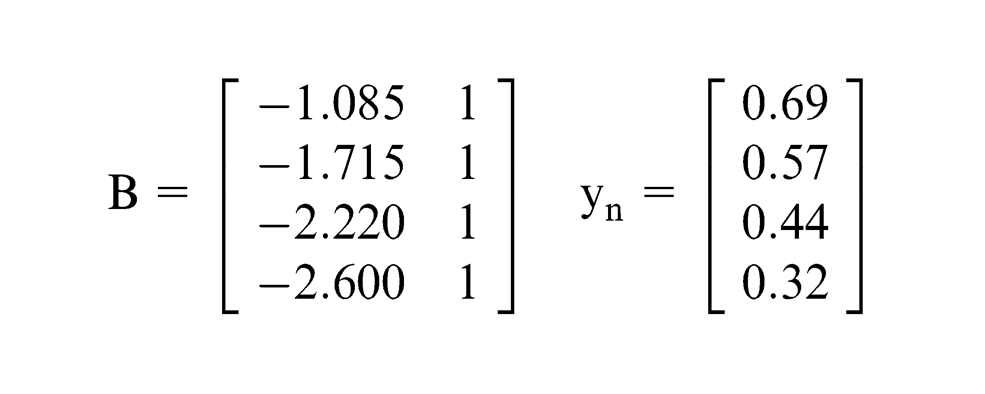
where B and yn are defined as follows
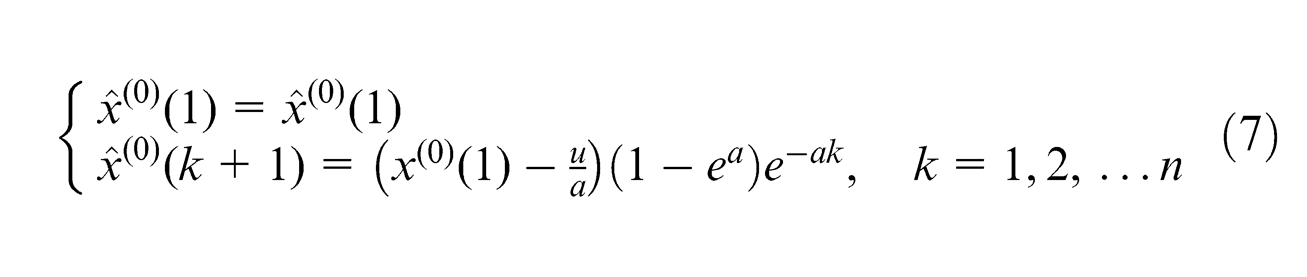
Solve equation (3) together with initial condition x(0)(1) = x(1)(1), and the particular solution is
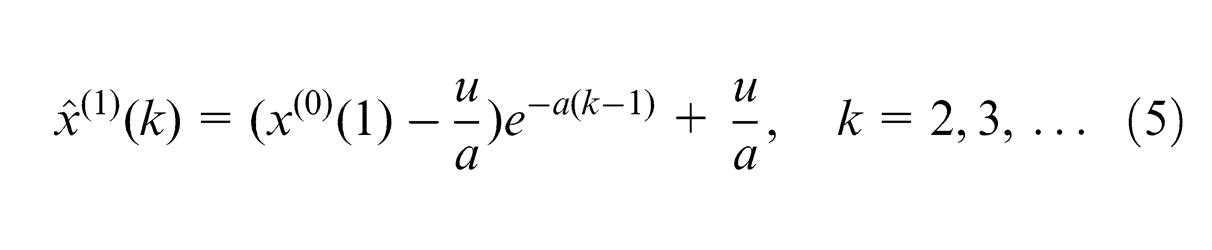
where ∧ represents grey forecast value, and cumulative reduction is conducted as follows
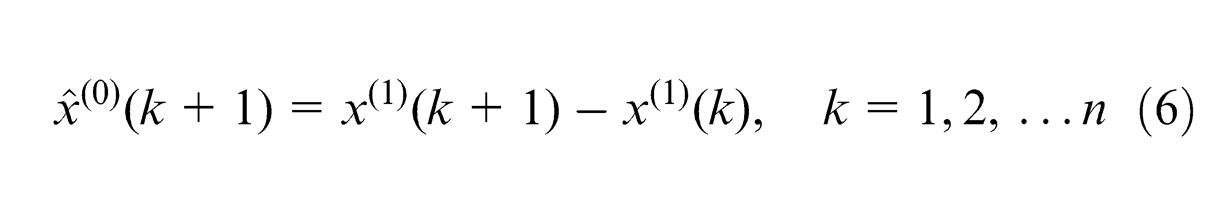
Then GM(1, 1) prediction value
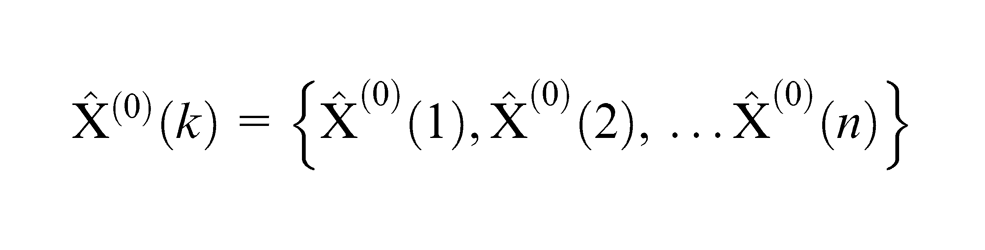
It is necessary to forecast each vector of customer requirements to get the future states distribution of customer requirements. Therefore, GM(1, 1) model is used similarly to predict trend of each vector, that is, must-be attribute (M), one-dimensional attribute (O), attractive attribute (A), indifferent attribute (I), and so on. Mathematical expressions for prediction values of customer requirement in future are as follows
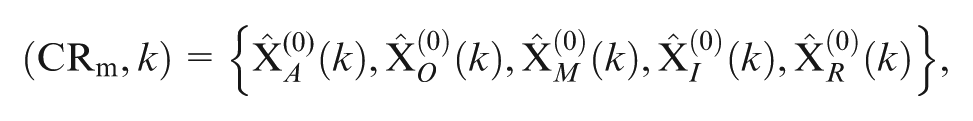
where k ≥ n
Modify the grey prediction results with Markov chain
Forecast based on the GM(1, 1) model is accurate in short-term prediction with fewer fluctuations. However, the prediction accuracy is lower when there are big variations in the sequence of historical data. Thus, GM(1, 1) model should be adjusted by Markov chain theory to obtain a more reasonable and reliable customer requirement prediction.
Step 1: partition the customer requirement’ states
Here, the authors only select one vector of the customer requirements distribution to illustrate the proposed forecast method. The other vectors of customer requirements could be obtained in the same way. The original data sequence of customer requirements distribution could be marked as
And forecast sequence with GM(1, 1) model is noted as
Therefore, the residual Δr(k) is calculated as follows

Then the residual sequence is partitioned into several states according to the mean
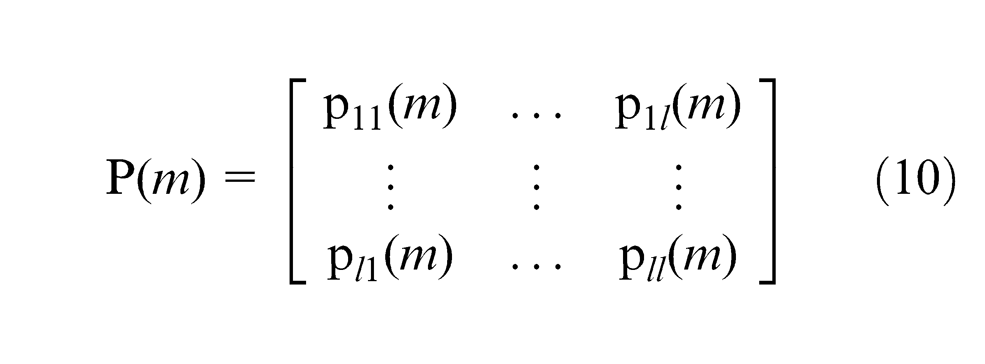
Step 2: construct states transition matrix of customer requirement
If
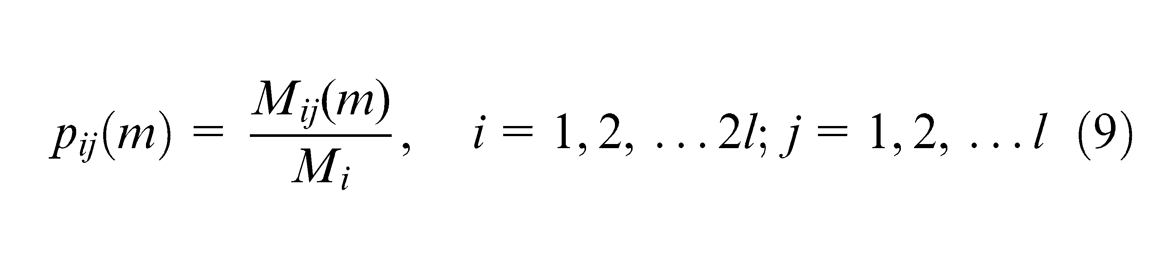
where
Residual state vector is defined as S(k) in the kth period, and then the probability vector of residual state in the (k+ 1)th period is calculated as follows
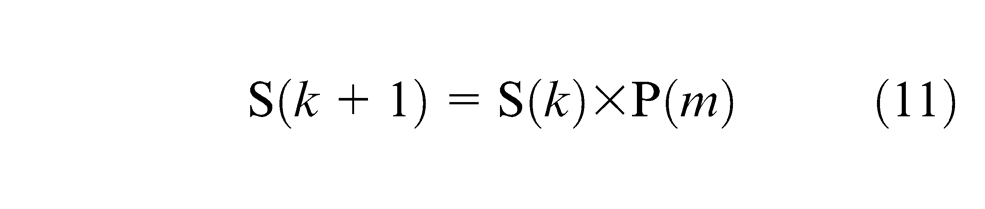
The state of the residuals in the (k+1)th period is the column where the largest attribute value stays.
Step 3: determine the forecast value of customer requirement state
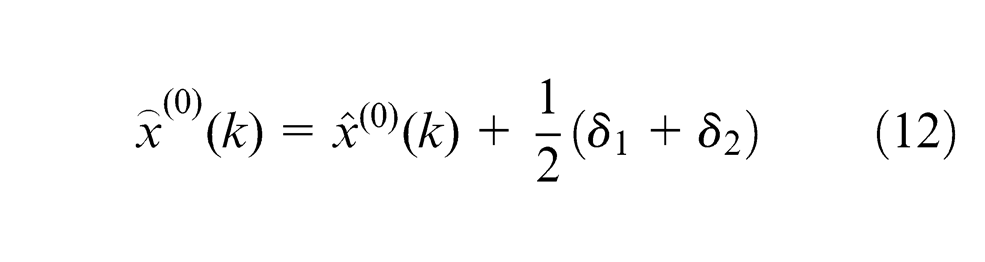
Once the customer requirement states is determined, both point estimation and fluctuation interval are also determined, which would enhance the reliability and the accuracy of the prediction. Point estimation from the grey–Markov chain method can be calculated as follows
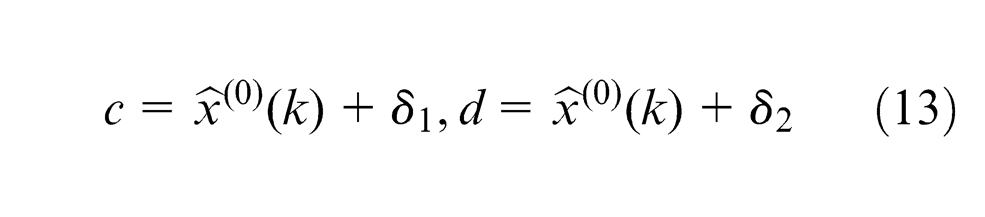
The fluctuation interval of the prediction value (c, d) could also be determined as follows
Case study: customer requirements forecast for mobile phone
In this section, forecast of customer requirements states for a mobile phone is taken as an example to demonstrate the application of the proposed approach in the real world. W Company is a manufacturer that designs mobile phone for young people and trend-setters. Those customers of the W company are mainly commuters, who usually spend nearly 2–3 h/day on the road by public transport. Therefore, they often focus on the entertainment and reading provided by the mobile phone. Life cycle of mobile phone today is increasingly becoming shorter. In volatile cellular phone market, it is critical for the W company to predict the dynamic customer requirements due to the customer sophistication and intense competition. W company expects to develop a new type of mobile phone with “larger screen of 7 inches” to capture the future taste of customers with lower cost. The authors would illustrate how the proposed approach can be applied to the case. To reveal the advantages of the customer requirement prediction method, we also make comparisons between the proposed approach and prediction method based on the GM(1, 1).
Obtain inputs of the forecasting method
Kano surveys have been conducted in the past five quarters. CR1 represents customer requirement of “larger screen of 7 inches.” Here, number of customers is converted into percentage form to simplify calculations. The distributions of customer requirements in the past five quarters are shown in Table 3.
Historical distribution of CR1“larger screen of 7 in” in the past five quarters.
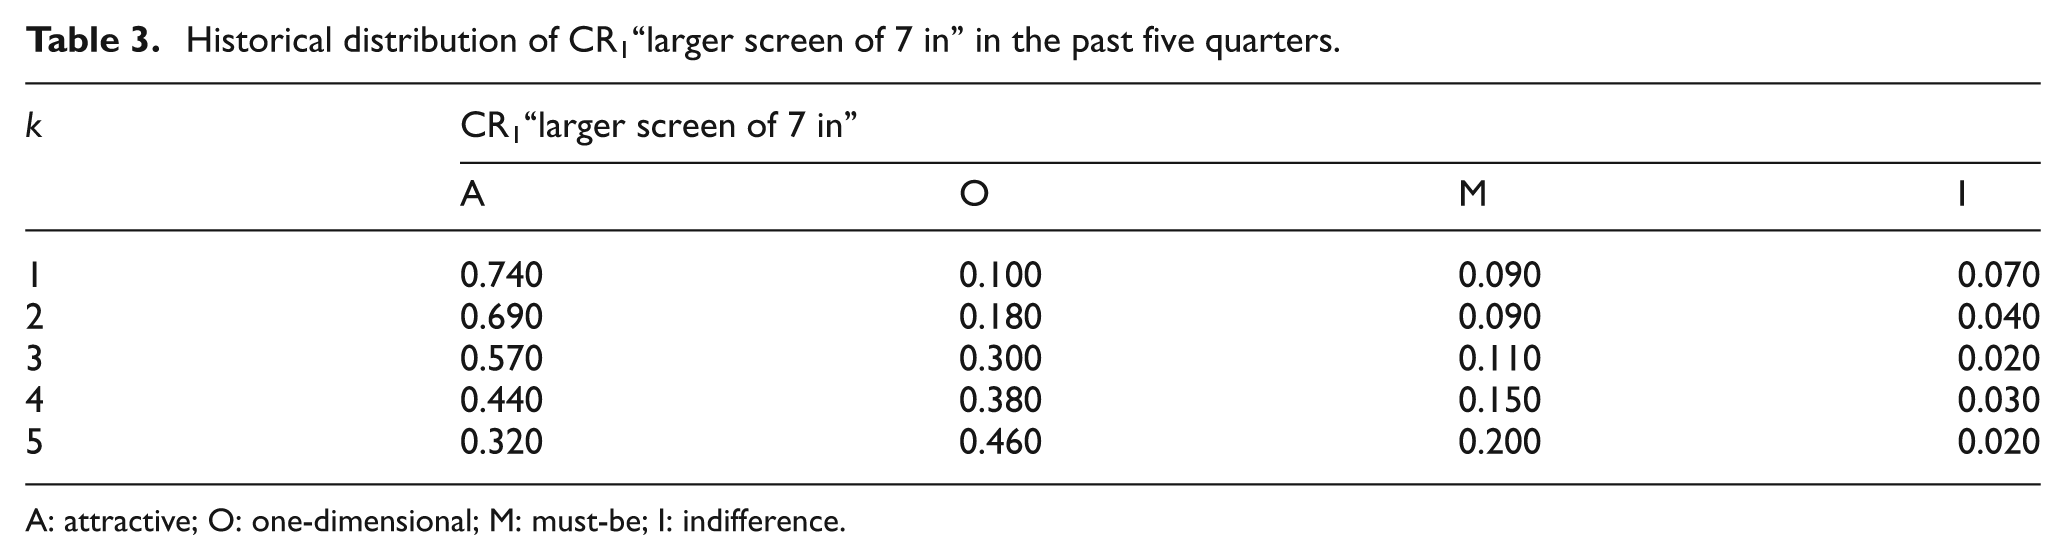
A: attractive; O: one-dimensional; M: must-be; I: indifference.
Obviously, percentage of customers who choose CR1 as “attractive” attribute declines with time, while percentage of customers who choose CR1 as “one-dimensional” attribute witnesses a gradual increase. In fact, percentage of the “attractive” has exceeded percentage of “one-dimensional” in the fifth quarter. Thus, CR1 has transformed into a “one-dimensional” customer requirement from the “attractive” one.
Construct GM(1, 1) prediction model for customer requirements states
We first utilize the “attractive” (A) sequence in the past five quarters (shown in Table 4) to illustrate how to predict customer requirements states. Forecast for other customer requirements (i.e. O, M, I) can be obtained in the same way.
The initial “attractive” (A) sequence, accumulated sequence and prediction sequence.
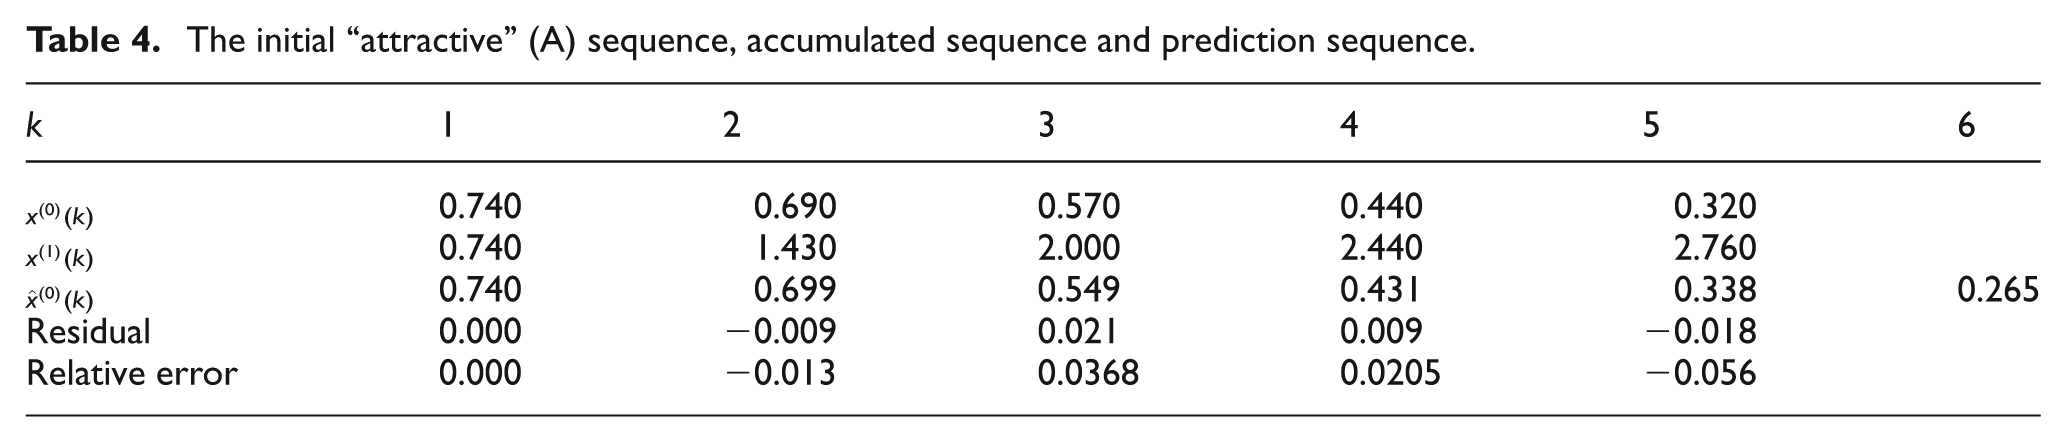
First, the historical date sequence is accumulated to generate a new sequence (see Table 4).
Second, the matrix B and data vector
Third, according to formula (3), grey parameters are obtained as follows: a = 0.243 and u = 0.967.
Fourth, the value of a, u and
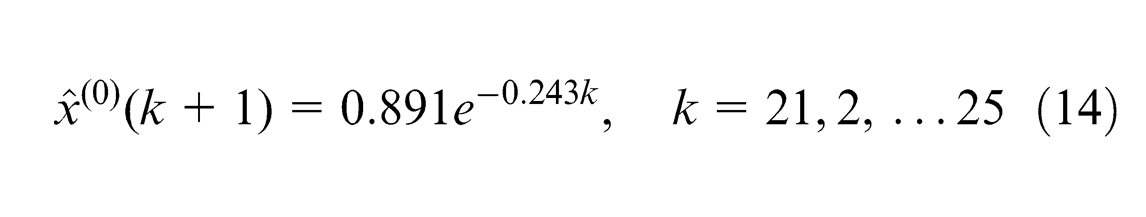
Fifth, the prediction value, and residual and relative error of “attractive” attribute of CR1 are calculated in the light of equation (14). The results are also shown in Table 4.
Modify the grey prediction results with Markov chain
To obtain a more reasonable and reliable prediction of customer requirement, Markov chain is used to modify the results from GM(1, 1) model.
Step 1: partition the customer requirement’ states
Considering the boundary value of residuals, we can partition the residual series into three states to ensure the convenience of calculation. That is, State 1:
Criteria for classification of “attractive” customer requirement’ states.
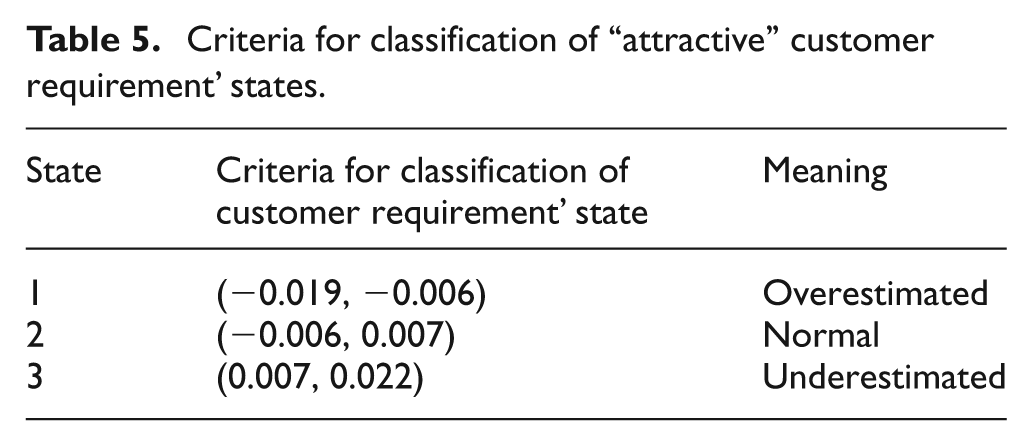
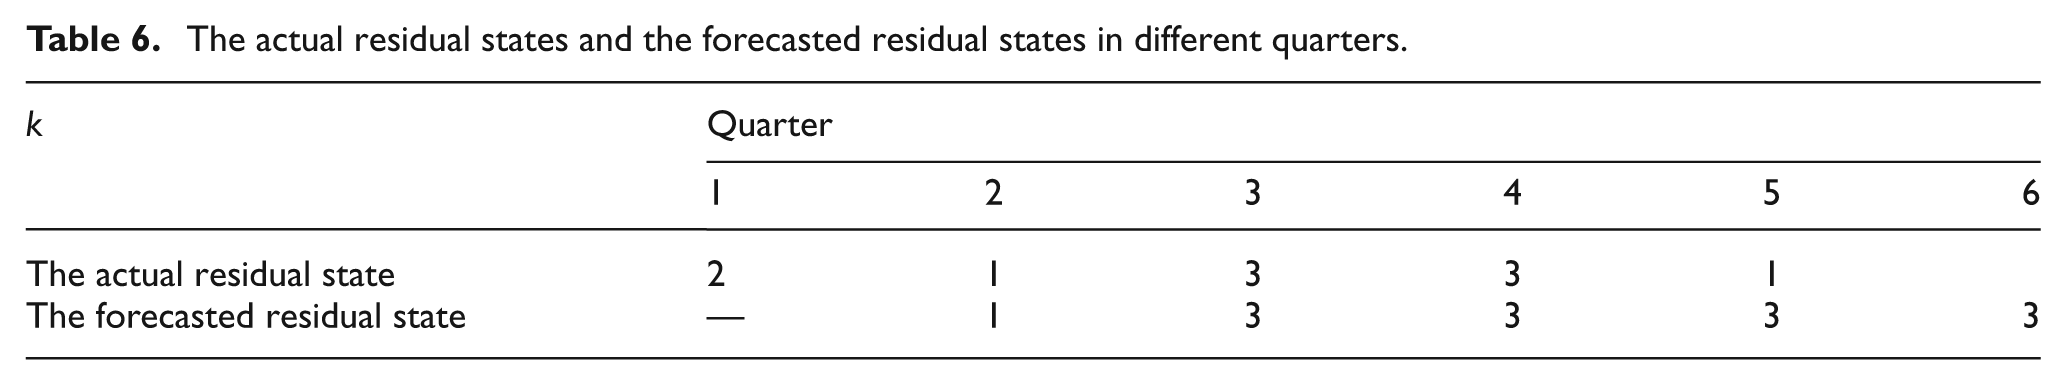
Thus, the actual residuals state distribution in the last five quarters can be acquired in Table 6 according to the criteria for classification of “attractive” customer requirements state.
The actual residual states and the forecasted residual states in different quarters.
Step 2: construct states transition matrix of customer requirement
We can obtain the states’ transferring frequency distribution (see Table 7) in line with the state of residual in Table 6.
States’ transferring frequency distribution for “attractive” customer requirement.
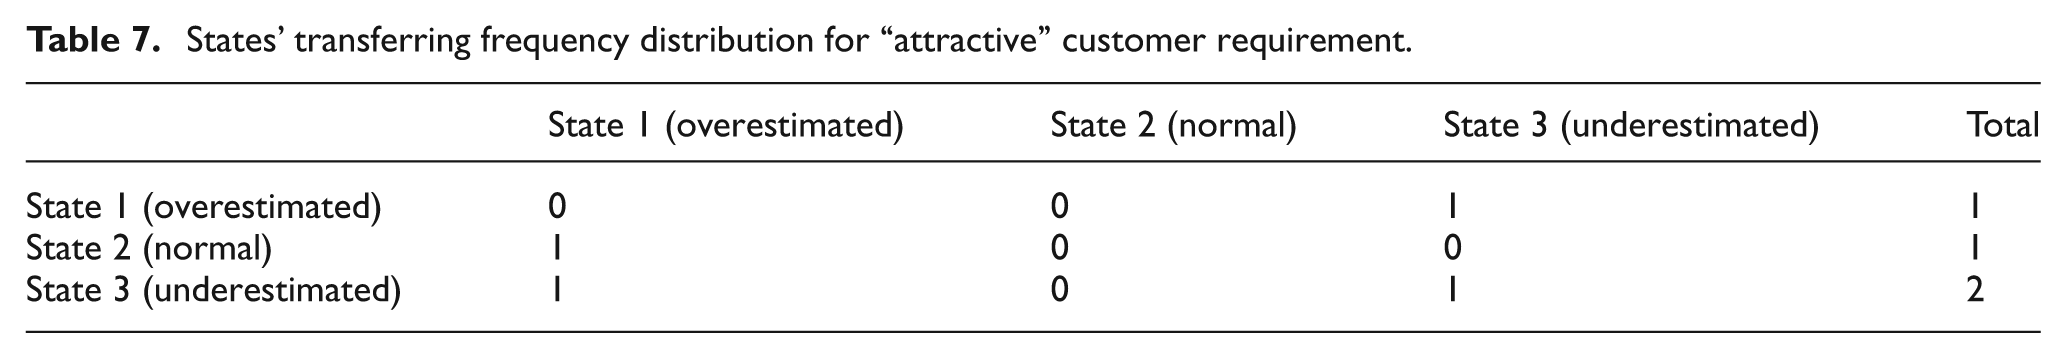
Thus, we get the states transition matrix P according to formula (9)
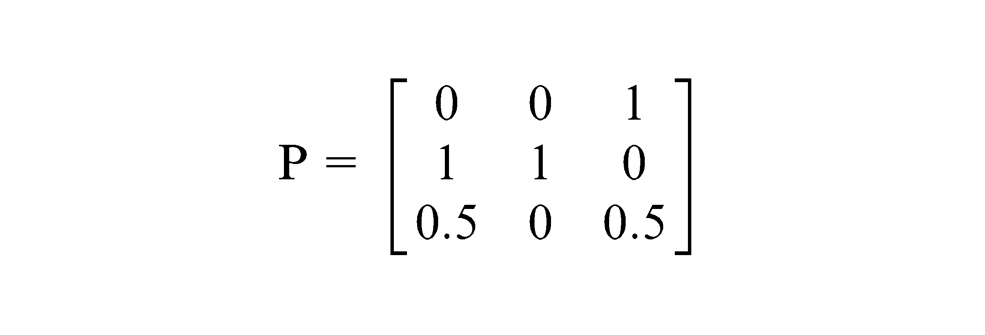
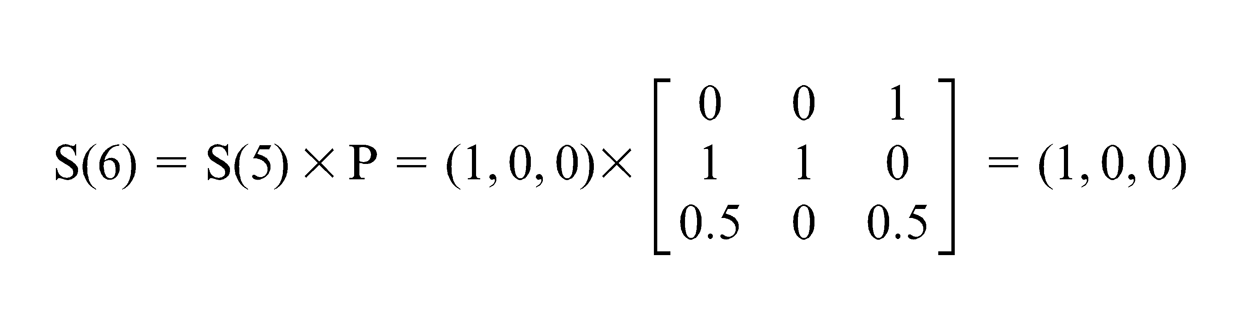
We can see from Table 6 that the residual is in State 2 (normal) in the first quarter, and thus, the probability vector S(0) = (0, 1, 0). Then, we can predict probability vector in the second quarter S(1) = S (0) × P = (1, 0, 0). Therefore, residual is in State 1 (overestimated) in the second quarter. Similarly, we can forecast residual states (see Table 6) in other quarters with the formula (11).
Step 3: determine the forecast value of customer requirement
Grey–Markov chain model predictions in different periods are calculated based on the data in Tables 4 and 5. For example, the residual is in State 1 (see Table 6) in the second quarter, and its corresponding fluctuation interval is (−0.019, −0.006). Therefore, modified point prediction value of customer requirement could be obtained according to formula (12), for example, modified point prediction value in the second quarter is calculated as follows
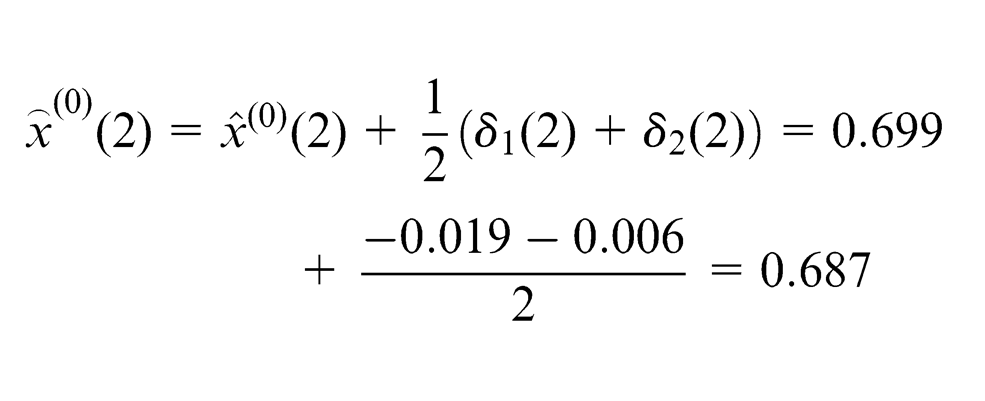
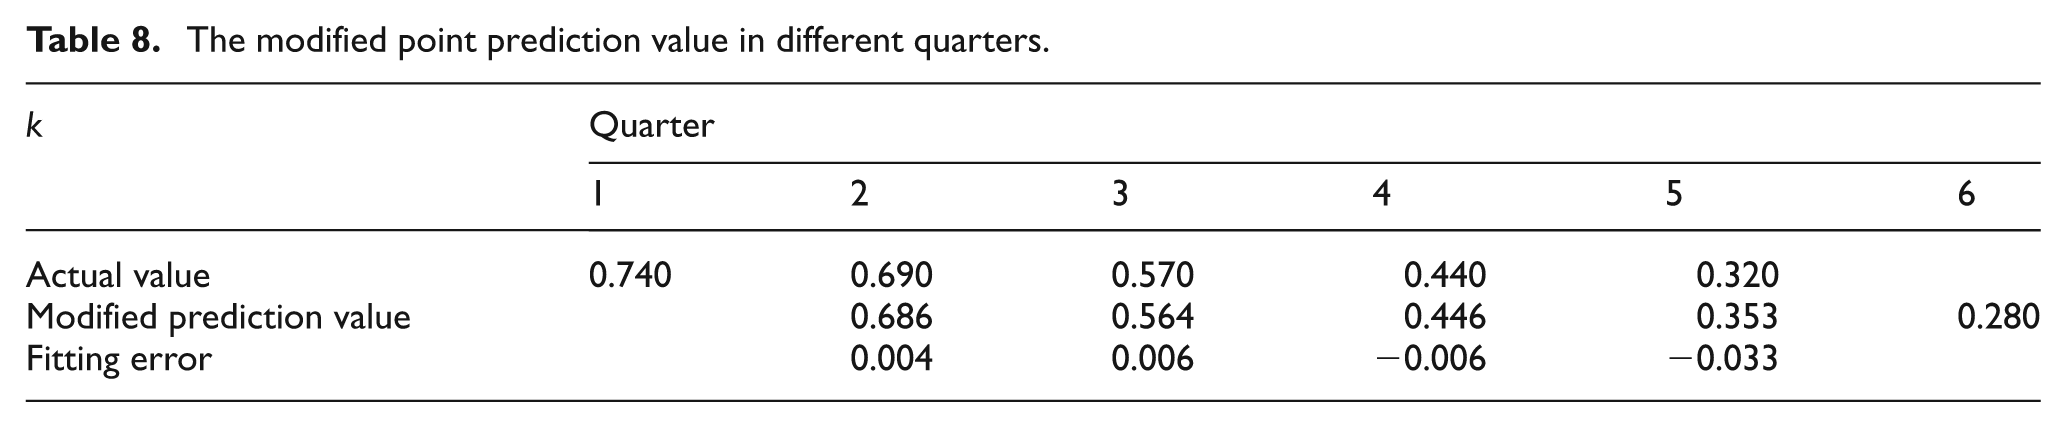
The modified point prediction values in other quarters are listed in Table 8.
The modified point prediction value in different quarters.
Then, considering the reliability and reasonability of the prediction (forecast fluctuations), the form of interval prediction of customer requirement is conducted in the following steps.
First, the upper and lower limits of fluctuation interval of point prediction value can be calculated in line with the formula (13) and Table 5. For instance, when k = 6
So, the fluctuation interval form of the prediction is (0.272, 0.287). Second, the actual probability vector in the fifth quarter is in State 1, and thus S(5) = (1, 0, 0), according to formula (11)
Therefore, the probability of prediction value falling into interval of (0.272, 0.287) is 100%.
The proposed grey–Markov chain method considers not prediction fluctuations, but its future fluctuation rang. Besides, it also provides probability of prediction values falling into the fluctuation range. Therefore, it is more reliable and reasonable than other single-point prediction methods.
Similarly, we can obtain point predictions for other attributes of CR1 (e.g. O, M, and I) in Table 9. Therefore, the states distribution vector of the customer requirement (“larger screen of 7 inches”) in the sixth quarter T(CR1, 6) is obtained as follows
Point predictions for customer requirements states of A, O, M and I.
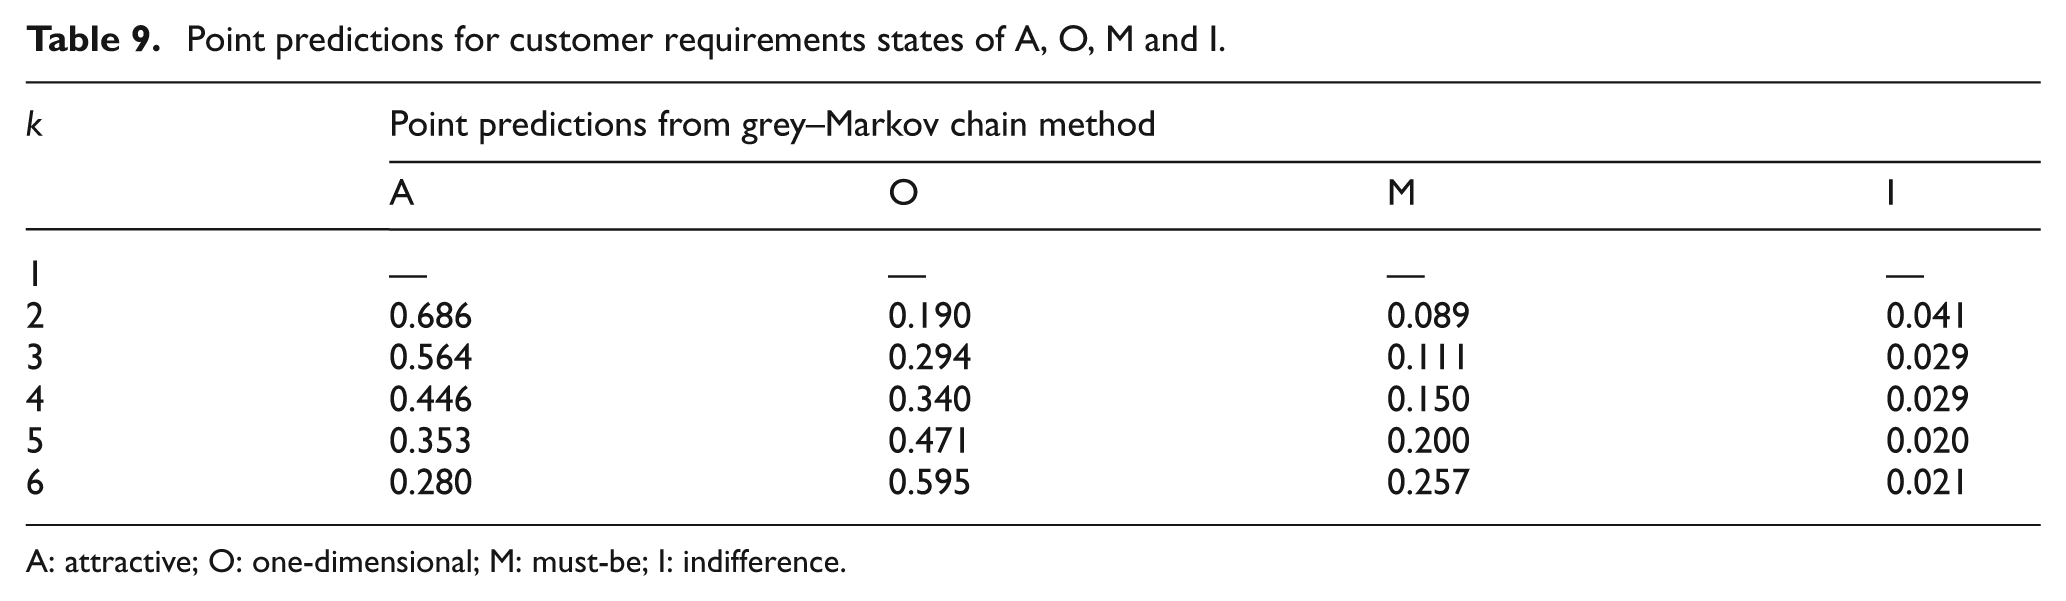
A: attractive; O: one-dimensional; M: must-be; I: indifference.
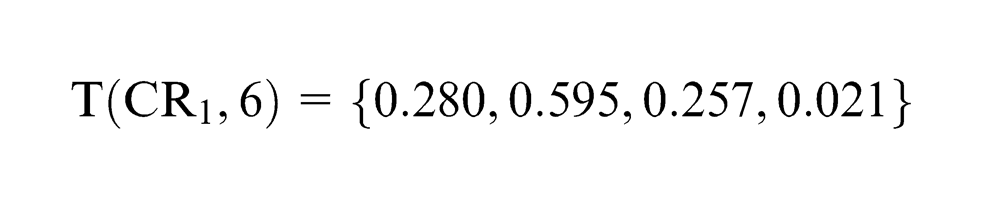
Clearly, “larger screen of 7 inches” is “one-dimensional” customer requirement at the sixth quarter. Table 10 shows predictions in form of intervals and probability of the point estimations falling into prediction intervals.
Prediction fluctuations range and states probability of forecast in the sixth quarter.
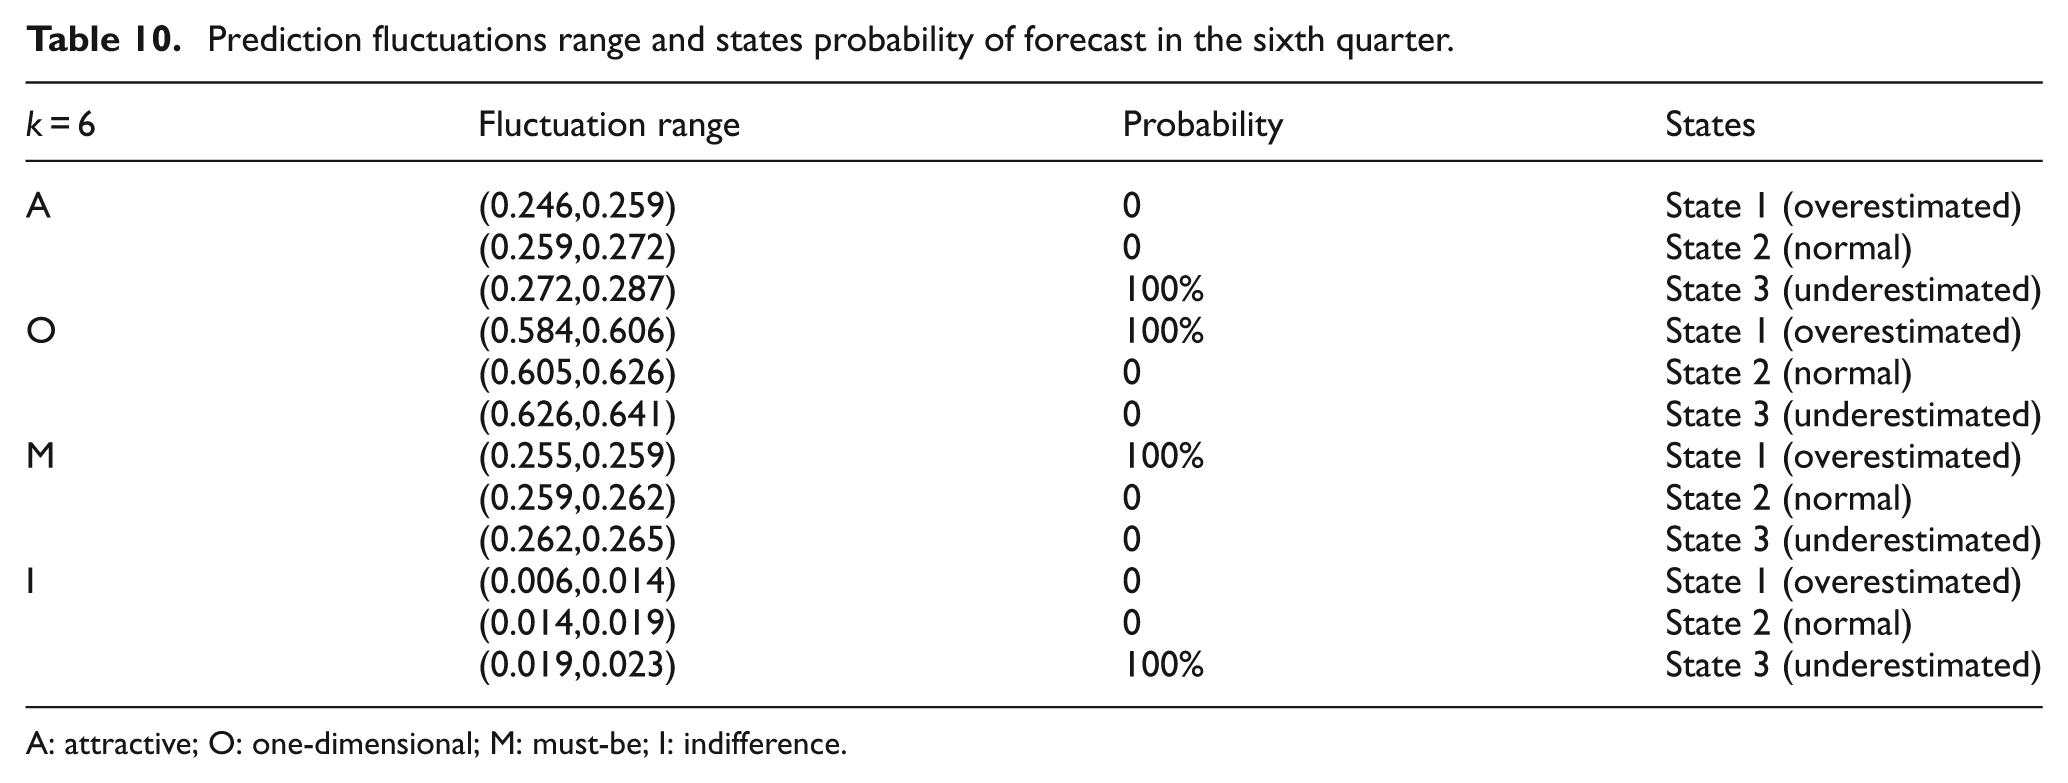
A: attractive; O: one-dimensional; M: must-be; I: indifference.
Comparison and discussion
The actual value of “attractive attribute” of CR1 is compared with the prediction value from the integrated method in Figure 3. It is clear from Figure 3 and Table 8 that the fitting errors of the proposed prediction approach is smaller, for example, the fitting error in the second quarter is only 0.004. The average fitting error (from the second quarter to the fifth quarter) is −0.007.
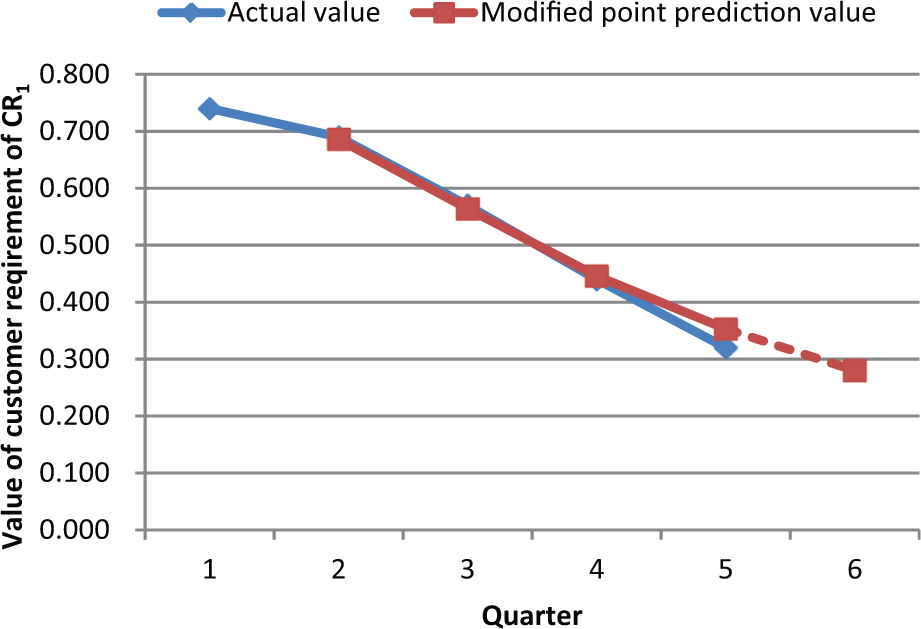
Actual value and modified point prediction value for “attractive attribute” of CR1.
To reveal the advantages of the proposed method, we also compare it with forecast approach using only the grey theory in Figure 4.
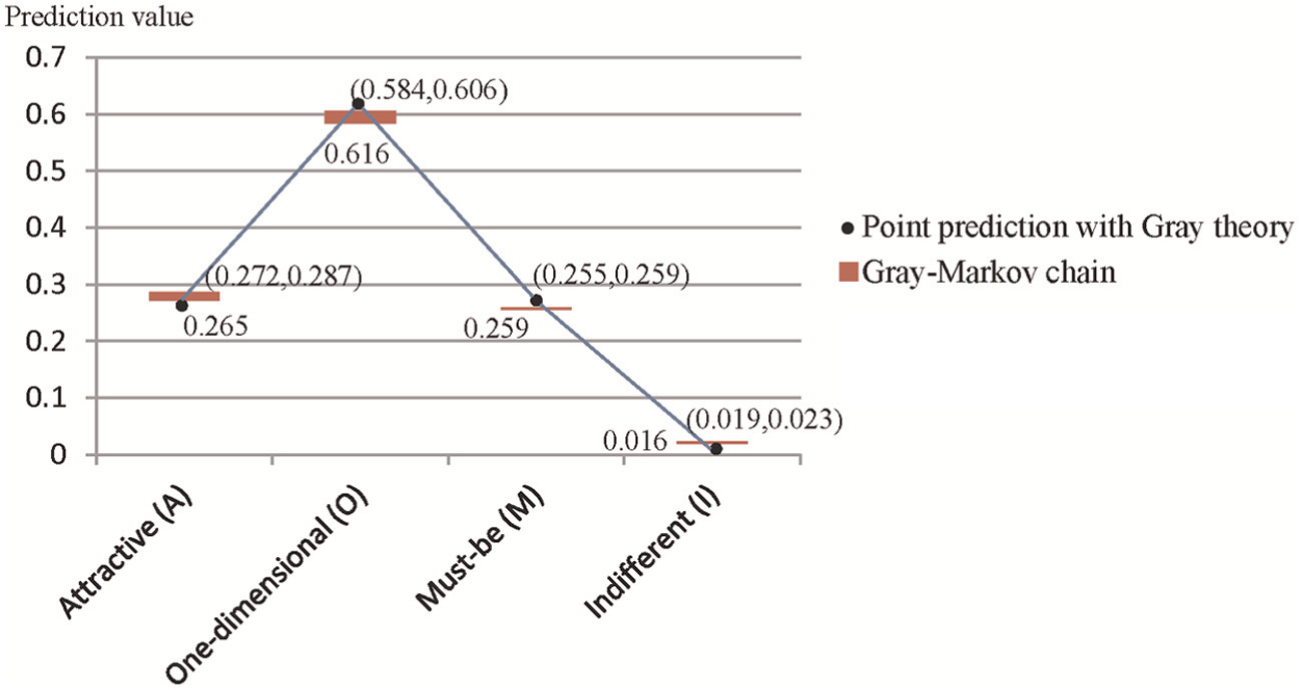
Comparison between grey theory–based method and grey–Markov chain in the sixth quarter.
It can be seen clearly from Figure 4 that the prediction results from the proposed method are different from that of the GM(1, 1) method. The proposed prediction method based on grey–Markov chain provides interval form of customer requirement forecast, which is more reasonable and reliable than the other point prediction methods (e.g. GM(1, 1) method). For instance, the “One-dimensional” state of the customer requirement (larger screen of 7 inches) in the sixth quarter is predicted to be (0.584, 0.606), and the interval 0.022 is considered as the accuracy of the prediction, which would provide useful information for the company. However, the GM(1, 1) prediction method only presents single-point result (0.616) that does not consider the uncertainties included in the forecasting process. This would lead to overestimated prediction. In fact, predicted values of customer requirement tend to fluctuate within a certain range due to the complex nature of factors. The interval form of prediction enhances the reliability and reasonability of the forecast.
We can see from Figure 5 that CR1 (“larger screen of 7 inches”) is an attractive attribute to customers from the first quarter to the fourth quarter. In fact, CR1 is a delighter to targeted customers because there are fewer manufacturers who introduced mobile phone with “larger screen of 7 inches,” especially for e-reading on mobile phone with the same price according to the company’s survey. Besides, the targeted customers in the case study are young commuters who often spend 2–3 h on the public transportation every day, and they are loyal supporters of e-reading on mobile phone. Therefore, mobile phone with bigger screen would bring surprising reading experience to these targeted customers at the beginning of the market introduction. The CR1 begins to shift from “one-dimensional” (O) to “attractive” (A) attribute between the fourth quarter and the fifth quarter because several major rivals of the company have introduced competitive products (e.g. Pad with partial function of cellular phone) with the same price early in the fourth quarter in the light of the company’s business intelligence, and CR1 (“larger screen of 7 inches”) could no longer bring customers much pleasant and surprising experience as before. In the sixth quarter, the percentage of people who select CR1 (“larger screen of 7 inches”) as “must-be” requirement almost catch up with the percentage of people who choose CR1 as “attractive” requirement. In general, the customer requirement (CR1) in the sixth quarter is still “one-dimensional.” W company should continue to invest resources to satisfy the demand of targeted customers so as to enhance customer satisfaction and loyalty. W company adopts alternative materials to reduce costs, and provide customers with cheaper screen that has the same function.
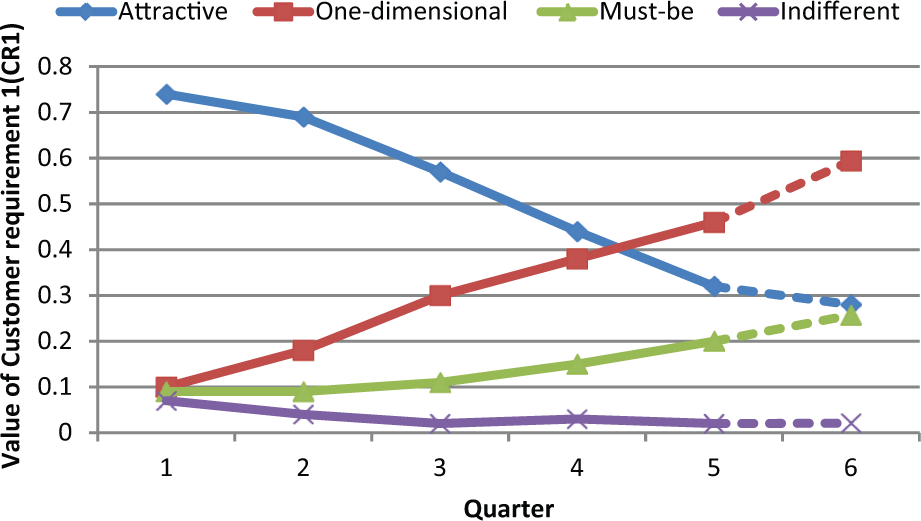
The trends of Customer requirement 1 (“larger screen of 7 inches”).
In sum, the proposed grey–Markov chain prediction method reveals the following features:
First, the proposed approach does not require much historical data as traditional prediction methods (e.g. time series–based methods) to predict the future states of customer requirement, which would significantly reduce the workload and cost of the companies. For instance, in the case study, customer requirement information of five quarters is enough to predict the next quarter’s state distribution.
Second, the proposed prediction method not only uses the grey theory’s strength in describing the overall trend of customer requirements but also considers the local fluctuations with Markov chain. This characteristic ensures the accuracy of the prediction.
Third, the proposed method helps manufacturing companies know well the transition rule of different customer requirements to design the right product for the right customer at the right time. Furthermore, it also reduces the unnecessary design changes caused by customer requirement variation, and avoids undesirable delays in schedules.
Fourth, the interval form of prediction from the proposed approach is more reliable and reasonable than that of other point estimation methods. For example, the predicted one-dimensional state of the customer requirement in the sixth quarter is (0.584, 0.606) and is reasonable than the overestimated point prediction 0.616 due to the consideration of inherent uncertainty in the prediction.
Fifth, in contrast to the traditional prediction methods, it is also not necessary to assume that the data possess a known statistical distribution in the proposed method.
Conclusion and suggestions
This article explores the possibility to design an integrated approach based on Kano model and grey–Markov chain for prediction of customer requirement state. The presented approach makes use of Kano model’s merits in customer requirement classification, grey theory’s strengths in trends forecasting with fewer data, and Markov chain’s advantages in manipulating fluctuations. The proposed integrated approach could help product development departments and marketing departments to know in advance the customer requirement state evolution trends, and satisfy the requirement that would bring potential business opportunity. In this way, right resource could be put into the right customer requirements at the right time. The validation of the proposed method in the state prediction of mobile phone shows that it is a more effective prediction tool. To sum up, the approach reveals the following strengths:
The proposed method solves the problems of qualitative and static customer requirement classification in the conventional Kano model. It considers the customer requirement from a quantitative and dynamic respect, and therefore, provides a more practical and specific perspective on customer requirement analysis.
The integration of the grey prediction method with the Markov chain can not only predict evolution trends of customer requirements states with fewer data but also reduce forecast error caused by fluctuations of historical data to ensure accuracy of prediction.
The proposed method provides more reasonable and reliable predictions of customer requirement because it produces both point prediction and interval form prediction results for future customer requirement states with uncertainties.
Knowing the transition rules of customer requirements in advance with the proposed approach could help companies to design the right product for the right customer at the right time. Thus, it could reduce unnecessary design changes caused by customer requirement variation, and avoids undesirable delays in schedules.
In future researches, some other designing approaches (e.g. teoriya resheniya izobretatelskikh zadatc (TRIZ), design failure mode and effects analysis (DFMEA), QFD, etc.) will be integrated together with the proposed prediction method to design and develop more attractive products for turbulent market. Furthermore, more testing work is necessitated to gain external validity.
Footnotes
Acknowledgements
The authors would thank the editor and anonymous reviewers for their helpful comments and suggestions on this article.
Declaration of conflicting interests
The authors declare that there is no conflict of interest.
Funding
This research received no specific grant from any funding agency in the public, commercial, or not-for-profit sectors.