
Abstract
In order to meet the demand for the current consumer electronic products, the improvement of the surface mount technology is an important trend. This study used the Taguchi method to develop different level schemes of the surface mount technology solder paste printing process parameter in order to obtain the conditions of parameter combinations of the surface mount technology solder paste printing process parameter. However, the Taguchi method of experimental configuration requires multiple trials to obtain the surface mount technology solder paste printing process parameter, which may require considerable cost and time. Therefore, this study attempted to use two multiattribute decision-making methods, gray relational analysis, and technique for order preference by similarity to ideal solution evaluating method, in order to determine a group of optimal experimental schemes from among the established multiple experimental schemes using the Taguchi method. This study also used the process capability parameter to verify the research methods. The experimental results showed that surface mount technology solder paste printing thickness process capability (Cpk) value has improved from 0.59 to 1.53, which could improve product quality. The Taguchi and two multiattribute decision-making methods have proven that the model can effectively obtain the surface mount technology solder paste printing thickness process parameter.
Keywords
Introduction
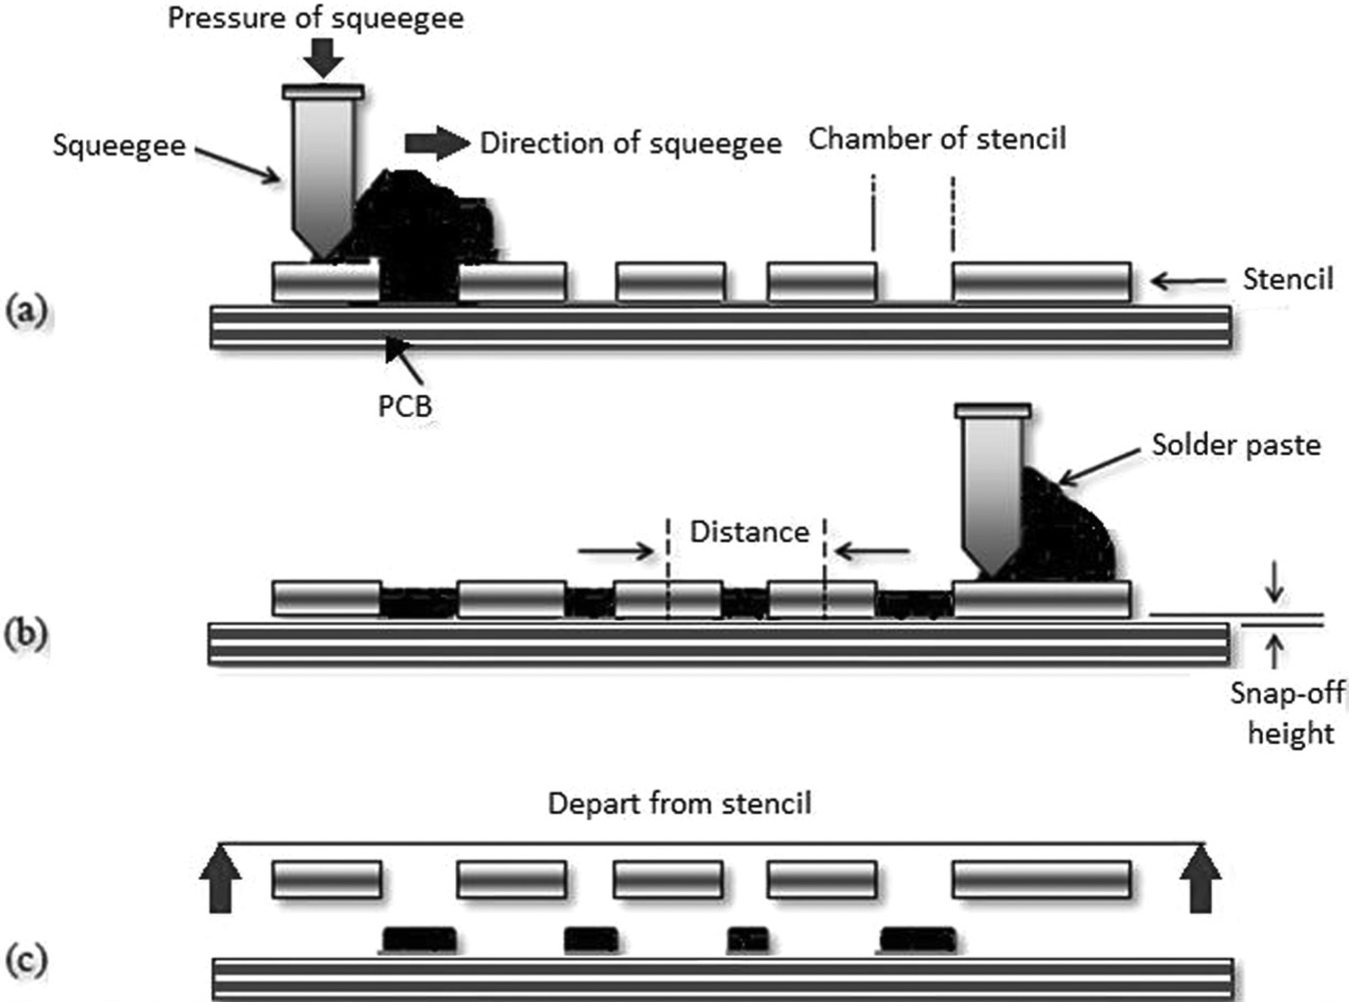
In response to the present trend of miniaturization of consumer electronic products, electronic components are becoming smaller, resulting in higher demand for surface mount technology (SMT) technology. The defect ratio of SMT is 75% in the solder paste printing process. In other words, the SMT yield rate can be maintained at a certain level only if the solder paste printing process is correctly done, the solder paste printing process as shown in Figure 1. However, it is difficult to make the printing process correct. It can also be said that solder paste printing process is the core of the entire SMT technology. Ramkumar et al. 1 proposed that the amount of fallen solder, pad design, hole design, circuit board surface coating, solder paste type, component placement method, and circuit temperature of the weld are the most important factors of the SMT process. The stencil hole design includes the hole shape and size. The hole may be a rectangle, oval, pentagon, and double trapezoid, and the size may be of 80%, 90%, and 100% of the soldering pad. Pan et al. 2 proposed 50 factors that may affect solder paste printing and argued that the selection of variables is very important, as there are many variables. Finally, six variables affecting the solder paste retention, including the size of the stencil hole, the hole shape, circuit board surface coating, stencil thickens, solder paste type, and printing speed, are selected. The experimental results suggested that hole size and stencil thickness are two key variables. Yang 3 proposed 19 variables affecting solder paste printing by printing parameters and solder paste and, finally, summarized stencil thickness, component spacing, stencil hole size, mold release height, mold release speed, squeeze pressure, solder viscosity, and solder paste particle size as the input values of the neural network. The experiments of Ramkumar et al. 1 focused on the stencil hole design, including the shape and the relative proportion of the hole size against the soldering pad.
A present study by Yang 4 used discrete-event simulation to create a 300-mm semiconductor manufacturing flow and executed a factorial experiment of three factors based on uniform design, including direct ratio, stocker capacity, and the number of machine load ports. Finally, using the dual-response surface method, the most important of the three factors and best performance were determined. The results show promise for the proposed tool-to-tool transportation strategy in solving practical application. Wazed et al. 5 developed simulation models for a multistage production system under common processes in an uncertain situation created by machine breakdown and quality variation. Few simulation models are developed based on a live case from a company. The models are verified and validated with the historical data of the company and by face validity. Taguchi approaches for orthogonal array are used in designing experiments. The experimental settings are executed in WITNESS, a simulation package. It is observed that variations in the levels of common processes in the system have significant impact on production quantity and cycle time. There is strong interaction among the common processes and the batch size in lancing stations. Padhi and Mohapatra 6 aim to present a combined fuzzy analytical hierarchical process (AHP) and simple multiattribute ranking technique (SMART) approach to deal with contractor selection problems in government procurement auctions. The proposed approach utilizes a set of 10 attributes for the evaluation of a contractor. In this approach, the attributes of both past performance and present status of the contractor are considered, wherein the selection attributes are qualitative and/or quantitative types, which are inhibiting and/or enabling in nature. Claudio and Okudan 7 in their study present an exploratory work using a hypothetical example of a decision-making methodology, namely, multiattribute utility analysis, for health care. The hypothetical sample problem presented involves patient prioritization in an emergency department (ED), where several patients require immediate attention, and all have the same acuity level. The utility theory is selected for this application in order to appropriately account for uncertainties in the decision problem.
As the experimental configuration of the Taguchi method requires multiple trials to obtain an SMT solder paste printing process parameter, it may require considerable time and cost. The technique for order preference by similarity to ideal solution (TOPSIS) concept considers the set of optimal attributes of m attributes in n schemes in order to develop a comprehensive performance and chooses the optimal scheme using the positive ideal solution and negative ideal solution. Gray relational analysis constructs the optimal attributes in the case of uncertain and incomplete information in scheme selection in order to mine and understand the relationships between different schemes and attributes through analysis and computation to select the attribute combination of the optimal scheme.8–19
Research method and case analysis
Based on the multiple experimental schemes established by the experimental configuration of the Taguchi method, this study interviewed 10 experts (including one assistant manager of the Manufacturing Department, two managers, five section managers, and two engineers of the SMT Department of a company) and used two multiattribute decision-making methods (TOPSIS and gray relational analysis) to determine a group of optimal experiments, while using the process capability index (
Factor analysis of SMT solder paste printing thickness process.
To explore solder paste thickness
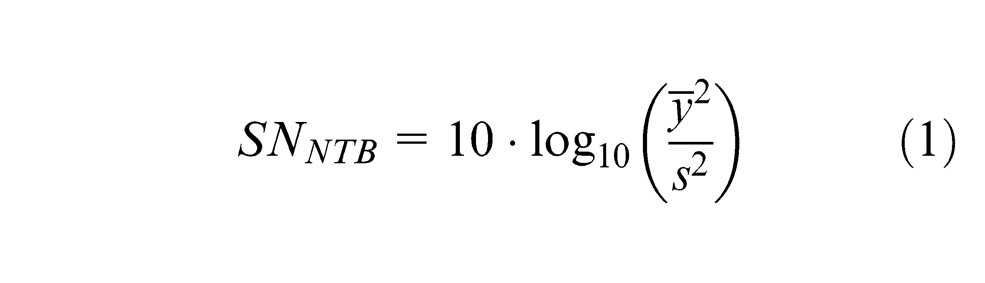
Process capability is measured by the
Gray relational analysis
The degree of relationships among subsystems or elements could be evaluated through gray relational analysis, 20 and important influential factors to the development trend are then determined in order to learn the major features of the system through the following steps.
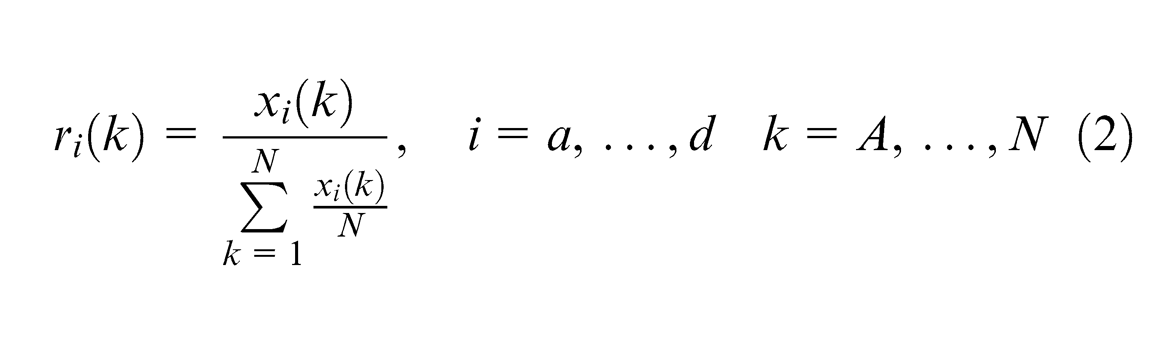
Step 1: normalize original data.
Normalize by dividing the original data
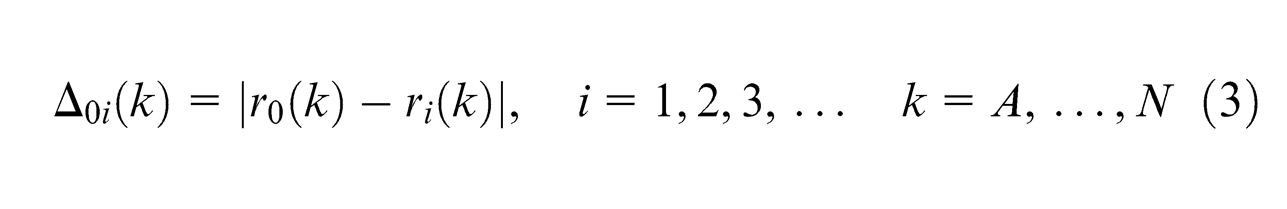
Step 2: designate the standard sequence and calculate the difference sequence.
Take the mean value as a standard sequence, that is, sequence 0; the difference sequence
Step 3: calculate maximal difference


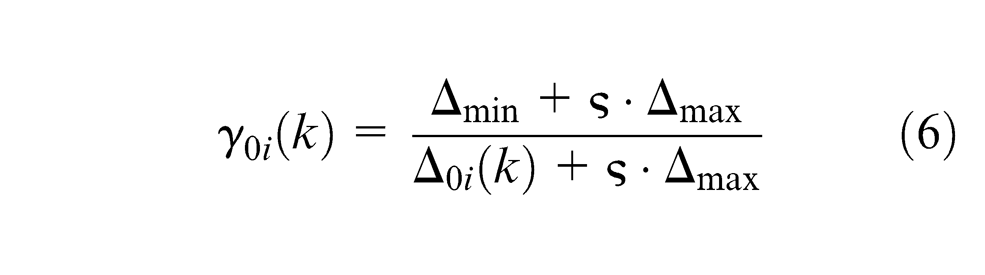
Step 4: calculate gray relational coefficient
The relational coefficient
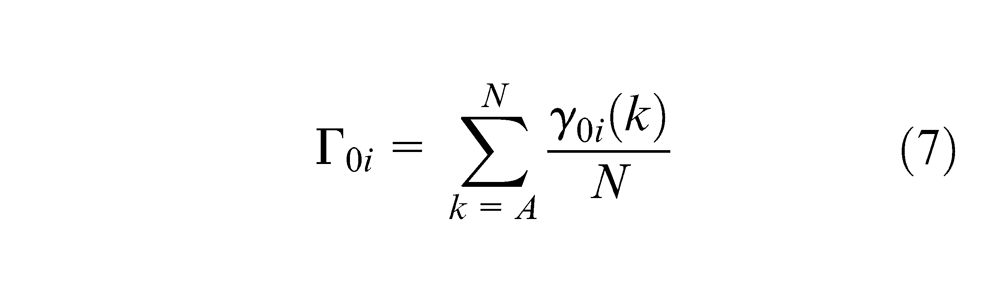
Step 5: calculate the gray relationship
Step 6: conduct sequencing according to the gray relationship.
TOPSIS
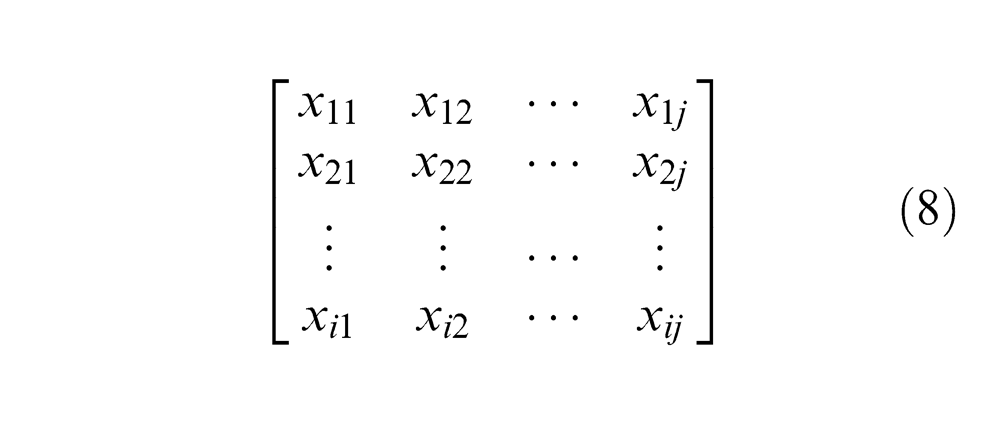
The basic concept of TOPSIS is to define both the positive ideal solution and the negative ideal solution in order to determine the solution closest to the positive ideal solution and farthest from the negative ideal solution. The positive ideal solution refers to the criterion value of the maximum benefits and minimum costs of all alternative solutions. Contrarily, the criterion value of the minimum benefit and maximum cost refers to the negative ideal solution. The TOPSIS method can be applied in the evaluation of a decision-making matrix of m solutions with n attributes, as illustrated in the following, and the calculation steps are given in the following. 11
Step 1: original value normalization.
Decision makers can provide subjective value measurements of a scoring matrix composed of the attribute value of TOPSIS, as established in each scheme. Assuming that there are n schemes and m attributes, and the score of scheme j in attribute i is
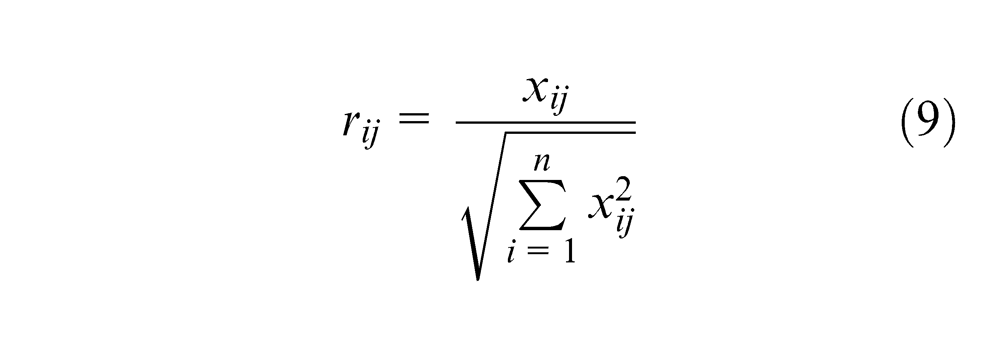
In order to avoid the influence of extreme values, TOPSIS must standardize the scoring matrix to prevent greatly different scores among the schemes in the same attribute and eliminate the influence of different attributes with different scales on the different scopes of attribute values. Assume that
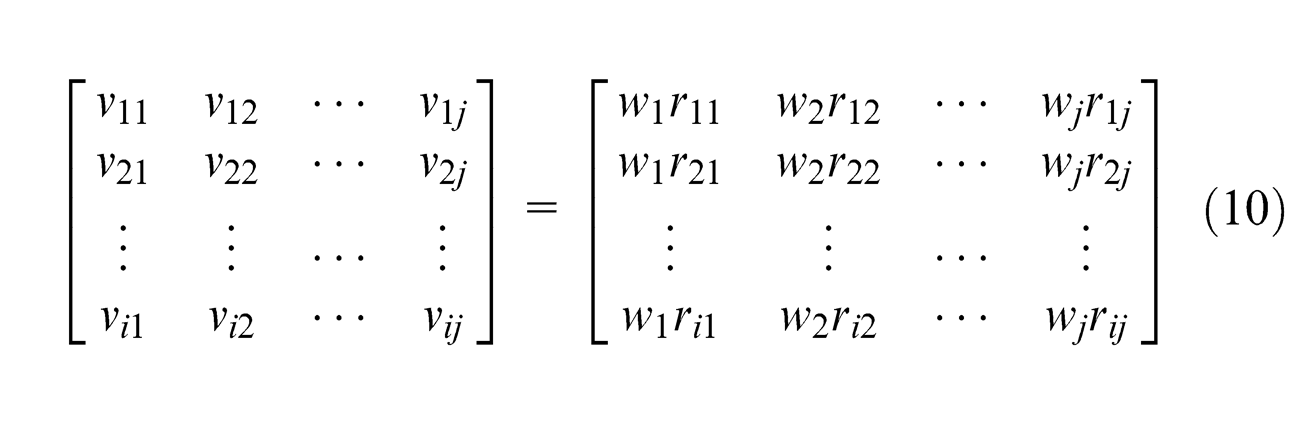
Step 2: establish the weighted normalization decision-making matrix.
According to the relative weight of each attribute, the scoring matrix comprising the attribute values of the schemes in each of the attributes can be converted to a weighted scoring matrix. Weight in this study is the direct scoring method; assume that
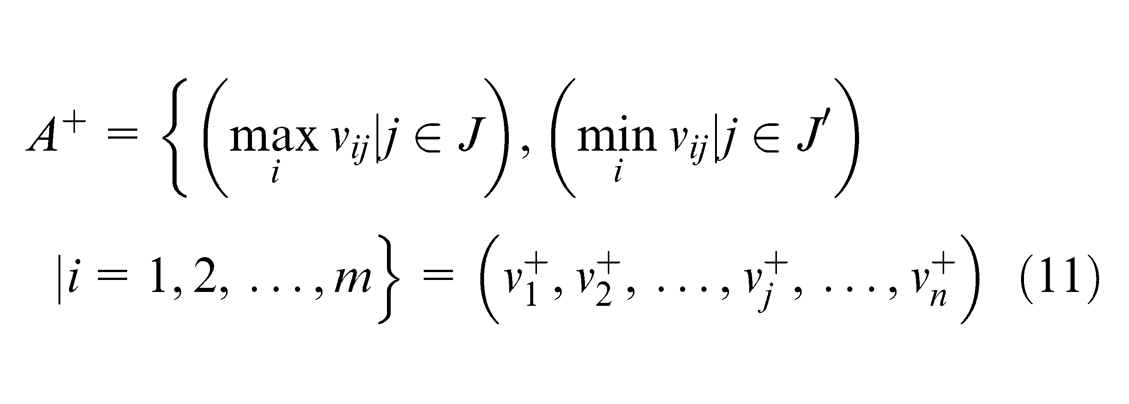
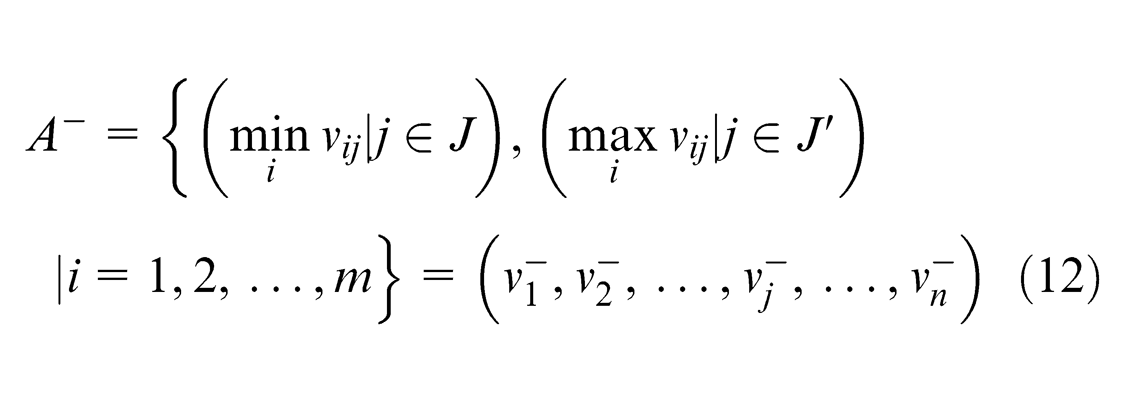
Step 3: search for the positive ideal solution (A+) and negative ideal solution (A−), as shown in equations (11) and (12).
The value measurement method of TOPSIS measures the degrees of separation between each scheme and the positive ideal solution and between each scheme and the negative ideal solution as relative strength and weakness, respectively. The positive ideal solution reaches the maximum value as the larger-the-better attribute and the minimum value as the smaller-the-better attribute. In order to facilitate calculation, the smaller-the-better attribute is first adjusted to the larger-the-better attribute and then the positive ideal solution is scheme (
where
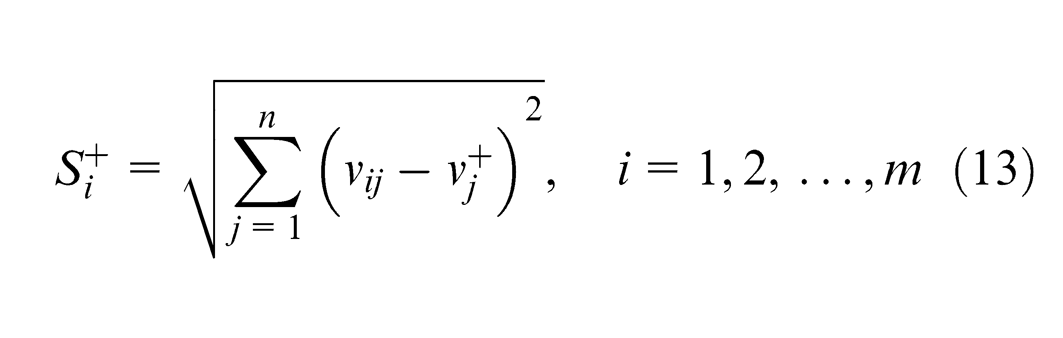
Step 4: calculate the distances from the positive ideal solution (

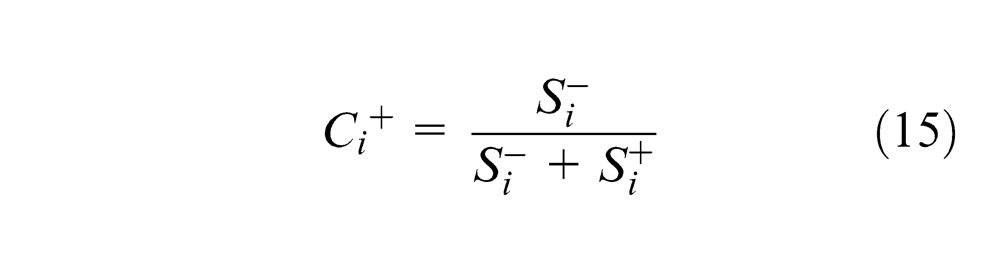
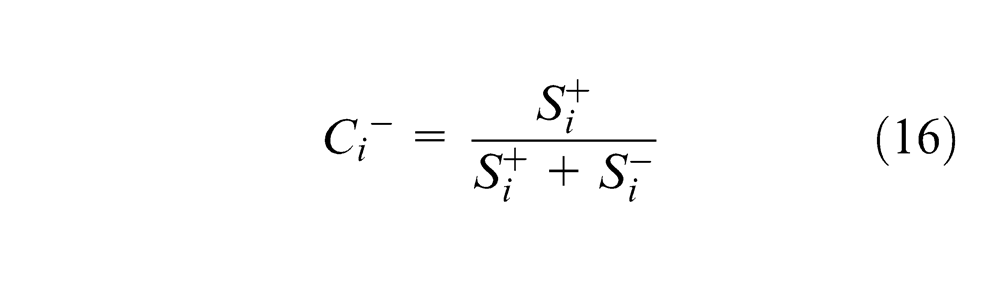
Step 5: calculate the relative approximation of various solutions to the ideal solution, as shown in equations (15) and (16).
The measured value of
where
Step 6: rank the preference order. According to the results of Step 5, the relative performance of various solutions can be ranked, where a larger value indicates stronger preference. TOPSIS uses the relative approximate value of the positive ideal solution to rank the preference of solutions and avoids the difficulty of simultaneously comparing solutions closest or farthest from the positive ideal solution and the negative ideal solution.
Discussion
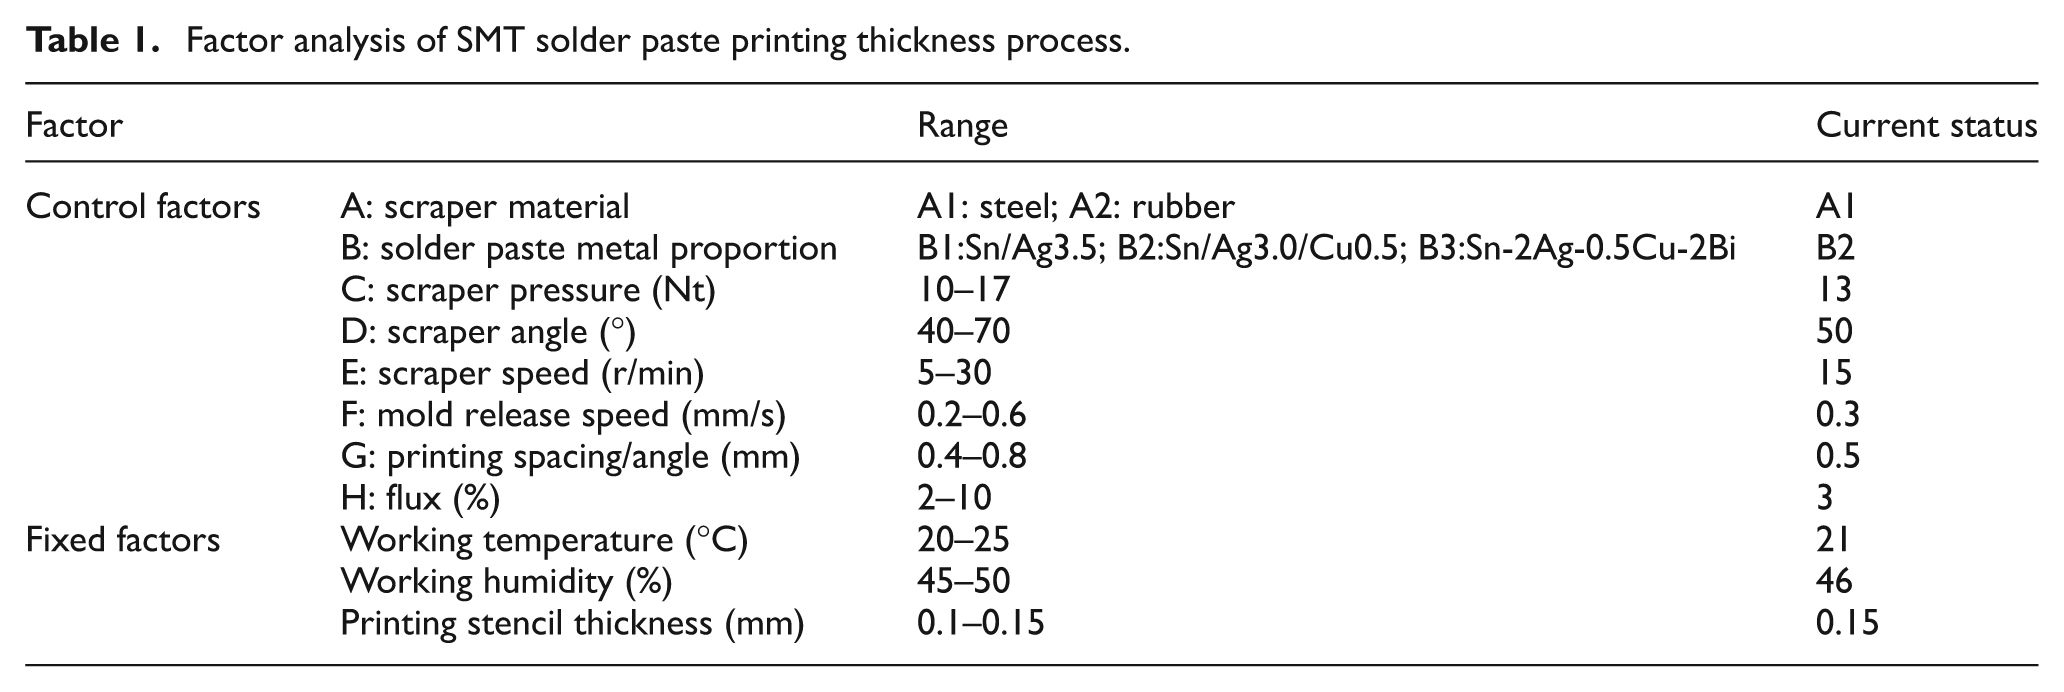
Regarding the control factors affecting the SMT solder paste thickness process, this study found fixed factors and controllable factors, as shown in Table 1, after literature review and interviews with industrial experts.1,2,22,23
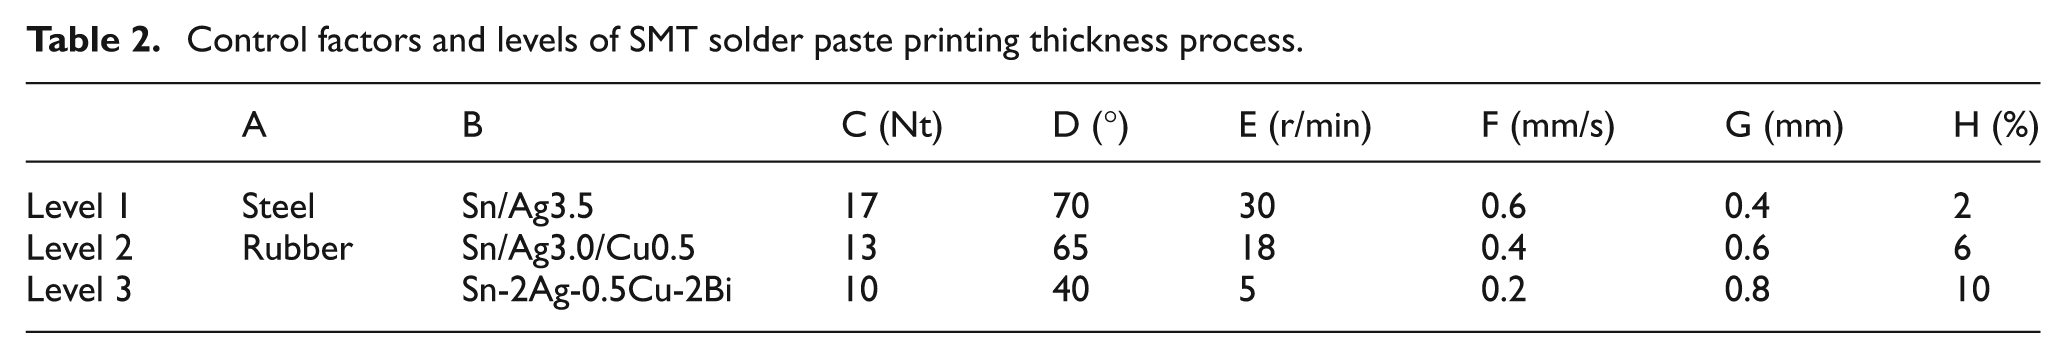
According to the discussions of the expert panel and company process engineers, the selection of factor level refers to the reliable data accumulated from previous experience, which is determined by discussion, as shown in Table 2: factor analysis of solder paste printing thickness process.
Control factors and levels of SMT solder paste printing thickness process.
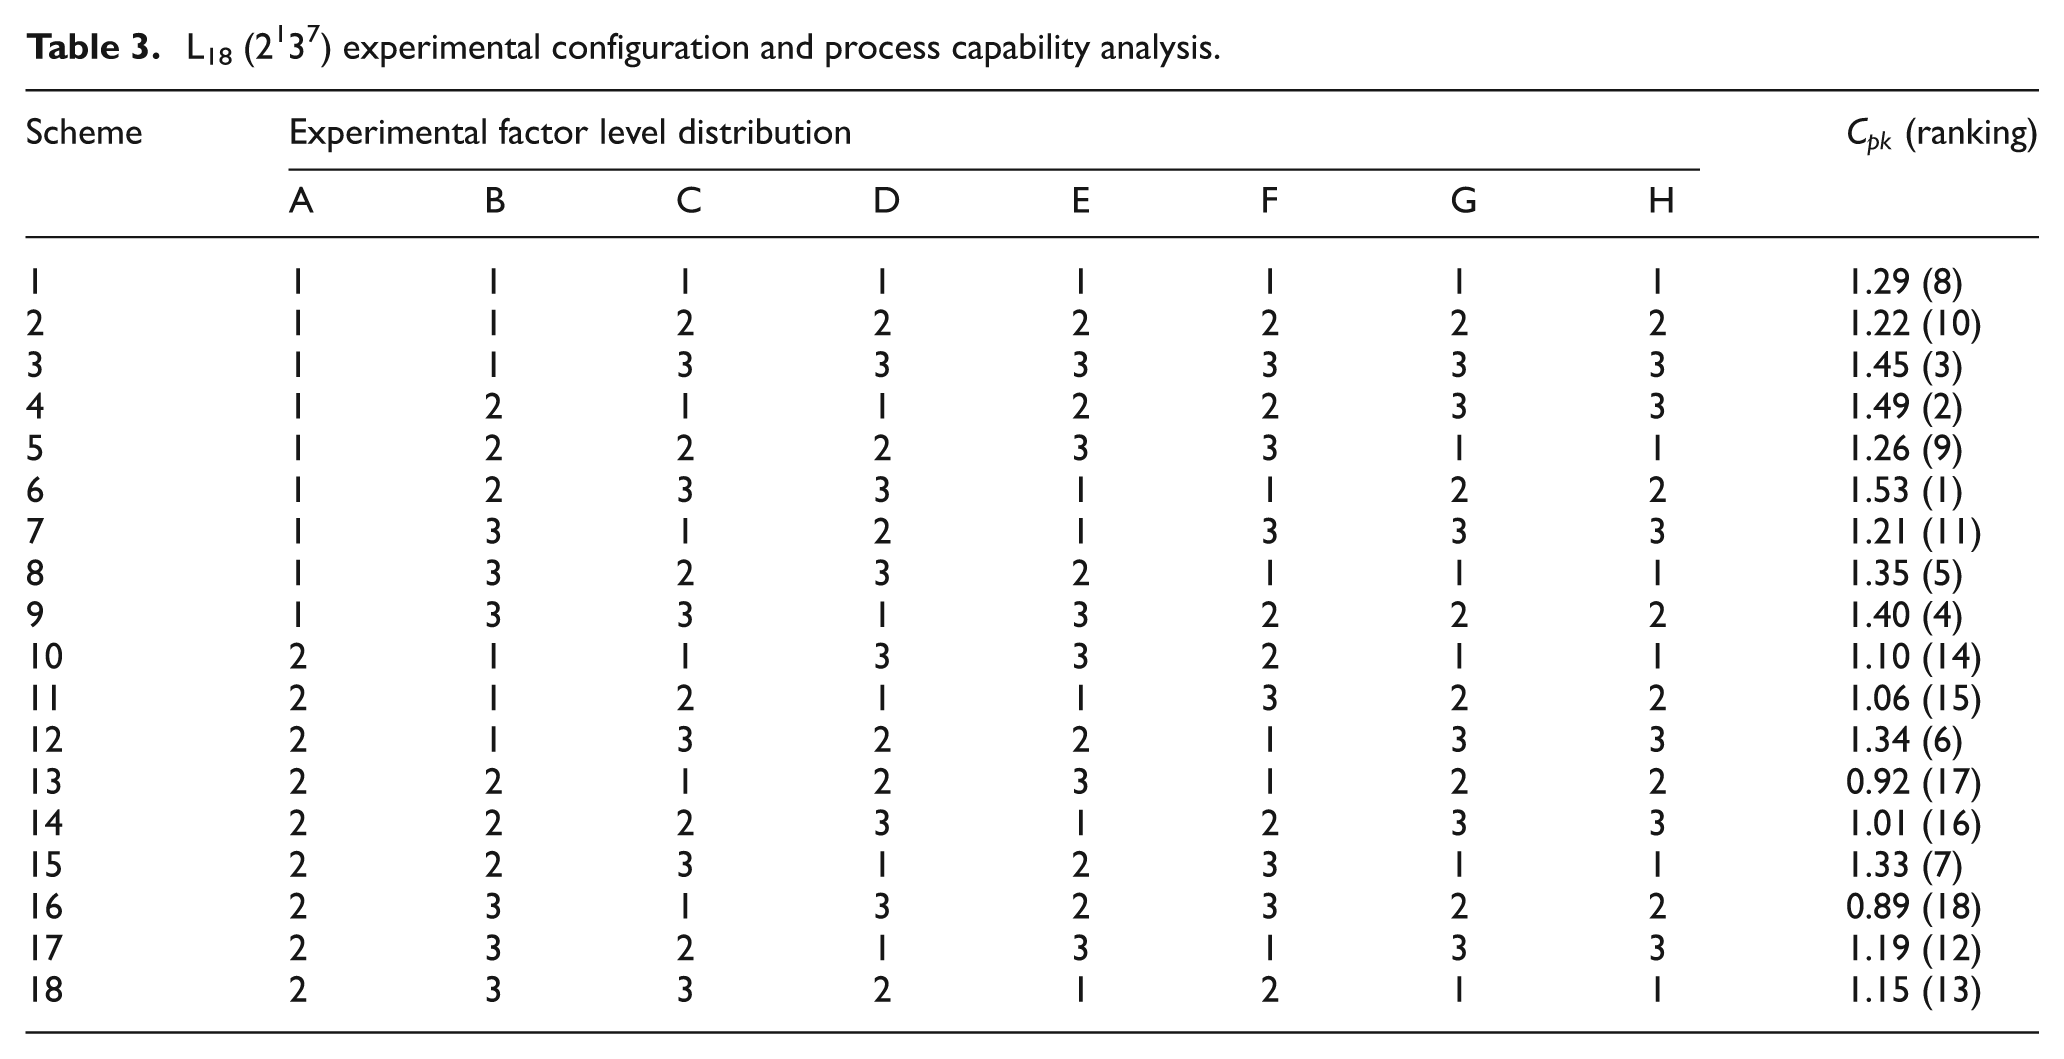
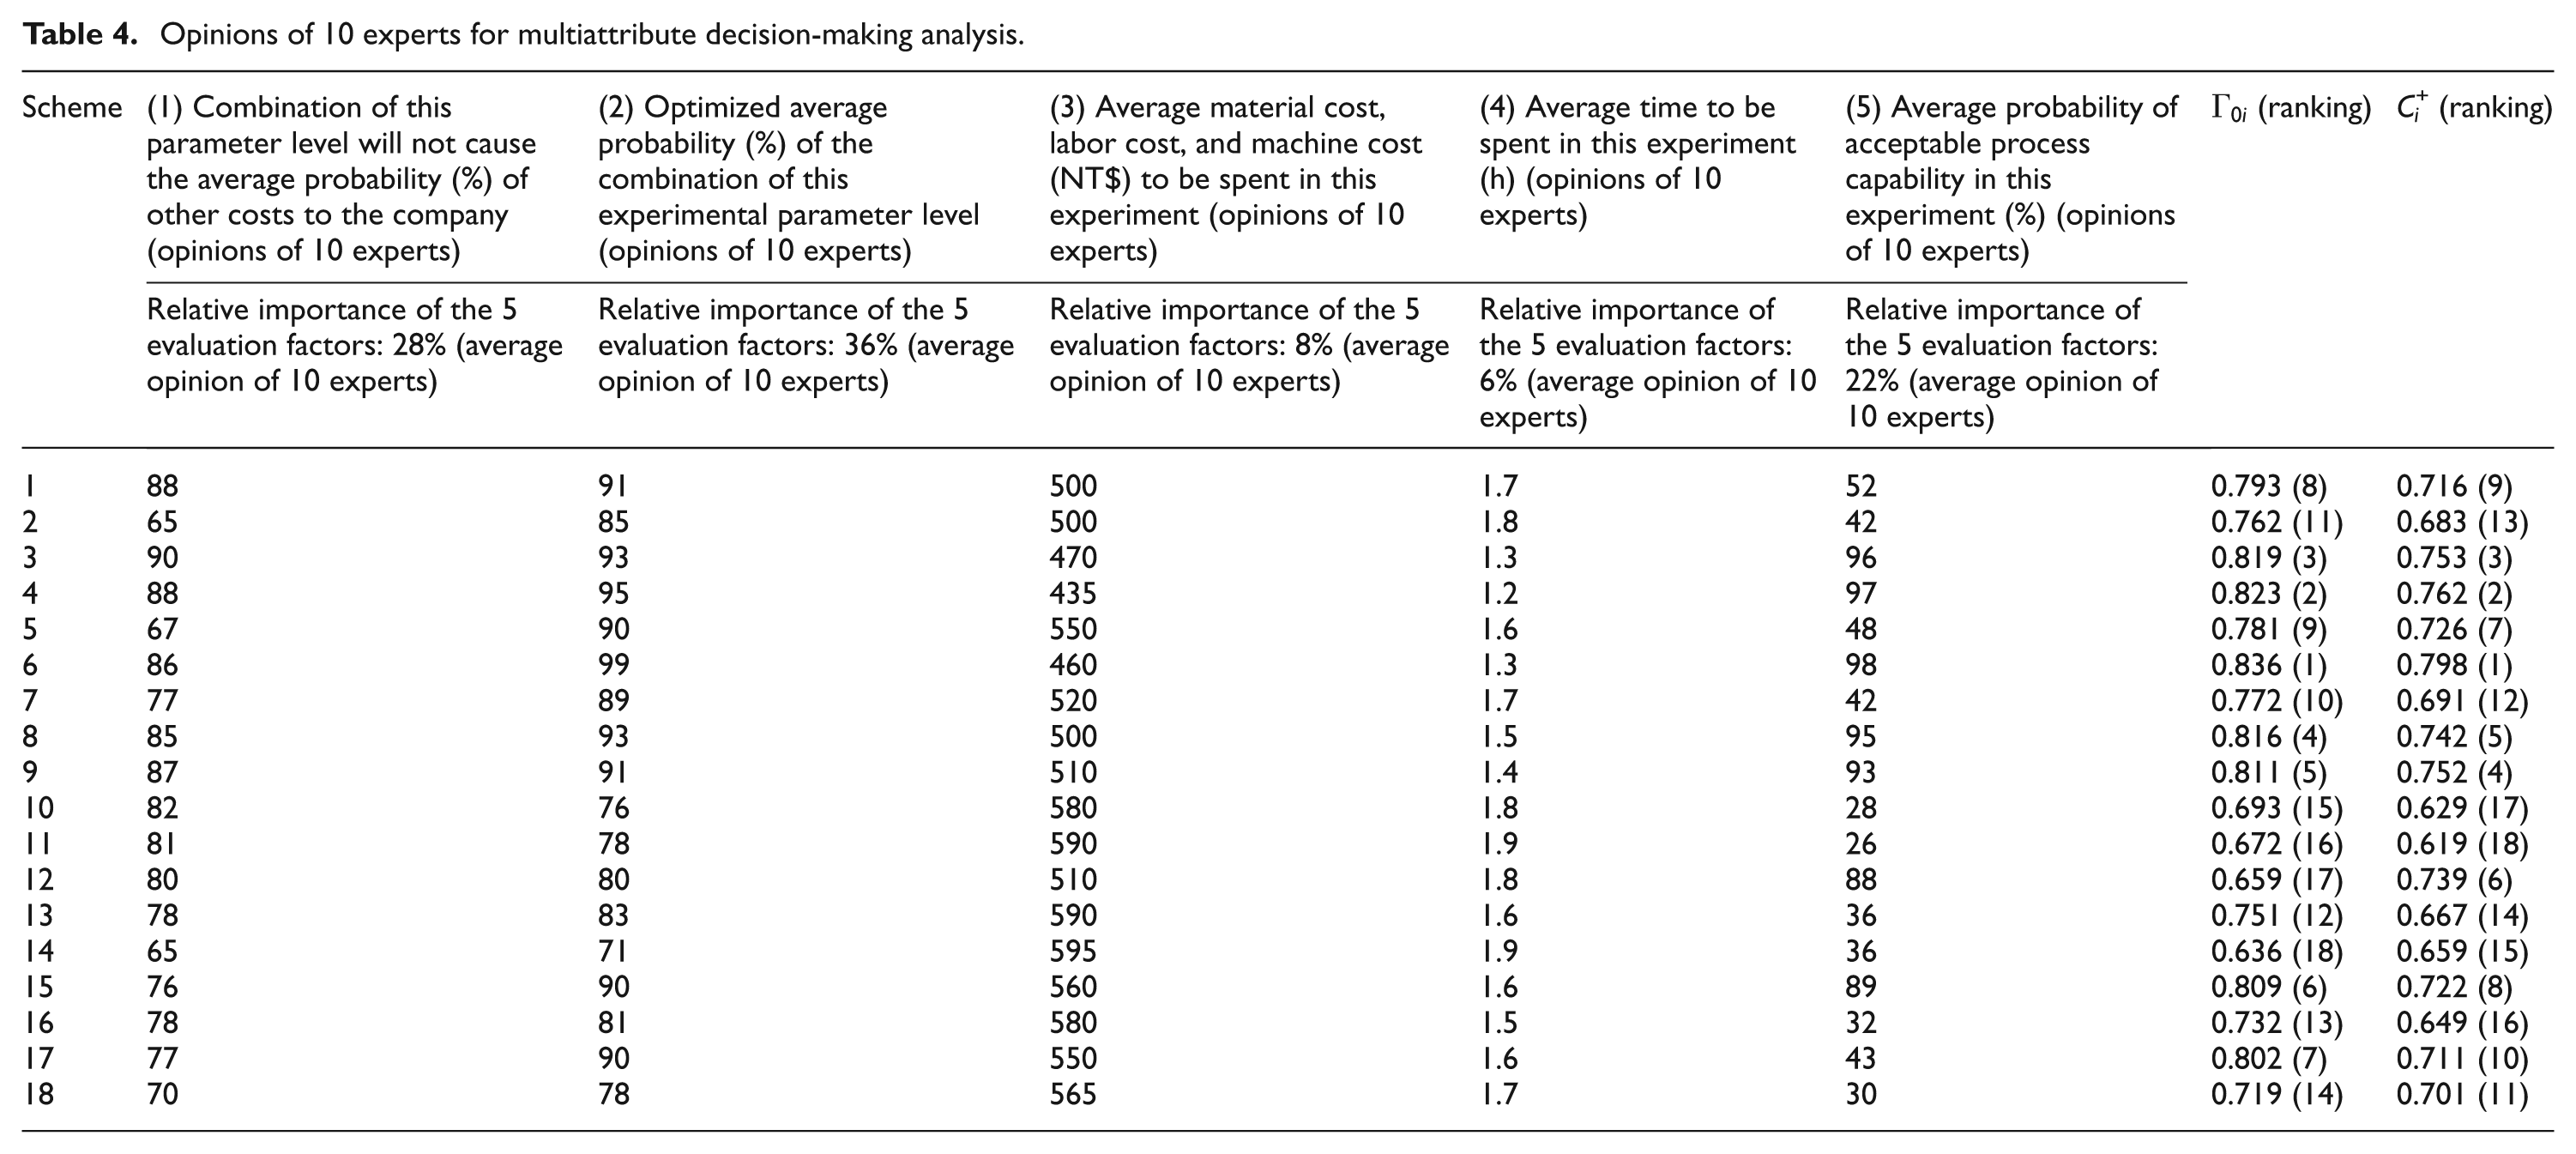
As suggested by the proposed research methods, the process capability index ranking of the top three schemes and the ranking of multiattribute decision-making method are the same, and the ranking of the Schemes 4 and 5 is slightly different (two multiattribute decision-making methods), as shown in Tables 3 and 4.
L18 (2137) experimental configuration and process capability analysis.
Opinions of 10 experts for multiattribute decision-making analysis.
The 18 groups of schemes, as shown in Table 3, have been confirmed to obtain
Response value and SN ratio in confirmation trials.
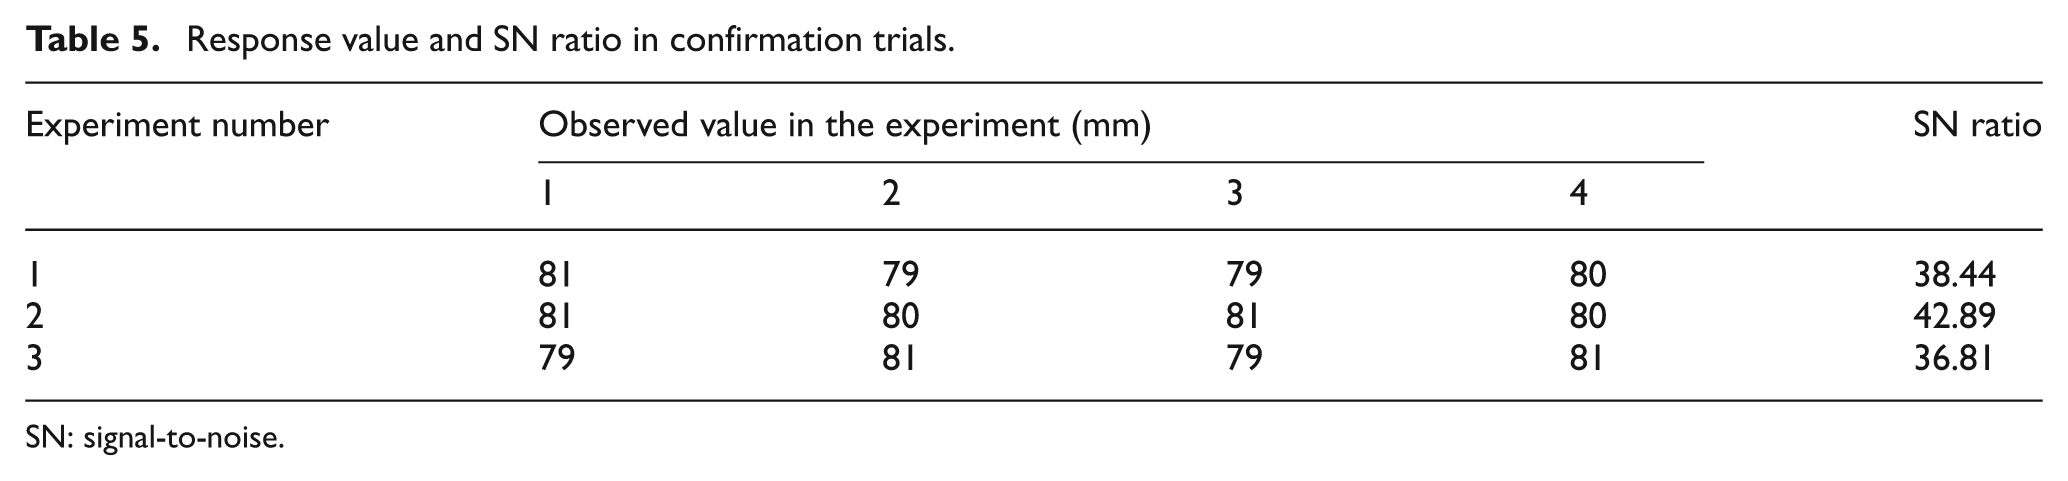
SN: signal-to-noise.
Therefore, the expected SN ratio confidence interval in the confirmation experimental trials is SN/CI2 = [30.0618, 44.6812]. In the above confirmation experiments, all SN ratios fall in the 95% confidence interval, indicating that the experimental results are successful.
After preliminary analysis and fine-tuning of the final analysis of the process conditions, it is found that SMT solder paste printing thickness and process conditions are correlated to a considerable extent. After standardization of the manufacturing process, it is found that the SMT solder paste printing thickness process capability
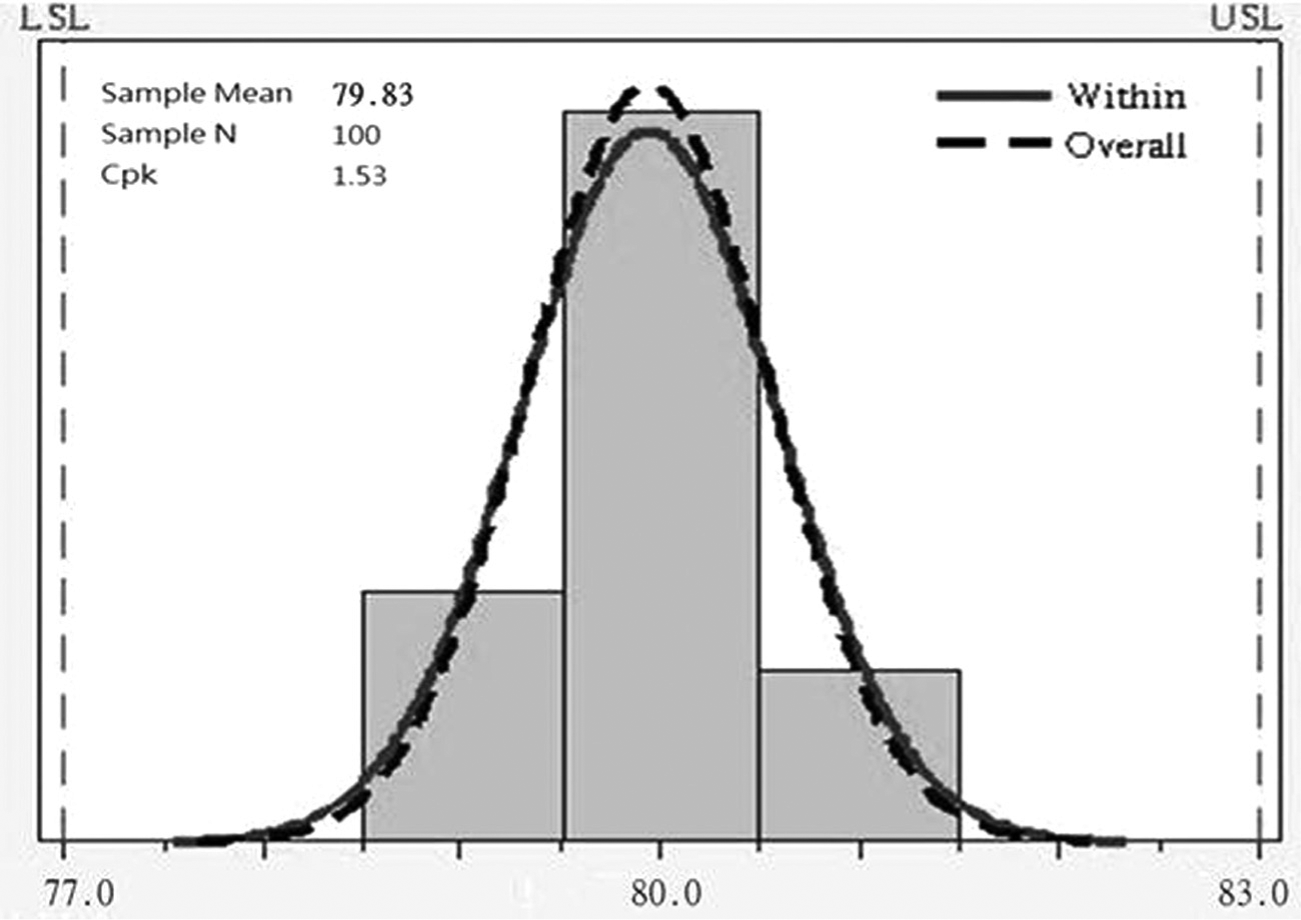
SMT solder paste printing thickness process capability.
Table 3 shows that the ranking of process capability index (
Conclusion
This study integrated the Taguchi method and multiattribute decision-making method (gray relational analysis method and TOPSIS evaluating method) in order to determine the optimal experimental level combination for SMT solder paste printing thickness for manufacturing processes. The empirical results suggested that SMT solder paste printing thickness process capability
Footnotes
Declaration of conflicting interests
The author declares that there is no conflict of interest.
Funding
This research received no specific grant from any funding agency in the public, commercial, or not-for-profit sectors.