
Abstract
Atomic force microscopy is often used not only to acquire the sample surface topography at the subnanometer scale but also to measure forces on the surface during imaging. This study aims to develop a practical measurement scheme of the actual scratching forces exerted during atomic force microscopy nanoscratching using a simple optical microscope setup. The measurement results are utilized to analyze the mode characteristics of atomic force microscopy nanomachining. Unlike typical atomic force microscopy force measurement methods using position-sensitive detector signal analysis, the optically measured atomic force microscopy cantilever deformation data using varying input (normal) forces along with information on the cantilever stiffness were used to estimate the components of the actual force exerted during nanomachining without using complex data interpolation methods. Scratching experiments were performed on Si(100) workpieces, and the estimated real force values were compared with the experimental data from atomic force microscopy nanomachining for each input force and corresponding scratch depth. Frictional coefficients and in-process acoustic emission monitoring results were also used to conduct an in-depth analysis of the actual force results. It is shown that the estimation results are meaningfully close to both the theoretical evaluations and the scratching experimental data as the scratch depth changes. Moreover, the force data are shown to have the ability to detect mode transitions such as the elastic–plastic and the plowing–cutting transitions during nanomachining, which validates the utility of this approach.
Keywords
Introduction
Atomic force microscopy (AFM) is often used not only to measure the surface topography of a sample at the subnanometer scale, but also to measure forces on the surface during imaging. 1 The force-sensing ability, which is made possible by the combination of the AFM cantilever (with tip) and the position-sensitive detector (PSD), which senses the position of a laser beam reflected from the cantilever, is an essential function in AFM manipulation applications such as AFM nanomachining and nanoscratching. There have been several attempts to estimate the forces generated during the AFM tip–workpiece interactions; for force measurements using PSD sensing, Ruan and Bhushan 2 reviewed the friction force measurement techniques for AFM and proposed measurement techniques for different scanning directions (parallel and perpendicular to the cantilever long axis). For collecting three-dimensional force components, Yan et al. 3 performed experiments and subsequent PSD signal analysis for varying groove depths during AFM scratching. Because the stiffness of the cantilever plays an important role in friction measurements, Neumeister and Ducker 1 reported stiffness calculations for a V-shaped cantilever using elastic theory and finite element method (FEM) analysis. Liu et al. 4 also performed calibrations for friction measurements for various cantilever shape and positions. To better characterize error analysis during PSD signal calibrations, Schwarz et al. 5 summarized typical sources of error such as the cantilever dimensions, laser beam positions, signal uncertainties, and statistical errors.
As demonstrated by the literature, measurement method of conventional forces during AFM machining remains a challenging problem due to technical difficulties in solving inherent problems including the cantilever stiffness, surface deformations, material property limitations (to the soft materials), and fluctuations and PSD calibration procedures.
In this research, however, a simple optical setup is used to estimate the real scratching forces exerted during AFM nanoscratching of Si(100). Scratching experiments were performed with varying normal forces, and the corresponding cantilever deflections were measured using an optical microscope. Assuming a quasi-static state, 3 the recorded deflections and cantilever stiffness were used to estimate real AFM scratching forces.
To validate the proposed scheme, estimated real forces from measured data were compared with both AFM nanomachining experimental data and related theoretical values including the friction coefficient and the minimum thickness value. The force data results are then further examined to determine whether they can be used to detect mode transitions such as the elastic–plastic and plowing–cutting transitions during the nanomachining. In addition, in-process acoustic emission (AE) monitoring, which has nanometer-level sensitivity, 6 was also used to investigate the mode characteristics and transitions.
Theories
AFM machining mode
AFM setups can perform various mechanical cutting processes such as scratching on a nanoscale using the measuring tip as a cutting tool. Zhang and Tanaka 7 reported four distinct scratching regimes as the depth of tool engagement increases (before fracture): no-wear, adhering, plowing, and cutting. After the elastic deformations (no-wear and adhering regimes), plowing mode, in which material is pushed out of the scratching groove (pileup), is observed. As the depth increases further, the material is removed in the form of machining chips (cutting regime) (Figure 1).8–10 After the cutting regime, if the scratching depth continues to increase, brittle fracture (cracks) can be initiated. As the relation between the normal force and the groove depth is nonlinear and nondeterministic because of process variables such as material properties and processing characteristics, a sophisticated experimental scheme accompanied by an appropriate theoretical framework is necessary to investigate the nanoscale process.
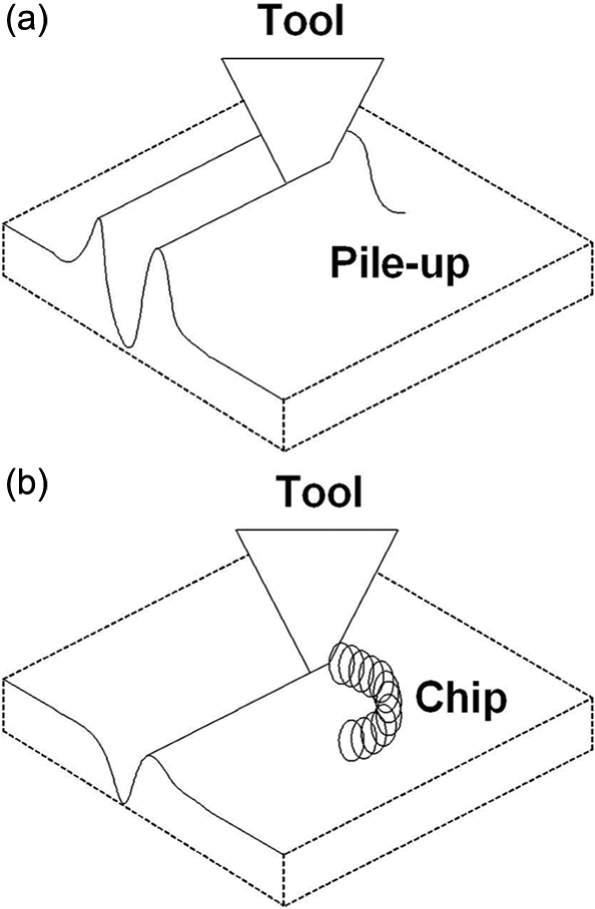
Schematic of nanomachining/micromachining mode in the plastic deformation region: (a) plowing mode and (b) cutting mode.
AFM cantilever and stiffness definition
Figure 2 shows optical and scanning electron microscope (SEM) images of an AFM cantilever used in this research. In Figure 3, the cantilever deflection is described and subsequently defined in equation (1) in terms of the angle (θ) from the horizontal line (θ = 12°, given by the tip maker) and normal (z direction) displacement
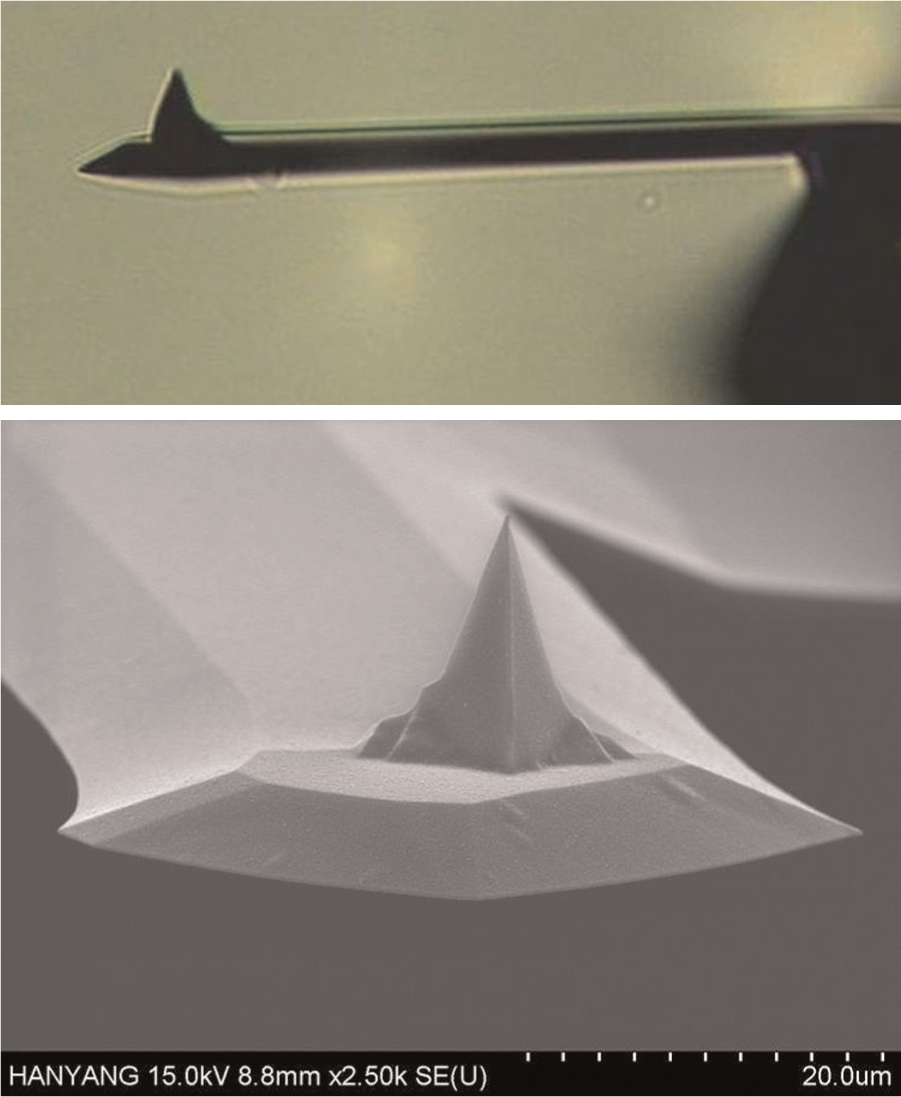
Optical/SEM images of the cantilever.
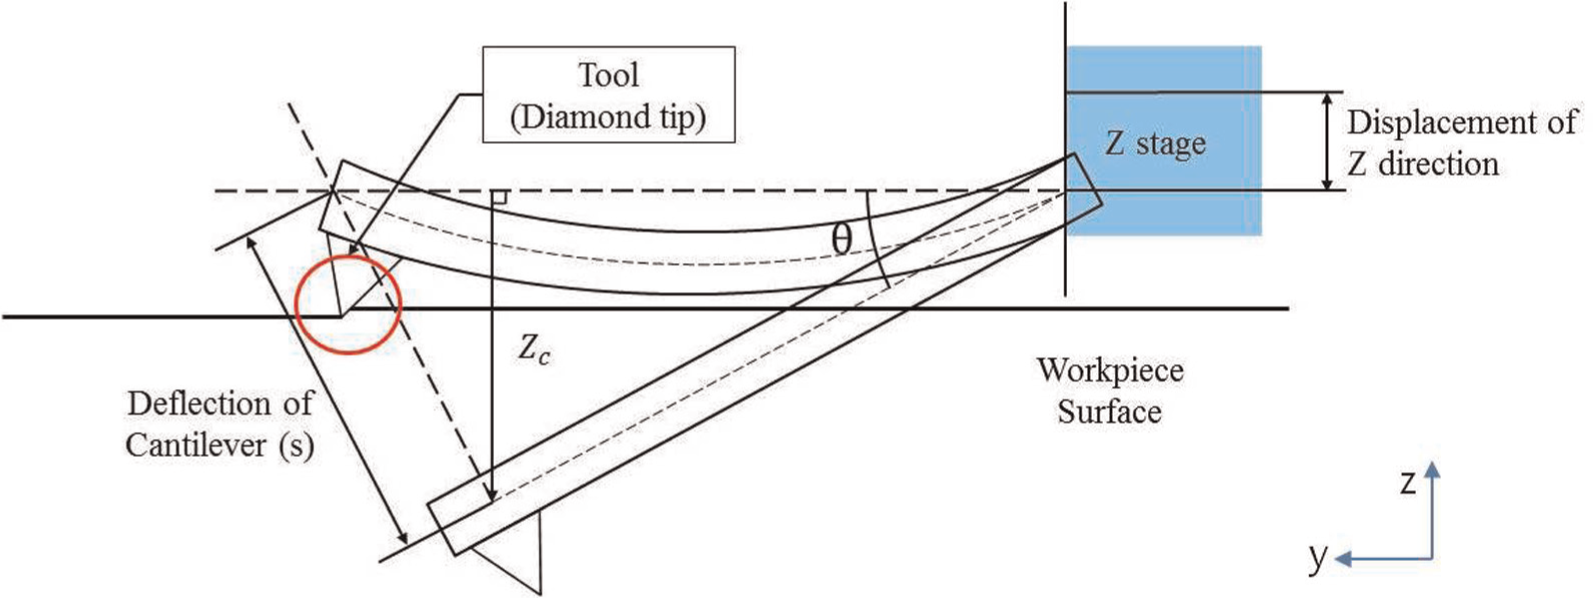
Deflection of the cantilever.
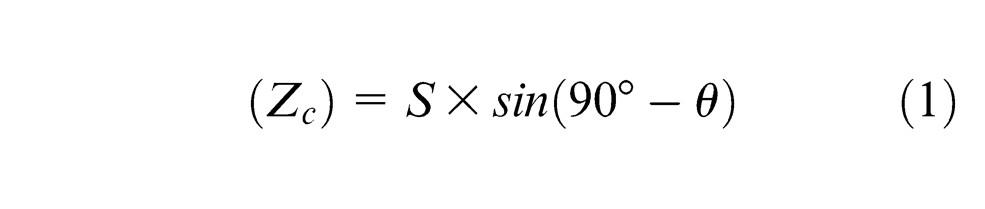
where Zc is the vertical deflection of the cantilever and S is the deflection of cantilever (Figure 3).
The forces exerted on the workpiece surface come from the restoring force of the cantilever at the center of the tip (Figure 4).
Schematic description of the cantilever.
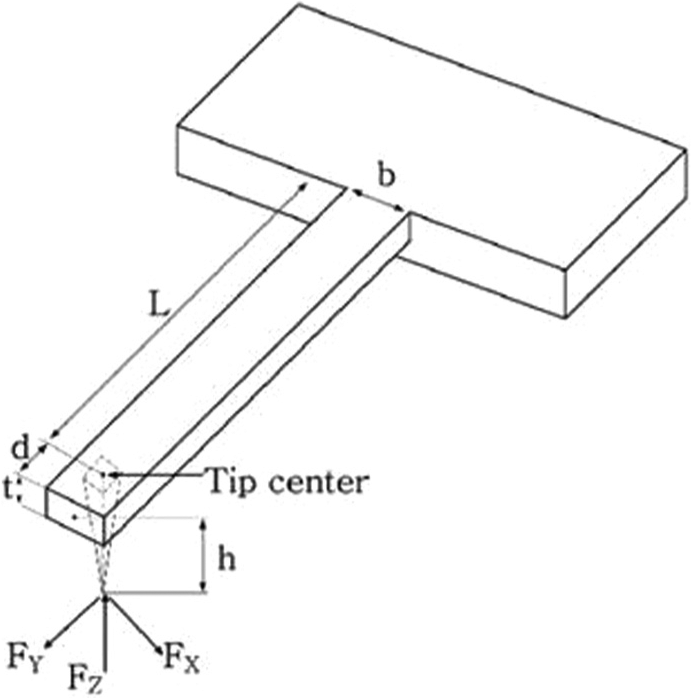
The cantilever stiffness (Kz) and the bending spring constant (Kxz) around the x-axis are shown in equations (2) and (3), respectively 3


where L is the cantilever length (to the center of the tip), b is its width, t is its thickness, and E is its Young’s modulus. In addition, the bending stiffness around the x-axis is

where h is the height of the tip.
AFM cantilever tip movements and related forces
As has been discussed in the literature,
11
if the cantilever tip is moving perpendicular to the cantilever axis (x direction), the torsional stiffness is generally not known and difficult to measure. On the other hand, if the tip is moving along the cantilever axis (y direction), both normal and friction forces result in bending of the probe (friction coefficient) with bending spring constants that can be easily measured or calculated, and related forces (Fy and
To estimate the actual force components on the AFM cantilever during nanoscratching, the normal force before scratching (Fz) is compared with the normal and lateral forces (
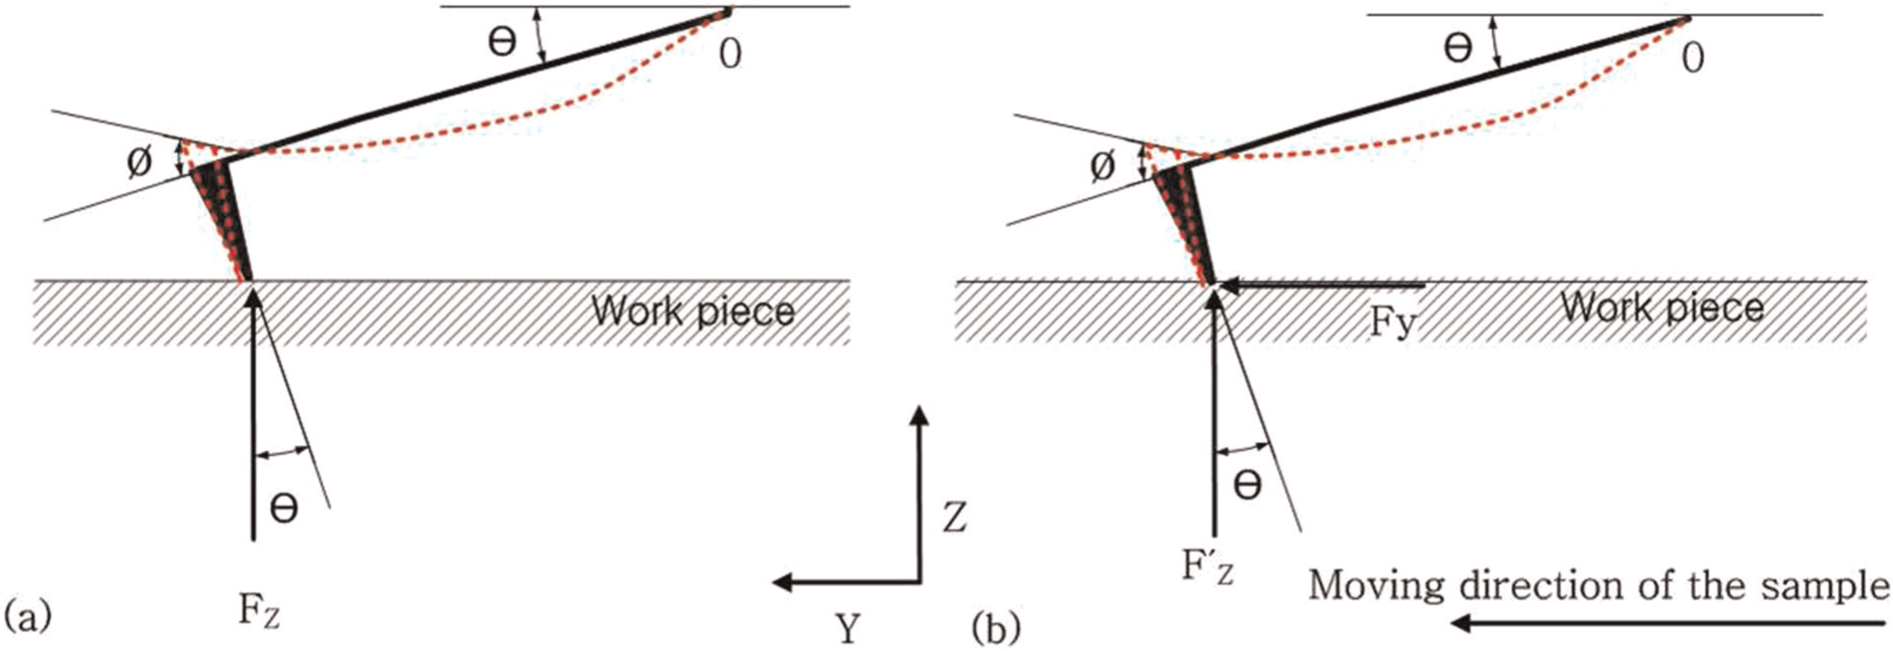
Forces around the cantilever tip before and during scratching: (a) forces on the tip before scratch and (b) forces on the tip during scratch. 3
Before scratch, the torsion (deflection) angle (
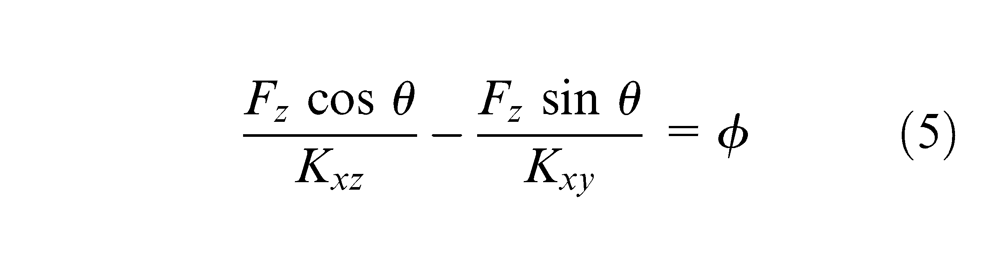
where Fz is the normal force during indentation.
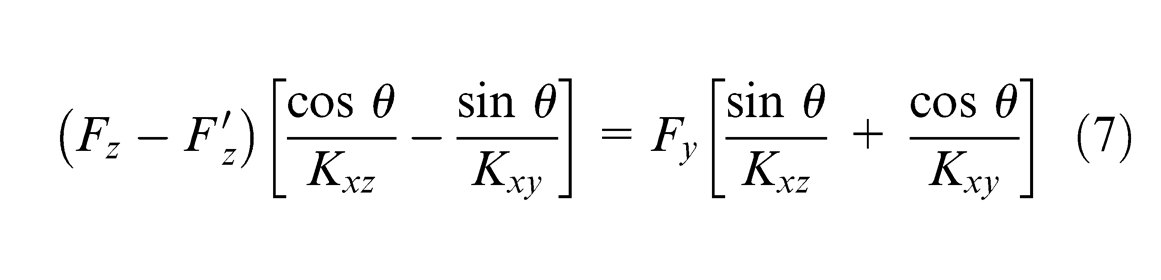
During scratching, assuming a quasi-static state, the torsional angle can also be expressed in terms of the actual normal and lateral forces 3
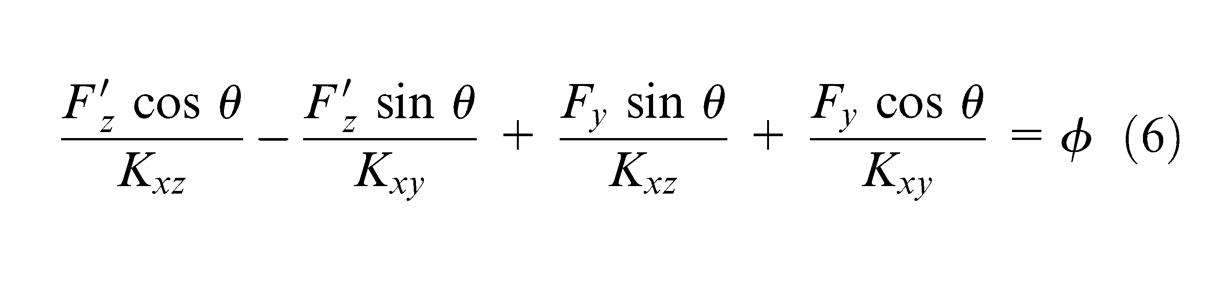
where
Because the torsional angle does not vary, the two equations may be combined 3
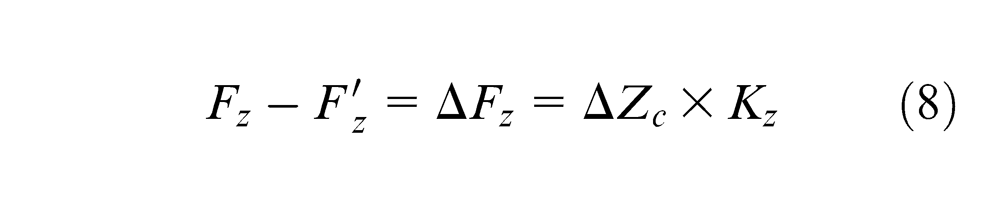
The difference between normal forces before and during scratching can be expressed as vertical displacement of the cantilever (ΔZc) multiplied by the stiffness of the cantilever
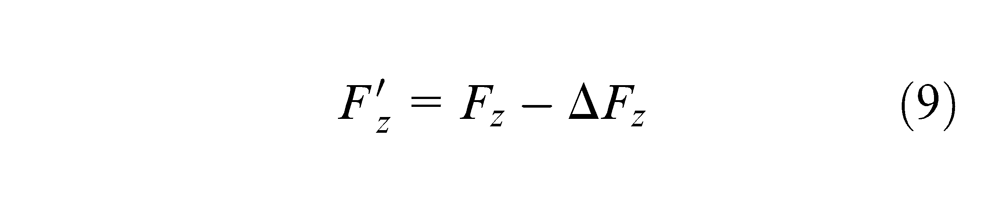
Therefore, the actual scratching force in the normal direction is expressed as the indentation force minus the cantilever deflection force
In addition, from equations (7) and (8), the lateral force during scratching can be expressed as
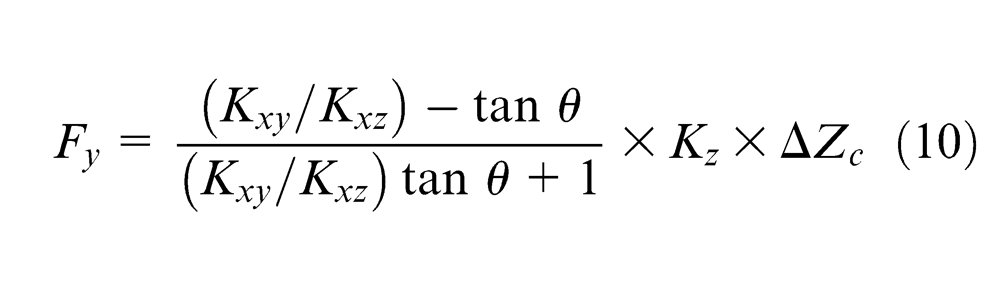
As summarized by Yan et al., 3 the actual forces during scratching can be expressed in terms of the cantilever displacement (measured from the PSD signal) and the cantilever stiffness. If the cantilever displacement can be measured, for example, by an optical setup, then the acquisition of actual (in process) scratching forces becomes quite simple, without requiring a special kind of cantilever, which conforms to the PSD sensitivity limitation ranges and complex PSD signal analysis processes.
Friction coefficient and minimum chip thickness estimation
To explain the plastic deformation regime (plowing and cutting) theoretically, a simplified geometric model 6 is employed to estimate the friction coefficient and subsequent minimum chip thickness during nanomachining with the variations of machining depth. For a spherical tip of radius R in contact with a softer body (Figure 6), plowing will take place with grooves.
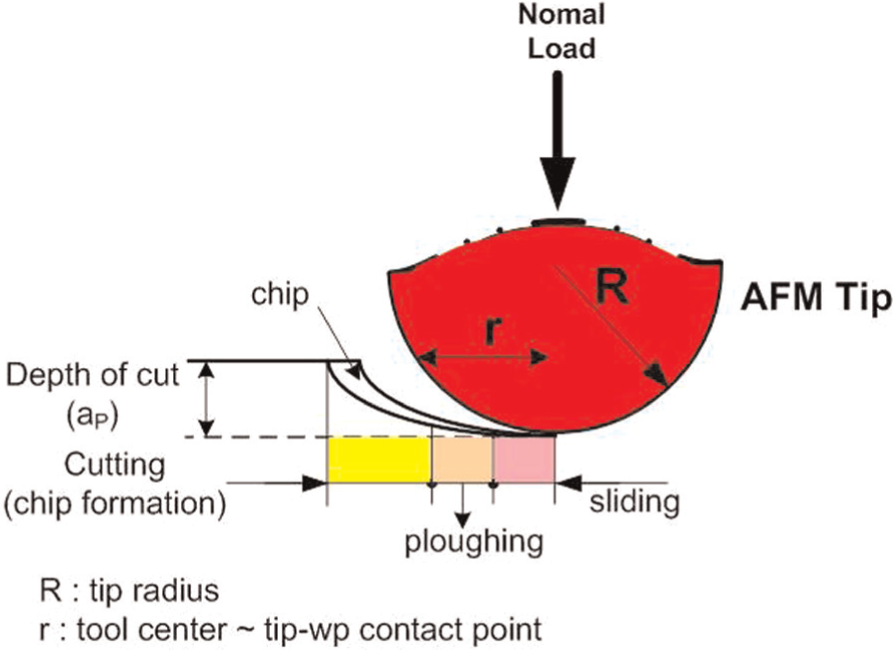
Material cutting model (microextrusion model) schematic of a hard sphere sliding. 13 At shallow cutting depth, plowing will take place, and after the undeformed chip thickness reaches a certain depth (ap), chip formation occurs.
Then the friction coefficient (
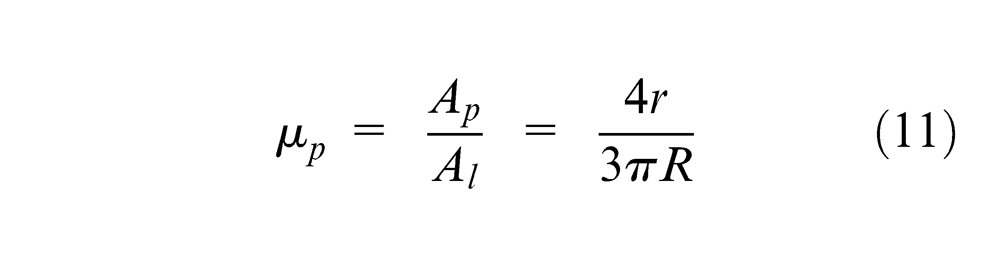
where r is the length from the tool center to the tip–workpiece contact point at the workpiece surface.
In nanometer-scale cutting, the cutting edge effect (nose radius (R)) and µp become the major factors for chip formation, which occurs only after the undeformed chip thickness reaches a certain minimum value (
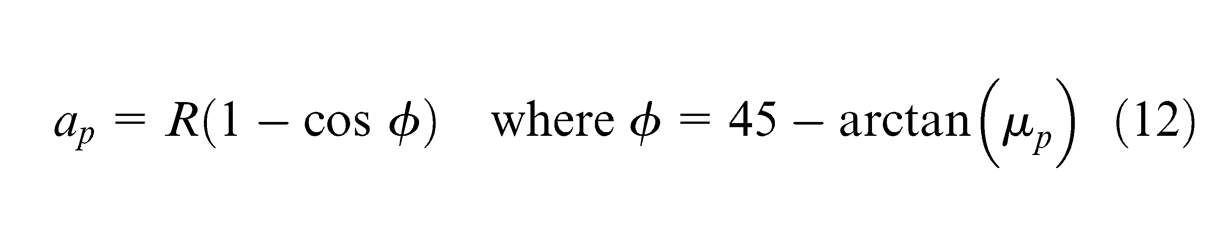
The above-mentioned equations can provide theoretical estimations to decide the deformation state and related mode transition during plowing and cutting.
Experimental setup
Nano-optical setup
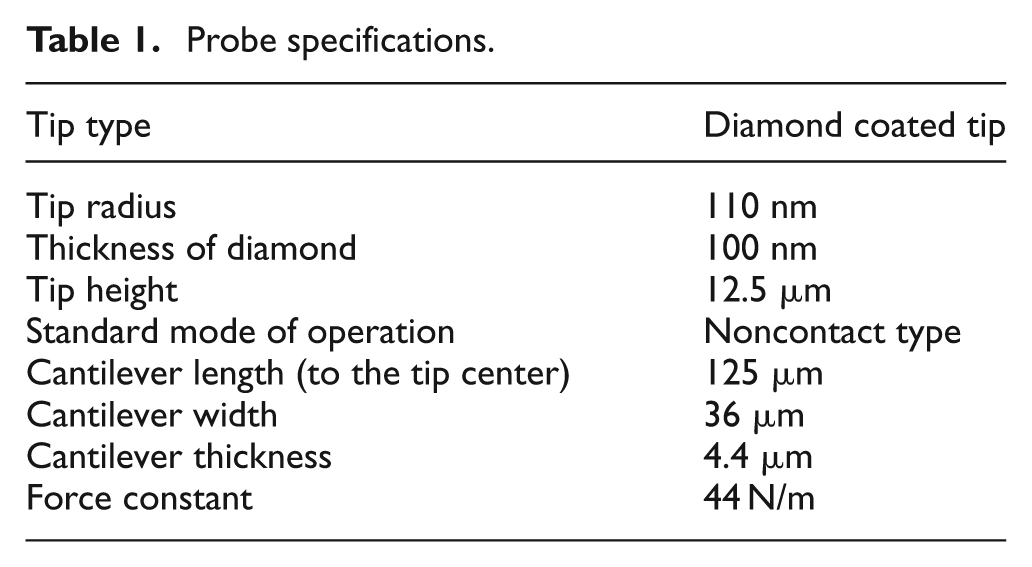
To observe the vertical displacement of the AFM cantilever (at the tip center) during scratching, an optical measurement setup (Figure 7(a)) consisting of a ball screw (2 µm/pitch), a lead zirconate titanate (PZT) (255 type standard piezoceramic from PI, 1 µm/V), and an optical microscope (Sometech with video imaging system EGVM 3513, ×500 lens) is constructed. The ball screw is used until the cantilever tip touches the workpiece (Si(100)) surface (Figure 7(b)). Afterward, the indentation is made by applying an appropriate voltage to the PZT. The input (normal) force was calculated by multiplying the deflection of the cantilever (from PZT displacement) by the cantilever spring constant (44 N/m, as shown in Table 1). For scratching, the workpiece is moved (in the y direction) with a constant speed (10 µm/s). The difference of cantilever deformation is measured and stored using the optical microscope system.
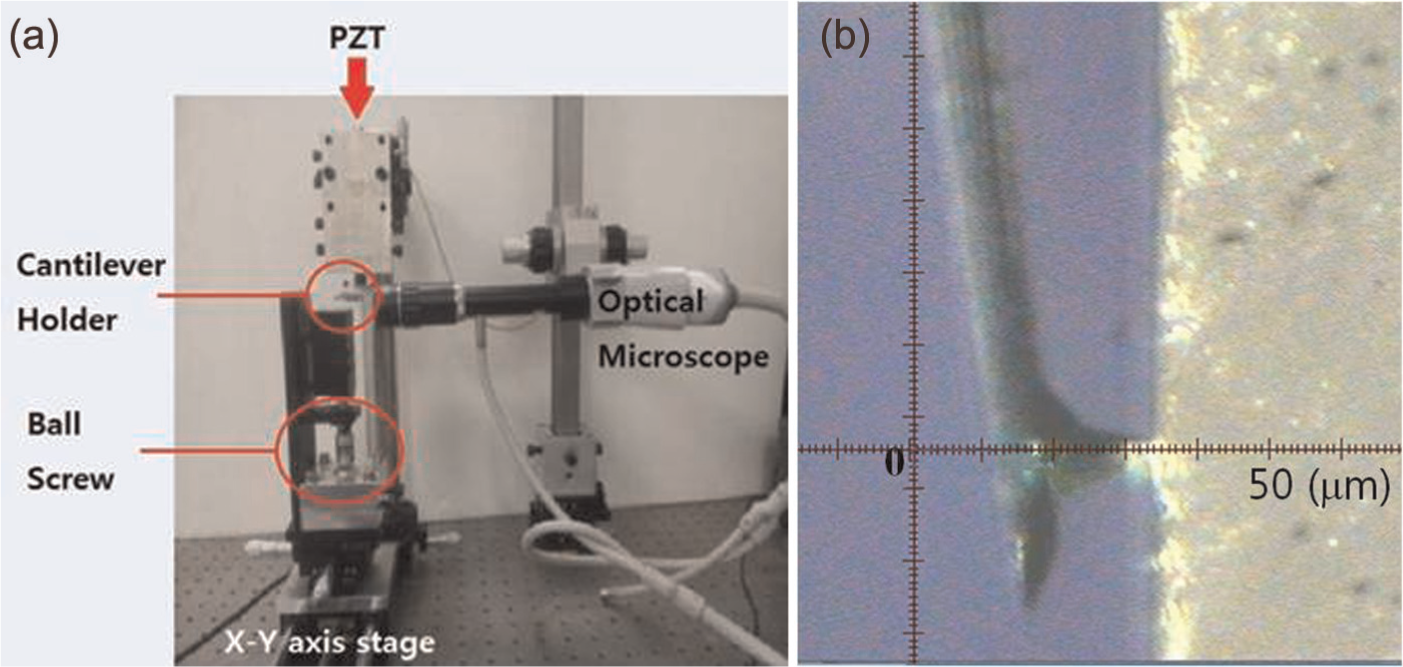
Nano-optical system—In the system, PZT is used to make indentation, ball screw is to make approach, optical microscope is to measure cantilever deformation, and Y stage is to move samples: (a) system setup and (b) image of tip approaching the surface.
Probe specifications.
AFM machining system and SEM
Figure 8 and Table 1 show the AFM setup and probe specifications, respectively, used for this research. An Auto-Probe M5 AFM system (by TM Microscopes) with data acquisition/nanolithography software and noncontact-type diamond-coated probes were used for the experiments.
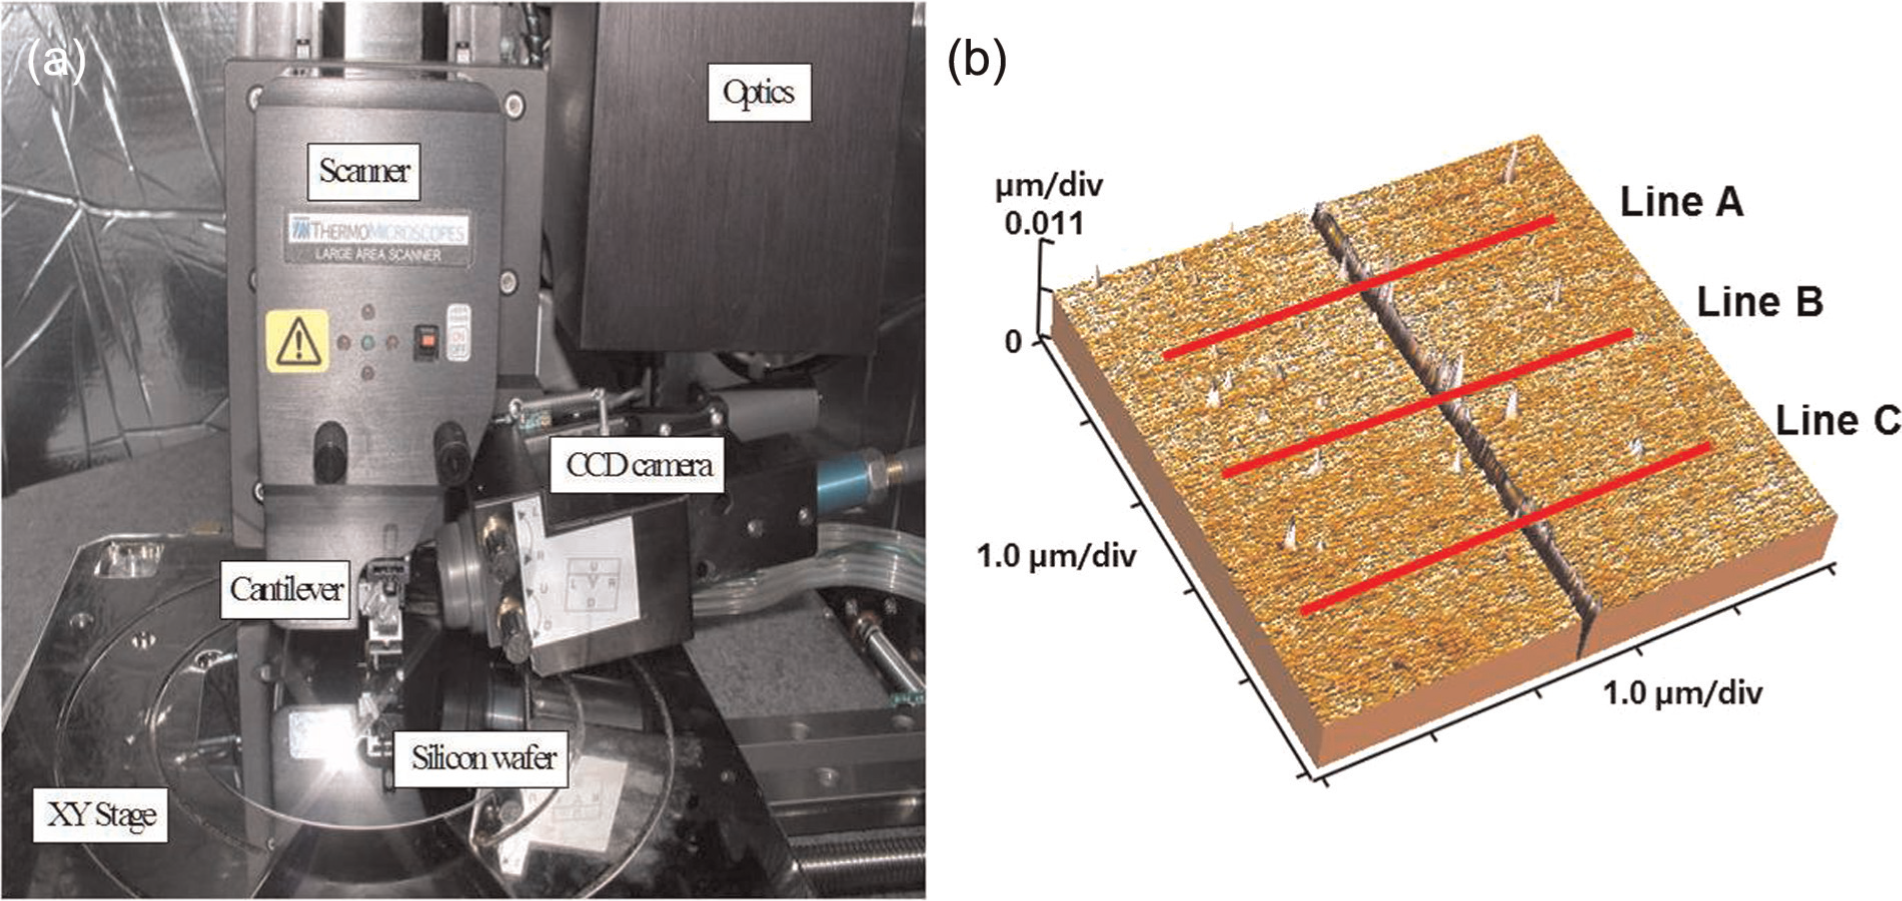
Auto-Probe M5 AFM instrument and a typical AFM experiment image: (a) AFM setup and (b) typical AFM scratching image.
To detect the mode transition and analyze the mode characteristics during AFM machining, experiments were performed on Si(100) workpieces with various groove depths, which are dictated by the vertical force (10–120 µN) applied to the AFM cantilever. The scratching speed was 5 µm/s, and cut depths were measured three times for each normal load input (Figure 8). Accurate cantilever stiffness values are necessary to estimate AFM tip movement and related forces. Figure 9 shows cantilever dimensions measured using SEM, which are essential for calculating the cantilever stiffness. 4
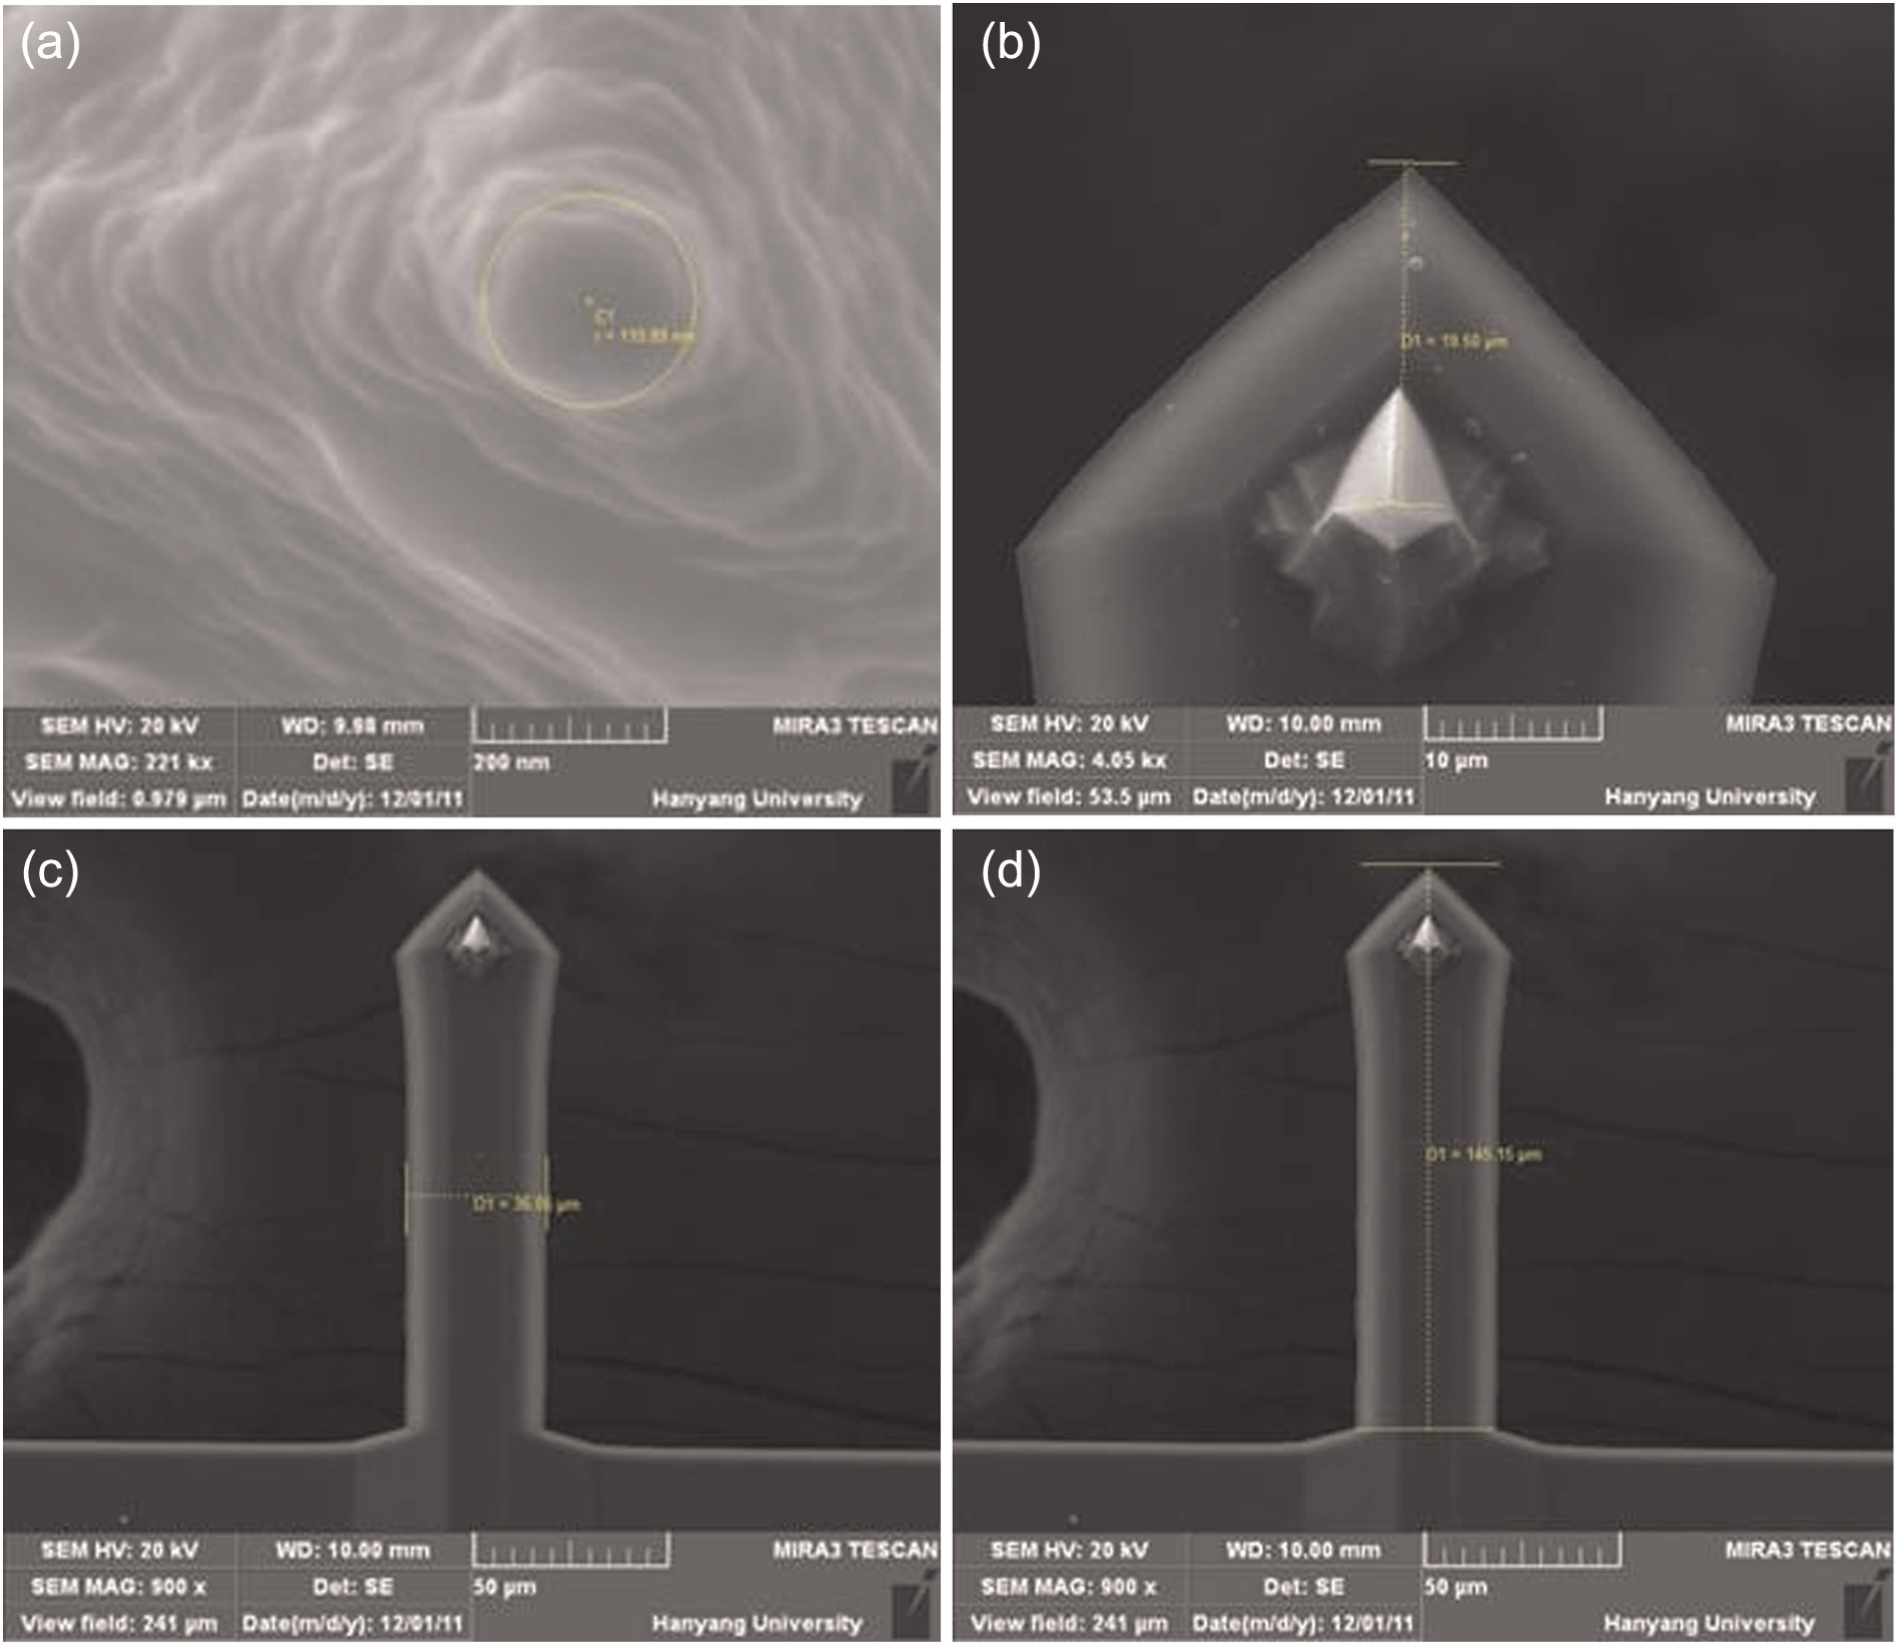
Major dimensions of the AFM cantilever from SEM measurements (described in Figure 4): (a) tip nose radius (R = 110 nm), (b) from the tip center to the end (d = 19.5 µm), (c) cantilever width (b = 36 µm), and (d) total length of the cantilever (L+d = 145 µm).
With the variations of machining modes, sometimes AFM images are inadequate to analyze detailed surface characteristics (i.e. machining chip generation). As an alternative, a high-resolution (1 nm image resolution) field emission scanning electron microscope (FE-SEM, Hitachi ultrahigh resolution (UHR) S-4800, Figure 10) was used to visualize nanomachined surfaces including chip formation.
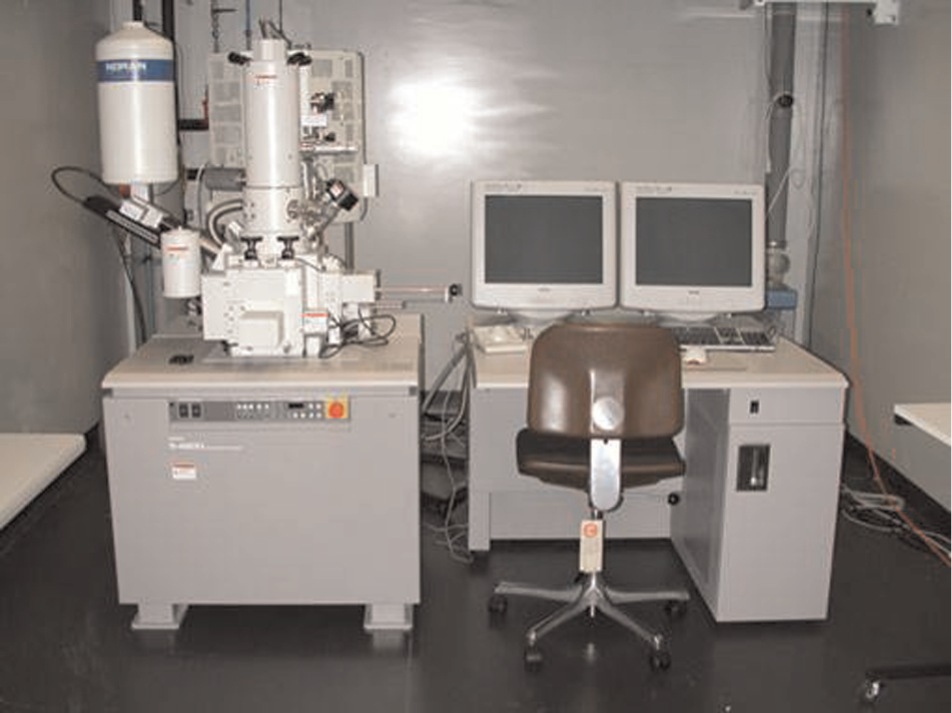
FE-SEM (Hitachi UHR S-4800).
AE monitoring system
Figure 11 shows a schematic of AE monitoring setup for the nanomachining experiments. The laser beam deflection method, which is the most often used for AFM force measurement, is also illustrated. In addition, AE monitoring conditions are summarized in Table 2.
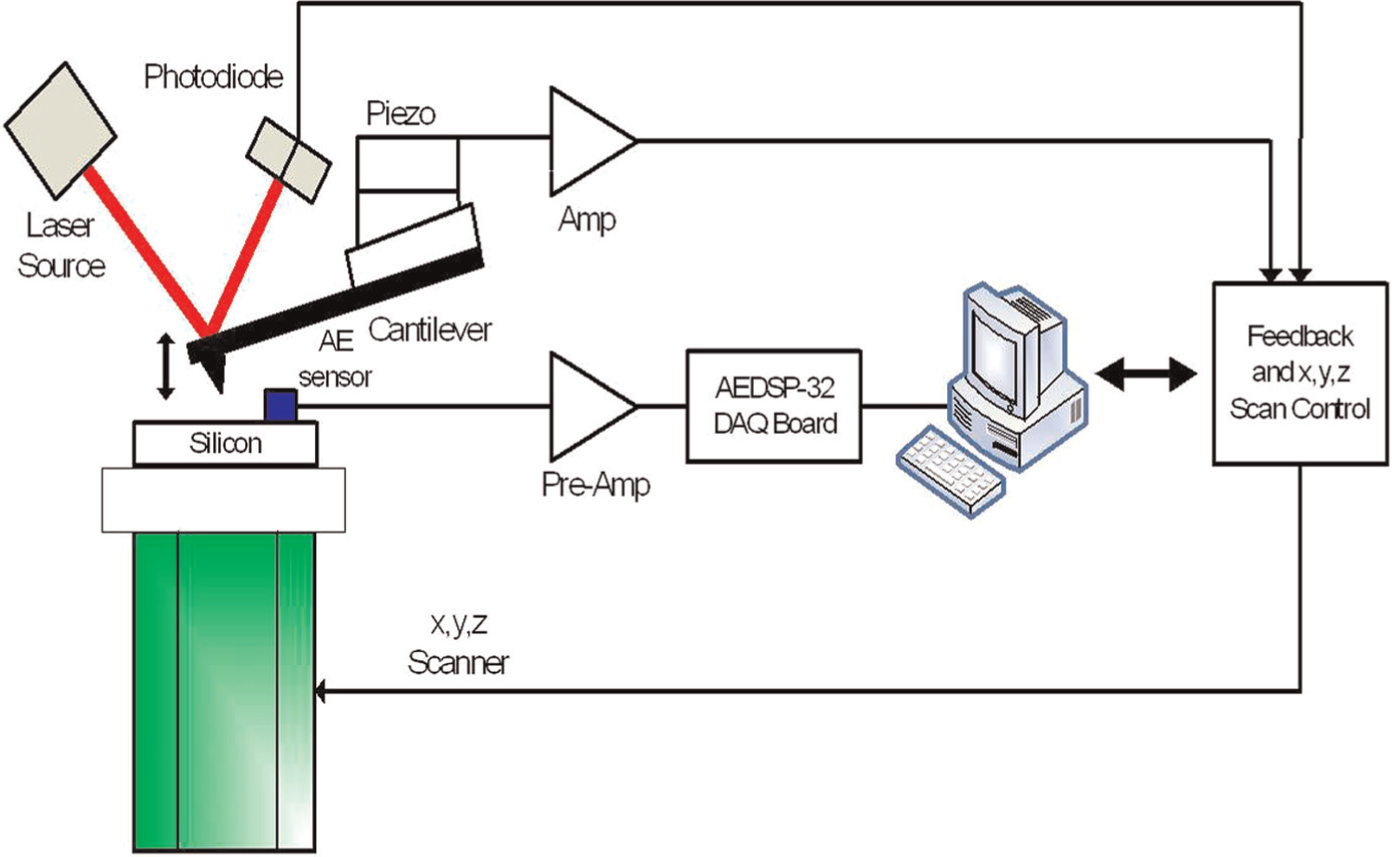
Schematic of AE monitoring system.
AE monitoring conditions.
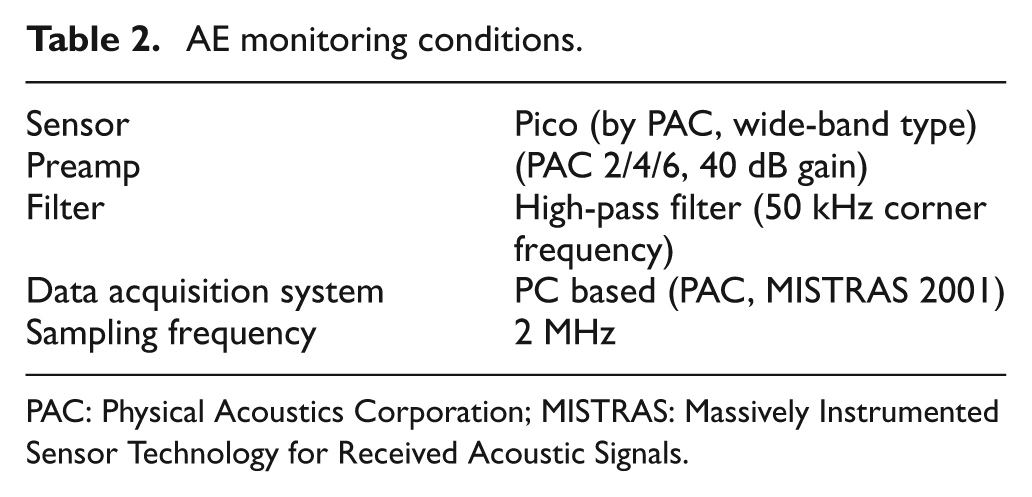
PAC: Physical Acoustics Corporation; MISTRAS: Massively Instrumented Sensor Technology for Received Acoustic Signals.
Results and discussions
Figure 12 summarizes the overall steps and tools to measure and analyze the nanomachining using the proposed scheme.
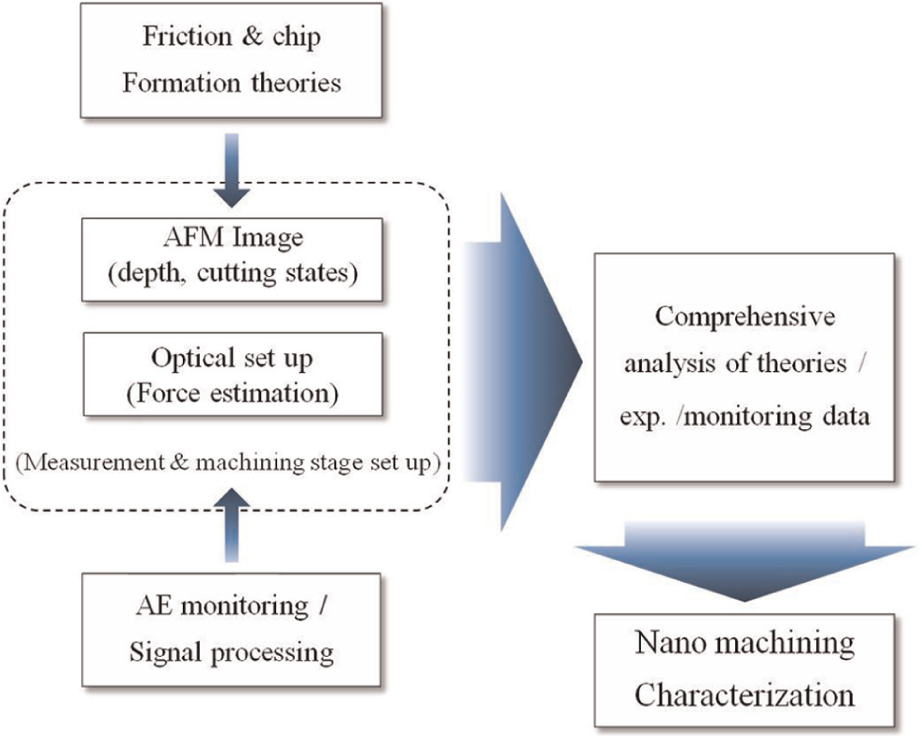
Overall procedure to measure and characterize the nanomachining.
Cantilever deflection measurements using optical setup
The cantilever displacements under various input forces (10–120 µN) were measured and illustrated in Figure 13. Little deformation is observed until the normal force reaches a certain value (20 µN), and then the deformation increases monotonically with the input force.
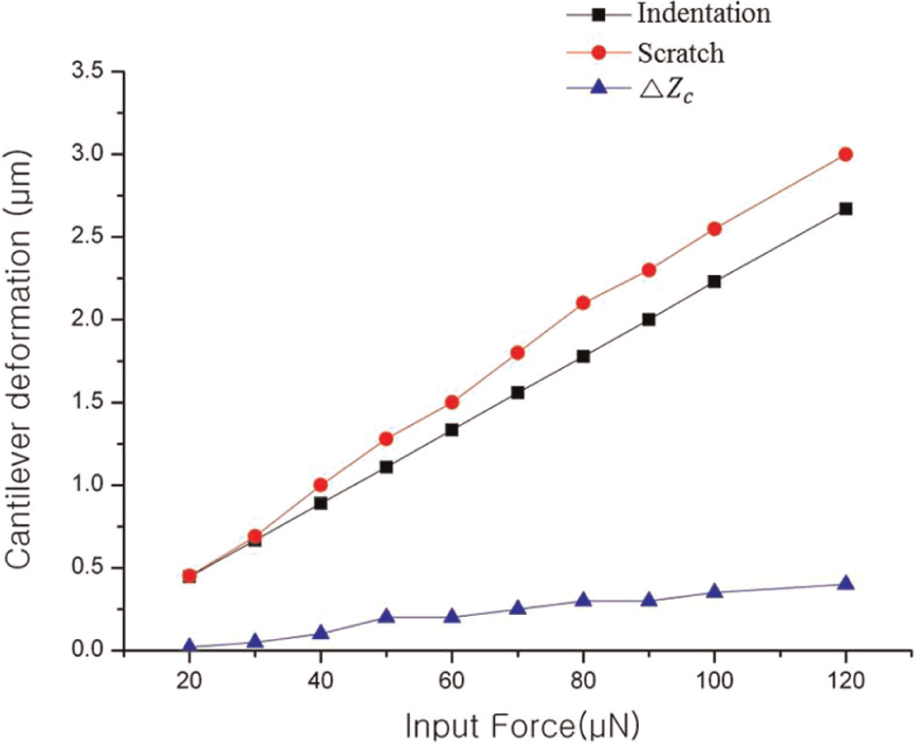
Optical measurement data with varying input forces.
AFM images and profiles from nanoscratching
Experiments were performed to detect and analyze the mode characteristics and transitions during AFM machining. The AFM profiles for various normal loadings and their corresponding SEM images are gathered in Table 3. In the initial AFM machining stages with relatively low input forces (under 20 µN), no significant deformations are noted (elastic region). The elastic–plastic transition depth value is observed to be under 4 nm.
AFM scratching results with varying normal forces.
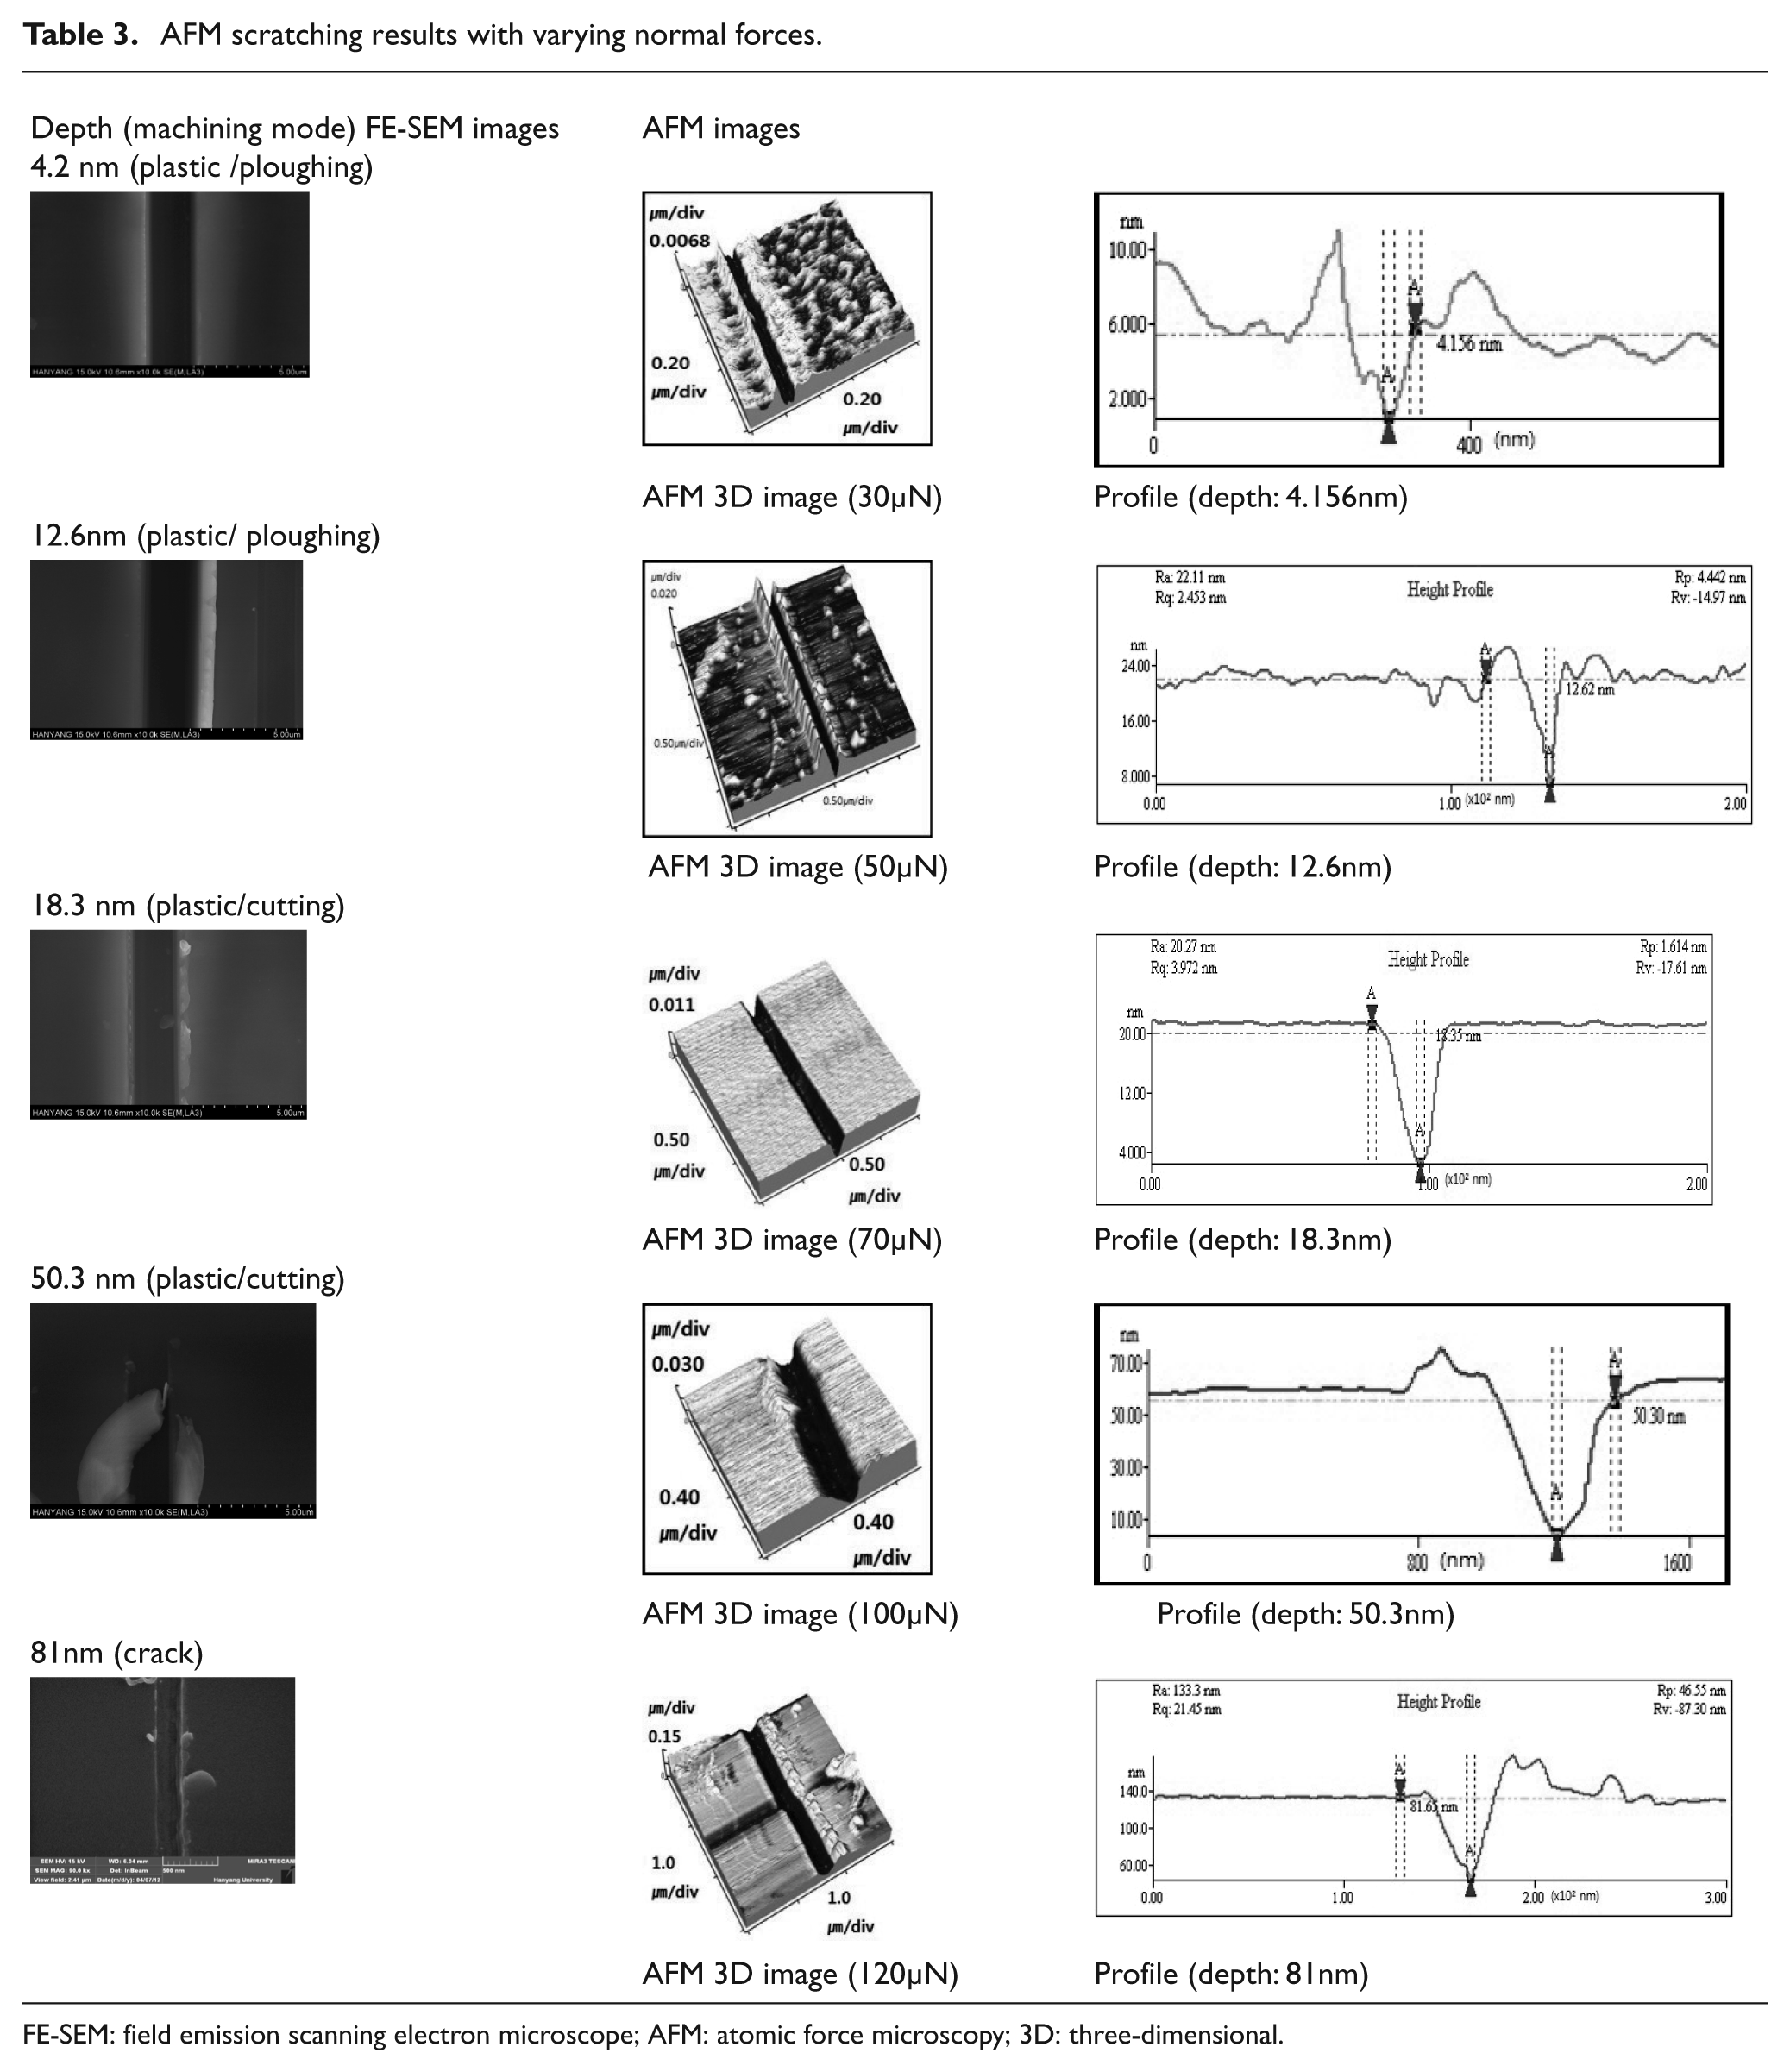
FE-SEM: field emission scanning electron microscope; AFM: atomic force microscopy; 3D: three-dimensional.
At shallow scratching depths in the plastic deformation region, scratch grooves are formed, and displaced material (“pileup”) can be observed along both sides of the grooves. As the depth increases, chips begin forming, indicating the transition from plowing to cutting. The transition depth for the current set of experiments was observed to be between 12.63 nm (normal force = 50 µN) and 18.3 nm (normal force = 70 µN).
As described earlier, a certain scratch depth (minimum chip thickness, equations (11) and (12))) is needed to initiate cutting; considering the calculated minimum chip thickness value (15 nm with a nose radius = 110 nm), the calculated results validate the experimental observations. With further increasing of vertical loads after chip formation, the initiation of brittle behavior (cracks) can be observed.
AFM scratching force estimation
Real force components (
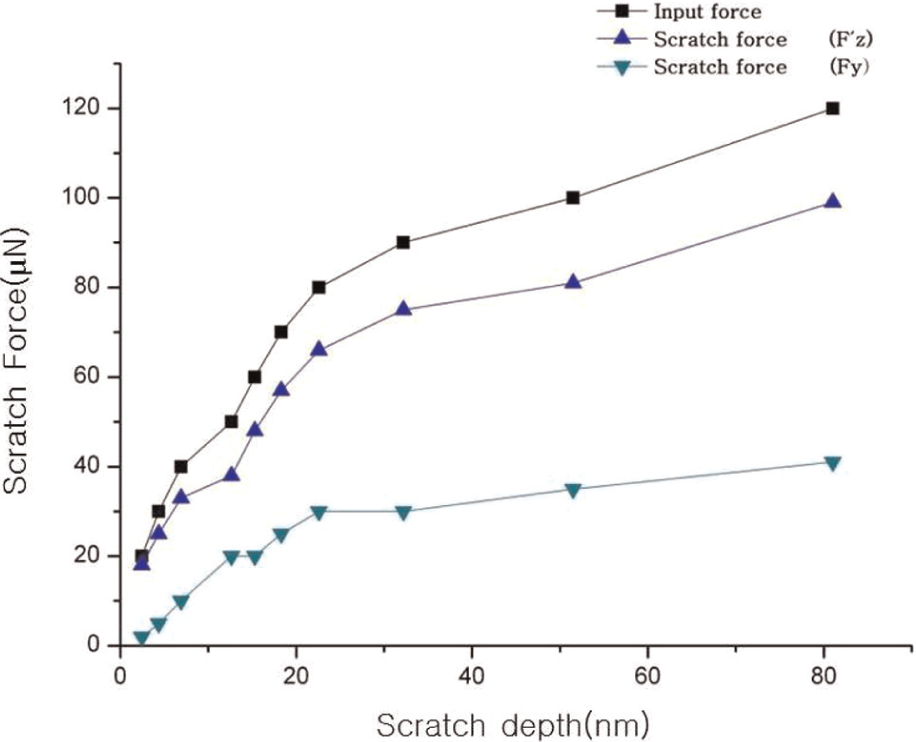
Scratch depth versus estimated scratch forces from the optical setup.
Friction coefficient values from the calculations (lateral force/normal force,
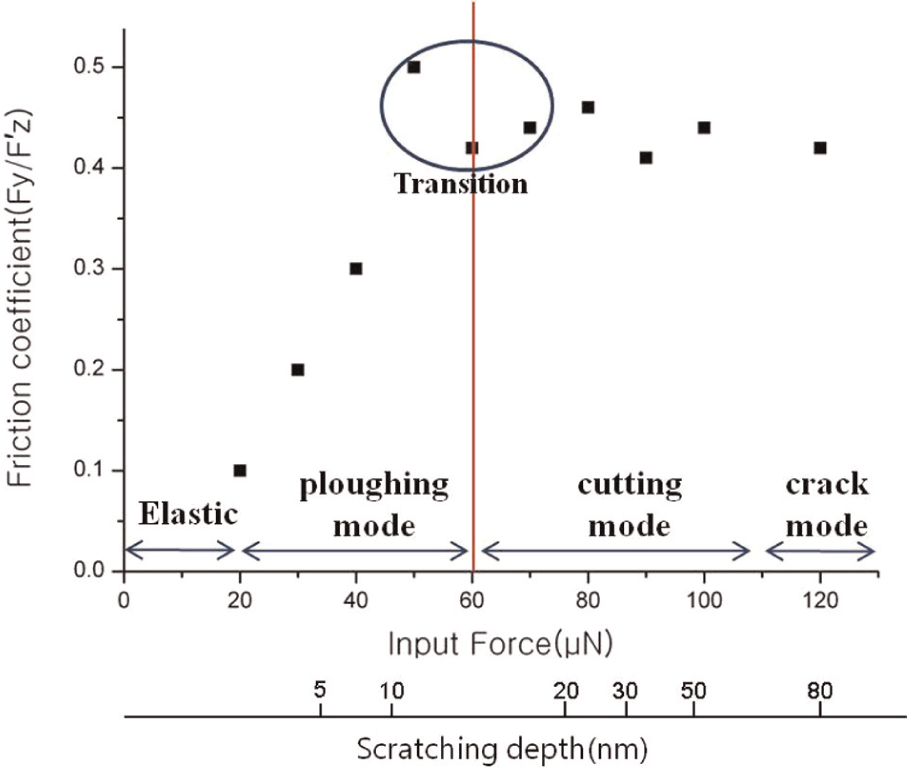
Estimated friction coefficients from optical setup and typical machining modes from AFM scratching.
For instance, Figure 16 shows theoretical values for the friction coefficient and corresponding minimum chip thickness from equations (11) and (12), respectively. Before the cutting regime (i.e. at the transition from plowing to cutting), the theoretical values (ap = 15 nm) closely match the AFM experimental results in Table 3.
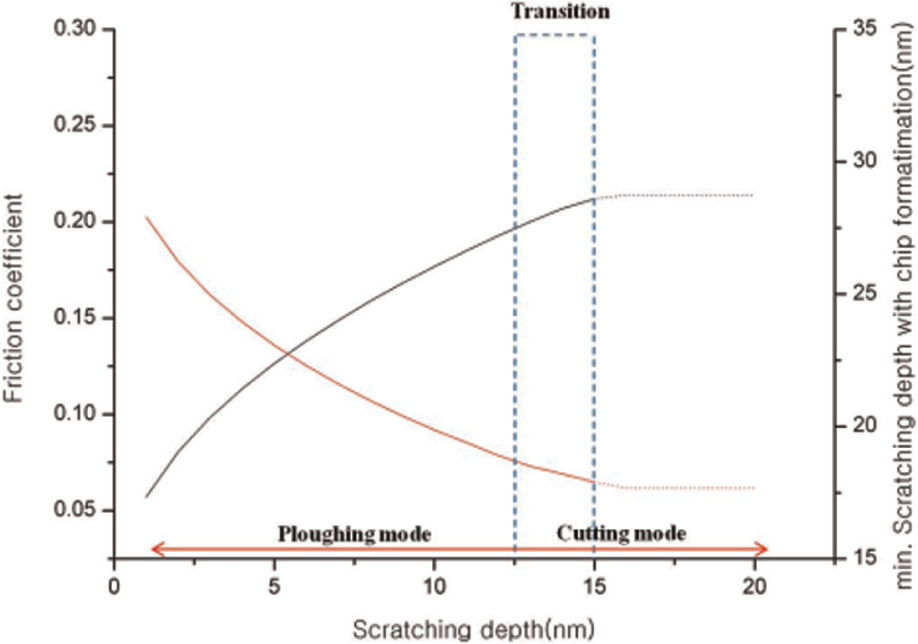
Theoretical friction coefficient and minimum chip thickness value during AFM machining (R = 110 nm).
In Figure 15, friction coefficients for varying input forces are compared with the AFM nanoscratching experimental results and the corresponding groove depths (see Table 3). The input force ranges for the different machining modes (plowing, cutting, and crack initiation) largely overlap with those of the AFM machining data.
As illustrated in Figure 15, the friction coefficient in the plastic region (after plowing) increases with increasing normal force, as shown in Figure 16, which has also been observed in other studies. 17 Moreover, the region in which the friction coefficient fluctuates coincides with the plowing–cutting transition region in the AFM scratching results (Table 3).
AE monitoring
It has been shown that AE monitoring signals have a strong correlation with friction coefficient, even in nanometer-scale machining. 6 Figure 17 summarizes the AE monitoring results during nanoscratching. For each AFM scratching experiment at a different input force, the average AE root mean square (RMS) was acquired from sampled AE signals (Figure 17).
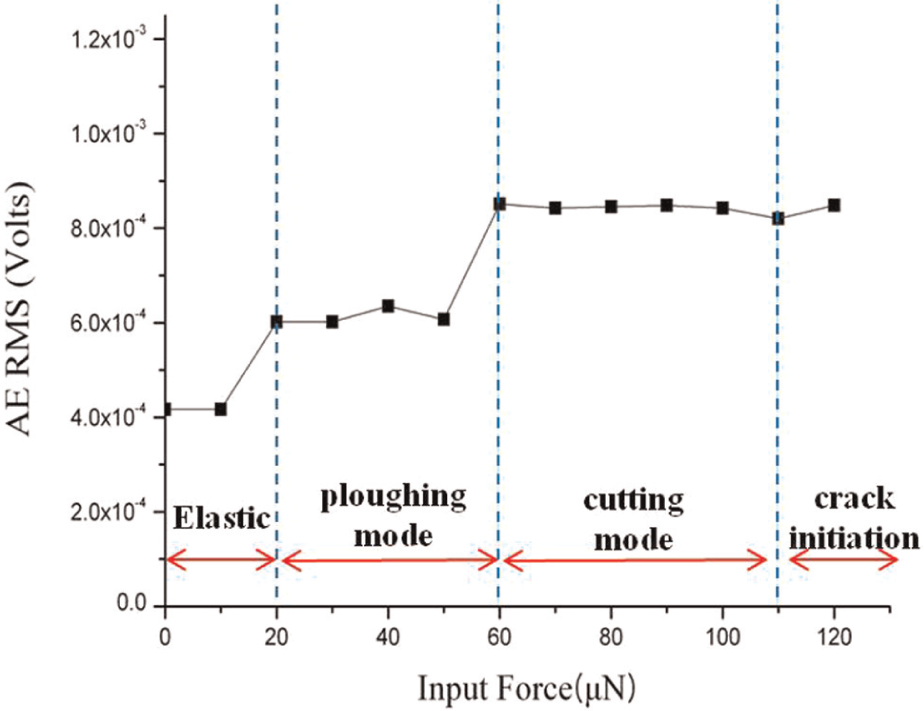
AE monitoring results during nanoscratching.
The AE monitoring results show that the signal values are negligible in the elastic region and then increase with normal forces in the plowing region. After the plowing–cutting transition, the signal stabilizes, which has previously been reported as a characteristic of the friction coefficient during nanoscale machining. 17
From the above-mentioned observations, the estimated results were shown to closely correspond to the theoretical, experimental, and sensor monitoring results in the plowing region and the plowing–cutting transition region. Moreover, as the proposed scheme (optical measurement setup and sensitive sensor monitoring) is viable to examine subtle changes during nanoscale processing with depth changes, it can be applicable to nanopatterning of various materials including thin film–coated materials.
Conclusion
In this study, the actual normal and lateral forces during AFM nanoscratching were estimated by optically measuring cantilever deformation upon an imposed normal force. Using friction coefficients as a main comparison parameter, it is shown that the estimated forces were reasonably close to the results of AFM nanomachining and AE monitoring experiments. Moreover, real force components for distinct machining states such as plowing and cutting and the related machining mode transitions can also be monitored and detected with this scheme.
Footnotes
Conflict of interest
The authors declare that there is no conflict of interest.
Funding
This research was supported by Basic Science Research Program through the National Research Foundation of Korea (NRF) and funded by the Ministry of Education, Science and Technology (2012-0012171).