
Abstract
Statistical tolerancing has been widely employed in industry as it is more practical compared with the worst-case tolerancing in achieving lower manufacturing cost while satisfying design specification. As reciprocal exponential function is one of the commonly employed cost–tolerance models in practice and current approach is difficult to allocate statistical tolerances for such a function, this article investigates a method for optimal statistical tolerance allocation with such a cost–tolerance function. The method is to minimize manufacturing cost subject to constraints on tolerance target and machining capabilities. The optimization problem is solved by applying the algorithmic approach. Particularly, a closed-form expression of the tolerance optimization problem is further derived based on the Lagrange multiplier method with integrating the Lambert W function, a multivalue complex function. In addition, for constrained minimization problems with only equality constraints, the optimal tolerance allocation can be obtained by solving simultaneous equations without the time-consuming computing on differentiating while keeping the solution accurate. An example is illustrated to demonstrate the application of this approach. Through comparisons with the regular Lagrange multiplier method applied to reciprocal exponential cost–tolerance type, the result reveals that tolerances can be allocated much faster using this proposed method.
Keywords
Introduction
Statistical tolerance analysis plays a significant role in establishing engineering specification that has substantial influence on determining the process capability index for a certain process. It has been widely employed in manufacturing industry as it is more practical compared with the worst-case tolerancing in achieving better product quality and lower manufacturing cost while satisfying design specification. For example, 6σ (six sigma or six standard deviations) is a rigorous and disciplined methodology that utilizes data by facts and statistical analysis to measure and improve a company’s process performance and product quality by identifying and preventing shortcomings in manufacturing. It is a statistical term that denotes that in a batch of identically manufactured parts, 99.99966% of the items based on Motorola presumption are within the acceptable tolerance specified by the customer. 1 However, the traditional quality paradigm defined a process capability if the plus and minus three-sigma (±3σ) range of process natural distribution was less than the designed tolerance. Under the assumption of normal distribution, this three-sigma quality level translates to a process yield of 99.73%. Consequently, the root sum square (RSS) method for tolerancing becomes a conventional analysis tool for statistical tolerancing. 2
Over the past few decades, several articles have been devoted to the study of optimal statistical tolerancing problem. Srinivasan et al. 3 and Skowronski and Turner 4 estimated design parameters for statistical dimensional tolerance synthesis by normal distribution, whereas Kharoufeh and Chandra 5 and Stefano 6 proposed a new statistical tolerance stack-up analysis approach for nonnormally distributed dimensions. In addition, Zhang et al. 7 put forward an optimization model and approach to allocate optimum statistical tolerance based on the distribution function zones. Recently, some nontraditional optimization techniques have appeared to tackle the tolerance optimization problems. Shan et al. 8 and Wu et al., 9 for example, presented a statistical tolerancing design method using genetic algorithm.
The Lagrange multiplier (LM) method is a classical approach for solving constrained optimization problems. Chase et al. 10 and Yang and Naikan 11 adopted the LM method to simplify the computation and acquire an exact closed-form solution in tolerance allocation. Although, Singh et al. 12 and Kumar et al. 13 claimed that the application of the LM method is tedious and difficult, especially in a mixed variable optimization problem involving both continuous tolerance and discrete process selection, the LM method based on exhaustive search characteristic undoubtedly can acquire a global solution for optimal tolerance allocation problems. Besides, the near-optimal solutions obtained using nontraditional optimization techniques were not consistent so that it is possible to skip the best manufacturing process for optimal tolerance allocation of complex assemblies with alternative process selection. As a consequent, Kumar et al. 14 collocated the LM method with searching technique to discover the optimal tolerance allocation of complex assemblies with alternative process selection. This method reveals better results than other traditional optimization approach.
Although the manufacturing cost of a product is related to the material, shape, and production methods of a product, the production procedure and processes, in particular the finishing process, are highly dependent on the tolerancing specifications. A product with tight tolerancing requires precise manufacturing process, in addition to the regular preprocesses, and results in high manufacturing cost. Therefore, tolerance allocation is critical for determining the manufacturing cost not to mention that the tolerance stack-up must satisfy the design requirement. With regard to optimal tolerance allocation satisfying least manufacturing cost, a great deal of studies has been made on reciprocal power cost–tolerance relationship as well as worst-case tolerance analysis. However, optimal statistical tolerance allocation on reciprocal exponential cost–tolerance model is still lacking as it becomes a tough problem to solve a transcendental equation with reciprocal exponential. The expressions with exponential responses appear in many problems in physics and engineering, and many equations involving exponentials can be solved by making use of Lambert W function. More recently, the Lambert W function has been used with increasing frequency to arise in a wide variety of mathematical, physical, chemical, and engineering fields.15–17 Only few attempts have so far been made on tolerance optimization problem integrating the Lambert W Function. 18 For instance, Govindaluri et al. 19 and Shin et al.20,21 derived a closed-form solution to the tolerance optimization problem using the Lambert W function by trading off several interrelated costs and a quality loss. Cheng and Tsai 22 solved tolerance allocation with minimum manufacturing cost under constraints of design tolerances by employing the Lambert W function is another example.
While it is known that the LM method is an efficient approach to accomplish optimal tolerance allocation, this article is an attempt to provide a systematic analysis regarding statistical tolerance on reciprocal exponential cost–tolerance model for least cost tolerance allocation based on the LM method by introducing the Lambert W function. This study derives the functional form of the exact expression for the statistical tolerancing with reciprocal exponential cost–tolerance model and then obtains the explicit exact expression in terms of the Lambert W function. By means of derivative closed-form solutions, a quick decision on optimal tolerances can be derived without resorting to rigorous optimization procedures using numerical methods in order to differentiating. An example is also discussed to illustrate the feasibility and limitations of employing the LM method in tolerance allocation. This article then concludes the contribution showing the improvement of optimizing tolerance distribution from the traditional LM method.
Methodologies
Statistical tolerancing
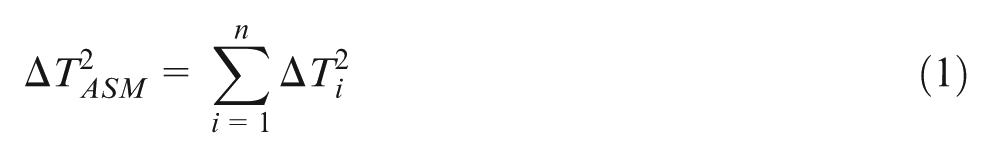
The statistical tolerancing is a more realistic and economical way of allocating component tolerances based on batch production. Tolerance allocation is to determine an allowable criterion, often based on manufacturing cost, on component characteristics to ensure the quality of the assembly while possessing minimum manufacturing cost. The component tolerance analysis in an assembly generally takes into account tolerance stack-up problem. To avoid the tolerance accumulation of the resultant dimensions exceeding the design specification, the process dimensional chain has been used to analyze for design and manufacturing. The dimensional chain is defined as the sum or difference of all relevant contributing machining dimensions. Applying the tolerance chain concept and assuming normal distribution of part dimensions, the resulting tolerance ΔTASM is equal to RSS of the relevant contributing process tolerances ΔTis for statistical tolerance analysis. It can be formulated as
Generally speaking, the statistical tolerancing is a better approach used in design for mass production.
LM optimization method
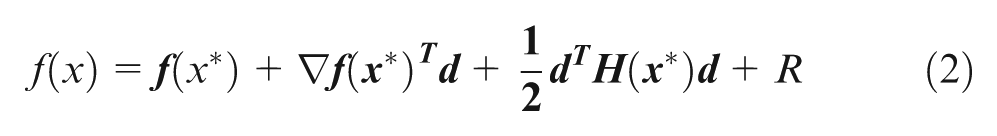
The concept of the LM method is to transform the constrained optimization problem into an unconstrained one. The technique introduces undetermined multiplier(s) imposing the constraint to construct a new objective function without any constraint, namely the Lagrangian function. The transformed constrained problem thus can be solved by unconstrained numerical optimization methods.
For unconstrained optimum design, the multidimensional form of Taylor’s expansion about the given point
where ∇
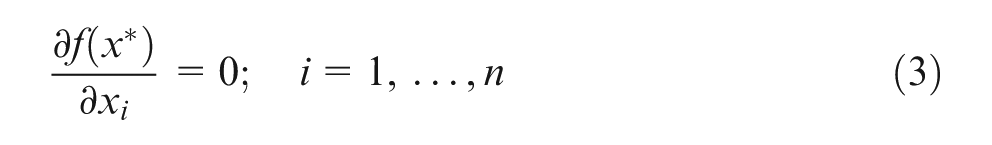
First-order necessary conditions
Second-order necessary conditions
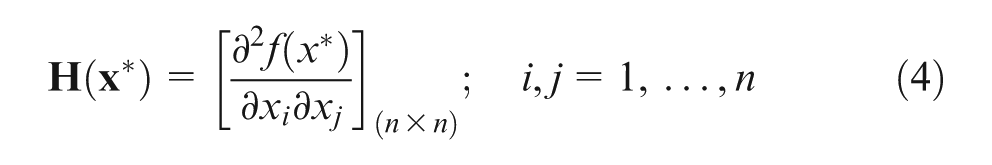
where
Second-order sufficiency conditions. If the matrix
Applying the foregoing criteria, the first-order necessary conditions can be used to solve the optimization problem, while both the second-order necessary and sufficient conditions are used to check whether the solution satisfies minimum. Note that since the cost–tolerance function cannot have negative value, namely convex function,
Lambert W function
The Lambert W function is defined as the solution of the following equation
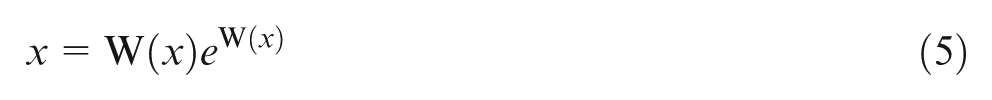
where x is a complex number. The Lambert W function is a multivalue complex function. If x is a real number such that x≥−1/e, then W(x) becomes a real function and possesses two real branches. The branch in the range [−1,∞) is called the principal branch and denoted as W0(x). The other in the range (−∞, −1] is called the negative branch and denoted as W−1(x). Both branches of the Lambert W function are depicted in Figure 1, where the two branches are identified. The solid line W0(x) is defined for −1/e≤x < ∞, and the dot line W−1(x) is defined for −1/e≤x < 0. The two branches meet at the point (−1/e, −1). It is noteworthy that W(x) has two real values for −1/e≤x < 0. Nevertheless, numerical analysis in engineering applications often focuses attention on real values of the Lambert W function with respect to positive x-axis. In other words, the range of x is limited to 0 ≤x < ∞, the Lambert W function can ensure a unique solution. Based on tolerancing characteristic, in this study, the main stress falls on x≥ 0.
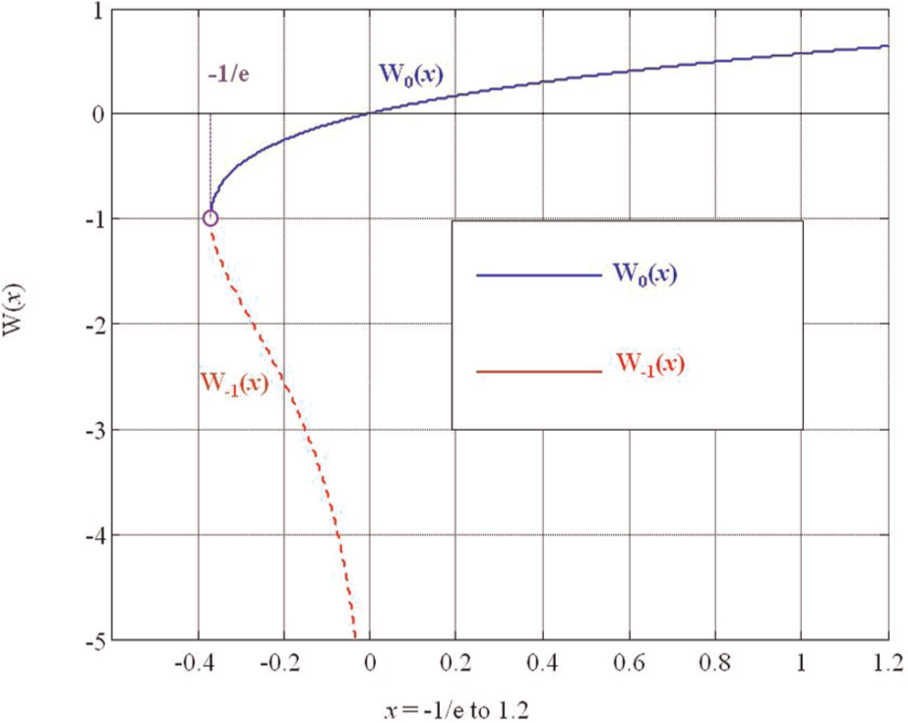
Plot of the Lambert W function.
Even though the Lambert W relation is noninjective and fails to be expressed in terms of elementary functions, many equations involving exponentials can be solved using the Lambert W function. The strength of the Lambert W function approach lies in the fact that the function has been implemented on several software packages such as Maple, MATLAB, or Mathematica that afford to compute the value of the Lambert W function easily.
Statistical tolerance allocation with reciprocal exponential cost–tolerance model
The general cost–tolerance relationship can be expressed as the following two types
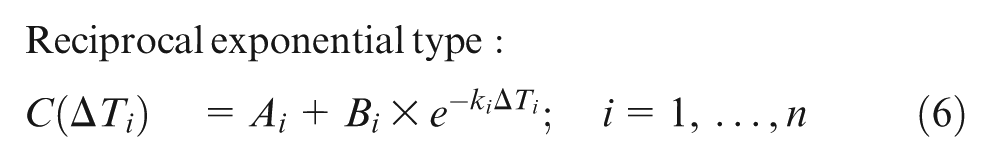
or
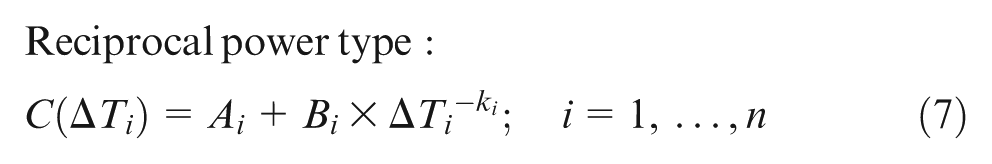
where Ai is the fixed costs of making a single component including material, scrapping, and reworking costs; Bi and ki are determined by the cost of producing a single component according to each company’s own data collected from its production line. 7
Once the cost function is established, the statistical tolerance analysis for equality constrained problems is explored respectively with equations (6) and (7) as the cost–tolerance function. The necessary conditions of optimality for equality constraints, namely the governing equations, are given as
where C(ΔTi)s are the cost–tolerance function as expressed in equation (6) or (7) and λ is the LM.
As regards the optimal statistical tolerance allocation on reciprocal power cost–tolerance model, a considerable amount of studies have been carried out to investigate the application and solution. However, the present study is aimed at developing optimal statistical tolerance allocation on reciprocal exponential cost–tolerance model.
Putting the cost function (6) and the constraint
Solving for λ, then
Eliminating λ by expressing individual tolerance in terms of ΔT1 yields
Simplifying equation (11), the formulation can be transformed as
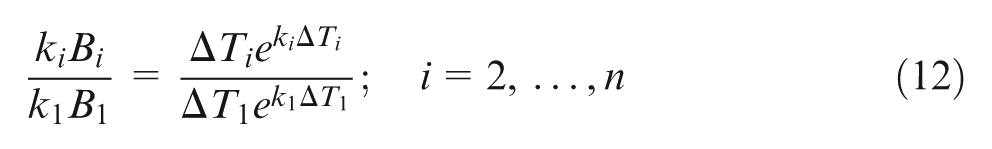
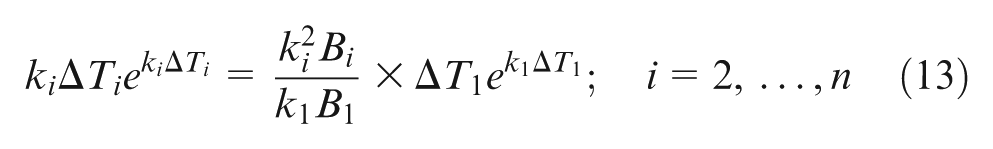
As a result, the above formula is a transcendental equation that cannot be solved explicitly. Note that the use of the Lambert W function allows the apparently explicit calculation of the allocated tolerances of assemblies. The general strategy for solving equation (12) is to transpose all of the terms containing the unknown variable to one side of the equation. The next step is to multiply both sides by ki and make it look like equation (5), thus
Let
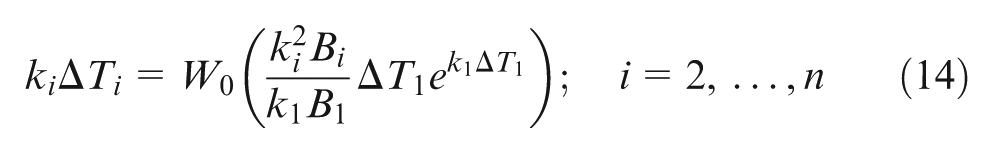
Finally, each individual tolerance ΔTi can be determined in terms of ΔT1 based on the above equation in the following form
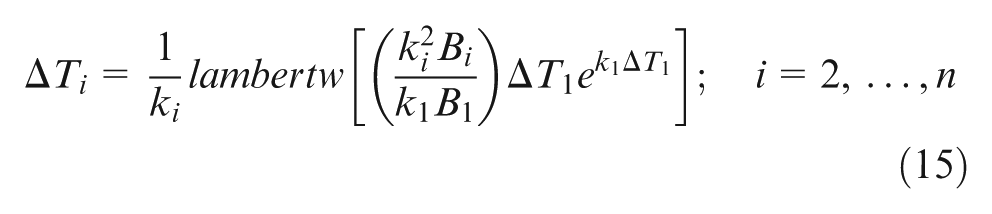
where lambertw(x) is the function that evaluates the Lambert W function at the value x. The value of lambertw(x) for a given x is available in many software systems such as Maple, MATLAB, and Mathematica.
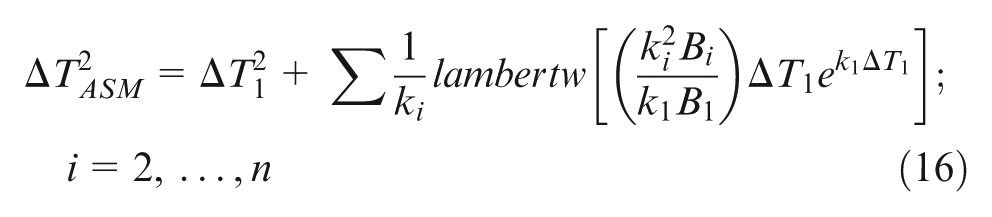
To express closed-form solution and quickly determine optimal tolerances without resorting to numerical methods, the Lambert W function is introduced to tolerance optimization problem for reciprocal exponential cost–tolerance model. Besides, on the x-interval [0, ∞), there is one nonnegative and increasing real solution. The property acts consistently in accordance with tolerance. Consequently, the accumulated tolerance can be calculated as
An illustrative example
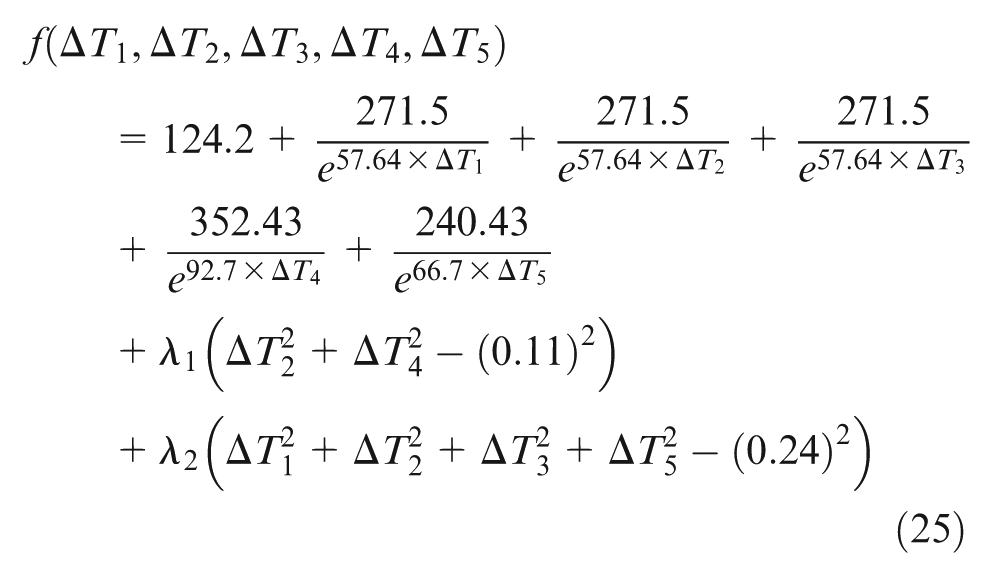
Figure 2 is a wheel mounting assembly used to demonstrate the derived results for the optimization problem with equality constraints. 24 The assembly involves five dimensions that two interrelated dimension chains are constituted to analyze. Dimensions shown in Figure 2 are considered to be normally distributed. Units used in this example are given in millimeters for dimensions and tolerances. The tolerable gap range associated with the assembly dimensions Y1 and Y2 must be 0.11 and 0.24, respectively. The tolerances of the five dimensions, X1, X2, X3, X4 and X5, are depicted that ΔT1, ΔT2, and ΔT3 are within [0.006, 0.08]; ΔT4 is within [0.002, 0.06]; and ΔT5 is within [0.01, 0.1]. The cost (in US$) with reciprocal exponential cost–tolerance relationship is given as
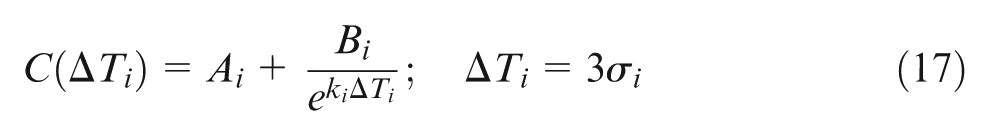
where σi is the standard deviation of the process corresponding to the ith tolerance, and A1 = A2 = A3 = 23, A4=35, A5 = 20.2, B1 = B2 = B3 = 271.5, B4 =352.43, B5 = 240.43, k1 = k2 = k3 = 57.64, k4 = 92.7, and k5 = 66.7.
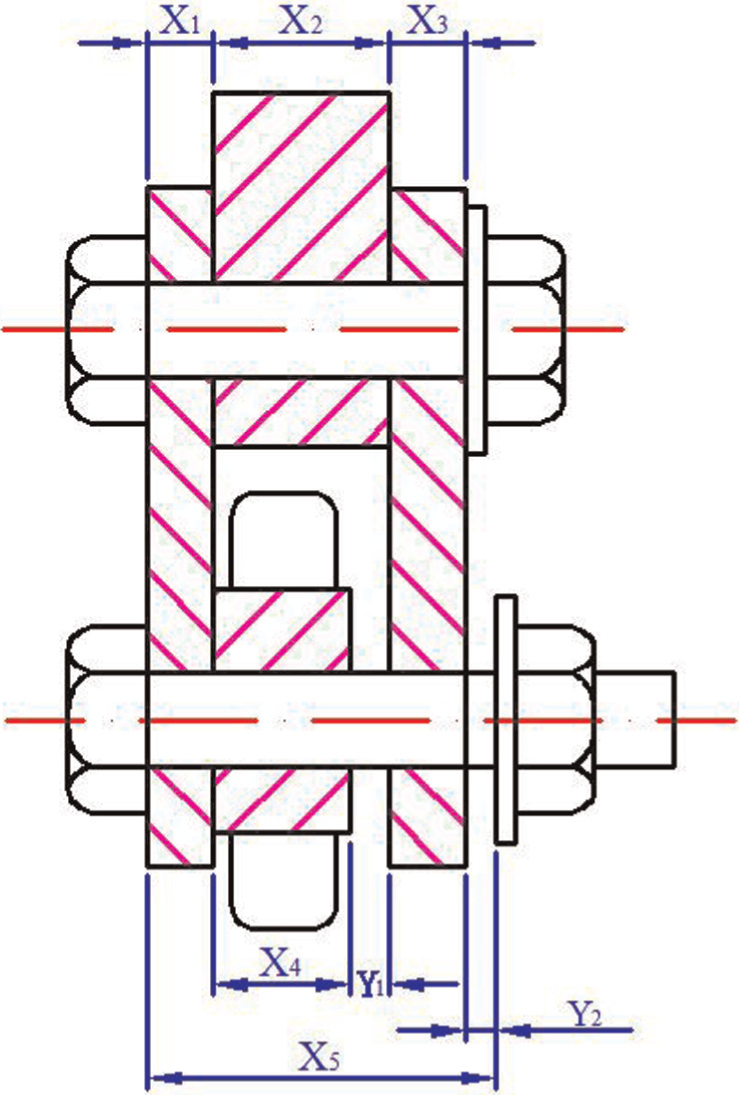
Wheel mounting assembly.
Constructing the constrained problem, the optimization problem can be expressed as
subject to
Restriction of the gap range


Applying tolerance chain relationship and imposing the quantities of the permissible gap, the preceding equations can be simply written as
Owing to the monotonically decreasing property of the cost–tolerance function, the equality constraints can be considered as active constraints. As a consequence, the tolerance chains for the constraint functions can be further expressed as
Restriction of the component tolerances


Thus, the Lagrangian function for the problem is implemented as
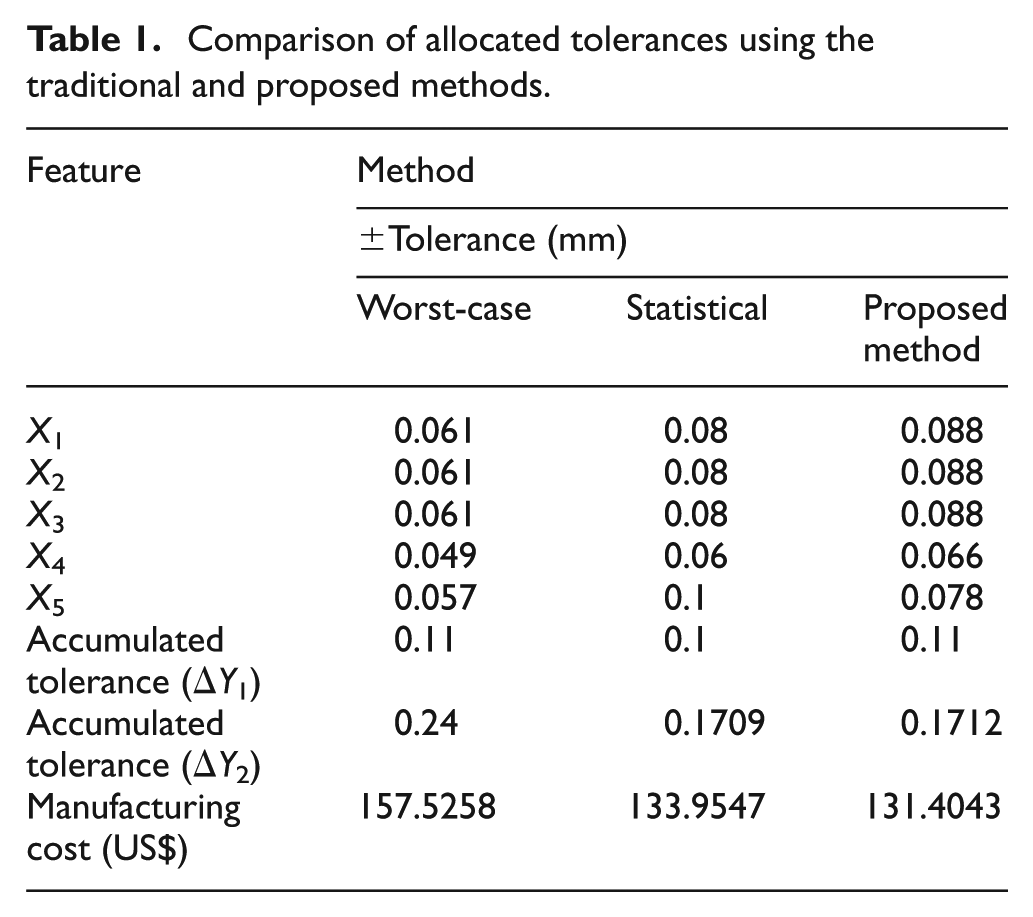
Provided that the problem using the LM method is solved normally, the partial derivatives of the Lagrangian function with respect to all ΔTis and λks are essential. The regular LM method is difficult to handle the case with reciprocal exponential type as computations become complicated. To solve the problem using the derived approach, the tolerance ΔT2 can be taken as a pivot parameter to substitute into equation (15). The expression of other tolerances can be depicted in terms of the pivot tolerance. First, the functional requirements can be taken into account, namely restriction of the gap range. Next, by means of solving simultaneous equations, the obtained optimum allocated tolerances should be checked whether they conform to restriction of the component tolerances. If not, choose the upper bound of the component tolerance. This approach eliminates the procedure for solving the LMs and partial derivatives. Taking advantage of the LM method to solve the optimization problem for the statistic tolerance analysis, the optimal tolerances and the corresponding manufacturing cost can be obtained, as listed in Table 1. The worst-case tolerance allocation using LM method is taken to compare with the statistical tolerance allocation using proposed LM method. The statistical tolerance allocation using proposed LM method can also significantly acquire lower manufacturing cost. Moreover, the statistic tolerance analysis reveals that upper bounds of the five component tolerances are the main constraints. It implies that the accumulated tolerances do not excess the tolerable gap ranges. As a consequent, the restriction of the component tolerances can be further relaxed. In other words, the accumulated tolerance of the gap can be further relaxed to minimize the manufacturing cost if each individual tolerance limit is not considered. As a result, the modification of each component tolerance based on statistic tolerancing method should be adopted to allocate the modified optimal tolerance, as listed in Table 1.
Comparison of allocated tolerances using the traditional and proposed methods.
Conclusion
Tolerance assignment plays a vital role for manufacturing cost and product quality simultaneously considered. While statistical tolerance can draw the balance between manufacturing cost and quality, optimal tolerance allocation further benefits to make least manufacturing cost more realistic. As reciprocal exponential function is one of the commonly employed cost–tolerance models in practice, this article explores a method for optimal statistical tolerance allocation with such a cost–tolerance function. The method is to minimize manufacturing cost subject to constraints on tolerance target and machining capabilities. The optimization problem is solved by a closed-form equation based on the LM method with integrating the Lambert W function. For constrained minimization problems with only equality constraints, the optimal tolerance allocation can be obtained by solving simultaneous equations without the time-consuming computing on differentiating. The merit of the proposed method is to reduce the computation complexity for reciprocal exponential cost–tolerance function compared to traditional optimization methods.
Footnotes
Funding
This study was supported by the National Science Council, Taiwan, under contract NSC100-2221-E-005-024-MY2 and also by the Ministry of Economic Affairs, Taiwan, under contract 101-EC-17-A-05-S1-211. Part of the material used in this article is from Cheng and Tsai 22 with permission from the publisher.