
Abstract
A product’s functionality depends largely on the interaction of its components and their geometries. Hence, tolerance analyses are used to determine the effects of deviations on functional key characteristics of mechanisms. However, possible interactions between the different deviations and the resulting effects on themselves as well as on the functional key characteristics have not yet been considered.
This article considers the extension of the existing “integrated tolerance analysis of systems in motion” approach. By means of the methodology, the interactions between appearing deviations can be identified and integrated into a tolerance analysis functional relation. Therefore, the appearing interactions are represented by meta-models that can be easily integrated into the functional relation. Consequently, the product developer is able to gain information about the effects of deviations on functional key characteristics, as well as the effects of the deviations among themselves. In order to show the methodology’s practical use, the interactions between deviations of a nonideal crank mechanism inside a four-stroke combustion engine are considered. For this purpose, two different meta-modeling techniques are used: response surface methodology and artificial neural networks.
Introduction
A successful and economical product development goes hand in hand with the ambition to ensure the product’s functionality as early as possible during the product development process. Hence, geometric deviations of the considered system and its components need to be taken into account in order to ensure the system’s functionality. 1 Deviations appear during every stage of the product’s life cycle: manufacture, assembly and the system’s use (operation time). 2
Usually, a tolerance analysis is used to determine how the deviations affect a system’s functional key characteristics (FKCs). However, the consideration of time-dependent systems in motion results in the following two major problems that the product developers have to face.
The different kinds of deviations affect the FKCs in two different ways: random deviations (e.g. manufacturing-caused deviations of dimensions like length or height) result in a variation of the FKCs (Figure 1(a)) and systematic deviations (e.g. an operation-depending deformation due to inertial forces) cause a mean shift in the distribution of the FKCs (Figure 1(b)).
The time-depending motion behavior results in significant variable effects of the appearing deviations on the FKCs.
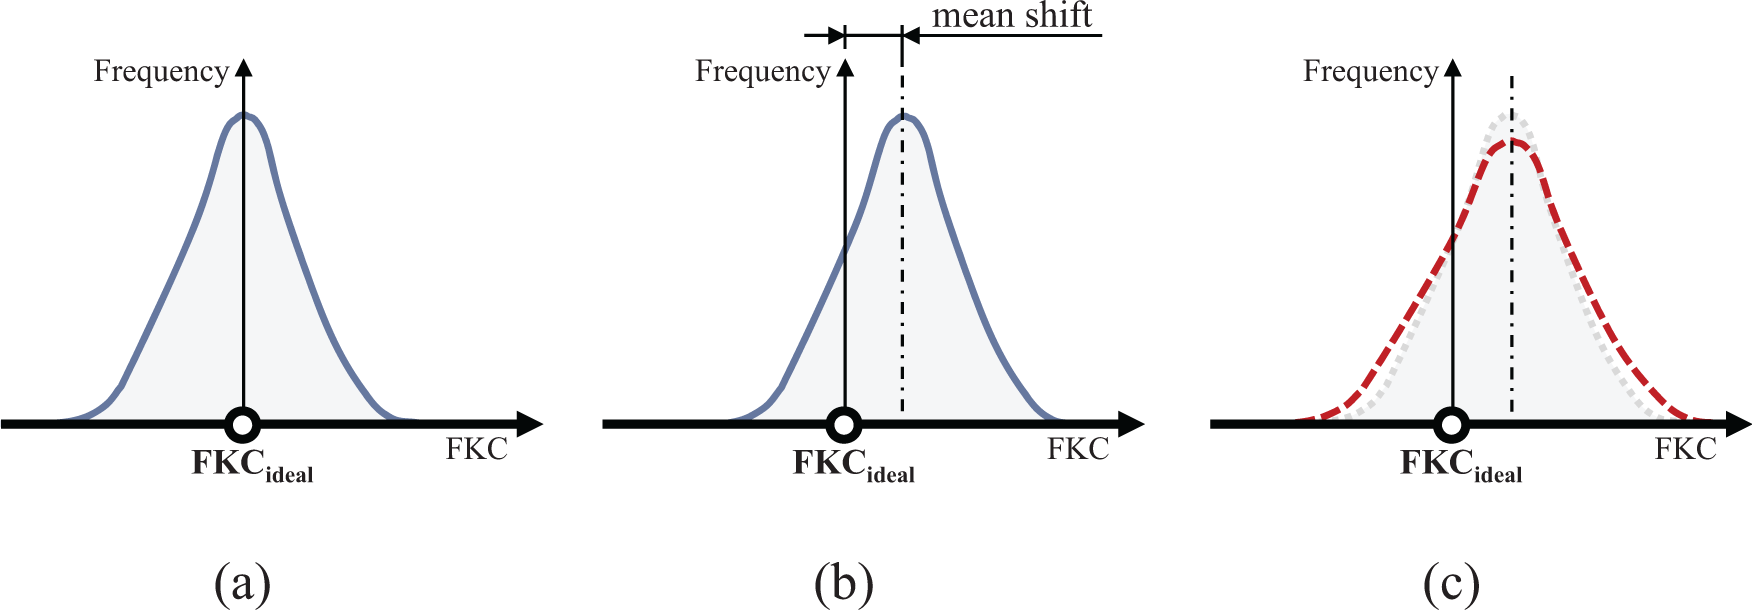
Effects of deviations and interactions between the deviations on a system’s functional key characteristic: (a) variation of the FKCs (due to random deviations), (b) variation (random deviations) and mean shift (systematic deviations) of the FKCs and (c) additional variation of the FKCs (due to interactions between deviations).
Stuppy and Meerkamm 3 and Wartzack et al. 4 present the “integrated tolerance analysis of systems in motion” approach. This approach takes into account the effects of manufacturing-caused and operation-depending deviations on a system’s time-depending FKCs. Statistical tolerance analyses are usually performed several times with at least 10,000 samples. Consequently, the consideration of operation-depending deviations is highly time-consuming since these deviations must be determined for each generated virtual sample of the system using, for example, computer-aided simulations.
In addition to the deviations’ effects on a FKC, effects of the deviations among themselves also appear. In compliance with Shah et al., 5 who deemed a “fundamental understanding of geometric variations and how they interact” to be “the key missing ingredient” in tolerance analysis, these dependencies are henceforth termed “interactions between deviations.” These interactions between the appearing deviations also affect a system’s FKCs. Figure 1(c) illustrates the additional variation of a FKC, which is caused by the interactions between deviations. Consequently, a definition of these interactions can be derived: interactions are the dependencies between dimensional and geometrical deviations, which result in different effects on a FKC (variation and/or mean shift) in the cases of the deviations’ independent, sequential (Figure 1(a) and (b)) and simultaneous appearance (Figure 1(c)). However, these interactions are not considered in existing approaches to the statistical tolerance analysis of systems in motion.
This article focuses on the extension of the existing “integrated tolerance analysis of systems in motion” approach.3,4 By means of the presented modified methodology, the interactions between deviations can be determined and integrated into a statistical tolerance analysis of a system in motion. Therefore, the tolerance analysis’ functional relation needs to be modified because appearing interactions are not considered yet. Consequently, appropriate mathematical models are needed, which represent the operation-depending deviations as well as the interactions toward these deviations. Moreover, these models should be easily integrated into the functional relation. Therefore, meta-models will be used. In the context of engineering design, a meta-model is the result of the meta-modeling procedure. 6 According to Simpson et al., 6 this procedure includes three steps: the experimental design for generating data, the choice of a model to represent the data (the meta-modeling technique) and the fitting of the data to the observed data. A meta-model can describe dependencies (real or virtual) using mathematical and statistical methods, such as approximation, estimation, machine learning and artificial intelligence. Well-known meta-modeling techniques are the response surface methodology (RSM) 6 and the training of artificial neural networks (ANNs).
Consequently, the product developer will be able to gain information about the effects of different deviations on a FKC, as well as the effects of these deviations among themselves. Furthermore, the time as well as the computational expense of a statistical tolerance analysis can be reduced significantly since far less samples are needed to generate/train the meta-model.
State of the art
In product development today, tolerance analysis and tolerance synthesis—being the two major objectives of dimensional management—are well known and widely used. The large diversity of analyzed products and the resulting requirements toward tolerance analysis and tolerance synthesis reflect in previous and current research activities that deal with many different aspects concerning products and processes. However, existing approaches to tolerance analysis do not integrate the specific aspects of mechanisms during their use. In this context, especially, the time-depending effects of deviations on the FKCs, the different kinds of deviations that appear during the product’s life cycle and the entailed interactions between these deviations have to be emphasized. Moreover, in 1957, Morrison 7 identified interactions between varying parameters as an essential aspect in reducing the variation of a system’s FKCs. Despite this potential, interactions between deviations have not drawn much attention in tolerance management and robust design. 8 This prompts Hasenkamp et al. 8 to say, in considering all stages of the product’s life cycle, that the development of integrated methods is both a promising and needed aim of tolerance management and robust design.
Tolerance analysis of a mechanism
The kinematic behavior of a mechanism is essentially affected by dimensional and geometric deviations of its components. These deviations can be traced back to, for example, manufacturing discrepancies. Therefore, a time-depending tolerance analysis of the effects of geometric deviations is necessary. Several publications have considered manufacturing deviations for mechanisms with both lower9–11 and higher kinematic pairs. 12 In addition to manufacturing-caused deviations, operation-depending deviations also appear. The operation-depending displacement of components due to joint clearance is considered in the studies by Sacks and Joskowicz 13 and Muvengei et al., 14 while Dupac and Beale, 15 Imani and Pour 16 and Guowei et al. 17 take into account the appearing deformation of components due to the forces resulting from the system’s motion. Further research considers manufacturing-caused as well as operation-depending deviations.18,19 However, the time-dependency of the mechanism, and thus of the deviations, remains unconsidered. A robust design approach is presented in the study by Huang and Zhang, 20 which enables the product developer to analyze a system in motion with manufacturing deviations and imperfect joints. Furthermore, Stuppy and Meerkamm 3 and Wartzack et al. 4 present the “integrated tolerance analysis of systems in motion” allowing the tolerance analysis of a mechanism with both manufacturing and operation-depending deviations (deformation and displacement due to joint clearance). In contrast to Huang and Zhang, 20 the “integrated tolerance analysis” is not limited to only normal distributions concerning the deviation’s statistical distributions. An appropriate visualization of the results of the “integrated tolerance analysis” is shown in the study by Wartzack et al. 4
However, all the listed research focuses on the effects of manufacturing and/or operation-depending deviations on the FKCs of a technical system. The aspect of possible interactions between the different deviations and the resulting effects among themselves, as well as the effects on the FKCs, has not yet been considered.
Use of meta-modeling in tolerance management and robust design
In 2002, Hong and Chang 21 stated with confidence that meta-modeling (especially ANNs) could pave the way to “a systematic method which automates this procedure, incorporating the domain specific knowledge as well as the geometry and process knowledge.” Despite this promising potential, the use of meta-modeling techniques in tolerance management is currently still limited. However, Dantan et al. 22 commented on an extended use of meta-modeling in tolerance management in recent years. Moreover, Wynn and Ograjensek 23 detail that meta-modeling techniques are the needed methods to “model very large data sets with almost unlimited commercial applications.” They also quote that the upcoming years will be “the golden age for statistics.”
Meta-models are mainly used in tolerance management in two ways: on the one hand, the dependencies of tolerances and the resulting manufacturing costs are described using meta-models. Especially in the case of tolerance synthesis, the tolerance–cost relations are usually unknown, and therefore, approximated using, for example, response surfaces24,25 or ANNs.26,27 On the other hand, the functional relations between varying parameters (e.g. deviations) and the system’s response (e.g. FKCs) are formulated. Due to the large diversity of meta-modeling techniques, a variety of research considers the tolerance-related application of different meta-modeling techniques. For instance, Wang et al. 28 use support vector regression (SVR) to predict the failure probability of a nonideal car door assembly. The widely used RSM is used to approximate the deformation of a beam in bending, 29 as well as the springback of sheet metal resulting from a deep-draw process. 30 Watrin et al. 31 use the RSM to approximate the noise level of a car’s rear axle bevel gear, which depends on the manufacturing-caused deviations of the gear components. The objective function of a tolerance synthesis is replaced by approximated response surfaces in the works of Huele and Engel 32 and Kim et al. 33 The effects of manufacturing-caused deviations on the assembly behavior of a technical system can also be represented using ANNs, as shown in the study by Andolfatto et al. 34 Furthermore, Kopardekar and Anand 35 compared the results of a tolerance synthesis based on an ANN with the results of a vector-chain-based tolerance synthesis. They conclude that the meta-models can be used for tolerance allocation problems. In addition to the investigation of tolerances (analysis and synthesis), meta-modeling techniques can be found in terms of the representation of tolerances and the measurement of deviations. Barbato et al. 36 use Kriging models to predict the optimal measuring points of parts that underlie flatness deviations.
Work methodology
This article considers a main modification of the existing “integrated tolerance analysis of systems in motion” methodology.3,4 Therefore, in order to take into account interactions between deviations, the necessary modifications to the methodology will be detailed in the upcoming section.
In order to show the modified approach’s practical use, interactions between deviations of a crank mechanism will be considered. The crank mechanism’s components are subject to both random manufacturing-caused and systematic operation-depending deviations, during a motion sequence consisting of two crank rotations. The deviations affect the piston’s position (FKC) as well as the combustion ratio during the system’s motion, in addition to causing possible collisions of the piston with additional components (e.g. piston/valve).
According to the modified methodology, the mathematical relation between the FKC and the system’s characteristics and the appearing deviations has to be defined. This usually requires that a time-depending vector-chain be established. In order to take into account the appearing interactions, appropriate meta-models will be determined that represent the affected deviations. These meta-models can be approximations, which can be integrated into the already formulated vector-chain-based functional relation. Finally, the prediction qualities of the meta-models will be determined to ensure an effective and reliable tolerance analysis.
Tolerance analysis of systems in motion considering interactions between deviations
The existing “integrated tolerance analysis” methodology does not consider possible interactions between the different deviations and the resulting effects among themselves, as well as the effects on the FKCs. The tolerance analysis of a system in motion can be divided into three main steps. First, the time-depending mathematical relations between the system’s varying characteristics and the FKCs are needed. Therefore, time-depending vector-chains are established, which include the system’s characteristics as well as the appearing dimensional and geometric deviations. The second step includes the tolerance analysis method. The existing methodology uses a Monte Carlo simulation to determine the FKCs for a defined number of samples of the system. The representation and interpretation of the results is the final step.3,4
The extension of the existing methodology toward considering interactions between appearing deviations requires two main modifications. First, the interactions need to be taken into account when formulating the functional relation. Therefore, appropriate approximations (meta-models) of the affected deviations replace the vectors (representing the terms of these deviations) in the relation’s vector-chain. Consequently, the numerical expense of the tolerance analysis can be reduced significantly. Second, the interactions and their effects on the FKCs need to be taken into account during the representation and interpretation of the tolerance analysis results. Therefore, the common contributor analysis (e.g. high–low–median) is replaced by a global sensitivity analysis in order to identify the deviation’s main and total effects. Figure 2 details the modifications of the methodology.
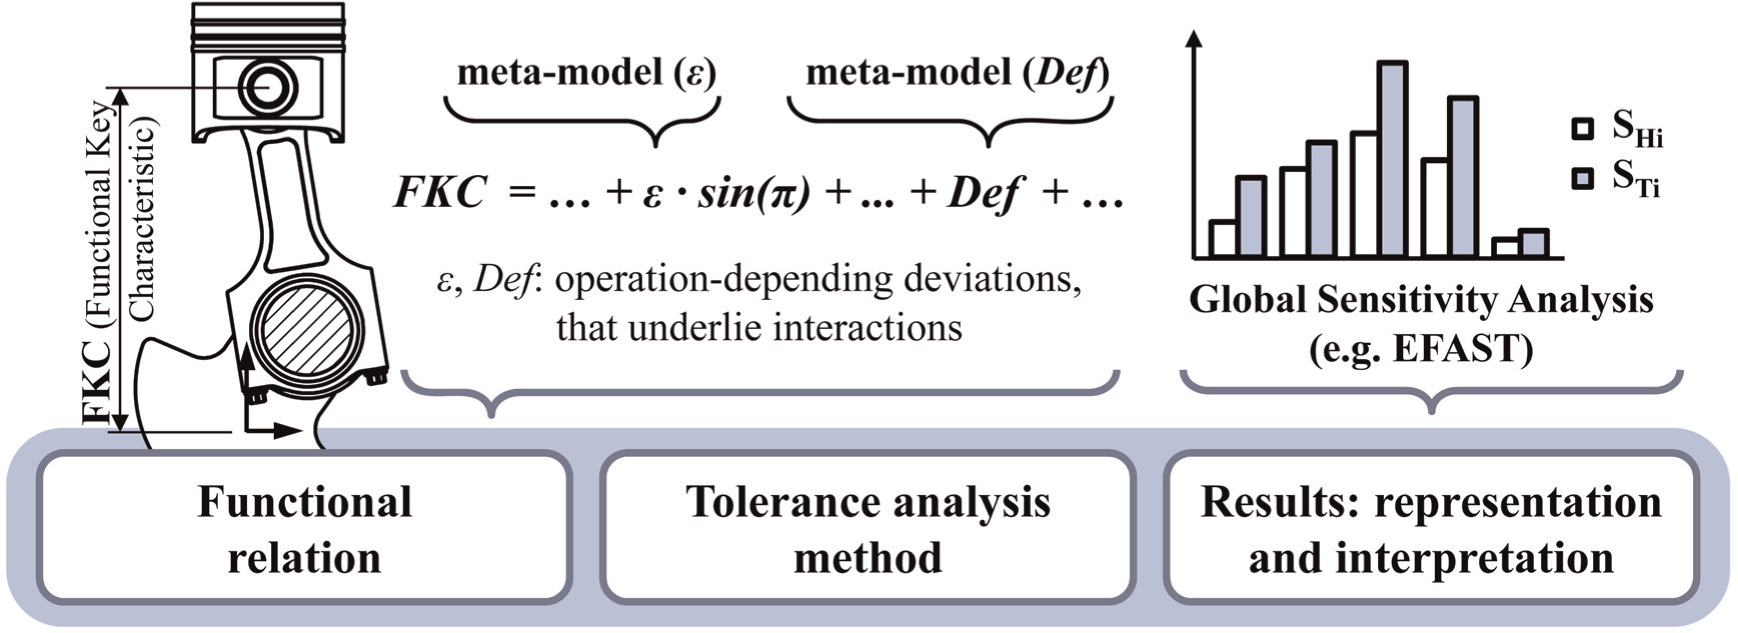
Modifications of the “integrated tolerance analysis of systems in motion” methodology.
Because the second modification can be realized quite easily, this article will focus on the first modification: the determination and integration of appropriate meta-models into the functional relation.
Based on the definition of the considered system, the appearing deviations must be defined and the corresponding interactions identified. The systematic and random deviations, which affect a system’s FKCs, can be classified according to the stage of the product’s life cycle in which they appear (manufacture, assembly and use). According to this classification, the interactions can be identified considering the deviation’s appearance in time. Interactions always appear between deviations if there is a difference in time between these deviations’ appearances. For example, because manufacturing-caused deviations appear earlier in the product’s life cycle, they also affect the assembly-caused and the operation-depending deviations. The effects of different kinds of deviations on the FKCs, as well as the corresponding interactions among themselves (dotted and dashed arrows), are shown in Figure 3.
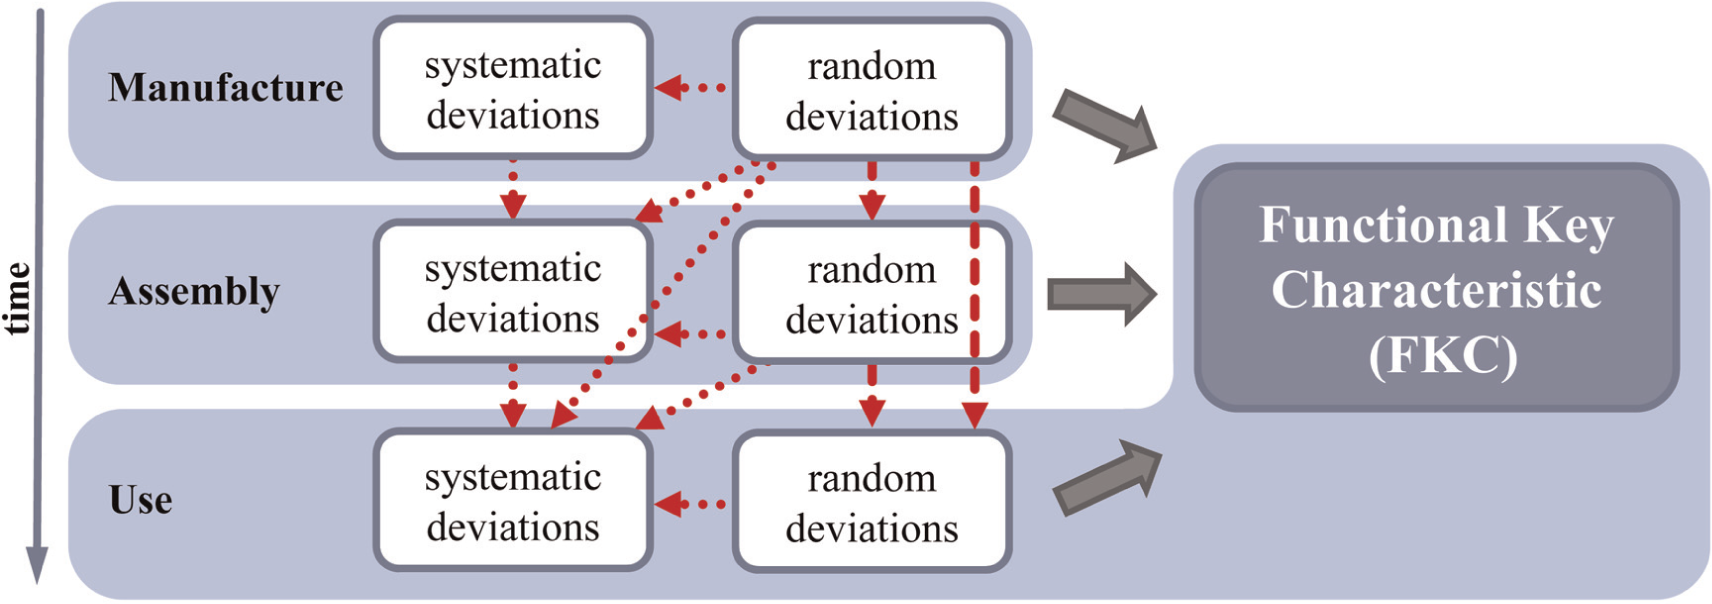
Interactions (dotted and dashed arrows) between the appearing deviations of a mechanism in use.
Furthermore, two different forms of interactions appear due to the characteristics of the deviations: systematic and random deviations. The interactions toward random deviations (dashed arrows) can be considered in a Monte Carlo–based tolerance analysis by correcting the covariance matrix (entries aside the principal diagonal). However, the integration of the remaining form of interactions (the effects of systematic and random deviations on systematic deviations of later life cycle stages, dotted arrows) can be much more complex and, therefore, requires a separate methodology, as detailed in Figure 4.
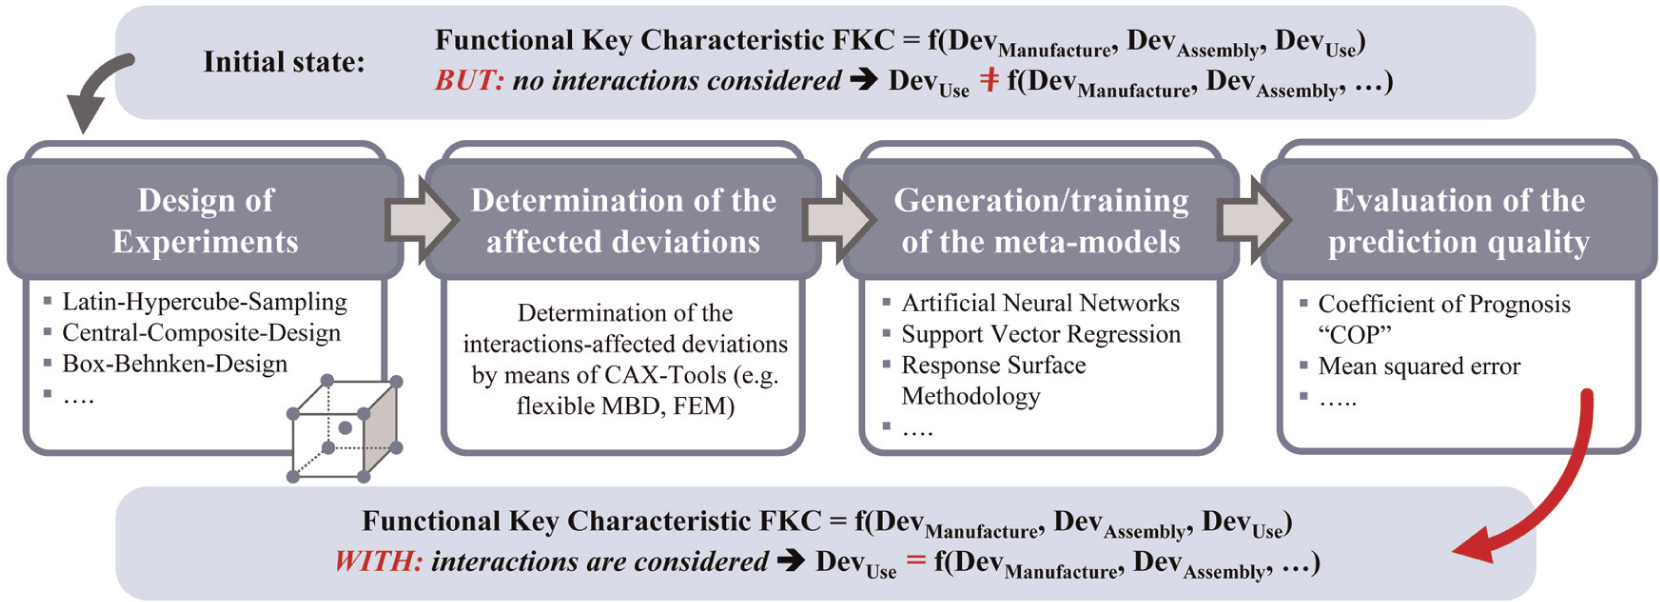
Methodology for the integration of interactions between deviations in the tolerance analysis’ functional relation.
As mentioned earlier, the terms of the systematic deviations in the functional relation have to be replaced by appropriate models (meta-models) that represent the appearing deviations as well as the interactions toward these deviations. At first, a defined number of samples of the nonideal mechanism’s deviations and varying parameters, which cause the considered interactions, must be generated. Usually, this requires far less samples than the generation of virtual samples of the system during the second step of the tolerance analysis. Therefore, methods of the design of experiments (DoE) can be used. In the case of technical systems in motion, the focus should be on Monte Carlo–based sampling methods (e.g. Latin Hypercube Sampling) because the interactions toward random deviations (first form of interactions) can also be considered. Subsequently, the time-depending systematic deviations can be determined for each of the generated nonideal systems using CAX tools. For instance, the deformation of a part can be determined using a flexible multibody dynamics (MBD) simulation (coupling of MBD and finite element analysis (FEA)). Because these deviations essentially affect the system’s FKC (by causing a mean shift), an expert is needed to set up the necessary simulation models. This ensures a realistic and reliable data set. Based on the determined data set, the meta-models can be generated/trained. In addition to the well-known RSM, 37 a variety of additional meta-modeling techniques can be used. As detailed in section “Use of meta-modeling in tolerance management and robust design,” tolerance-related publications deal inter alia with ANNs, Kriging and SVR. The data set is split into two different sets. One is used to train the meta-model, and the remaining (test) samples are used to evaluate the prediction quality of the meta-model according to the so-called goodness-of-fit parameters, 38 such as the mean squared error, R2—the coefficient of determination 38 or the coefficient of prognosis (COP). 39 To obtain the training and the test samples, different validation strategies can be applied, which differ in the way that the data set is split. The split validation splits the data set in the commonly used ratio of 70 training samples to 30 test samples. The 10-fold cross validation uses a ratio of 90:10. However, the separation is done 10 times, ensuring that each sample belongs to the test data set once. Additional validation strategies are based on a random constellation of the training and test data sets. If a satisfying prediction quality of the meta-models can be achieved, these meta-models can finally replace the terms in the functional relation, which represent the systematic deviations. Subsequently, with the modified functional relation, the product developer can proceed to the second step of the tolerance analysis, the application of the tolerance analysis method.
Demonstrator: crank mechanism
The precise motion of the crank mechanism is affected by appearing deviations. These deviations can cause collisions of the components among themselves (e.g. piston/crankshaft) or collisions with additional engine parts (e.g. piston/valves). Moreover, the engine’s combustion ratio is affected due to the mechanism’s varying position of the piston (FKC). The crank rotates at 3000 r/min resulting from a time-depending piston pressure with a maximum of 180 bar.
3
A motion sequence of the crank mechanism consists of two crank rotations with a total crank angle of
manufacturing deviations (crank radius r, con-rod link length l, position deviation of the piston);
operation-depending deviations (deformation of the crankshaft, displacement due to joint clearance s = 0.06 mm in the lower con-rod bearing).
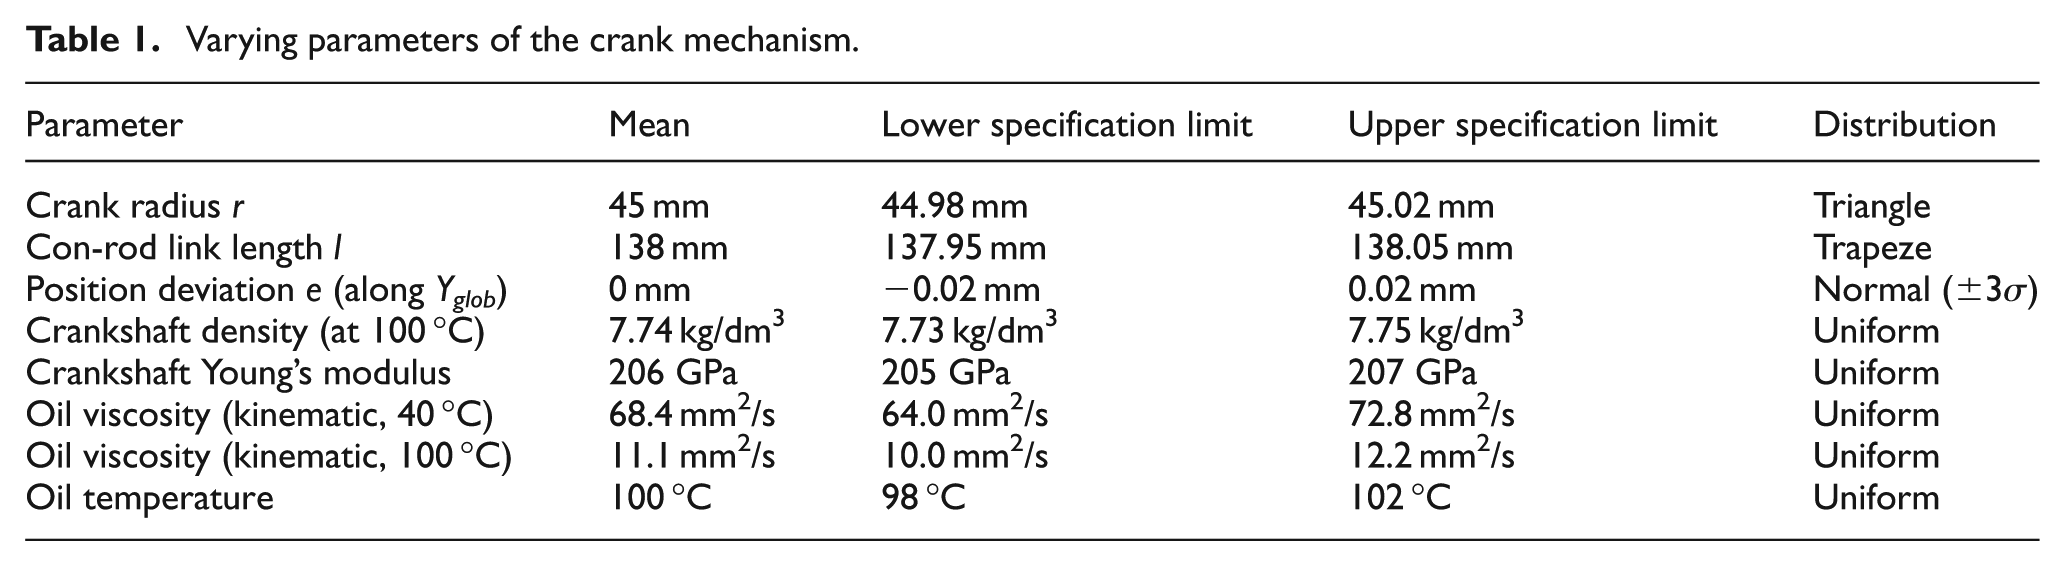
Table 1 details the varying parameters with the corresponding specification limits and distributions. The crank mechanism and the appearing manufacturing deviations are shown in Figure 5.
Varying parameters of the crank mechanism.
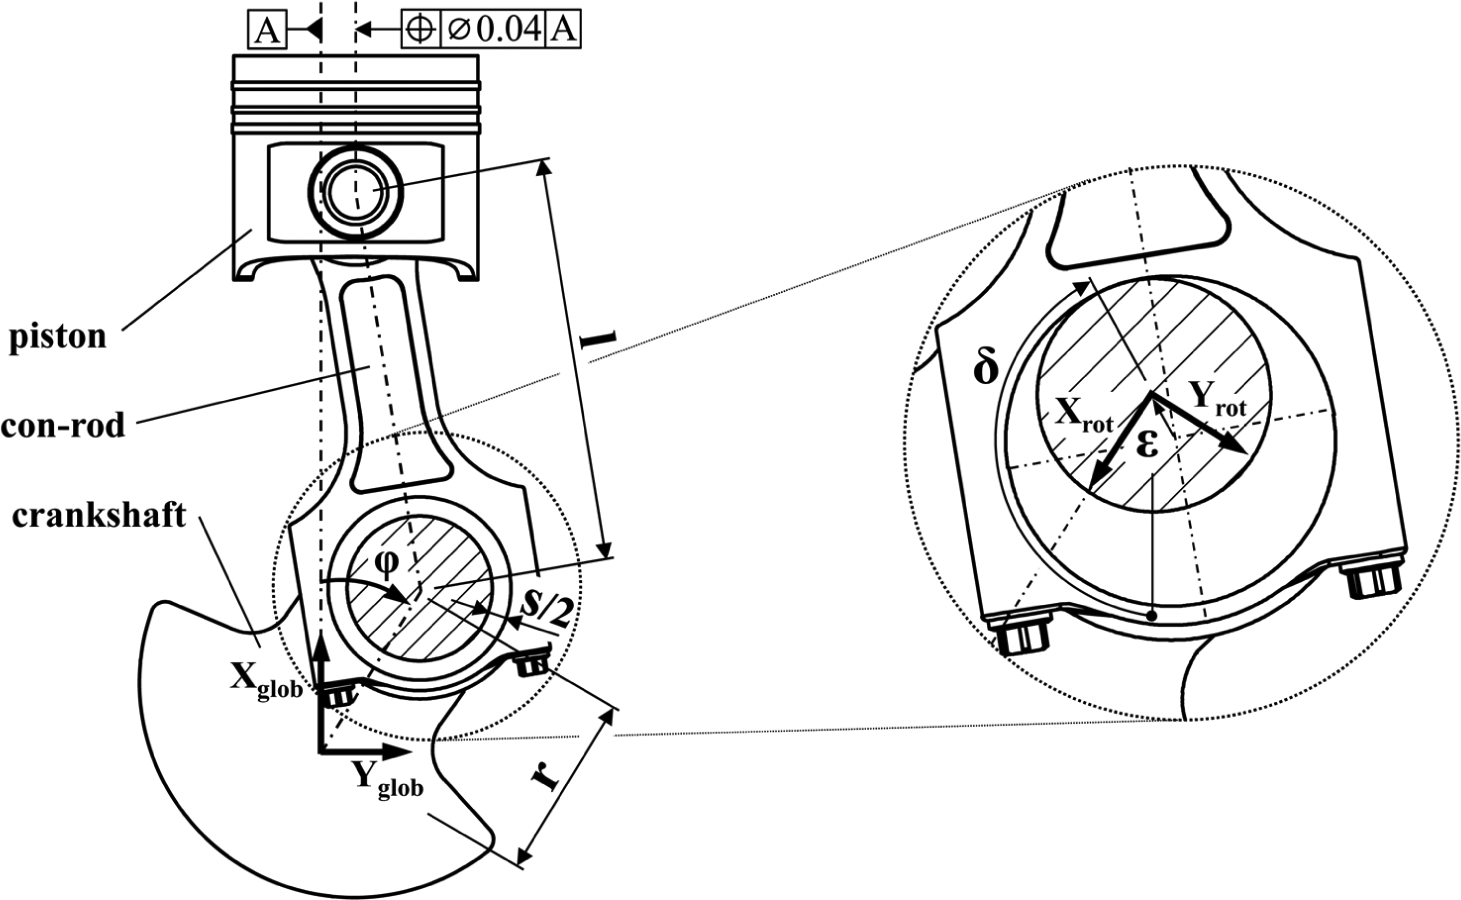
Crank mechanism with appearing deviations, coordinate systems (Xglob–Yglob; Xrot–Yrot) and displacement parameters ε and δ.
The defined specification limits of the engine oil viscosities result from a selection of 12 different oils (viscosity class: 5W30). The limits of the crankshaft’s Young’s modulus and density are based on the specifications of the material 42CrMo4 (US system: AISI 4140) taken from material databases as well as from the manufacturer’s material specifications.
Integration of interactions between the crank mechanism’s deviations into the functional relation
In order to show the modified methodology’s practical use, the functional relation of the nonideal crank mechanism will be determined. As detailed, the mechanism is subject to both manufacturing-caused and operation-depending deviations, during a motion sequence consisting of two crank rotations.
Therefore, a time-dependent vector-chain is set up, including the characteristics of the crank mechanism’s components. The appearing deviations are included in the vector-chain by additional vectors. Hence, the relation between the position of the piston (FKC) and the appearing deviations can be formulated. For a detailed derivation of the functional relation, see the study by Stuppy and Meerkamm. 3 However, because this relation does not consider the interactions toward the operation-depending deviations (deformation and displacement), it has to be modified according to the presented methodology (Figure 4).
DoE
In order to generate/train appropriate meta-models, the effects on the operation-depending deviations of the crank mechanism need to be investigated for several nonideal crank mechanisms. Therefore, analyses based on the Monte Carlo Sampling are usually used. However, a large number of samples are necessary, which can be computationally expensive and thus time-consuming. 40 The samples for the simulations will be generated using Latin Hypercube Sampling, which requires far fewer samples to combine plausibly parameter values according to their corresponding distributions. 41
The number of samples for the simulations depends on two diverging requirements: In order to achieve good and reliable results, many samples should be generated. However, a higher number of samples lead to an increase in the simulation time. In this case, ANNs and response surfaces (second order) are used to generate/train the meta-models. ANNs do not have any restrictions concerning a minimum sampling size. However, according to equation (1) with eight varying input parameters, 45 samples are necessary in order to define a second-order response surface. Additional samples will be used to determine the response surface’s approximation error (usually, a 50% oversampling is recommended) as well as to evaluate the prognosis quality of these meta-models. Consequently, 100 samples of the nonideal crank mechanism are generated.
Determination of the operation-depending deviations
Both the deformation of the crankshaft and the displacement of the con-rod are caused by the forces on the crankshaft appearing during the crank mechanism’s use. In order to investigate the effects on the operation-depending deviations, first a multibody simulation of the nonideal crank mechanism has to be performed in order to determine the corresponding forces on the crankshaft for each of the 100 samples. 42 The differences between the force components of five randomly chosen samples (samples S1–S5) and the ideal mechanism are shown in Figure 6.
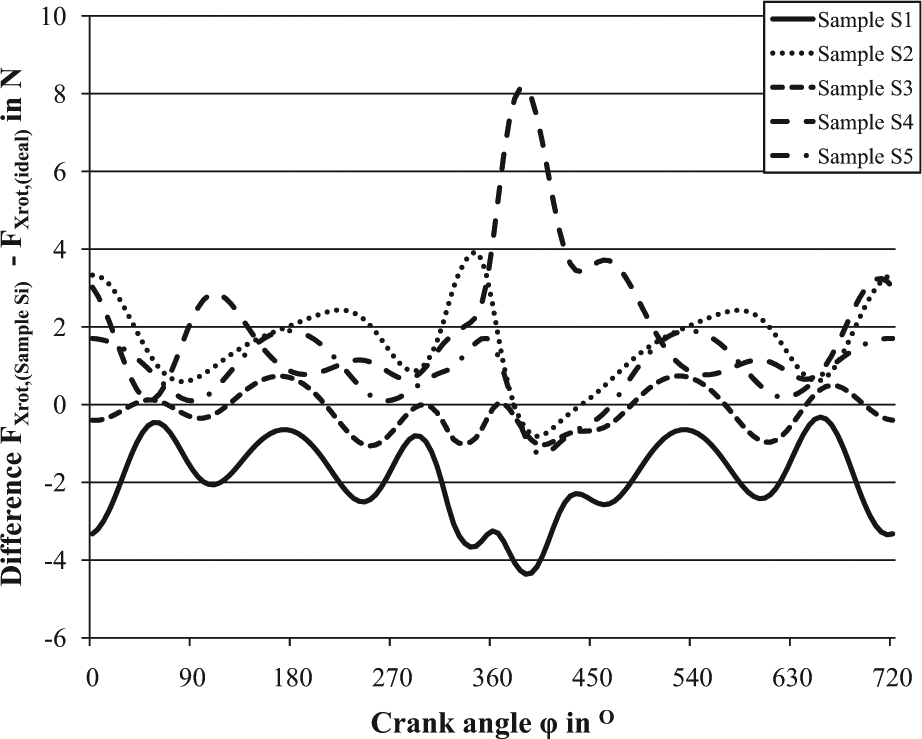
Difference of the force
Deformation of the crankshaft
In order to determine the elastic deformation as a function of time during a motion sequence of the crank mechanism, additional 144 FEAs (5°-steps of the crank’s rotation) were performed for each sample. Figure 7 displays the components of the resulting deformation of the ideal mechanism’s crankshaft according to the rotating coordinate system Xrot−Yrot, which is fixed to the crankshaft. The varying deformations
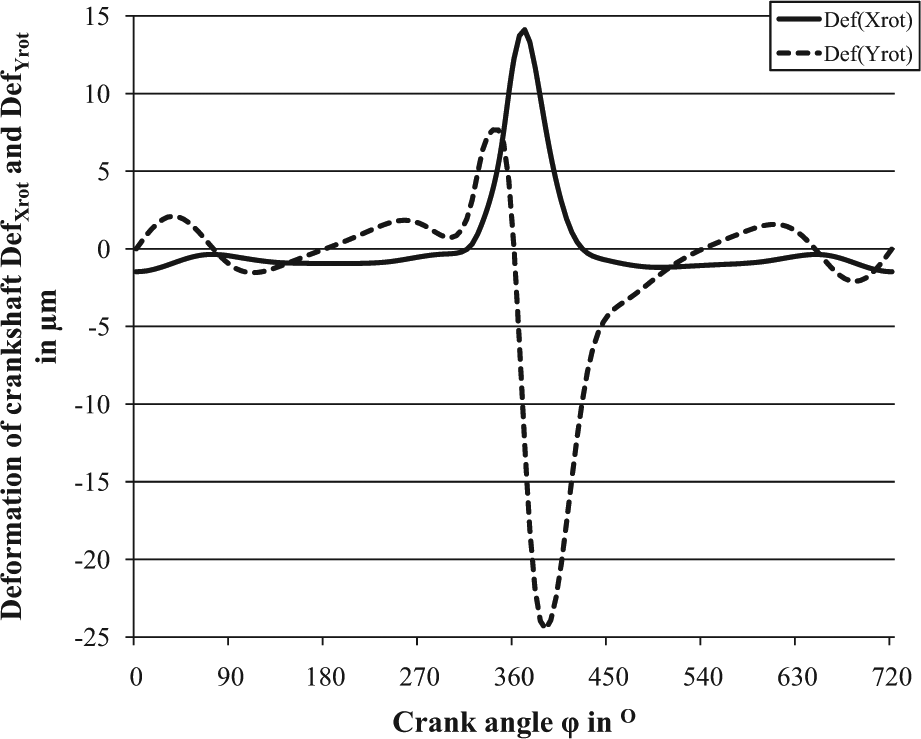
Deformation of crankshaft
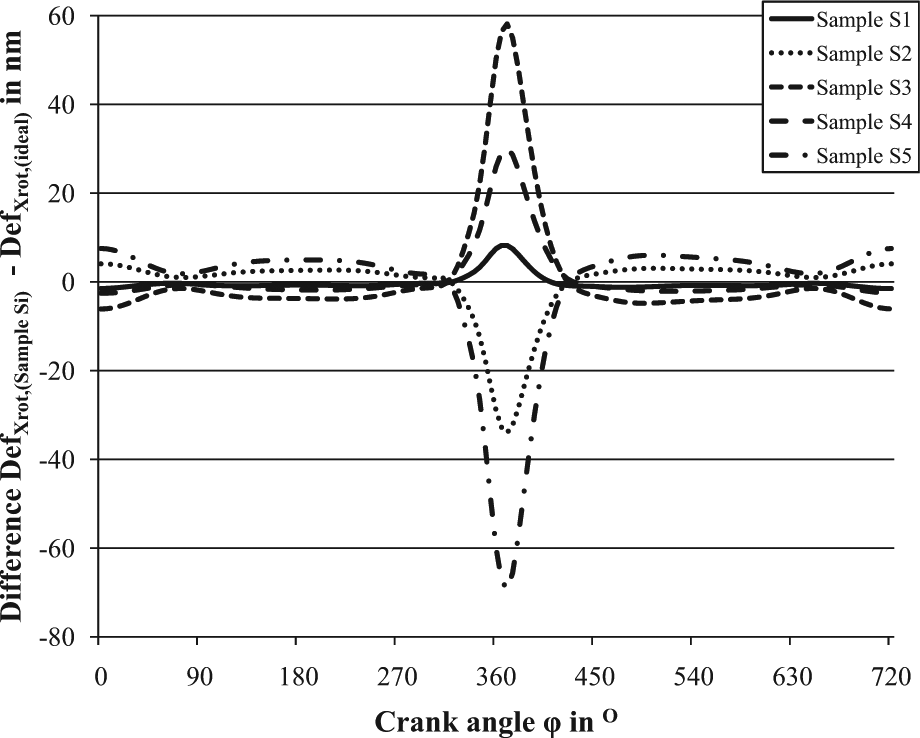
Difference of
Displacement of the con-rod due to joint clearance
Due to the clearance of the revolute joint and the appearing forces, a displacement of the con-rod relative to the crankshaft appears. The determination of each sample’s time-depending displacement is based on a hydrodynamic consideration of the revolute joint’s behavior. 43 The displacement is given in polar coordinates using the radial eccentricity ε and the corresponding orientation angle δ (Figure 5). For a detailed determination of the hydrodynamic displacement, see Stuppy and Meerkamm’s study. 44 The time-depending displacement (ε and δ) of the ideal mechanism as well as the deviations of the eccentricity of the five nonideal samples are shown in Figures 9 and 10.
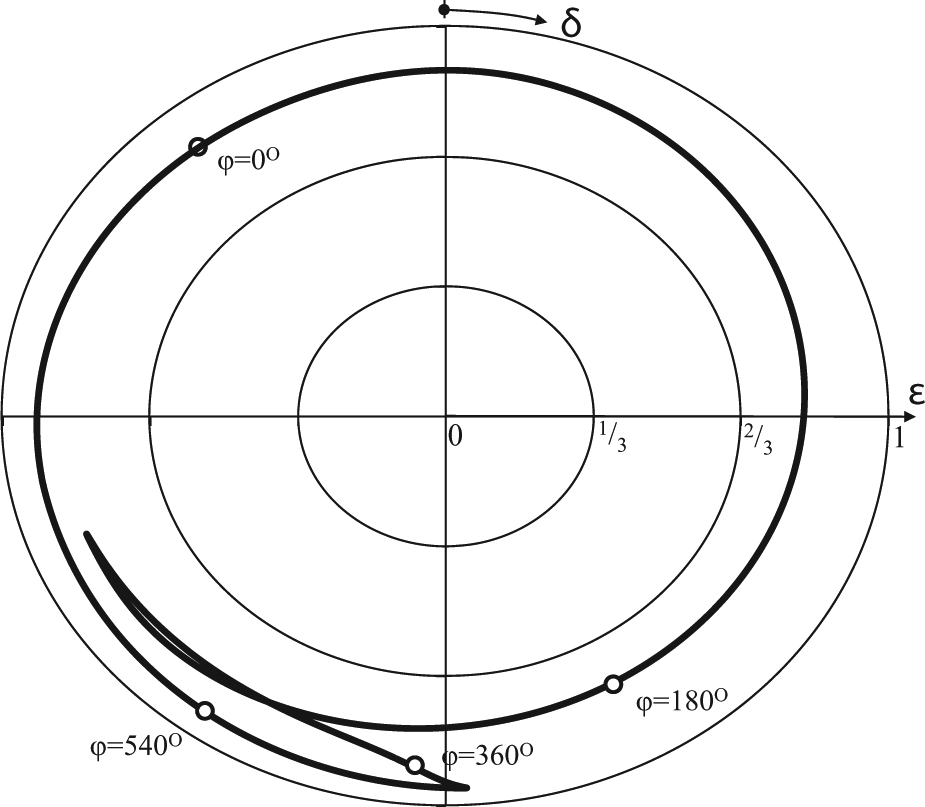
Displacement of con-rod ε and δ (ideal system).
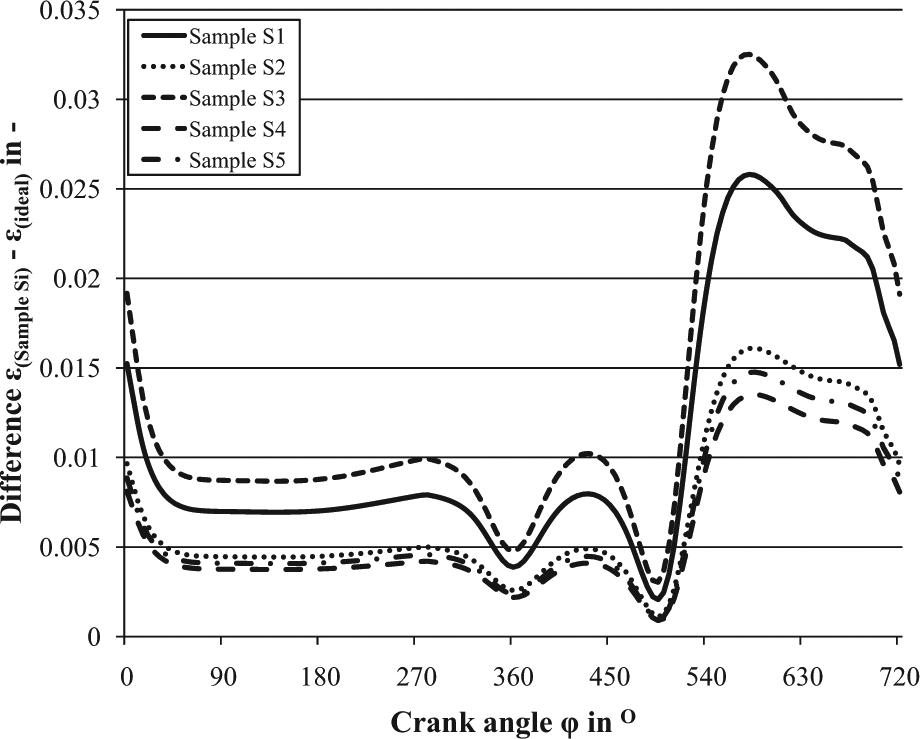
Difference of ε between S1–S5 and the ideal system.
Meta-modeling
Several meta-modeling techniques can be used to generate the necessary meta-models of the operation-depending crankshaft’s deformation and the con-rod’s displacement. In the context of interactions between a mechanism’s deviations, the considered techniques are the widely used RSM, 6 ANNs and the SVR. However, previous investigations show that SVR-based meta-models are insufficient (low prediction qualities). 45 In contrast, the use of ANNs in tolerance analyses is recommended by Andolfatto et al. 34 It is stated that the prediction qualities of ANNs “can be seen as satisfactory for many tolerancing applications.” 34 Moreover, Simpson et al. 6 recommend ANNs for “repeated, nonlinear and deterministic applications,” even as statistical tolerance analyses take into account time-dependent systematic operation-depending deviations and the corresponding interactions toward these deviations. Consequently, the meta-modeling techniques applied in this article are the RSM and ANNs. A second-order response surface approximates the mathematical relation between the varying operation parameters and manufacturing deviations xi and the four parameters of the operation-depending deviations y, using a quadratic approximation (βi: regression coefficients) 37
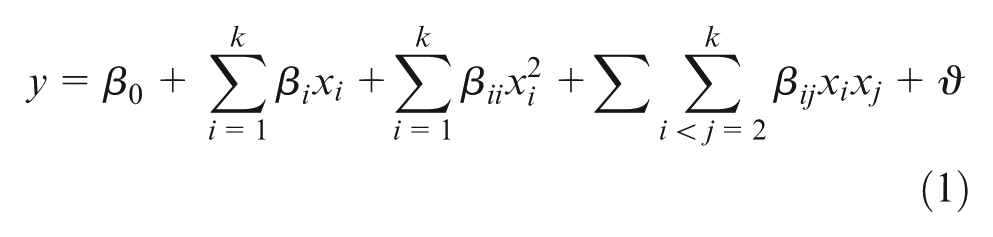
However, there still remains an approximation error ϑ. Therefore, additional samples (taken from the oversampling) are available to determine this error based on the method of least squares.
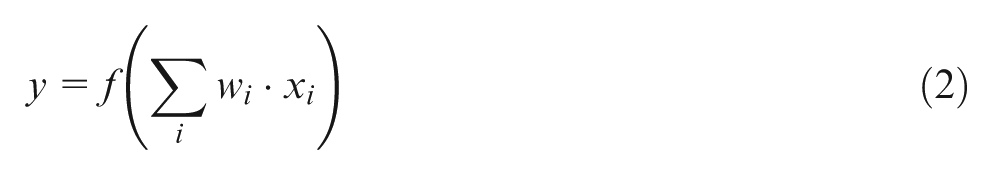
An ANN is a mathematical model, which contains several artificial neurons and connections among them. Each neuron receives an input vector and delivers a certain output, depending on the synaptic weight wi and a transfer function f. Usually, the ANNs use sigmoid functions for approximation purposes. 46 After the training, the network can calculate the correspondent output y to a specified combination of input values xi 34
Evaluation of the meta-model’s prediction quality
Based on the determined data set, four meta-models need to be determined (deformation:
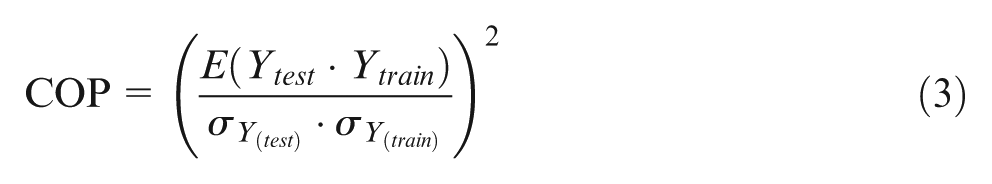
The remaining 10 (test) samples of each validation run are used to evaluate the prediction quality of the meta-models, according to the COP. Therefore, the standard deviations σ of the sample distributions Ytest and Ytrain as well as the mean E are needed. The COP ranges between 0 and 1, and a COP of 0.5 is equal to 50% prediction quality 39
The highest COPs of the response surfaces and the ANNs (two hidden layers with 10 neurons each) are listed in Table 2. Due to their exceptionally high prediction qualities, the ANNs should be integrated into the functional relation.
COPs of the determined meta-models (n = 100).
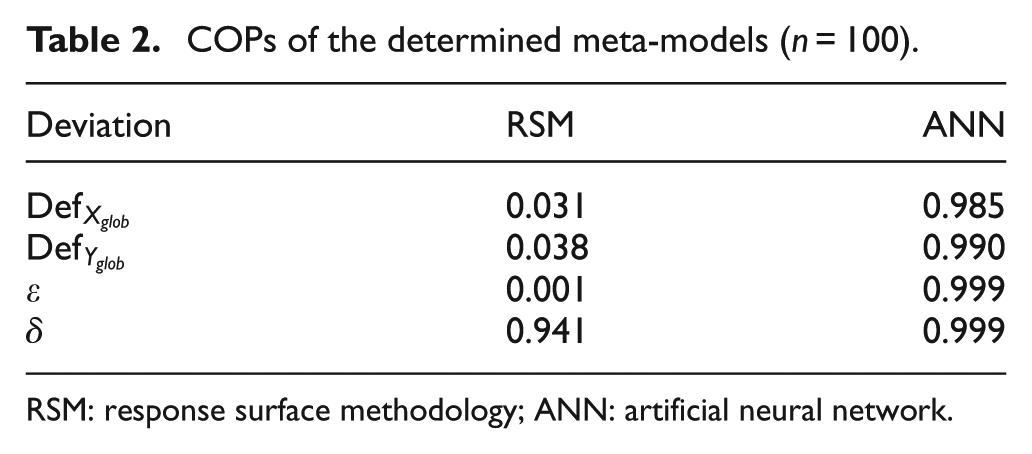
RSM: response surface methodology; ANN: artificial neural network.
Because the functional relation of the crank mechanism could be modified, the product developer can proceed to the following steps of the “tolerance analysis of systems in motion” methodology: the application of the tolerance analysis method and the representation and interpretation of the results.
Conclusion
This article focused on the extension of the existing “integrated tolerance analysis of systems in motion” methodology.3,4 Because deviations appear with a difference in time during the product’s life cycle, they cause both effects on a mechanism’s FKCs and effects among themselves, caused by the so-called interactions. These interactions lead to additional variation of the time-depending FKCs. Consequently, the interactions between deviations need to be taken into account during statistical tolerance analyses; especially, when the system’s components underlie many deviations.
A methodology was presented that supports the product developer in systematically determining appropriate mathematical models, which represent the affected deviations, as well as the effects of the appearing interactions. These meta-models can be integrated into the tolerance analysis process by modifying the functional relation. In order to show the methodology’s practical use, the interactions between random manufacturing-caused and systematic operation-depending deviations of a nonideal crank mechanism were analyzed and by means of ANNs integrated into the statistical tolerance analysis. The modified tolerance analysis methodology enables the product developer to gain information about the effects of deviations on a FKC of a system in motion, as well as the effects of the deviations among themselves. Furthermore, the use of meta-models results in a significant reduction in time and computational expense of statistical tolerance analyses. However, it is obvious that the variation of the FKCs, caused by the appearing interactions between deviations, is usually smaller than the variation due to the deviations itself. Nevertheless, the higher the given requirements concerning the system’s precision and quality as well as the number of deviations, the more interactions between deviations should be considered during a statistical tolerance analysis of a system in motion.
Footnotes
Acknowledgements
The authors would like to thank the anonymous referees for their helpful comments, which helped to improve the article.
Funding
The research project ME1029/16-1 “Functional product validation and optimization of technical systems in motion as a part of product’s lifecycle oriented tolerance management” was supported by German Research Foundation (DFG).