
Abstract
Autobody panel fitting is an efficient way to improve dimensional quality and to give a better impression to the consumers. Taillight fitting is a challenge and time-consuming problem in the automotive industry. The purpose of this research is to develop a modeling and optimization method for efficiently assembling the taillights with attracting appearance and shape. The taillight assembly model is constructed with finite elements to depict the assembly process of the taillight. The validity of the finite element simulation model is proved by the consistence between the pressures obtained from the finite element simulation results and the pressure-sensitive paper. A linear approximation model for assembly variation sensitivity analysis is proposed to optimize the taillight shape. The results of this research will enhance the understanding of the optimal fitting of automotive taillight and help systematically improving the taillight design-for-assembly efficiency.
Introduction
Increasing quality and productivity are two major goals in today’s automotive industry. The dimensional integrity of the automotive body (body-in-white (BIW)) has great effects on the quality and functionality of the vehicle.1,2 In the automotive industry, especially in body design, the relationships between doors, hoods, fenders, and other panels are critical for quality appearance. 3 Modification and updating of the current autobody are mostly concentrated in the front part (hood, headlights, bumpers, and fender) and the rear part (trunk, taillights, bumpers, and fender). 2 It is a most challenging job in BIW assembly that obtaining the optimal gap and flushness of the front and rear parts. Poor gap and flushness quality affect not only the appearance but also the performance of an automotive. It results in uniformity and less smooth, bringing increased air noise, more air resistance, water leakage, and many other issues.
Taillight appearance/shape gives the whole impression to the consumers, and it has a great impact on customer’s purchasing decisions. 4 In order to obtain good dimensional quality, the trunk, bumper, and the taillights are designed to be adjusted efficiently for assembly. Taillight fitting area is the typical and challenging work for assembly. Autobody panel fitting is an efficient way to improve dimensional quality. Autobody panel fitting problem has been studied by many authors in the past,5–13 and the optimization models proposed in these articles mainly concerned the optimal fitting position between two closed parts, such as car door fitting. The rear end of a Volvo S60 was presented, 3 and the focus was the split line between rear lamp, rear bumper, and the outer rear bodyside. The example illustrated a visualization that was performed in the detailed phase since the tolerance model is built up of final reference points and tolerances.
For assemblies that consist of compliant sheet metals, the variation propagation mechanism was different from any of those models because of possible part deformation. 14 Liu and Hu 15 analyzed the variability characteristics for both serial assembly and parallel assembly and proposed the use of finite element analysis (FEA) in combination with statistical methods for the simulation of sheet metal assembly variation. Hu et al. 16 presented a numerical simulation method for the assembly process incorporating compliant nonideal parts. Wang and Gao 17 proposed an autobody taillight assembly model using FEA to analyze the fitting variation induced by tighten-up sequence. The majority of the methods developed in recent years are based on FEA.
For assemblies that consist of compliant sheet metals, the variation propagation mechanism is different from any of those models because of possible part deformation. Taillight assembly and fitting is a special and challenge case, which is a general consensus in the automotive industry. It is a long process that taillight assembly fitting quality improving and problem solving. The knowledge and experience obtained from case study can benefit a new taillight design and manufacture. On the one hand, automobile designers design the taillight shape according to vehicle-design-style and experience. On the other hand, automobile assembly plants rely on the trial-and-error method to determine the assembly force and tighten-up sequence, which requires years of experience and knowledge of the assembly process. Generally, it is a challenging work to assemble the taillights with beautiful appearance and shape. These taillights are not compatible for assembling, that is with bad interface of design for assembly (DFA). 4
In this article, a systematic and efficient assembly modeling method for optimal taillight fitting is developed using FEA. A simplified linear approximation model for assembly variation sensitivity analysis is proposed to optimize the taillight shape. It provides a choice for bridging the designers with assemblers. This article is structured as follows: autobody taillight assembly process is introduced in section “Taillight assembly and fitting.” Taillight assembly model is constructed in section “Taillight assembly modeling” to depict the assembly process of taillight, and seal strip modeling is discussed in detail. Then, the fitting variation sensitivity analysis is conducted, and a simplified linear approximation model is proposed in section “Fitting variation sensitivity analysis.” Section “Taillight shape optimization” presents the taillight shape optimization using proposed simplified fitting variation sensitivity analysis model.
Taillight assembly and fitting
Autobody is assembled with BIW (which is composed with flexible sheet metal parts) and accessories (interiors and exterior decoration parts). During the assembly process, there are metallic and nonmetallic parts being assembled together (Figure 1).
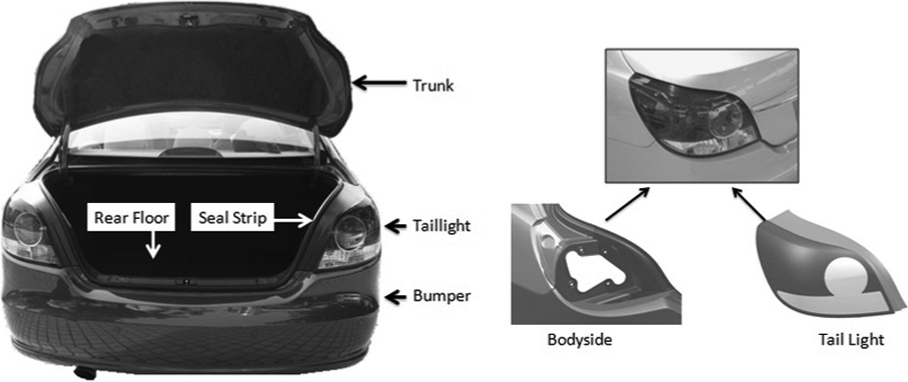
Taillight area and fitting parts.
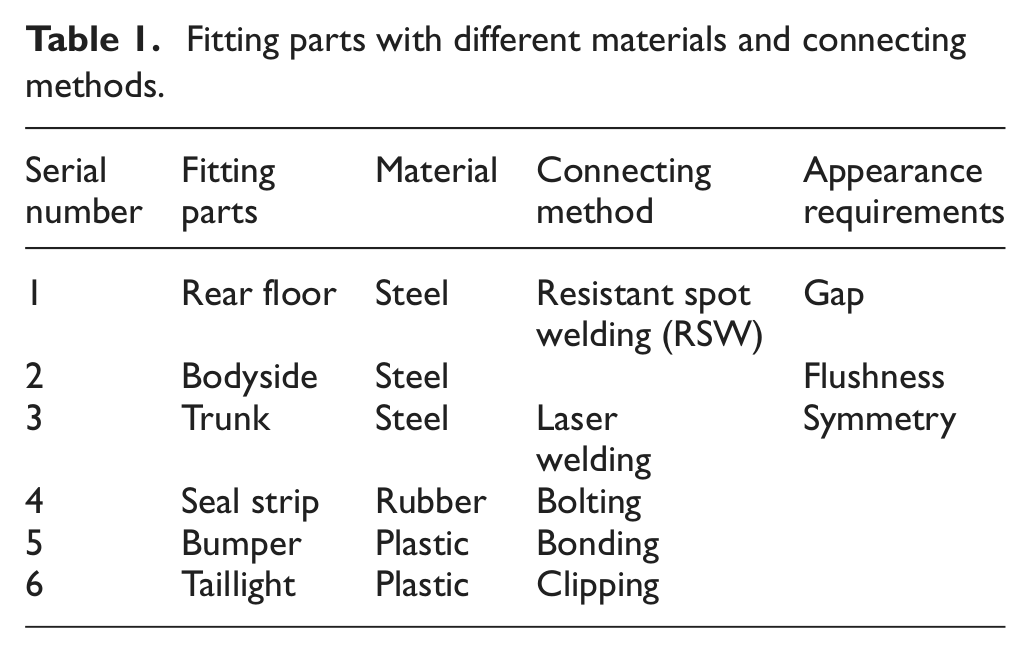
The complicated assembly variation prorogation mechanism needs to be explored for good fitting quality. Difficulties of taillight assembly and fitting include different materials (metallic and nonmetallic), different connecting methods (welding, bolted connecting, and bonding), and different quality requirements. Details of different materials and connecting methods are listed in Table 1.
Fitting parts with different materials and connecting methods.
There are many sources of variations in the taillight assembly and adjustment (Figure 2). These errors are the hurdles on the road of final good fitting quality. In fact, this article discusses the correlation between the taillight fitting quality and the tighten-up sequence in body shop. There is the paint process between body shop and final assembly. There are cleaning, prime coating, painting, and paint baking in the paint process. These processes are mainly chemical anticorrosive process and have little effect on dimensional quality of the BIW. Especially, there is little deformation in the taillight area of the BIW due to its local high stiffness.
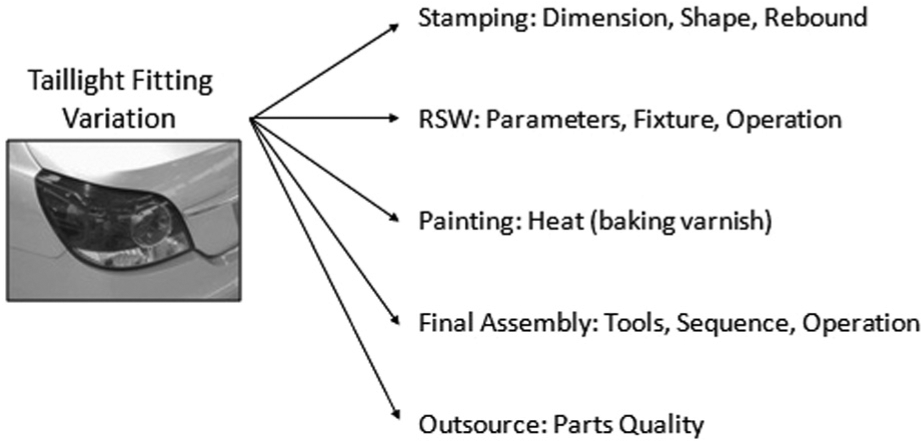
Assembly errors in taillight assembly.
There is one another big hurdle in the road of achieving excellent fitting quality, contradictory quality requirements. That is, some functional requirements are contradictory to the appearance/fitting requirements. Take the trunk as an example. As far as the sealing quality (rain proof) is concerned, the bigger the closing force of truck is, the better the sealing quality is. But, as far as the fitting quality is concerned, the fitting gap and flush are required to as uniform as possible. That is the closing force of the truck should be in certain range. These two quality requirements are contradictory requirements. Trade-offs should be made among these contradictory requirements.
Traditional taillight installation scheme is using about four connecting bolts to tighten up the taillight on the taillight holder in the BIW, and sealing strip is inserted between them. Typical taillight installation structures are shown in Figure 3.
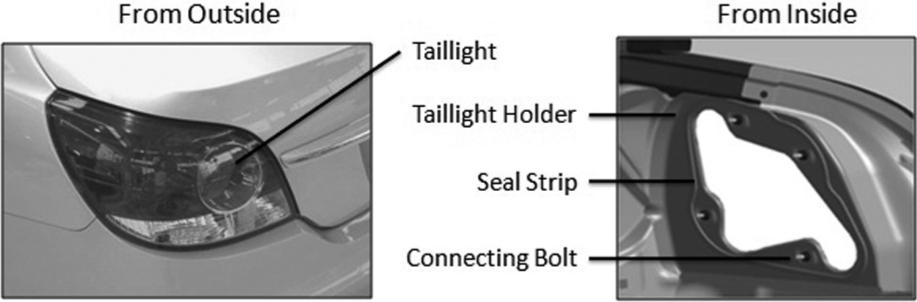
Typical taillight installation structures.
Taillight assembly modeling
Assembly model
Typical car taillight fitting area includes taillight, taillight holder, seal strip, bodyside, connecting bolts, and so on. The connecting bolts are tightened up sequentially to assemble the taillight into the bodyside. Different tighten-up forces and tighten-up sequences result in different fitting qualities. Taillight, taillight holder, and seal strip will deform correspondingly during the course of tighten up. Optimal tighten-up forces and sequences need to be determined in order to obtain good fitting quality and high production efficiency.
In order to produce an acceptable result of the taillight tighten-up process, a three-dimensional (3D) finite element (FE) model is proposed. The FE model is created using commercial software ABAQUS/CAE as the preprocessor, as shown in Figure 4. A FEA is carried out using the general-purpose FEA package ABAQUS Standard.
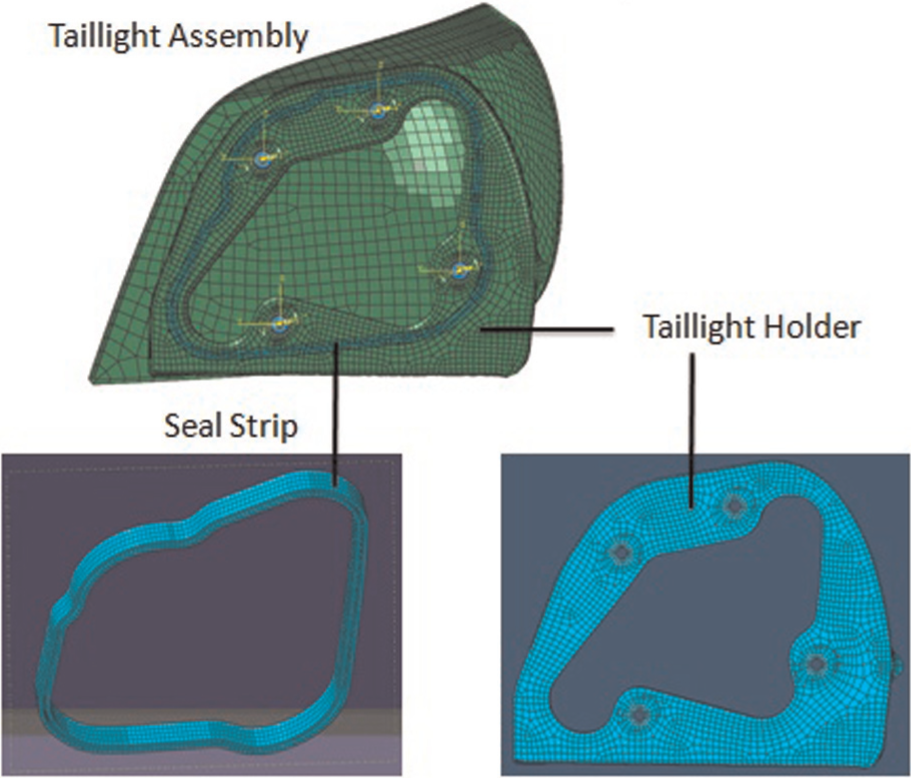
Mesh grid of taillight assembly model.
In the taillight FE model, seal strip and taillight holder are defined as the deformed body, while the taillight and connecting bolts are defined as a rigid body. The seal strip model is meshed with eight-node, 3D solid, reduced integration C3D8R elements. It results in approximately 5000 nodes and 2500 elements. The taillight holder is meshed with S4R elements, containing about 3700 nodes and 3500 elements. The taillight is messed with R3D4 elements, containing approximately 3600 nodes and 3600 elements.
Connecting bolts’ positioning deviation contains axial deviation, radial deviation, and rotational deviation. Axial deviation is induced by tighten-up torque and seal strip. Radial deviation and rotational deviation are induced by the clearances between connecting bolts and holes in taillight holder, which induced by taillight holder manufacturing errors.
Taillight holder is punched with low carbon steel sheet. So, the taillight holder is set as shell element, materials are set up as low carbon steel, and FEs are mainly four-point integration shell elements. Connecting bolts and taillight are set as rigid bodies because they hardly deform when tighten up.
Seal strip is in the middle of the taillight and taillight holder, which contacts with these two parts. Seal strip deformation is mainly decided by the tighten-up torque. Foamed rubber’s sealing and spring back properties could compensate for uneven gap between the taillight holder and taillight. Due to viscosity of the sealing strip, there is no relative sliding between the taillight and taillight holder while tighten up. TIE connecting and connector forces are employed in the FEA model while analyzing the tighten-up process.
Material attribute of seal strip
During the course of FEA, the material properties of the seal strip can be represented with the HyperFoam model in the ABAQUS, as long as the parameters obtained from the experiments of uniaxial tension, uniaxial compression, plane shear, volume test, and other test are inputted into the ABAQUS. The ABAQUS can automatically build the strain energy density function model of the seal strip with proper experimental data. Seal strip material is the foamed rubber, and its constitutive equation (1) is represented with foam strain energy density function
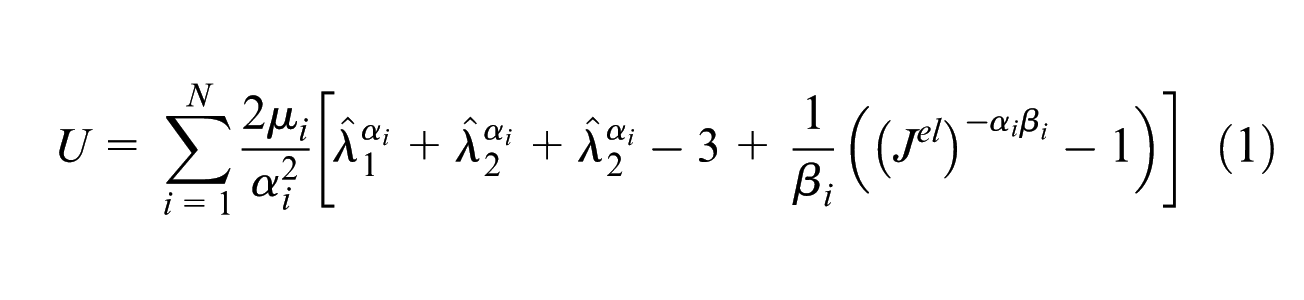
where N is material parameter;
Model validation
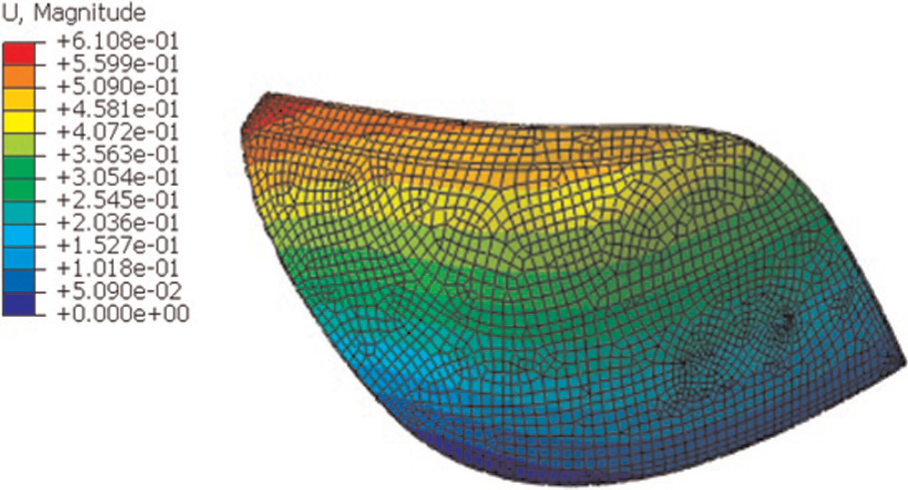
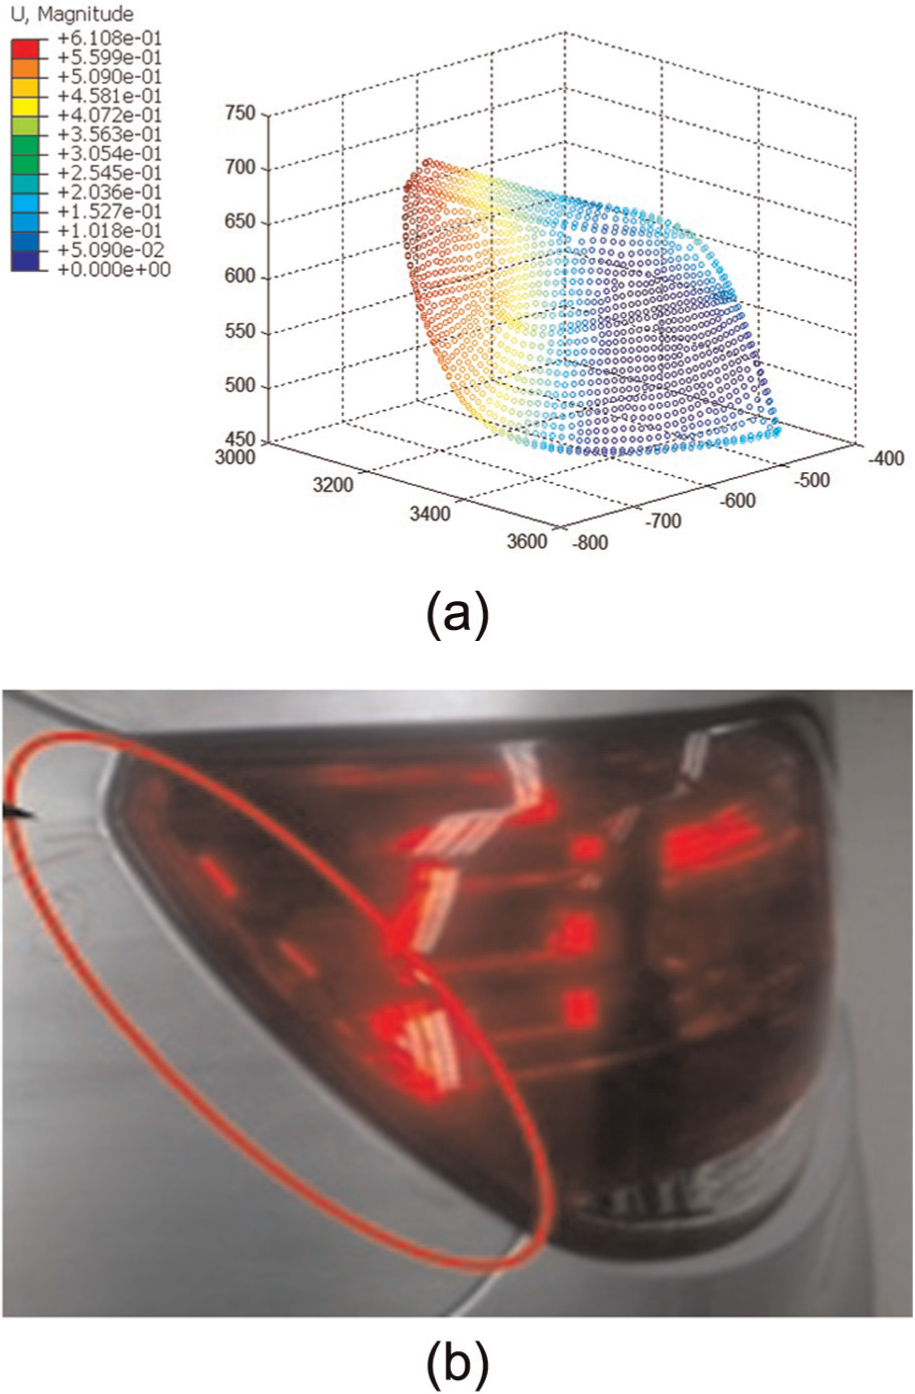
Tighten up the connecting bolts with a predetermined sequence in the taillight assembly model, deformation of taillight holder is shown in Figure 5. Simulation results indicate that not only the seal strip produces deformation, but also taillight holder deforms correspondingly.
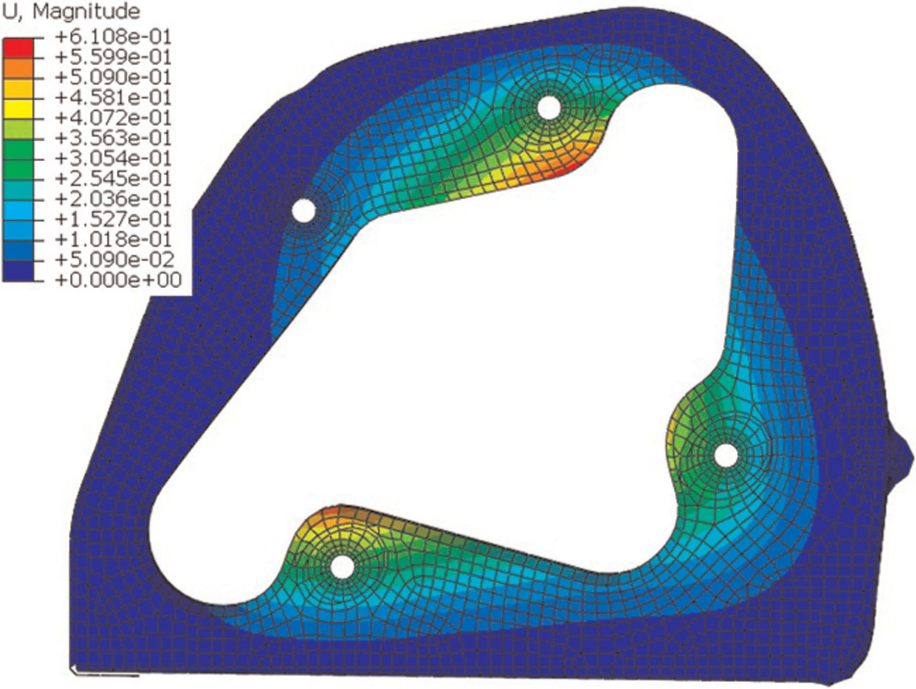
Contour of deformed taillight holder.
Model validation is conducted by practical assembly experiment. The differences between the practical contact pressures and the simulated pressures are employed to conduct the model validation. Pressure-sensitive paper (FUJIFILM-LLLW) is placed between the seal strip and the taillight holder. Tighten up the connecting bolts and keep the tighten-up state for 5 min. Then taking out the pressure-sensitive paper and translating the pressure-sensitive paper’s colors to the contacting pressures with reference-color-stripe of FUJIFILM-LLLW (Figure 6).
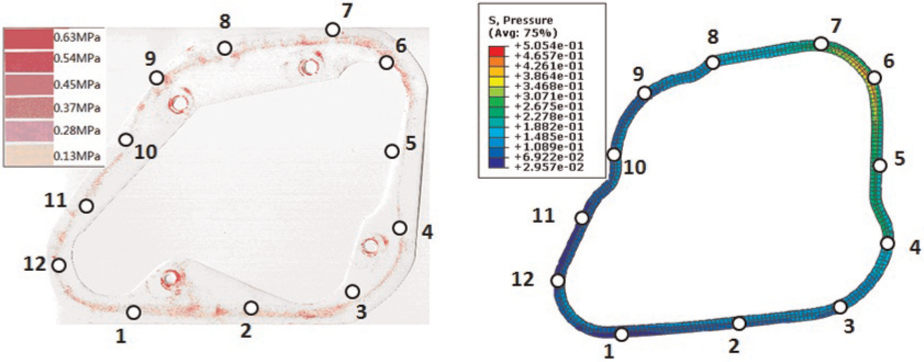
Pressure-sensitive paper and seal strip in FEA.
The differences between the experiment and the FEA simulation are not bigger than 10% (Figure 7). The results validate the proposed taillight assembly FEA model.
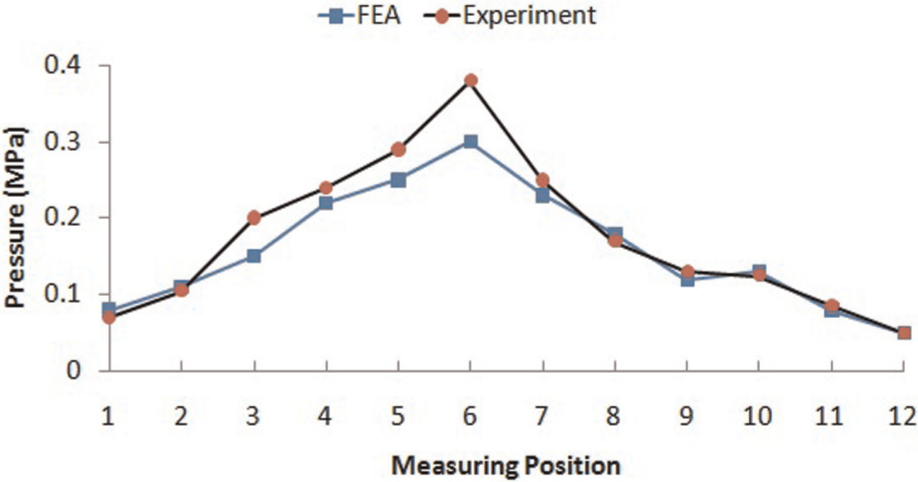
Comparison of contact pressure between experiment and FEA.
In fact, the final deformation of the taillight seal strip and the taillight holder is a coupled elastic and plastic deformation. The seal strip is elastic deformation. The taillight holder undergoes some plastic deformation, and it is proved by the measurement data of the taillight board by removing the assembled taillight. If calculating each point’s deviation induced by connecting bolts with the proposed FEA model, the computation workload is great and leads to low efficiency. A simplified linear approximation model for assembly variation sensitivity analysis is proposed to implement assembly deviation prediction and taillight shape optimization.
Fitting variation sensitivity analysis
Axial deviation of the screw bolts is the tighten-up displacements of the connecting bolts. Letting xi is the displacement of the ith connecting bolt (Figure 8), xi = d1−d2. Letting qj is the displacement of measuring points on taillight during the course of tighten up (Figure 9). There is some relationship between qj and xi.
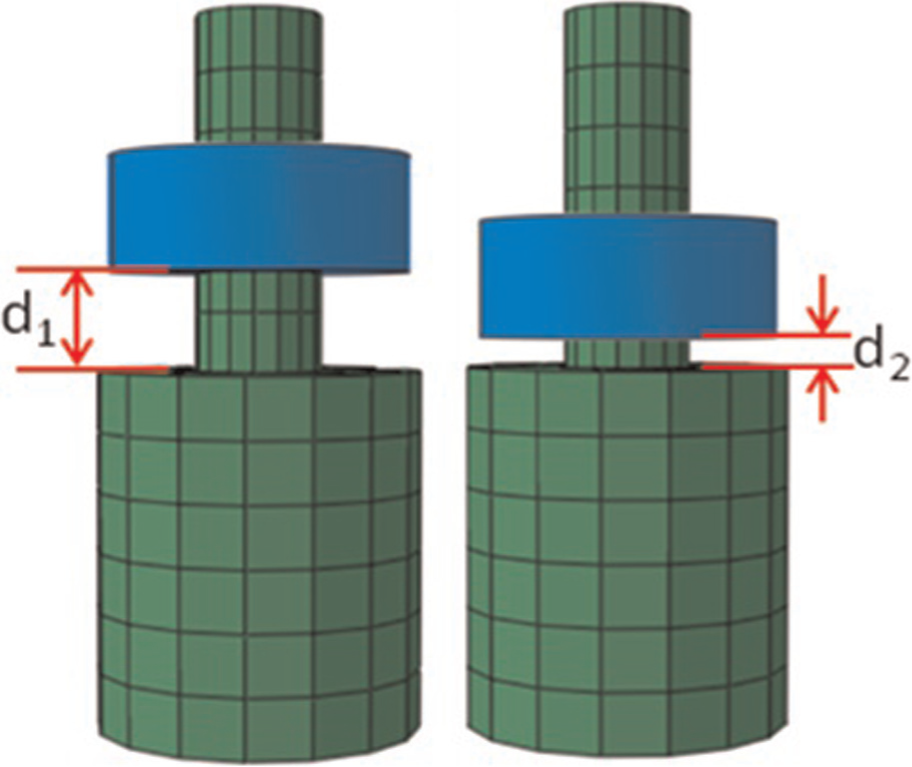
Schematic representation of displacement of connecting bolt (initial state (d1) and tighten-up state (d2))
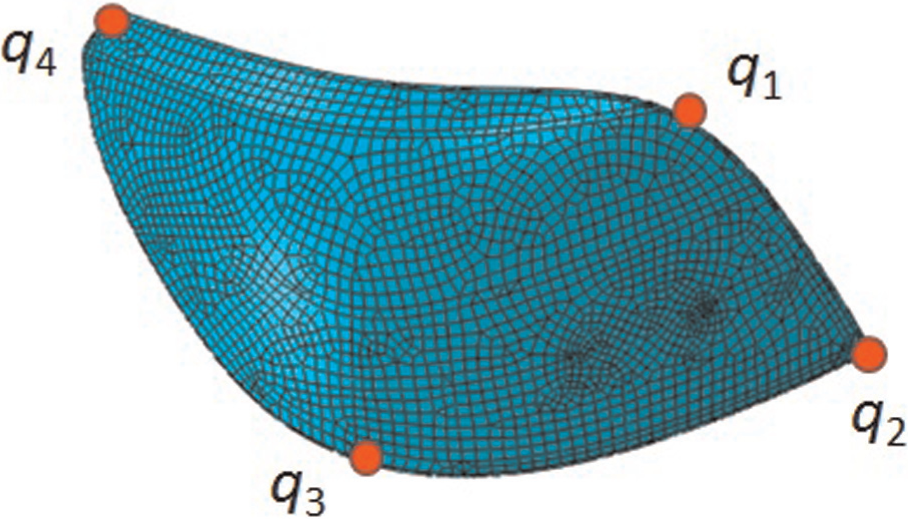
Measuring points on taillight.
Assuming that there are n connecting bolts in taillight, and their tighten-up displacements are x1, x2, …, xn. There are m measuring points on taillight and noted as q1, q2, …, qm. Letting X = (x1, x2, …, xn) T and Q = (q1, q2, …, qm) T , then there is one relationship between X and Q.
Letting Q = f(X), if
where
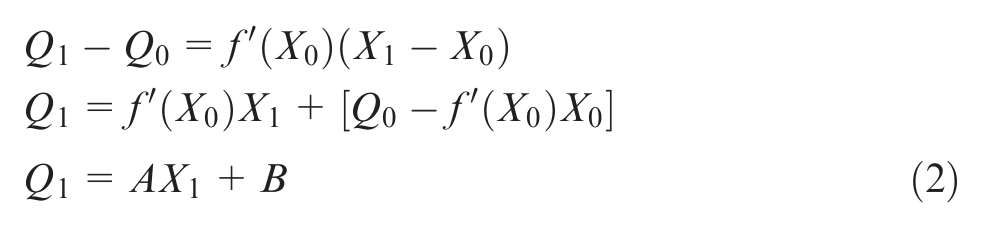
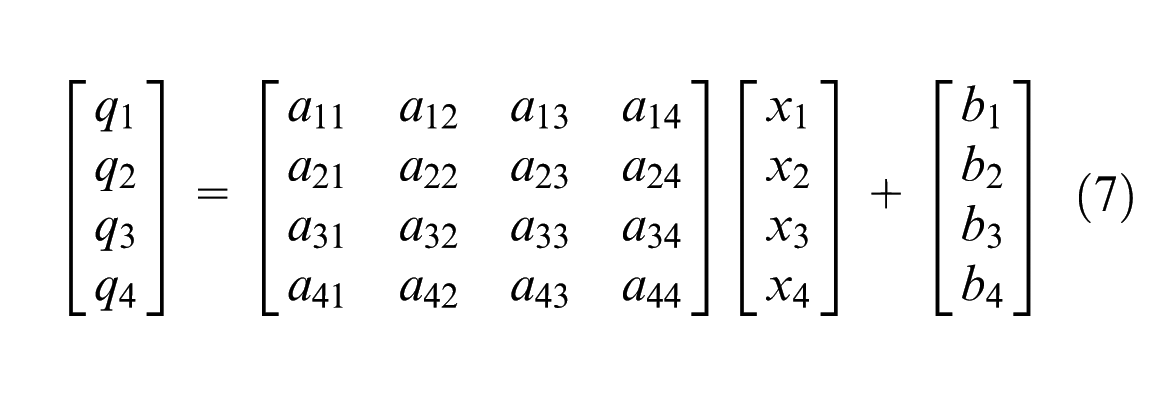
According to the above derivation, there is a linear relationship between Q and X in the neighborhood of X0. That is
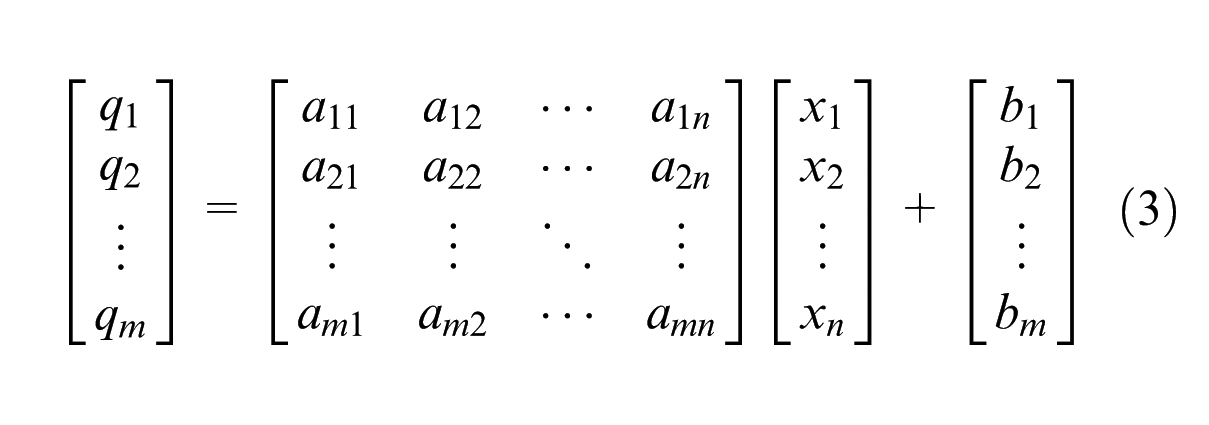
Representing the above matrix in a differential matrix form

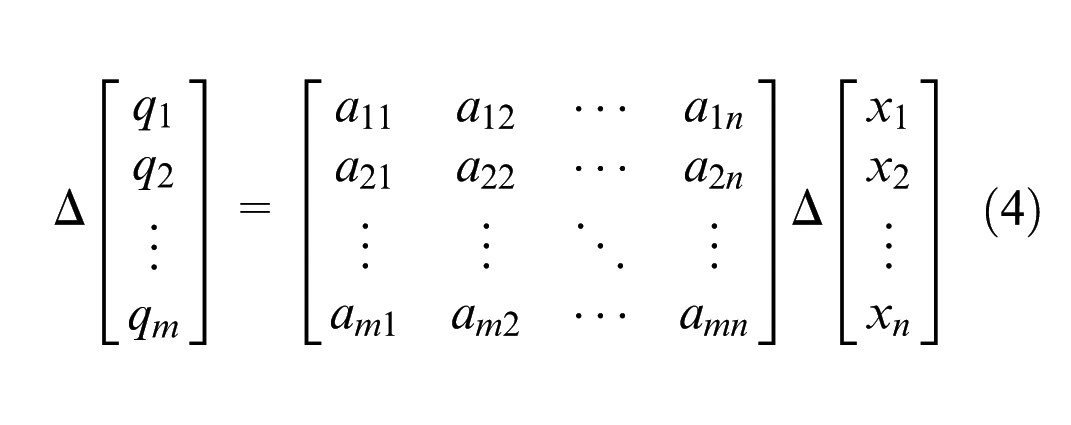
Expanding one row of the matrix equation
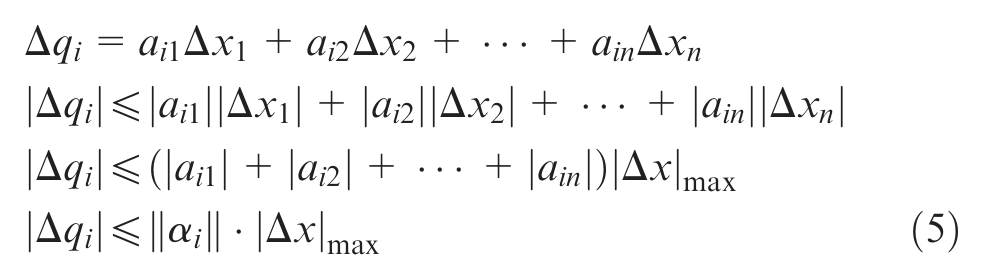
where
The one-norm of
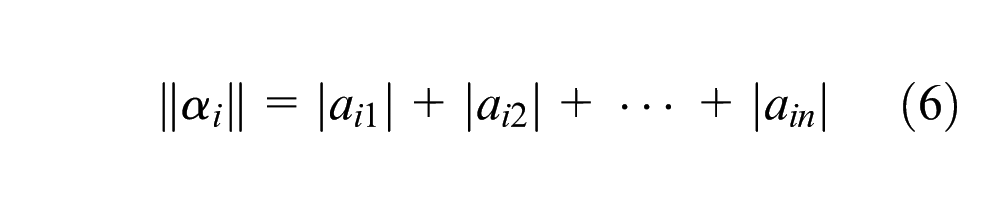
The coefficient aij (j = 1, 2, …, n) is the sensitivity coefficient between xj and qi. Calculating the one-norm of the ith row, which represents the degree of X impacts qi. Plotting the one-norm of the ith row (i = 1, 2, …, m) in the taillight and the biggest assembly variation areas can be found (Figure 10).
Assembly variation sensitivity cloud of the taillight surface.
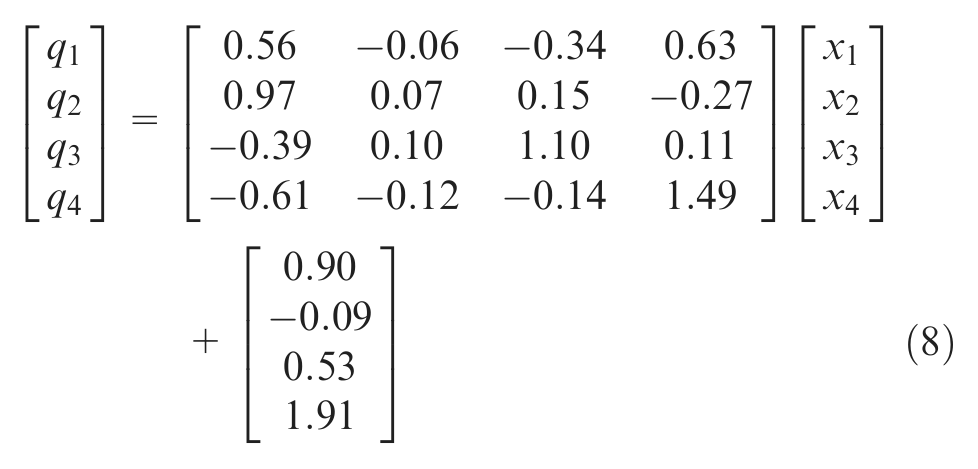
Four connecting bolts (Figure 4) and four measuring points (q1, q2, q3, q4) on the taillight (Figure 9) are chosen as the validation point for deviation analysis model

Coefficients A and B are calculated according to the simulated results
Numerical verification results between FEA simulation and linear approximation are shown in Table 2. The average deviation is less than 3%. It suggests that there is a good linear relationship between measuring points and connecting bolts’ deviation within the deviation neighborhood. This indicates the correctness of the FEA model. Input all the one-norms of the measuring points on taillight into MATLAB, and a deviation cloud is generated in Figure 11. Simulation result is consistent with practical situation (both the biggest variation areas are in the front-top of the taillight). It validates the proposed linear approximation sensitivity analysis model.
Numerical verification of the simplified model.
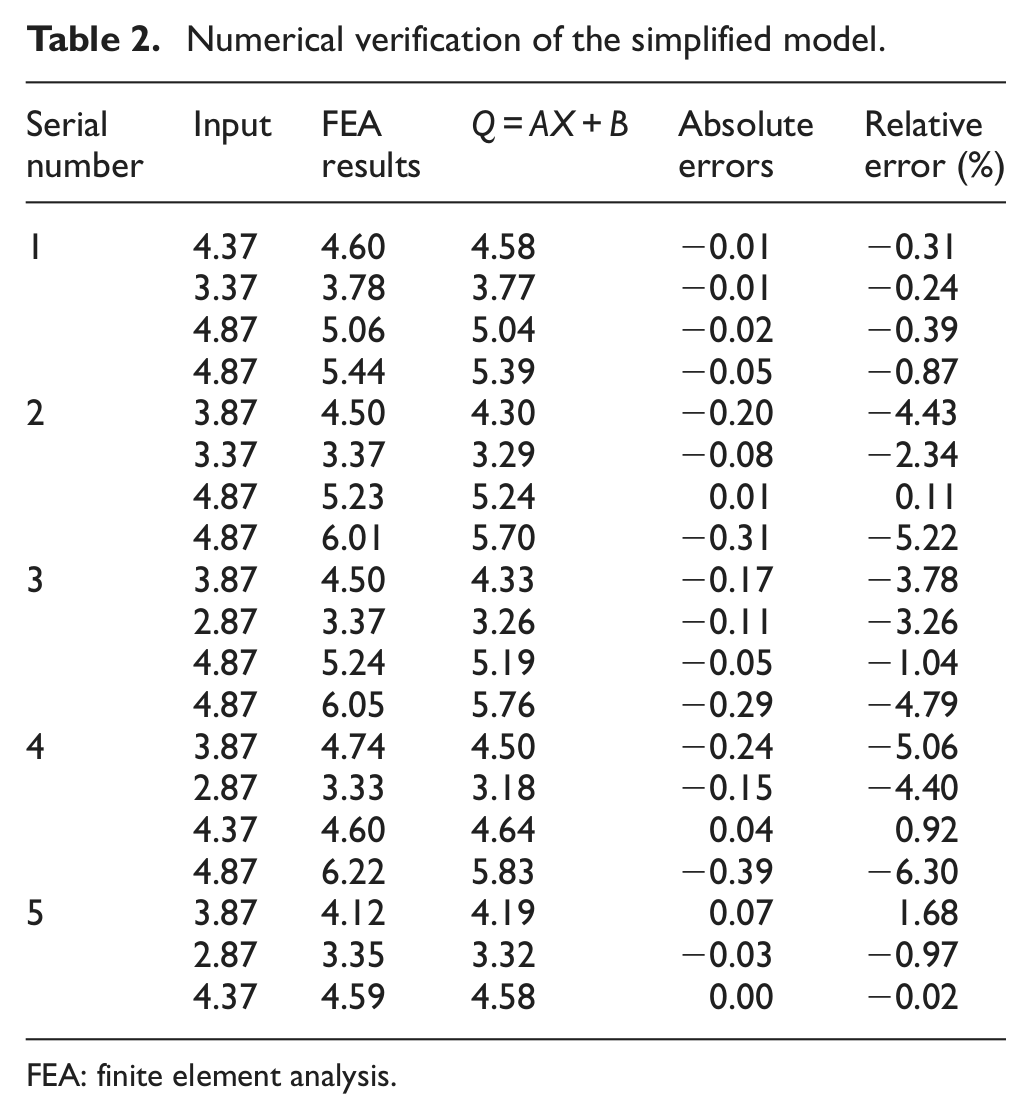
FEA: finite element analysis.
Comparison between prediction and production problem: (a) prediction result and (b) practical result.
Taillight shape optimization
Taillight shape can be optimized based on the proposed assembly variation sensitivity analysis model. Assuming that the taillight holder’s structure unchanged, the taillight fitting quality is improved through the optimization of the taillight shape (Figure 12). Taillight is extended into a blue cube, and the blue cube is the candidate space for taillight shape optimization. The one-norms of all the points inside the cube are employed as evaluation indices for taillight shape optimization.
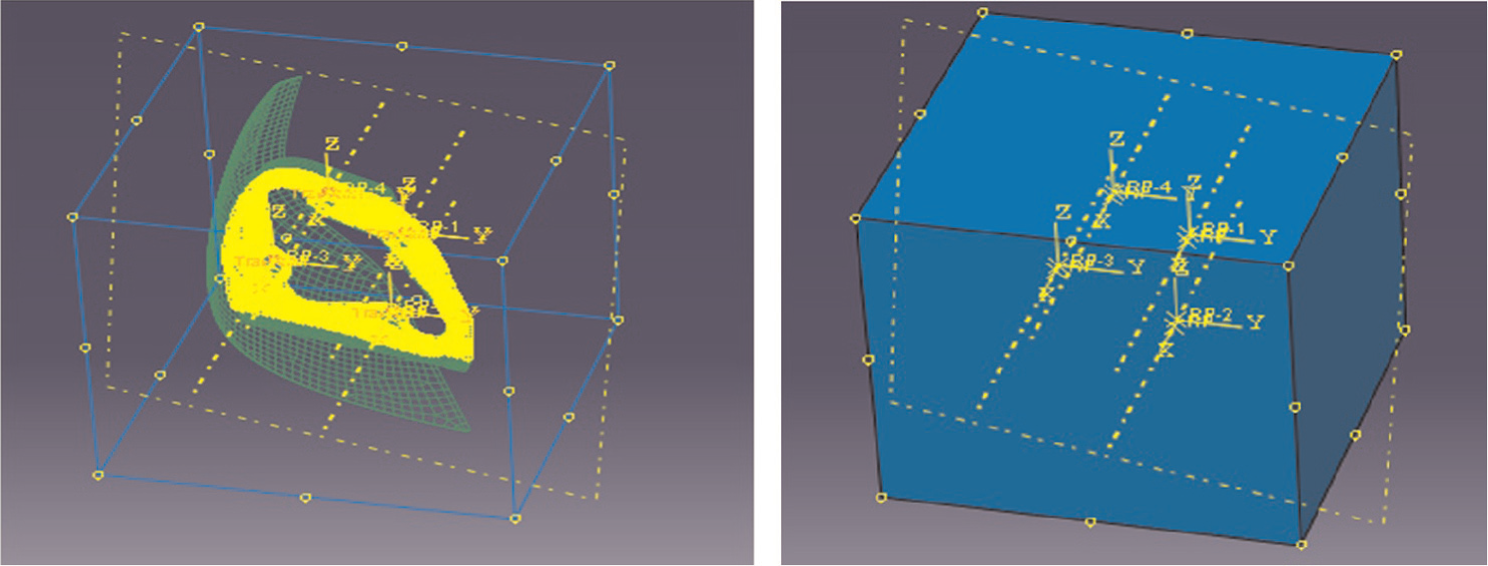
Candidate space for assembly variation sensitivity analysis.
Calculating the every one-norm of all the points inside the entity, all the points inside the entity could be classified according to the magnitude of the node sensitivity, such as 25%, 50%, and 75% (Figure 13). It provides the designers with the designing and optimizing candidate areas and improves the design efficiency.
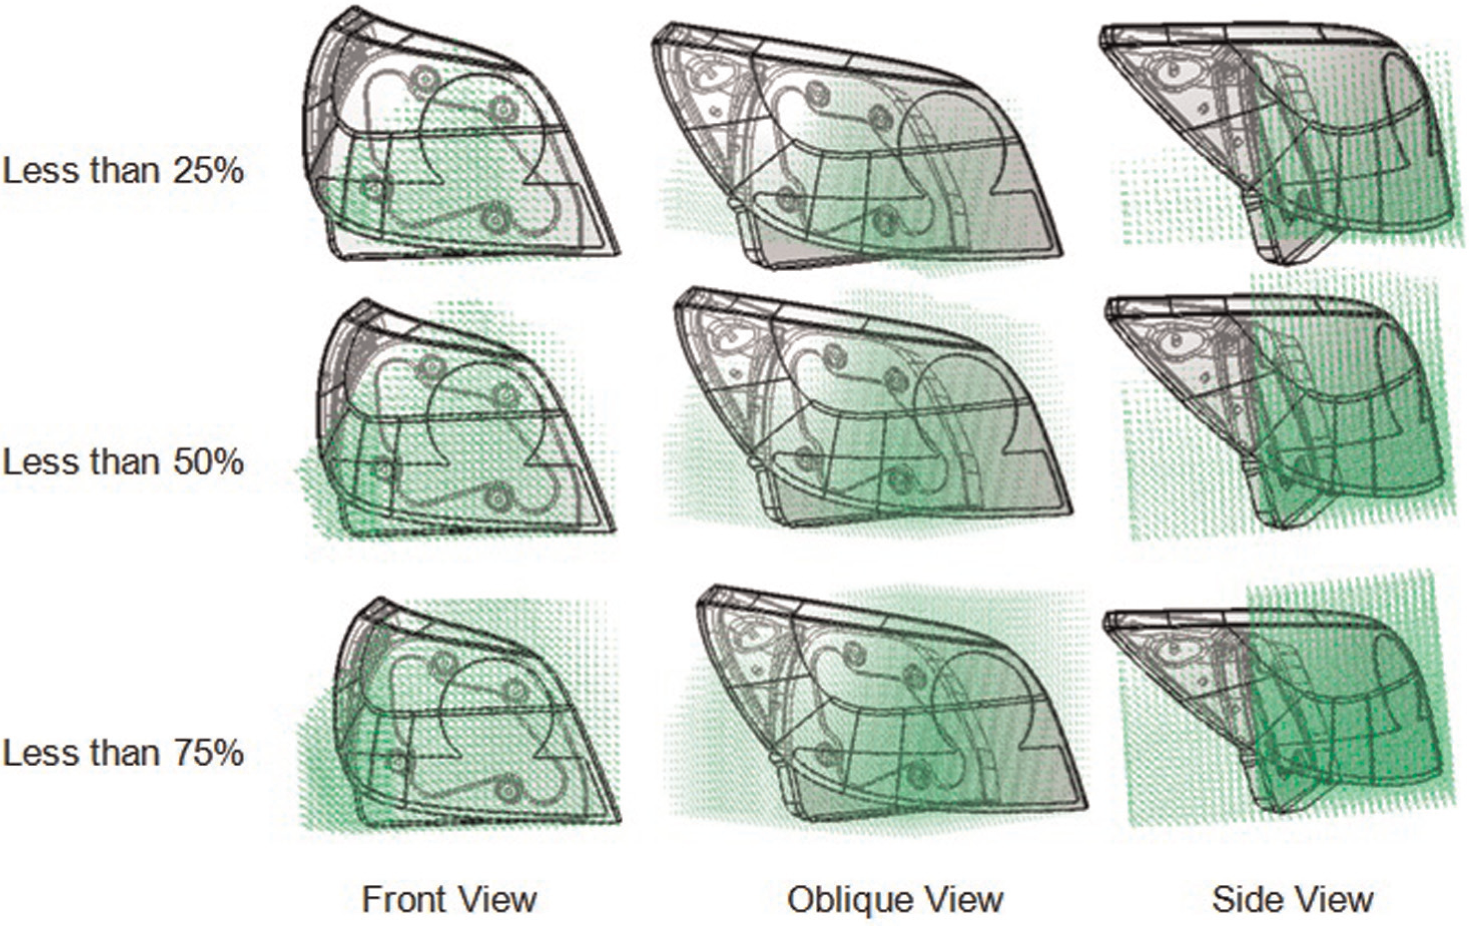
Feasible spaces for taillight shape optimization.
Based on the actual taillight assembly deviation sensitivity analysis, it can be drawn that the smaller the taillight’s surface, the smaller the assembly variation is. In order to obtain good assembly quality and high assembly efficiency, splitting taillights are employed more and more in currently automobile designing.
Conclusion
In the automotive industry, especially in body design, the relationships between doors, hoods, fenders, and other panels are critical for quality appearance. Front and rear appearances of an automotive are very important to the consumers’ first impression. Autobody panel fitting quality is an efficient way to improve dimensional quality and to give a better impression to the consumer. On the one hand, automobile designers design the taillight shape according to vehicle-design-style and experience. On the other hand, automobile assembly plants rely on the trial-and-error method to determine the assembly force and tighten-up sequence, which requires years of experience and knowledge of the assembly process. There is a need to develop good interface of DFA to efficiently assemble the taillights with attracting appearance and shape.
The taillight assembly model is constructed with FEs to simulate the taillight assembly process. The validity of the proposed model is proved by the consistence between the pressures obtained with the pressure-sensitive paper and FEA simulation results. If calculating each point’s deviation by the FEA simulation analysis, the computation workload is great and leads to low efficiency. A simplified linear approximation model for assembly variation sensitivity analysis is proposed. On the one hand, the simplified sensitivity model can improve the assembly efficiency and quality of taillight fitting. On the other hand, the simplified sensitivity model can be used to optimize the taillight shape. It provides a choice for bridging the designers with assemblers. The results of this research will enhance the understanding of the optimal fitting of automotive taillight and help systematically improving the taillight DFA interface and designing efficiency.
Footnotes
Funding
This study was supported by the National Natural Science Foundation of China (50905117), the Ministry of Science and Technology (MOST) of China under the contract of grant no. 2010DFA72760, and SMC-Chenxing Scholar Program of Shanghai Jiao Tong University.