
Abstract
Defining “quality” from customers’ perspective and controlling it throughout the product development process is a fuzzy and enduring task, especially for companies that are, simultaneously, fighting cost pressure and shortening product and technology life cycles. The poor predictability of customer demands complicates the definition of established requirements. During the product development process, product experts interpret the customer requirements and transfer them into product specifications. Due to the subjective nature of customer demands and the vast field of human perception, a huge number of product parameters have to be analyzed and specified to assure a comprehensive and successful approach. In order to keep an adequate cost–value ratio in production, it is not possible to pinpoint “hard” tolerances for each parameter. This article depicts the structured approach to choose the parameters, which are relevant for the customers’ quality judgment, and to tolerance “soft” customer perceptions. The emphasis lies on defining and scaling product parameters by combining product tests, interviews and focus groups for evaluation and interpretation by statistical means. Furthermore, the gathered information will be transferred into a “describing” specification, which will be supported by a tolerancing process based on statistical means.
Introduction
In the past, manufacturers of high-class products were able to rely on a premium rating and a focus on quality attributes such as reliability and a decent durability to establish their brand and sell their products. Nowadays, the situation has changed. In fact, companies feel strong pressure from globalized markets with many competitors trying to win the customers’ favor, especially with decreasing prices. This sums up to a high level of cost pressure and shortened product life cycles. Customers have access to a wide variety of more or less equal products in matter of quality. When it comes to a buying decision, the perceived product quality appears to be one of the most decisive arguments. Perceived quality includes the emotional charge of the product and the image of the multisensory experience that affects the customer besides rational consideration of features and performance. 1
However, the main problem is to find certain definitions of parameters that describe “quality” from customers’ point of view. Studies have shown that the judgment of “product experts” does not fit the expectations of customers. 2 In particular, this is because of the large variety of parameters that have to be considered and defined. Even if experts can manage to define all parameters by spending a lot of time and money, the question still remains whether these parameters are really of interest to the customer. This is why companies have a strong need for a quantitative and effective approach to measure the perceived quality from customers’ point of view. Additionally, a deficient communication along the supply chain causes a loss of information on the relevant parameters and increases the discrepancy between customers’ view and companies’ specifications. 3 In this article, a structured approach to measure relevant customer-related attributes is presented, and the usage of a statistical tolerancing process is explained.
Beforehand, the theoretical framework will be introduced. In short, measuring perceived quality is essential for understanding the effects of subjective impressions on the customers’ judgment of product quality (see section “Definition of (perceived) quality”). Due to a lot of intercompany communication within the supply chain, information must be clearly described and, with regard to content, must be correct (see section “Supply chain and bullwhip effects”). If the customer-related information is not described as objective as possible, a product attribute bullwhip effect may cause unwanted distortions during product development and production (see section “Supply chain and bullwhip effects”).
Definition of (perceived) quality
The term “quality” is not only multidimensional but also hard to define and measure. In 1928, Lisowsky was the first to differentiate between objective and subjective qualities. 4 In contrast to the objective quality being an “absolute” and “unemotional” quantity, the subjective quality is a value that implies a subject needing something. 4 The quality concept has been discussed and extended several times in the literature, for example, with respect to rational and emotional components and intrinsic and extrinsic dimensions.5–10 Garvin developed a structure of quality in 1984. In his theory, he differentiated eight subjective and objective dimensions, including the dimensions of aesthetics and perceived quality. Both dimensions are ratings of quality based on fragmentary, incomplete knowledge and thus highly subjective.11,12
Objective quality is independent of customers’ judgment and is observable, measurable (via measurement tools or expert rating) and verifiable. 13 It is defined as the technologically ascertainable basic benefit, that is, the entity of technical parameters of products and production processes. Objective quality can be equated with the technical power of a product.14–16 In contrast, the perceived quality is the consumer’s judgment regarding his achieved or expected benefit from the product. 16 This kind of rating is an abstraction on a higher level, a global appraisal. 14 The final opinion on the product is the result of the comparison of the quality actually observed and the quality expected. The expectations are based on autochthonous and foreign experiences and factors such as brand image, price and advertisement.13,14 The perceived quality is subjective and can only be measured personally for every single individual and situation.14,15 While the customer interacts with the product, he generates a hypothesis about the quality of the product, which may be decisive for his buying decision.
Supply chain and bullwhip effects
The supply chain is often seen as a linear chain of sequential dependent links (entities), beginning with the raw material supplier and ending with the “consumer.” The entities are legally separate organizations, which are basically connected in both directions by the flow of goods, services, capital and information.17–20 Trends, such as changes of the market and the increasing complexity of the product development and production processes, have resulted in a network instead of a linear structure. 21 Due to the complexity of the supply chain, there is an increasing danger of inefficiency and waste of material-related and human resources.
Simon (1952) discovered the so-called bullwhip effect, which was further explored by Forrester and Sterman.23,24,25 Originally, the bullwhip effect describes the cumulative amplitude of the order size and the stock along the supply chain from anterior to posterior entities, although the consumer requests products on a constant level. The observable increase of the order size is seen as a rational behavior pattern.17,22,23 Remarkably, the purchase order quantity related bullwhip effect can be seen as an analogy to the product attribute bullwhip. In this case, the problem is transferred to the strategic technology planning process. The original equipment manufacturer (OEM) deduces a prognosis regarding customer-related information on product attributes with the help of diagnostic tools. Based on these results, the OEM orders different subsystems. The supplier accepts the subliminal task and develops know-how for the required attributes with respect to the predictions of the OEM. Deviations in the specification and production phases of a product that are caused due to false expectations on what the consumer really wants are considered by the product attribute bullwhip effect. The relevant product characteristics, which form the basis of perceived quality, may not be specified correctly in accordance with customers’ demands. If the assumptions previously made by the OEM are actually wrong, false know-how is developed and shared by the supplier. 24 The consequences may be a deceptive focus on product attributes that are not important for the customer or expected with a different characteristic. A reason for the product attribute bullwhip effect is the influence of incorrect product attribute predictions on the product planning process. These effects may deteriorate further along the supply chain. Addressing the background and the negative consequences of this kind of bullwhip effect, a systematic approach to implement the information about customer-related product perception through the whole supply chain is conducted in this article (see section “Distribution”).
Methodology
This section presents a systematic approach to define and measure the attributes of perceived quality. Moreover, a systematic approach is used to integrate the gathered results into the supply chain to resolve communication asymmetries and the negative consequences of the bullwhip effect. Figure 1 offers a short overview of the upcoming structure of the methodology. The proposed method can be applied to almost all kinds of consumer durables. However, the method has also been successfully applied on industrial goods. 25
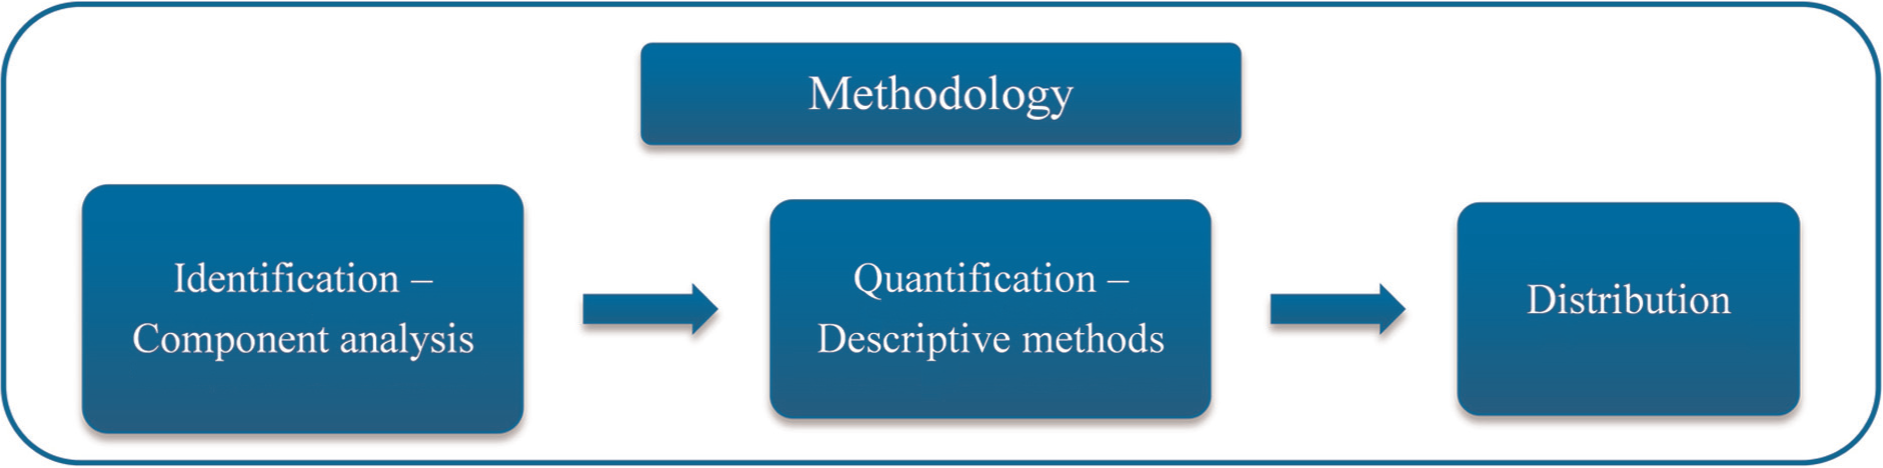
Structure of the methodology.
Identification—component analysis
As already mentioned, a positive perception of product traits is essential for a positive product judgment. Product quality can be split up into the protective quality based on technical functionality and a subjectively coined perceived quality.14–16 In this article, a staged model is used to structure the perception and close the gap between the entire perception by the customers and the technical parameters. The model assumes that the general impression is based on perceptive clusters that are composed of quality traits. Every quality trait is defined by so-called descriptors, which are dependent on technical parameters. The staged model offers an approach to objectify customers’ judgment of product quality by breaking the subjective impression down into objective technical parameters. Thus, the most relevant product traits in customers’ opinion can be measured to conduct a suitable scaling and to define exact tolerances as cutoff values for considering an object as high value.
Groups of elements that are perceived as belonging together, so-called perceptive clusters, subdivide the entire impression of customers into manageable parts. In a cluster and the interface to adjoining clusters, the sensation of all senses must be attuned to each other to assure a positive impression of the product and to prevent sensorial dissonances. The described perceptive clusters consist of several quality attributes. An attribute has a meaning (semantics and quality) and a specification (quantity). The specification by descriptors via technical parameters then leads back to an objective, scalable and measurable physical quantity (see Figure 2). The concretion of technical parameters is an essential step to develop defaults for construction, develop products and compile the tolerance width of specific parameters.

The perceptual subdivision of a product.
Quantification—descriptive methods
To identify and rate quality attributes, a two-staged model is suitable. To shorten the process, the central analysis is performed by a minor group in the form of a workshop. The results from the workshop are then tested in an empirical investigation with a larger group of probands.
Before the actual workshop, probands are trained to become “expert” customers by conceptual information and an exemplary task. During the workshop, the probands are asked to identify quality attributes of test objects. The part of finding a term is two-staged. In the first stage, all identified quality attributes are collected with the intention of finding uniform terms and specifications for every characteristic of the group. A group discussion is conducted to develop a common agreement on the different characteristics due to possible variations in the general understanding of the particular terms. In the second stage, the identification of the term itself takes place. Of every characteristic group, one quality attribute is examined by the workshop group. The result is a concise description for every attribute and an accordant suitable connected term, in most cases adjectives, for the minimum and maximum specification of the scale. For the rating of the characteristics, a six-staged Likert scale is used. This process is repeated until all relevant perceptive clusters are analyzed and form the fundamental list on which the rating questionnaire for the empirical investigation is based.
The empirical investigation is conducted with a larger sample size to allow better statistical inference from the data and increase the explanatory power. The probands receive all relevant conceptual information. To avoid bias in the individual judgment, there is no group discussion. The validation of the attributes is achieved by the questionnaire generated in the workshop. All probands rate the present test objects with respect to the terms in the questionnaire. A Latin square test plan of rotating the probands is used to avoid unwanted bias from a specific order of test objects.
Distribution
For a reasonable treatment of the data, a suitable integration of the gathered information in the product-related supply chain is required. For this purpose, there must be a connection of all stages of perception. Products are accurately specified with respect to customers’ demands if the description of the product contains all technical- and perception-related aspects. Both structures can be displayed in a tree structure. The whole product is broken down to the level of technical parameters. Due to the fact that technical and relevant perceptive aspects can be differentiated to technical parameters, there has to be an interface between both dimensions (see Figure 3).
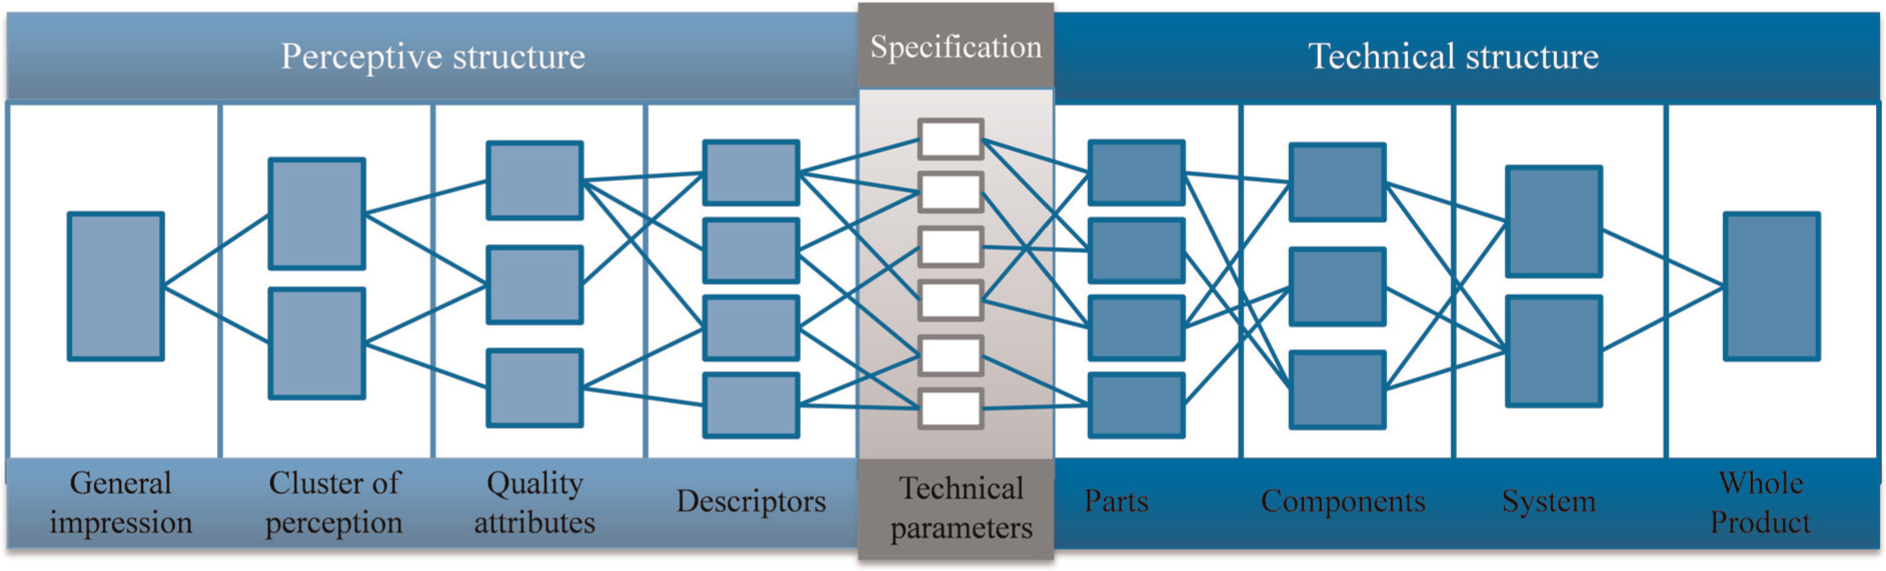
Perceptive and technical structure.
There are two major benefits resulting from such kind of product structure: first, the whole product is structured into partial components, and information on the product is compartmentalized, and second, it is possible to track back the influence of the technical parameters to the whole product. For securing a harmonious apperception of the product, different stages of perception must be designed harmonically. In this matter, the connection links in the interface are defined in an expert workshop (technical- and perception-related professionals). An essential purpose of the distribution phase is to find out a weight that indicates the most relevant and influential aspects for a positive perception of the product and to deduce specifications for the perceived quality. The selection of decisive descriptors becomes especially important with respect to the usually huge amount of descriptors of a product.
During the consideration process of the descriptors, the descriptors are compared to each other and explored regarding their universality (appearance in several quality attributes). Product experts weigh the different consumer groups because there may be different foci in perceived quality, but not all groups belong to relevant product purchasers. Furthermore, the quality attributes and the perceptive clusters are weighted for specific reasons. In the end, all weights from the different stages of perception can be allocated and a general weight for the specific descriptor is deduced.
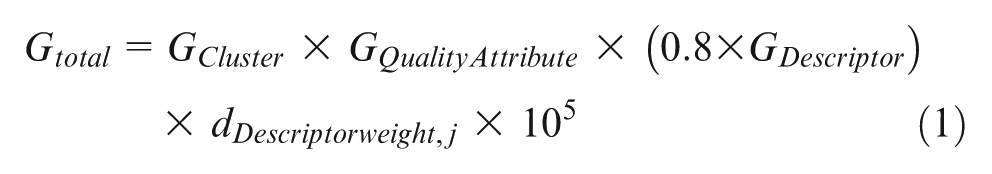
The final selection of the most essential descriptors is achieved by the Pareto principle, which follows the thought that 80% of all events can be led back to 20% of the involved actions.26–28 Transferred to the present topic, it is assumed that 20% of all descriptors are responsible for 80% of the perceived quality. These 20% of descriptors are the most important ones and must be subject to hard specifications, which includes the implementation of objective, quantifiable measurement data. The remaining 80% of the descriptors can stay qualitative but in a standardized vocabulary. The fitting formula with respect to the Pareto principle is
Results
The theoretically described approach in section “Methodology” was prototypically applied to the interior of a compact car. A total of 139 test persons between 18 and 60 years were interviewed in a predefined, reproducible setting. The probands were encouraged to “think aloud” and express their first impressions of the product. Probands had to extract possible perceptive clusters and interfaces in the product. The test persons examined seven most relevant perceptive clusters (minimal amount of mentioning: 15%). This indicated that a cluster and its immanent components must be designed and integrated harmonically. This approach of identifying the perceptive clusters was verified by a comparison study using an explorative interview and the tracking of the eye movement (eye-tracking system). The data extracted from the probands (26 for eye tracking and 28 for interview) offered a representative number of perceptive clusters. Although both methods are suitable for extracting the relevant perceptive clusters, a combination of the methods is recommended to combine the advantages of both approaches.
The next step to objectify customer-related demands was the analysis of the specific perceptive clusters and the definition of quality attributes. According to the approach described in section “Quantification—descriptive methods,” a two-level study was realized with the example of “steering wheels.” In the first step, 12 workshop participants, aged 19–70 years and with an equal distribution in gender, were asked to generate quality attributes with defined specifications. As a result of this, 44 quality attributes could be extracted, which were tested for reliability by statistical tests. Further statistical methods, for example, the gamma relation test and the Pareto analysis were used to outline 26 customer-relevant quality attributes. The validation of the results from the workshop was realized with 65 probands (aged 19–35 years). The previously composed 26 customer-relevant attributes from the workshop had an overlap of 66% with the results from the validation study, while the predefined 44 attributes had a coverage of 88%. Consequently, the applied two-staged approach is suitable to identify the relations between the characteristics of the attributes and the judgment of customers. Two reference studies were conducted to validate the approach. Probands were asked to judge on the quality attributes of shipping packets and several online shopping cart systems. Both studies exhibit significant results, which imply that the approach is valid.
After the cluster study and the quality attribute study, another quality attribute study was arranged to investigate another cluster, the gear shifting gate. Again, a two-staged approach was chosen. The workshop was realized with five product experts, one woman and four men. The experts generated 27 quality attributes with defined scaling. The empirical investigation was based on 15 customer-relevant quality attributes as a result of the statistical analysis. Fifty-three probands (19–42 years) participated. The remaining 27 attributes were covered by 75% of the attributes mentioned by the test persons; the original amount of attributes was covered by 88%. The approach was valid. With the help of correlative analysis, connections between the characteristics of the attributes and the customer-related judging were identified. Furthermore, the applied factor analysis reveals five relevant factors for the different descriptors: geometric dimensions, surfaces, distortion, contour and hole. This study is essential for the subsequent descriptor study conducted to assure that the customer-related demands are transferred into technical parameters and integrated in the supply chain. Ten probands were qualified in a successive learning process to describe quality attributes with descriptors. While the study took place, 10 descriptors were mutually deployed by the participants. Every descriptor was assigned to a scale, and an inspection instruction was developed (see Table 1).
Exemplary descriptors for the perceptive dimension “haptic” with test instructions.
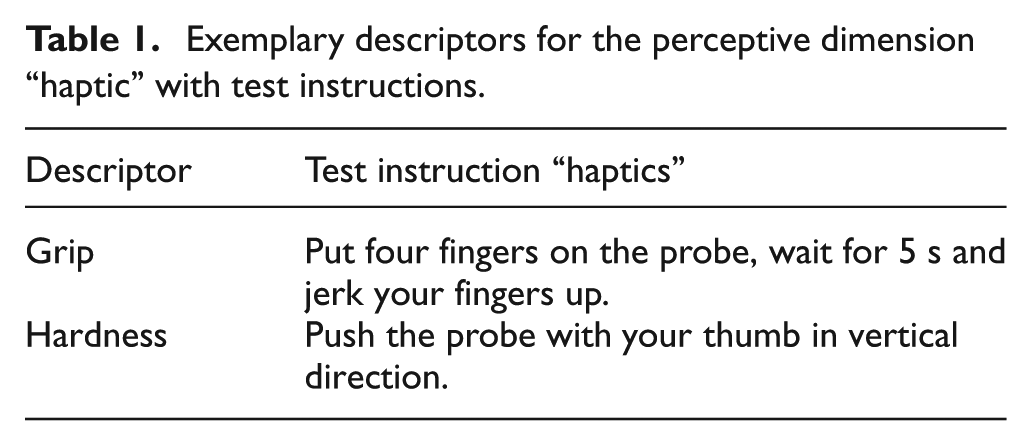
Finally, the subjects were categorized by the descriptors; the results were independent of the test persons. Within the context of the descriptors, an important task is to develop further descriptive specifications. In this matter, a prior focus lays on the definition of perceptive borders. A study has been conducted with the quality attribute “haptics of leather surfaces.” In an empirical investigation, 252 probands judged 36 leather surfaces according to 13 descriptors. Every sample has been rated by at least 40 probands. To categorize the perceptive tolerance borders, an analysis of probands’ ability to differentiate the leather skins, especially in the extremes of the scale, was carried out. Analysis outlined that the usage of scale for the descriptors is strongly differing in the range. For an in-depth analysis, the scale itself was subdivided in particular clusters in accordance with the idea that there is a meaningful difference between the judging of complex perceptive operations in specific scale sections (e.g. 0.5 scale points). A two-sample t-test applied on the different blocks indicates significant differences (cutoff value at 7.5%) in between the controlled blocks. Additionally, limiting sample pairs are determined to find out the specification of difference from customers’ point of view and are controlled with the help of statistical tests. These limiting samples reveal whether the descriptor is discriminated enough by the customer. It must be noted that the investigation of descriptors can only be realized in case of a sufficient difference between the standard deviation and range of the measured customers’ rating.
Discussion
The results suggest that the approach and the used methods are not only theoretically adequate but also practically helpful. The application to the interior of a car outlines that probands identify and remark the existence of perceptive clusters. The sample size used for several studies was big enough to allow reliable statistical conclusions. Moreover, the high overlapping of the results from preworkshops and the empirical investigation clearly shows that the gathered quality attributes are highly trustworthy and can be used as a basis for other studies. Still, the higher coverage of experts in comparison to “naive” customers suggests that the expert rating is more precise, despite the training course for the test persons becoming “expert” customers.
The approach of finding quality characteristics and creating a fitting min–max scale for it was successfully controlled by reference studies. This can be seen as content validation since the approach does not seem to be dependent on a single product or not working for other media. Especially, the transfer to computer media is a relevant contribution because of the nonphysical character. Another positive aspect is that the final descriptors were relatively independent of the individual opinion. This implies the objective character of the descriptors, although belonging to the perceptive structure. Thus, the subdivision of the perceptive structure seems to be done correctly and allows gathering of the most essential customer-related demands.
Defining and scaling customer-related demands are difficult but at the same time important tasks. Companies can no longer rely on product quality itself; by contrast, there is a strong urgency for special quality attributes that enable the own company to offer products that succeed the vast amount of competitors. Until now, the demands of customers often were interpreted by the OEM from a subjective point of view. Due to the poor predictability of these demands, a “product attribute bullwhip effect” can be observed, which causes an inefficient orientation toward wrong attributes and false know-how along the supply chain.
In order to resolve this problem, this article has shown a systematic approach to measure the quality attributes that are really important for the consumers in an objective way. The subdivision of the perceptive structure into several stages and the understanding of the individual peculiarity of each level allow a clear specification of the consumer demanding relevant descriptors and the bipolar scale containing the minimal and maximal characteristics of each descriptor. Thus, the product can be rated and the company may deduce valuable input regarding improvement potentials. In addition, the “product attribute bullwhip effect” can be eliminated with the help of knowledge of which parameters must be controlled with regard to the will of fulfilling customer-related demands. Using this approach may be useful for acquiring a decisive advantage in competition.
For the future, it could make sense to do further investigation and testing of the strategy conducted in this article, for example, by testing other product samples and proving its universality. The software template could be examined regarding its adaptability and manageability in companies to see whether the gathered information can be integrated in the supply chain properly.
Conclusion
This article outlines the growing importance of the subjectively affected perceived product quality for the development and production of products that are able to thrill customers. So far, the definition of the parameters of subjective quality was mostly done by the OEM, which resulted in the dissemination of false information. The drift of the original information is worsening due to bullwhip effects along the supply chain. Therefore, it is obvious that there is an urgent need for a systematic approach. In this order, the perceptive structure is subdivided down to technical parameters, which are the interface to the product structure, to achieve objectified data regarding the perceived quality.
The theoretic framework outlined in section “Introduction” is successfully transferred to several empirical studies, using established and standardized methods like questionnaires, interviews and workshops. As a result of these conducted studies, customer-relevant demands have been defined and scaled in the form of certain specifications. Finally, the gained information can be shared with the supply chain by using a software template.
Footnotes
Funding
The IGF promotion plan 12EN of the Research Community for Quality (FQS), August-Schanz-Str. 21A, 60433 Frankfurt/Main, has been funded by the AiF within the program for sponsorship by Industrial Joint Research and Development (IGF) of the German Federal Ministry of Economic Affairs and Technologies based on an enactment of the German Parliament.