
Abstract
This article describes an image analysis algorithm used to detect profiles during arc welding processes. The new algorithm is an aggregation of image processing (segmentation, filtering), computational geometry (alpha shape) and graph theory (cycle detection). It allows to extract precise geometrical profile entities, whether open or closed contours, that could be used for the monitoring of the welding process. The algorithm is shown to be really efficient and could be used for real-time monitoring of gas metal arc welding process.
Introduction
A better observation of the weld pool or the metal droplet behavior in a pulsed gas metal arc welding (PGMAW) process could help to enhance the welding quality in manufacturing processes.1,2 In PGMAW, the weld quality is strongly related to the metal transfer stability. The monitoring of metal transfer process can indicate the quality of the deposition process. 3 Therefore, geometrical analysis of the free surface of macro drop or droplets can offer important information for a better understanding of the physical phenomena during welding and can help to validate the simulation of welding processes.
There have been many studies on visual sensing techniques for observing weld pool image 4 and metal transfer process during welding. 1 Optical sensors like high-speed cameras and lighting systems have been widely used in gas metal arc welding (GMAW) process to perform image acquisition, 5 control process, 4 parametric studies 6 and droplet dynamics analysis. 1 After image acquisition, image processing plays a critical role in extracting useful information from visual scenes. 3 Nevertheless, the strong interference due to the arc lightning requires more than standard image treatment to analyze the raw images of the welding process. 7 Previous work has shown that it is possible to perform geometrical analysis in weld pools or droplets. 2 Parameters such as macro drop or droplet surface, volumes or height have been measured using different specific image processing algorithms.2,3,7,8 However, to date, effective automatic image processing of metal transfer has not been developed. 3
In this article, the monitoring of the shape and size of welding objects during static PGMAW is investigated with a two-dimensional (2D) method. A shadowgraphy technique, or back lighting, is the natural choice to record the droplet and macro drop profiles. 6 Due to the arc light interference and the relatively high speed of wire feed process, a high-speed camera and an effective image processing algorithms are required. 3 To have an indicator on quality of the process, the algorithms have to be able to extract the geometrical information (area, size and others) from the macro drop and droplets. In addition, the voltage and current signals are directly related to the droplet formation at the wire. 6
The algorithm gathers classical image treatment, computational geometry and graph theory. It is applied to obtain 2D profiles and geometrical parameters from macro drop and droplets. The purpose is to enhance future numerical models and improve welding monitoring setup by direct observations.
This article is organized as follows: First, the experimental setup for the application of macro drop analysis is described in order to show the difficulties and performances of profile detection during welding process. Then, mixed algorithms are explained, and some results of the macro drop and droplet study are shown.
Experimental setup
Multiphysics platform
A specific setup for data acquisition has been established in the laboratory to synchronize all kinds of signals and images in position and in time. 9 The experimental setup is composed of a welding generator, a data acquisition system and a high-speed camera. In this article, only details on image acquisition setup and treatment will be given.
Image acquisition setup
The PGMAW static process is recorded by shadowgraphy optical method. A halogen lamp is used to light the welding process. To guarantee a homogeneous illumination of the welding process, a light diffuser is placed in the optical path close to the halogen lamp. Finally, the shadows of the welding elements are projected to the other side where a Phantom V5.0 high-speed camera is aligned in the optical path (see Figure 1). A square device is used to ensure perpendicularity between the charge-coupled device (CCD) and the scene.
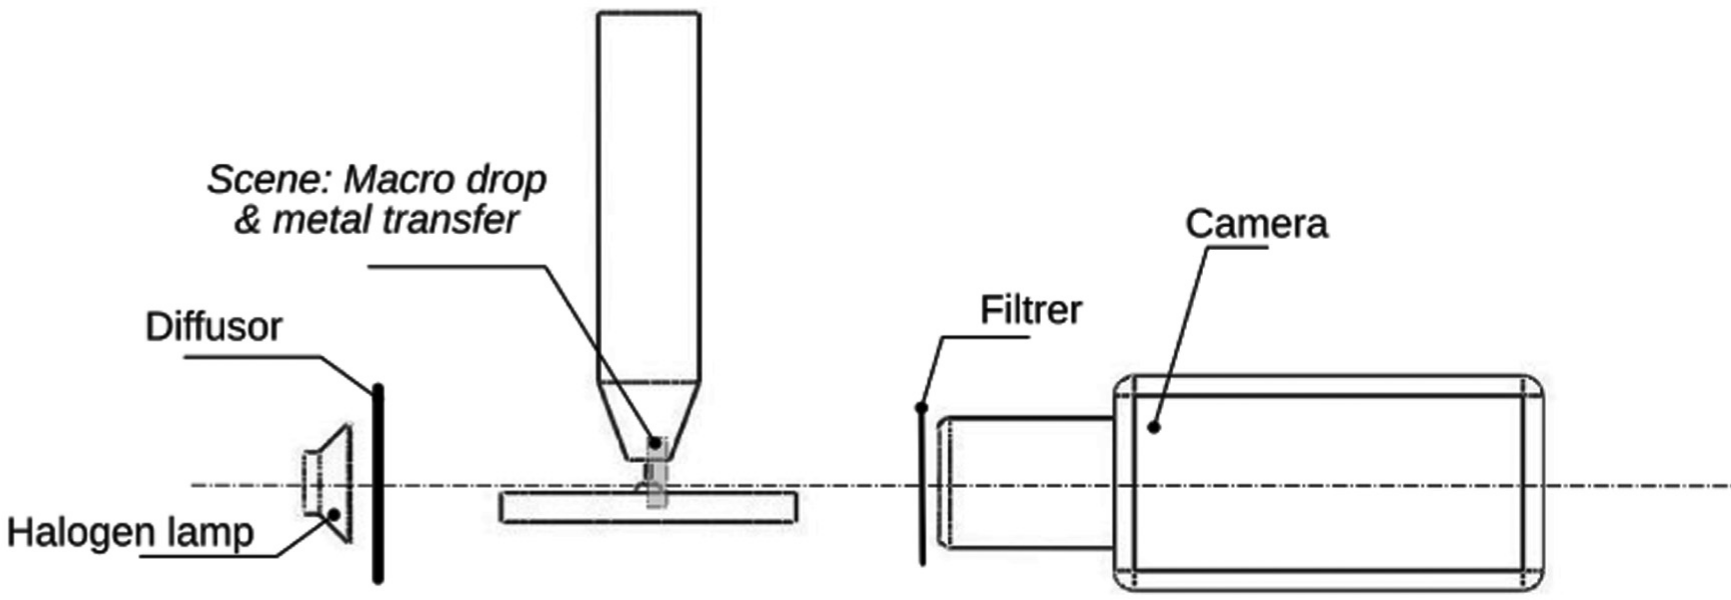
Experimental setup to detect macro drop and droplet edges in GMAW process.
To enhance the image contrast of the weld elements inside the electric discharge, the intensity rate between arc light and halogen lamp has to be reduced. The arc is known to have a low light emission around a wavelength of
Welding condition
Stationary spots weld are made using the GMAW process with the Oerlikon CitoWave 500 generator. The target is a steel disk with a thickness of
Shielding gas composition.
The welding parameter values are summarized in Table 2. For the experiments described in this article, there is no welding speed.
Determined constant welding parameters used in experiments.
The images are recorded at 4000 fps, which is enough to measure macro drop radius and apparent liquid–solid contact angle histories.
Geometrical parameters
Macro drop
Figure 2 shows the geometrical elements to be studied at the macro drop: the macro drop radius at the base
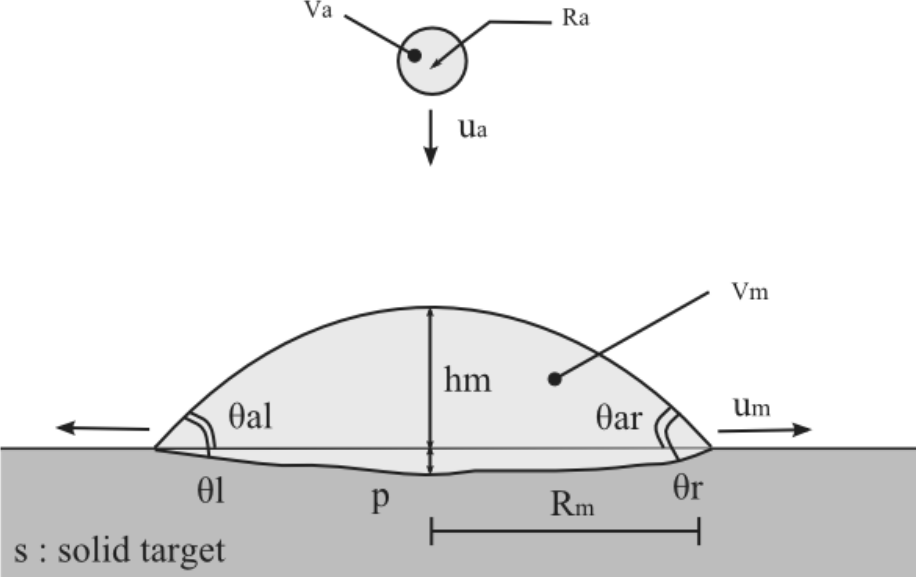
Profile schematics of welding objects in the GMAW process.
Metal transfer droplet
For the droplet or metal transfer drop, the geometrical parameter to be identified is the measured radius
Image processing
Image treatment are widely used in welding process to control weld pool 11 or to control metal transfer. 3 In this article, a different algorithm is described. The purpose is to have a single algorithm from raw images to geometrical characteristics of the different entities. The efficiency of the algorithms is dependent on the optical setup and image acquisition. Nevertheless, even if shadowgraphy technique is modified, the algorithm to detect and measure profile during welding is developed to be adaptable by only modifying some parameters. The algorithm is divided into the following four parts.
Image calibration in order to convert pixel to spatial coordinate or to apply some transformations.
Image treatment in order to reduce noise and detect profile by applying filters. The image treatment is generally organized as follows: (a) conversion to black and white; (b) blur smooth filter followed by a median smooth filter; (c) adaptive threshold only for the macro drop analysis followed by a canny filter.
Edge extraction in order to close contours.
Geometrical analysis to compute characteristics as area for example.
The last two points are adapted to the kind of analysis (macro drop or droplet).
Image calibration
As shown in section “Image acquisition setup,” the camera captures a shadow projection of the welding process. The recorded image is supposed to be a projection of the welding process orthogonal to the optical path. Therefore, no image projection correction is necessary. Only a scaling of the image dimension (in pixels) to the real object dimension (in millimeters) is needed. A snapshot of the scene with the wire in the CCD frame is done. The snapshot is done with the filters and the halogen lamp without welding. The diameter of the wire (1 mm) corresponds to 20 pixels in the image leading to the scaling coefficient
Image treatment
The idea is to extract the shapes of the macro drop and droplet from raw images. The most common approach is to segment the image, 3 which means to split the image into two fields: the macro drop and droplet in one color and the rest of the image in other. 12 Thanks to the optical method acquisition (shadowgraphy), the images are already segmented between light and shadow zones (see Figure 3(a)).
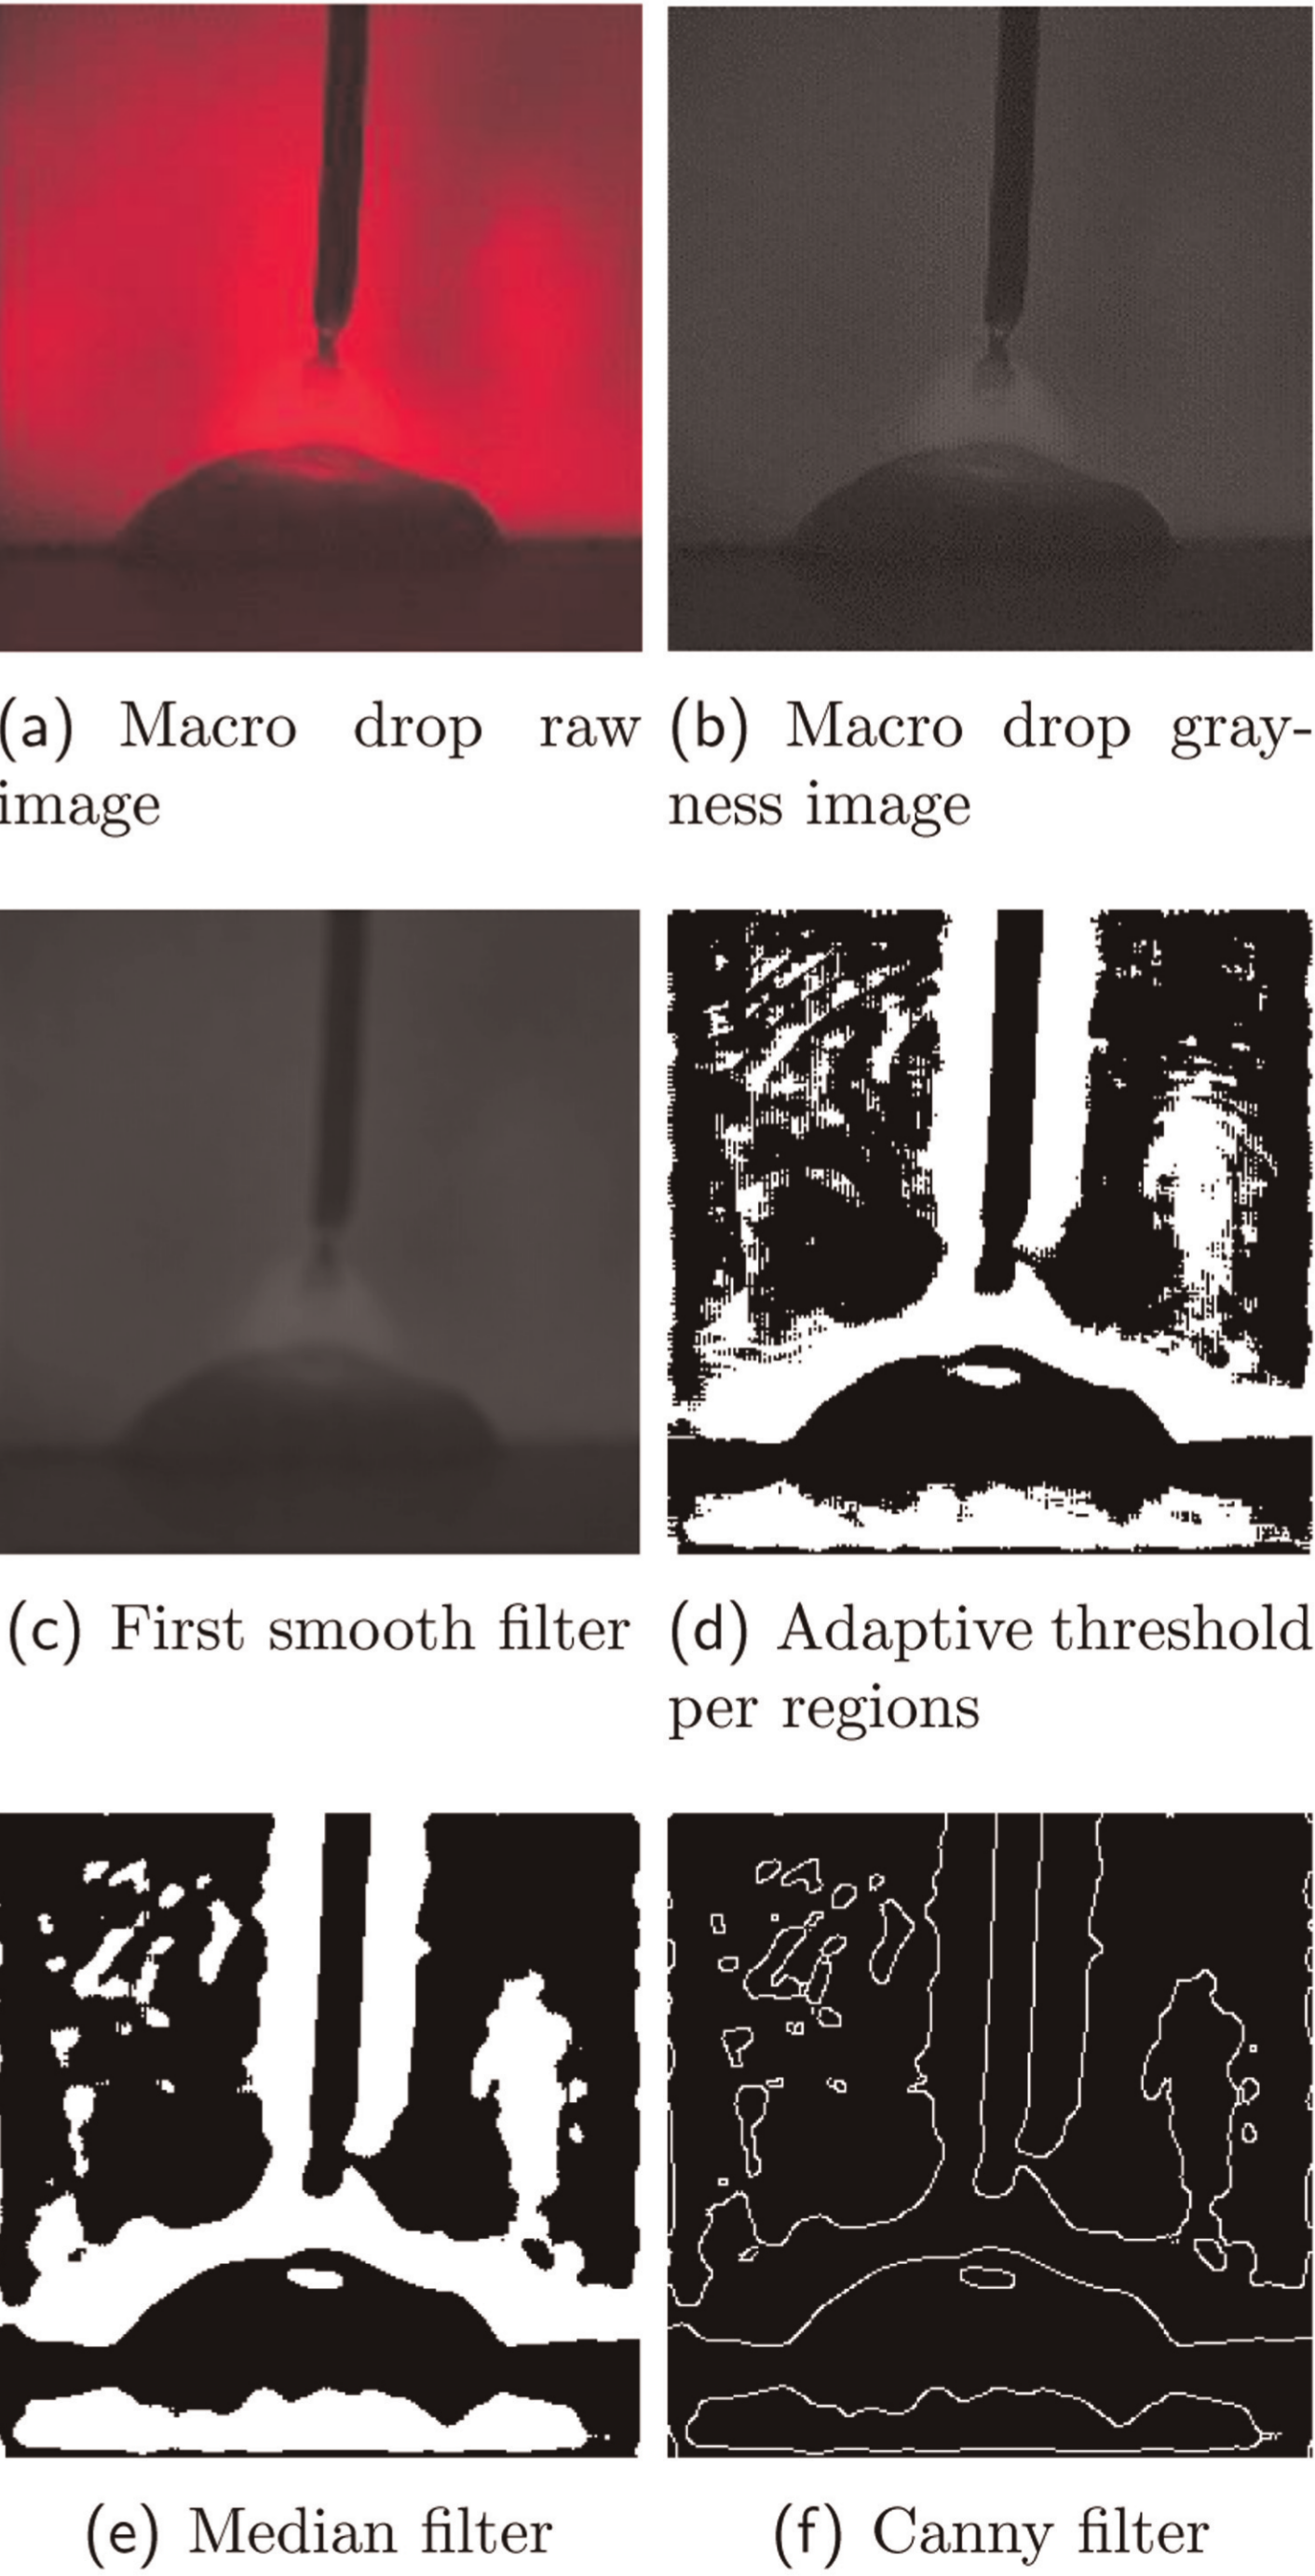
Step-by-step image treatment of PGMAW process: (a) macro drop raw image, (b) macro drop grayness image, (c) first smooth filter, (d) adaptive threshold per regions, (e) median filter and (f) canny filter.
However, objects within the image under the arc may differ only a few from the background intensity light level. In these areas, a contrast enhancement is necessary. Objects outside the arc, such as some regions of the macro drop profile, are clearly visible against the background. In these regions, a contrast enhancement can affect the image quality and thus lead to incorrect segmentation. 7 Therefore, the contrast enhancements, or threshold, have to be adapted per regions into the image.
Step 1. To simplify the contrast enhancement, the images are converted from RGB image color to gray-level image (see Figure 3(b)). To reduce the gray-level noise, a first smooth classical filter (blur) is applied over the image. The filter replaces the gray values of squares of 7 × 7 pixels by their average values (see Figure 3(c)). In consequence, the homogeneity quality is improved in the light and shadow regions, despite the edge contrast reduction induced between these regions.
Step 2. Then, an adaptive threshold can be used to enhance the difference between shadow elements and light zones. For the adaptive threshold, it is important to choose the correct size region where it will be applied. Small regions to threshold will generate isolated patterns (groups of pixels). The region chosen to threshold application is
Step 3. A second filter-type median is necessary to improve the previous threshold treatment. This filter computes the grayness median value over
Step 4. Finally, an impulse response filter to gray-level gradient (canny) is applied to extract the principal edges at the image. In a binary image, all edges are principal; therefore, canny detects all the edges at the image (see Figure 3(f)). Nevertheless, to guarantee a full detection of droplet and macro drop profile, the canny parameters are adjusted to maximum, which means maximum edge detection sensitivity.
The choice of the different parameters for the image treatment is done for each kind of experiment (macro drop and droplet). Once the parameters are set, they are valid for all the images for each experiment. The main parameter to be adapted is the size of the region to apply the filters (smooth and adaptive filters). The choice of these parameters can be rapid.
Edge extraction
Despite the performance achieved by the image treatment, canny filter generates many edges, or cords, in the image. These cords are composed of white pixels, interpreted by the algorithms as an individual point. In order to automate the edge extraction process, geometrical and graph algorithms are used to isolate the cords corresponding to macro drop profile and droplet edge section. The set of all white pixels after canny is denoted by W. The set is ordered with increasing x coordinate. The algorithms for macro drop and droplet are different. The purpose of the algorithm is to transform the set of point W to a linked list of points or a list of segments to represent a contour. The only parameter to be set is the α parameter in the alpha edge algorithm. It has to be set in function of the resolution of the image. In this work, it was chosen to 1.
Macro drop
For the macro drop profile, a user interaction algorithm is responsible for extracting the continuous cord (white pixels) corresponding to the profile into a list. Note that the macro drop and the substrate have the same continuous profile (see Figure 3(f)). The substrate shadow projection is always the same if the optical path does not change. Therefore, the users have to choose only one extreme of the cord corresponding to substrate profile (see Figure 4(a)).
Step 1. The first step is to detect the beginning of the cord. An empty list of white pixels C is initialized. The user gives a region of interest where the first point must be located, and an algorithm finds a point in this region and pushed it back to C.
Step 2. The algorithm finds all new white pixels in W inside small neighborhood of the last pixel in C and pushes them back to C. If there are several white pixels in the neighborhood, the algorithm chooses the one in the direction of the last white pixel in the profile list. The process is repeated with all white pixels until the other side of the image is reached. At the end of the algorithm, the ordered list C contains the profile.
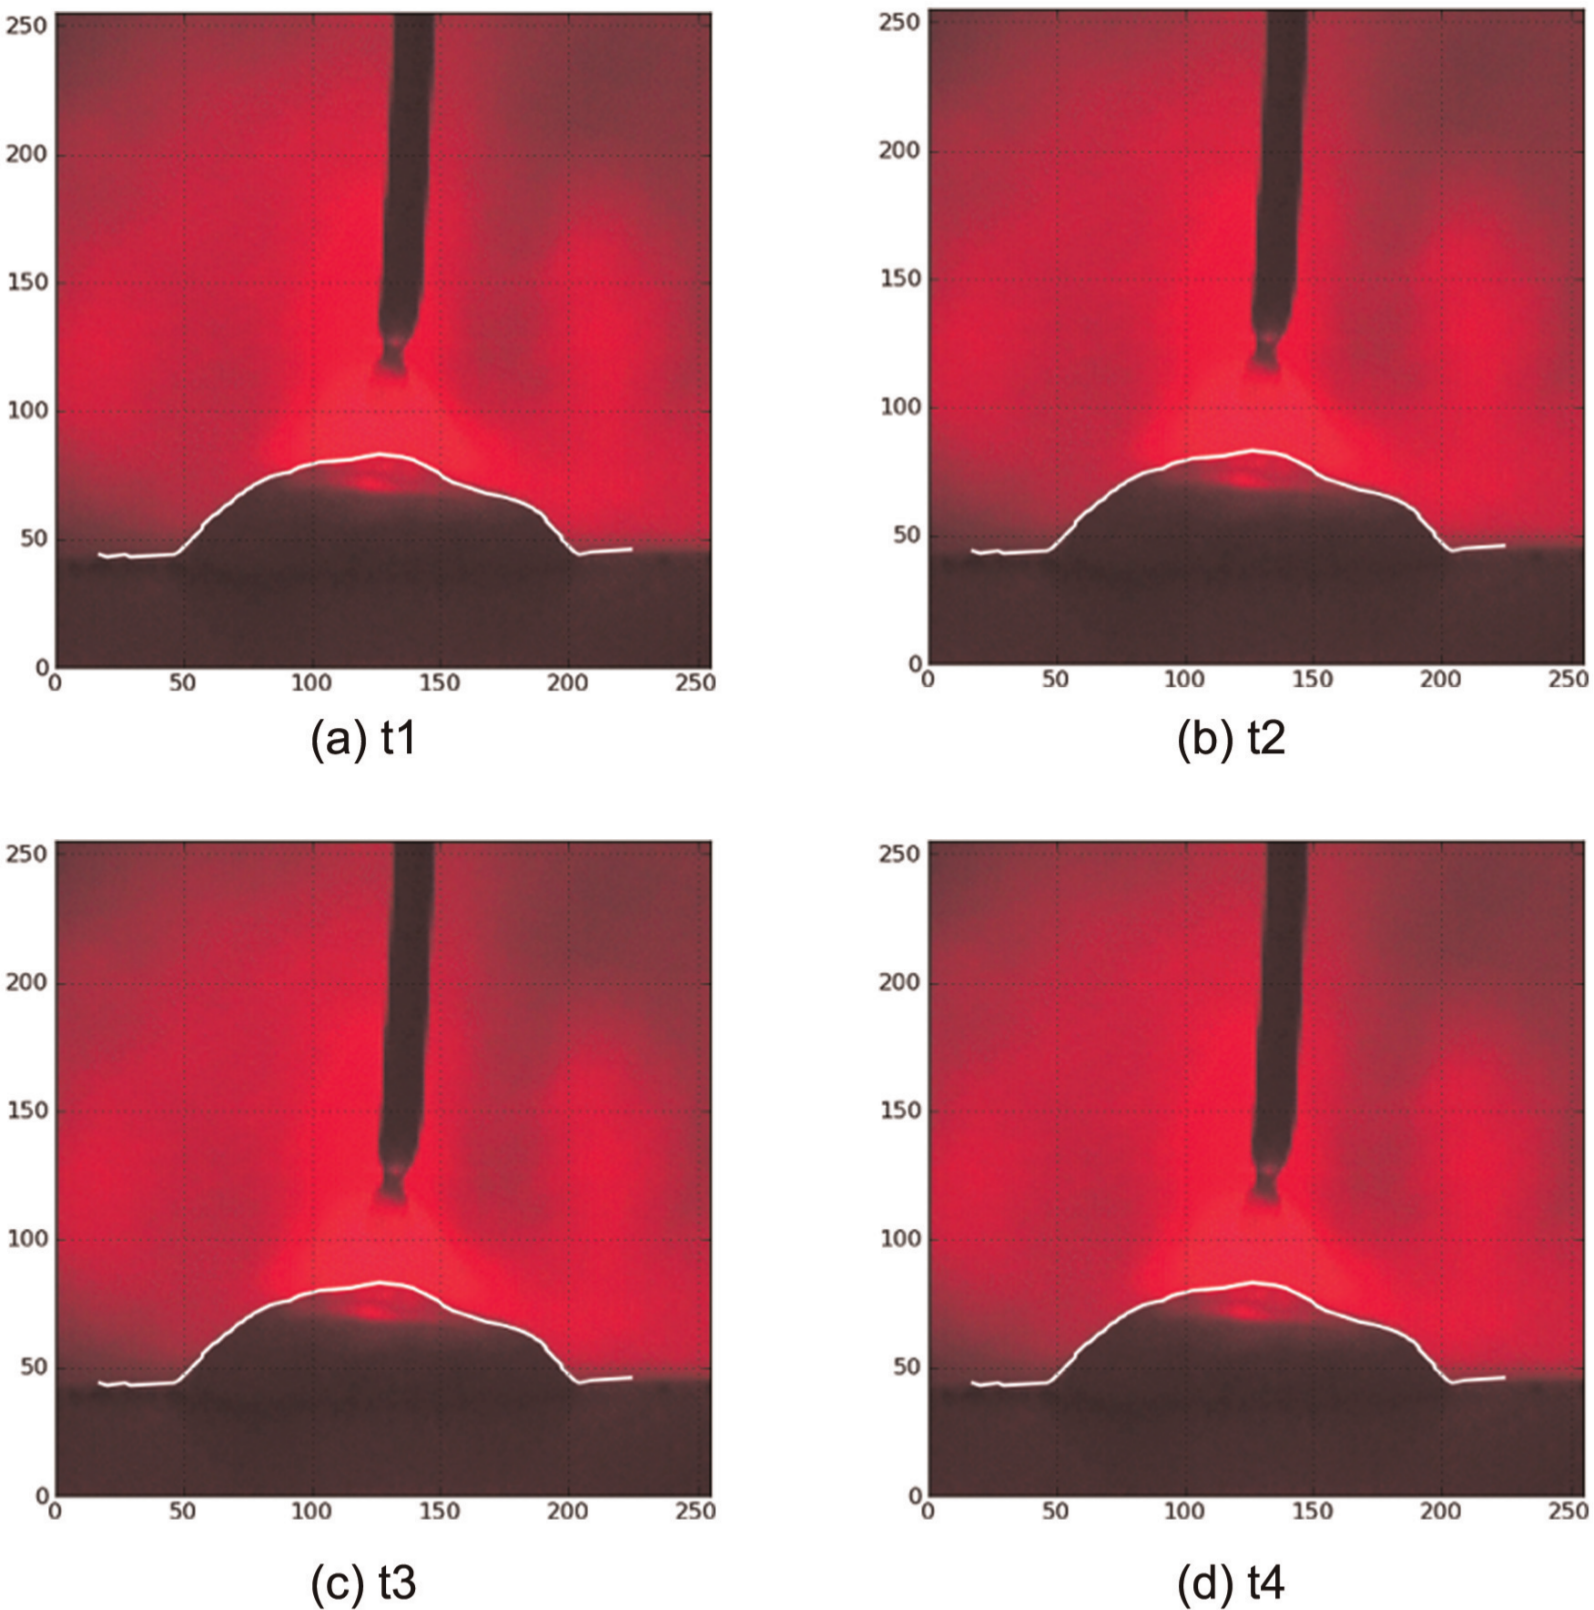
Images series of macro drop profiles: (a) t1, (b) t2, (c) t3 and (d) t4.
If the algorithm does not reach the other side of the image, the algorithm returns an empty list C. Empty list is the signal for bad treatment.
Droplet
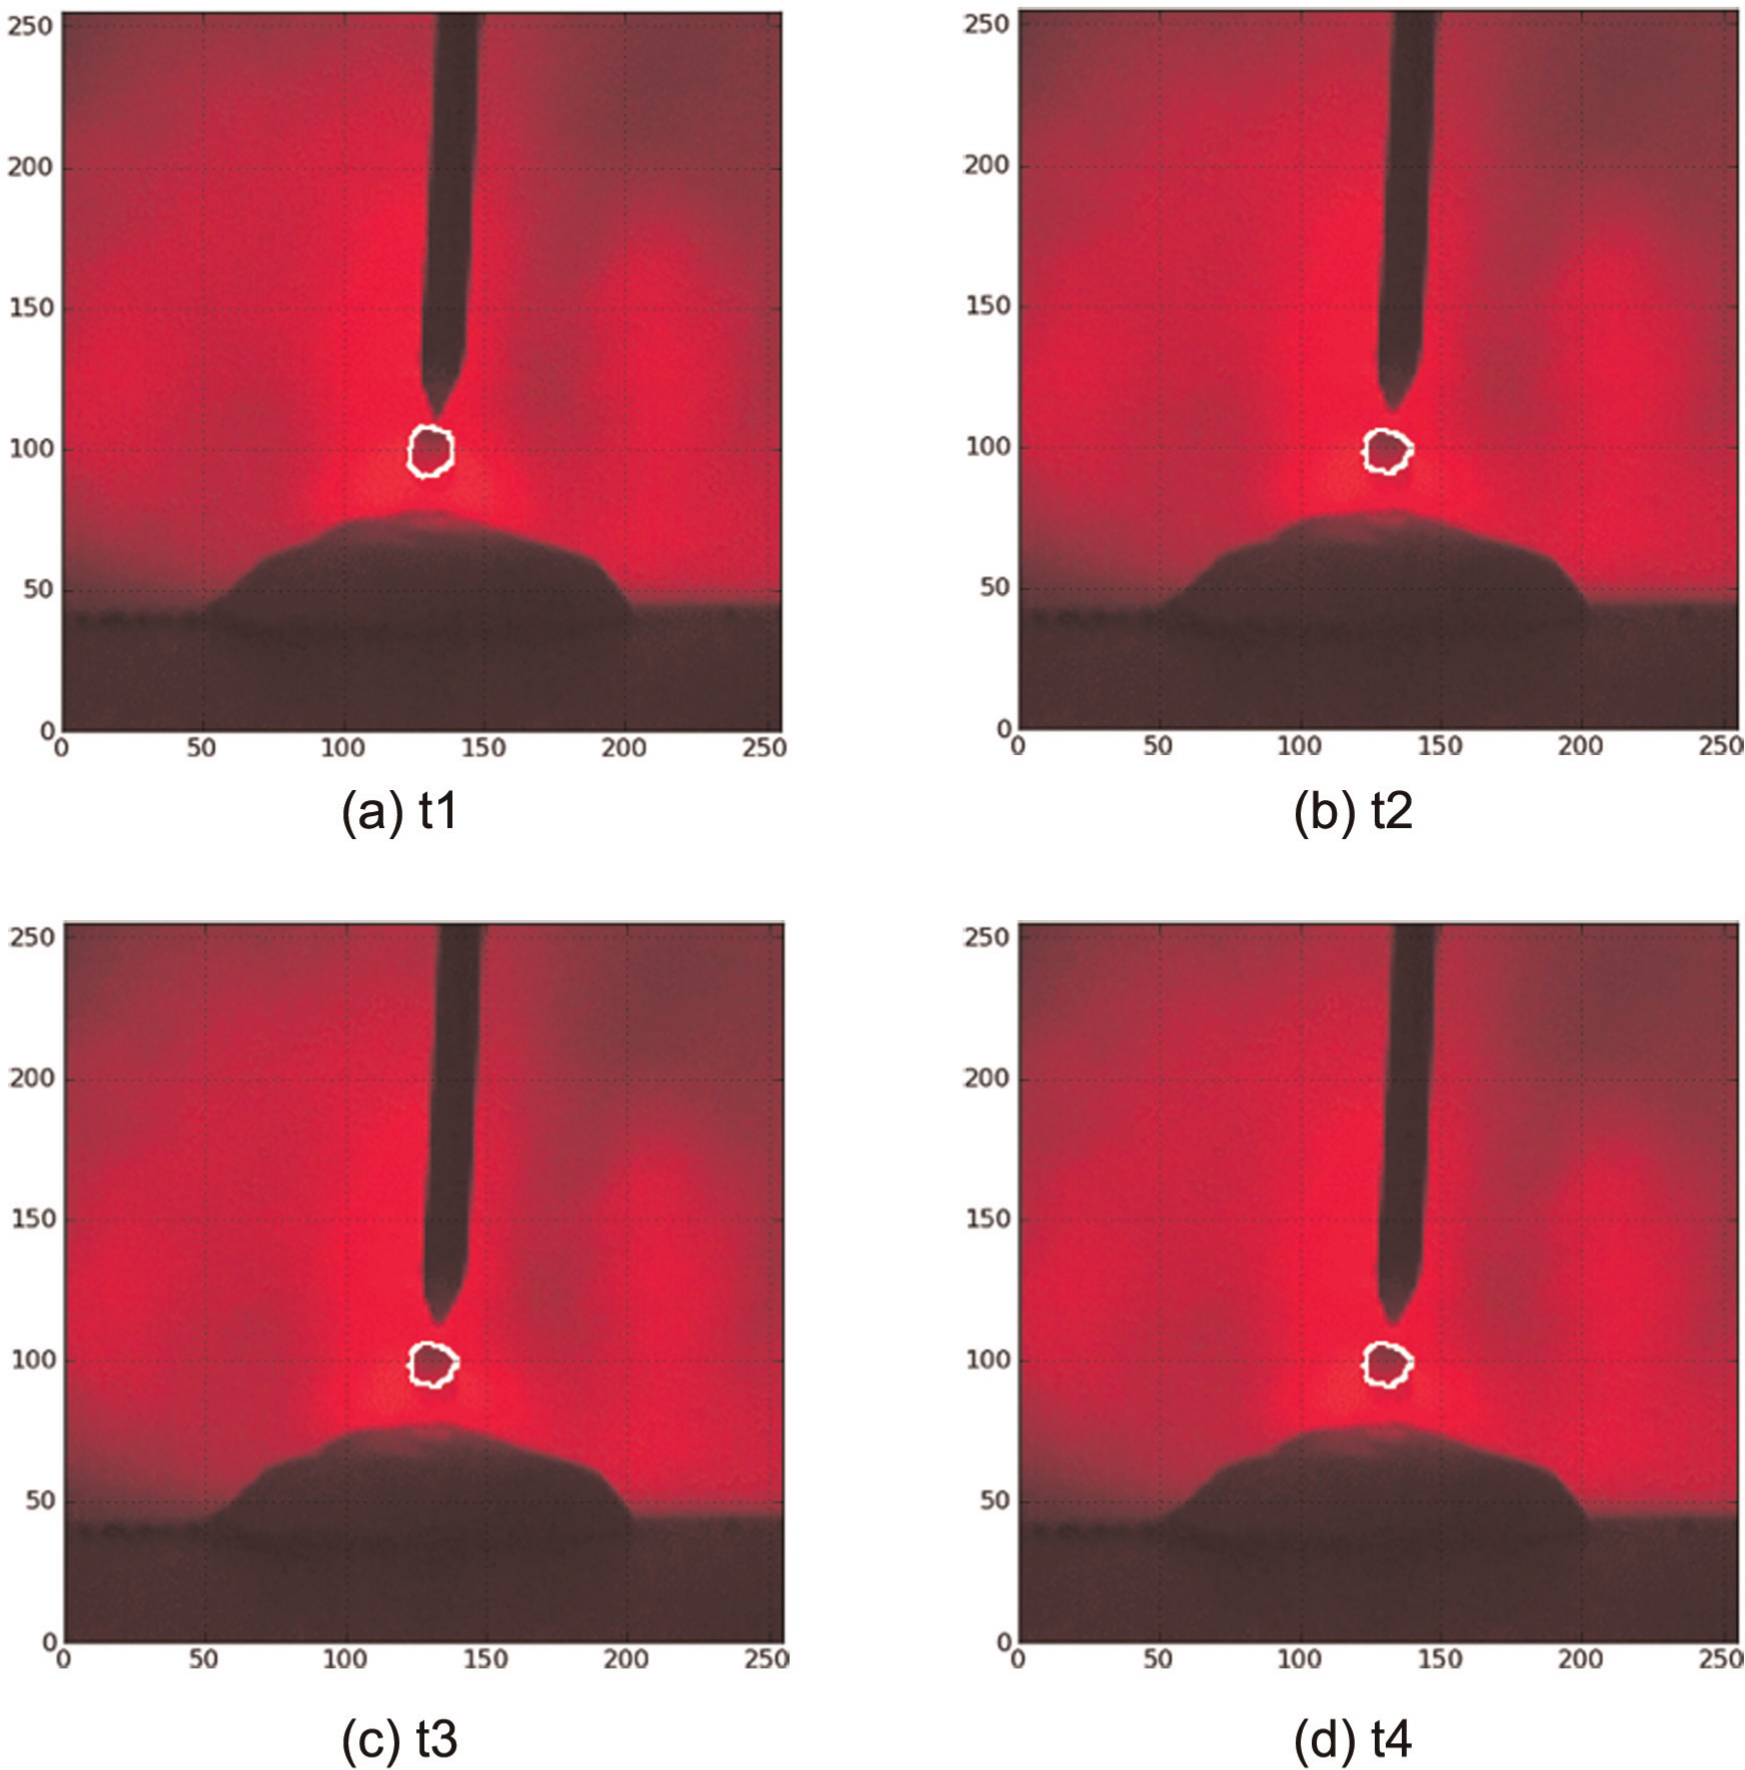
For the droplet edge section, the white point cord defines the surface of the droplet. Note in Figure 5(a) that the biggest closer cord corresponds to the droplet section. The idea is to build segments around the cords and take the longest closer segment.
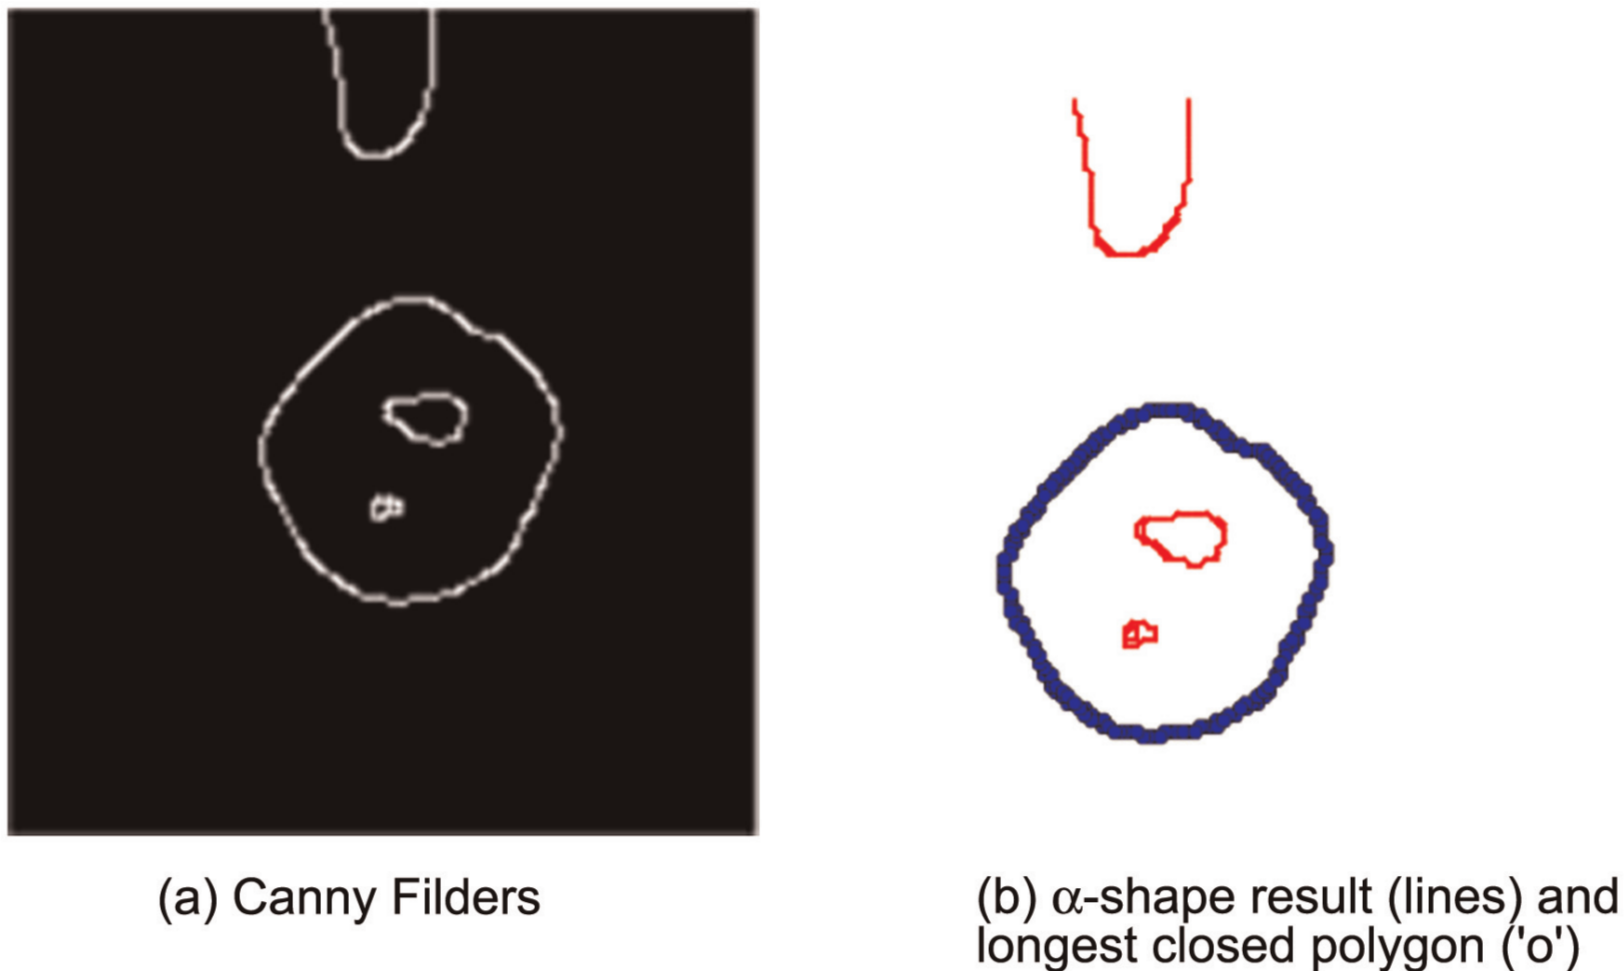
Results after the canny and alpha-shape procedure combined with the procedure of the longest closed polygon: (a) canny filters and (b) alpha-shape result (lines) and longest closed polygon (‘o’).
Step 1. To chain points of W, an alpha-shape algorithm 13 is used. All the points in W are inserted in the alpha shape that is defined with a parameter α. The alpha-shape procedure builds a triangulation, and the segments with a distance lower than α are tagged.
Step 2. The last procedure tagged too many segments. A graph algorithm connects all the tagged segments and finds the longest closed polygon. The longest closed polygon corresponds to the metal transfer drop profile (see Figures 5 and 6). At the end of the algorithm, the final set of segments corresponds to the droplet. If the polygon is not closed, which means each vertex has not got two segments attached, the return polygon is set empty.
Images series of drop profiles: (a) t1, (b) t2, (c) t3 and (d) t4.
Geometrical analysis
Some of the geometrical analysis computations are directly in the library in order to allow low computation time cost and to be used for monitoring.
Macro drop
After previous analysis, a chained list of points is obtained. Now it is possible to determine the geometrical parameters shown in Figure 2. To compute the wetting angle measure, linear regressions are taken from the extreme points of the processed macro drop extracted profiles. A loop algorithm applies this method to all frames to compute the wetting angles. Same procedure is used to estimate the macro drop radius and volume. 9
Droplets
The metal transfer droplet is approximate and closed with a combination of alpha-shape and graph algorithm as outlined in the previous section. For the droplet, the external surface and the speed are calculated. The speed is computed with the successive computation of the position of the centroid. The easiest way to compute it is to go through the volume (here the surface) and then to build the triangulation. From the triangulation, the triangles are then used to compute the surface and the position of the centroid. It is assumed that there is a kind of axisymmetry and a homogeneous density inside the droplet. With the triangles, the principal axis could also be computed.
Results
In this part, some results, performance and reliability of the algorithm for a set of experiments are shown. The basic experiment is a static PGMAW. A macro drop is fed by droplets that are assumed to drop vertically and then impinge the macro drop. The macro drop grows with a geometry that depends on the effects of gravity, surface tension, heat transfer and so on. 14
To improve weld pool stability in pulsed GMAW, the growth of the droplet is investigated. To improve weld quality, the transfer during some pulses is analyzed.
The algorithms are tested on an Intel i7 processor at the clock speed of 1.87 GHz. The analyzed images were extracted from high-speed camera film after the experiment.
Macro drop growth investigation
The influence of shielding gas on the macro drop behavior is investigated through:
the speed of growth of the macro drop radius;
the angle between the substrate and the liquid.
The first is an indicator of the ease of growth of the macro drop due to heat transfer and surface tension, and the second item gives information on the capillary mechanism involved in the macro drop.
The shielding gas has a great effect between the liquid and the gas interface. Gas could diffuse in the first layer of the liquid and greatly modify the physical properties. The surface tension is the main physical property that will be modified. A difference in surface tension will modify the shape of the interface by modifying its equilibrium. The gas will probably also modify the energy transfer in the arc.
To study the influence of the shielding gas on the shape of the gas–liquid interface, images must be selected in cold regime of the plasma in the pulse. Thanks to the synchronization between images and electrical signals, images are selected at the end of the period when the macro drop is almost stabilized. Once the images are selected, the algorithm described in section “Image treatment” is used. The treatment of each image lasts around 5 ms. All the images were correctly treated by the algorithm, and there is no loss of profile detection.
Base and angle evolution
Some profile detections of the macro drop are shown in Figure 4. The developed algorithm manages to detect profile under the arc. To isolate only macro drop profile, a threshold relative to the base material is used to extract the macro drop profile. The result is shown in Figure 7. Then, base radius
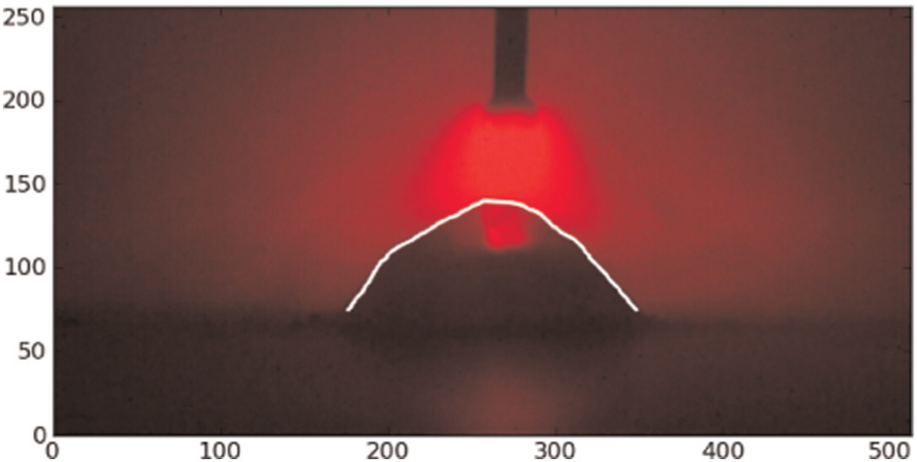
Profile of macro drop for G1 gas after 2 s of welding.
First, the evolution of
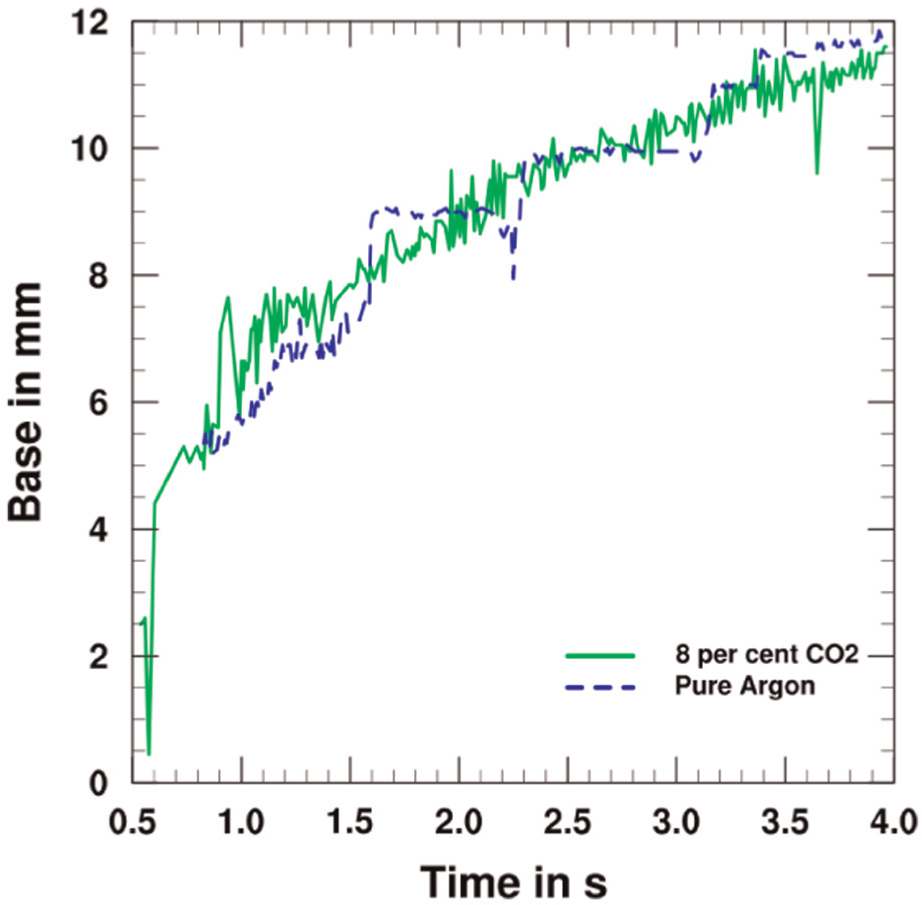
Macro drop growth (basis) in function of welding time.
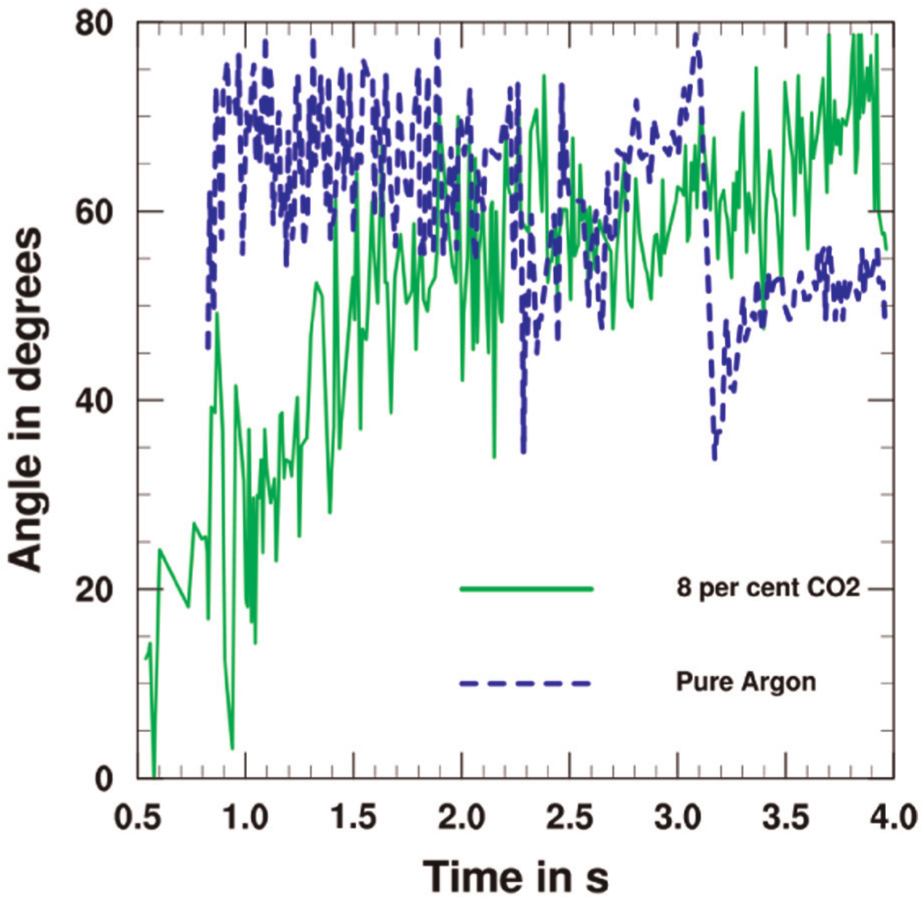
The other geometrical entity is the angle of the macro drop surface on the substrate, known as the wetting angle. To approximate it, a simple linear regression is performed for the first and last points of the profile. The results are shown in Figure 9 for the left angle and the two gases.
Macro drop left angle as a function of welding time.
The evolution curves of the wetting angle are also noisy. Investigation of the videos shows that the macro drop oscillates during welding. Macro drop oscillations induced wetting angle oscillations. Depending on the main oscillations during a period, the local angle oscillation is more or less important. For pure argon gas, the equilibrium angle (60°) is rapidly reached and stays constant all along the welding. For the 8% of CO2 gas, the angle increases until reaching a constant value of 70°.
Discussions
The noise in the measure for the base
The growth of the macro drop is a balance mainly between the energy balance and the mechanical equilibrium of the membrane. The shape of the macro drop is an important information for the equilibrium of the interface. For example, the macro drop made with pure argon grows step by step, denoting an instability of the interface (see Figure 8).
The modification of gas not only influences the surface tension but also modifies the energy transfer from the plasma to the workpiece. Even with same welding parameters, the difference of gas will modify the current lines distribution but also the arc length. Nevertheless, the evolution of the base
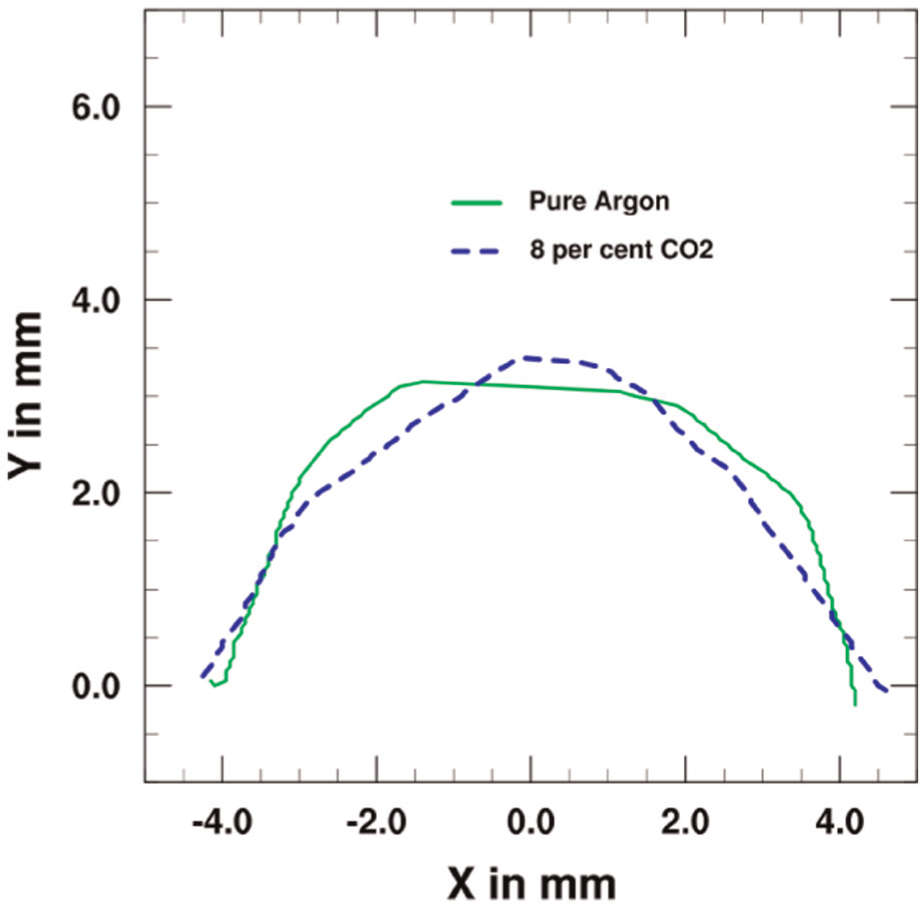
Shape of the macro drop at 2 s for the two gases.
The errors of the detection with the algorithm are hard to estimate due to the harsh environment. Nevertheless, changes in parameters (smooth filters, adaptive threshold) can modify the result. If adaptive threshold can hardly be changed, smooth filters can be changed. If the size of the smooth filter is decreased to
This investigation demonstrates the interest of this kind of analysis for understanding of the phenomenon involved in welding. It is interesting information for validation or comparison with numerical computation.
Droplet flight
Investigation of droplet flight is of interest for weld quality and the metal deposition process. The determination of the motion and the impact point is then a good indicator of the quality of the process. The droplet flight is only investigated for the 8% of CO2 for a pulse of 113 Hz. The treatment of each image takes between 5 and 45 ms with geometrical algorithm (triangulation) and output (surface computation and position of the center of mass), within the python interpreter. There is around 10% of bad image treatment due to some noise induced by welding. For these images, it was almost impossible to detect any profile.
Trajectories and droplet velocities
During one pulse, the droplet is detected. The shapes are shown in Figure 11.
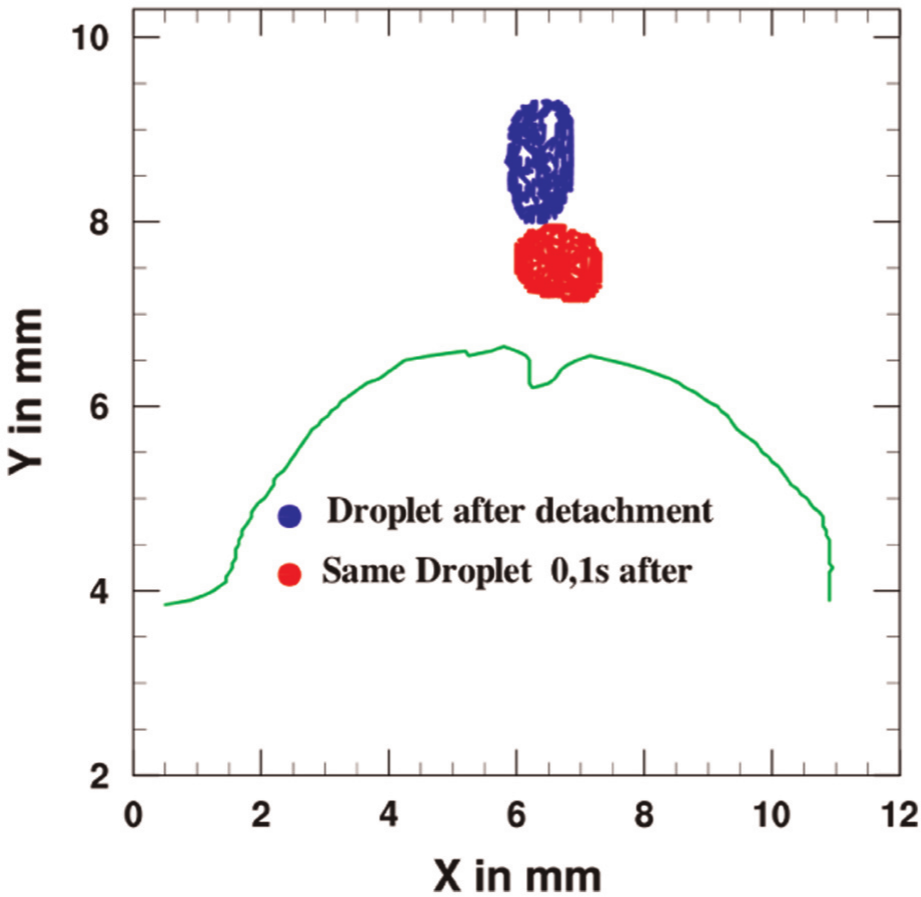
One droplet at two different times during the free flight in the same pulse.
The shape of the droplet changes during the free flight denoting oscillations of the droplet. Once the points of the contour of the droplet are detected, the center of mass is extracted as well as the principal axis. The center of mass is drawn during several pulses, as shown in Figure 12.
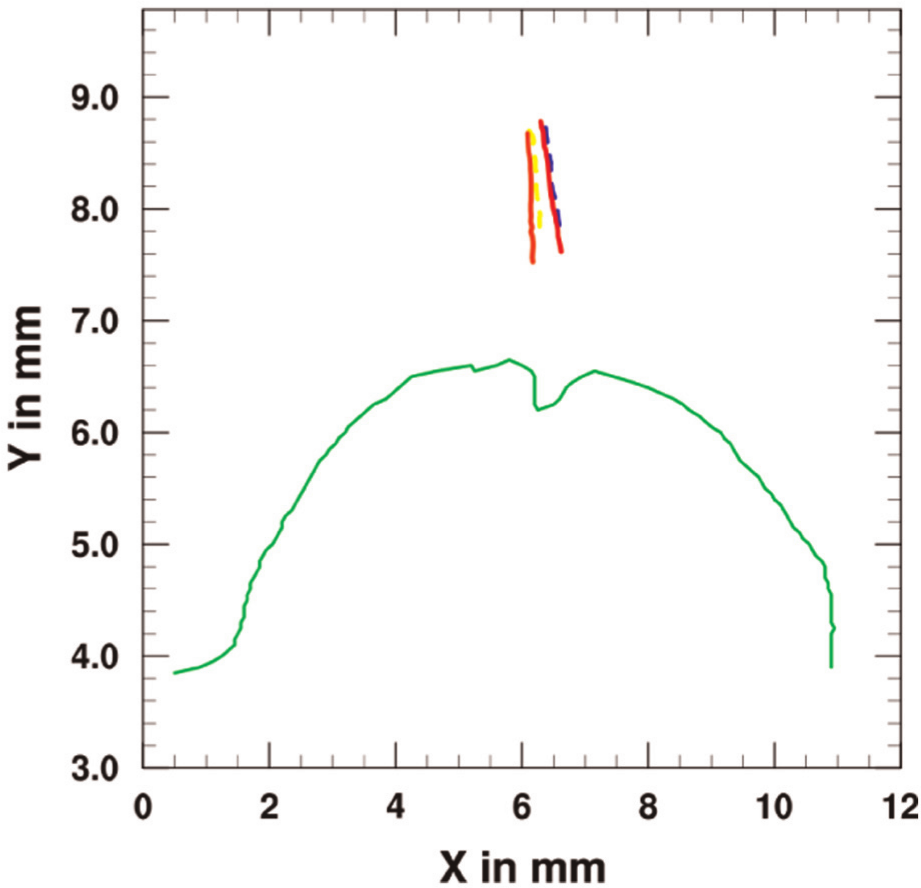
Locations of the center of mass of the droplet for four different pulses.
The motions of the center of mass are almost linear and repetitive for the different transfers. The trajectories show that the motion is aligned more or less with the vertical axis. The position relative to the vertical axis can then be drawn for the four free flight of droplets (Figure 13).
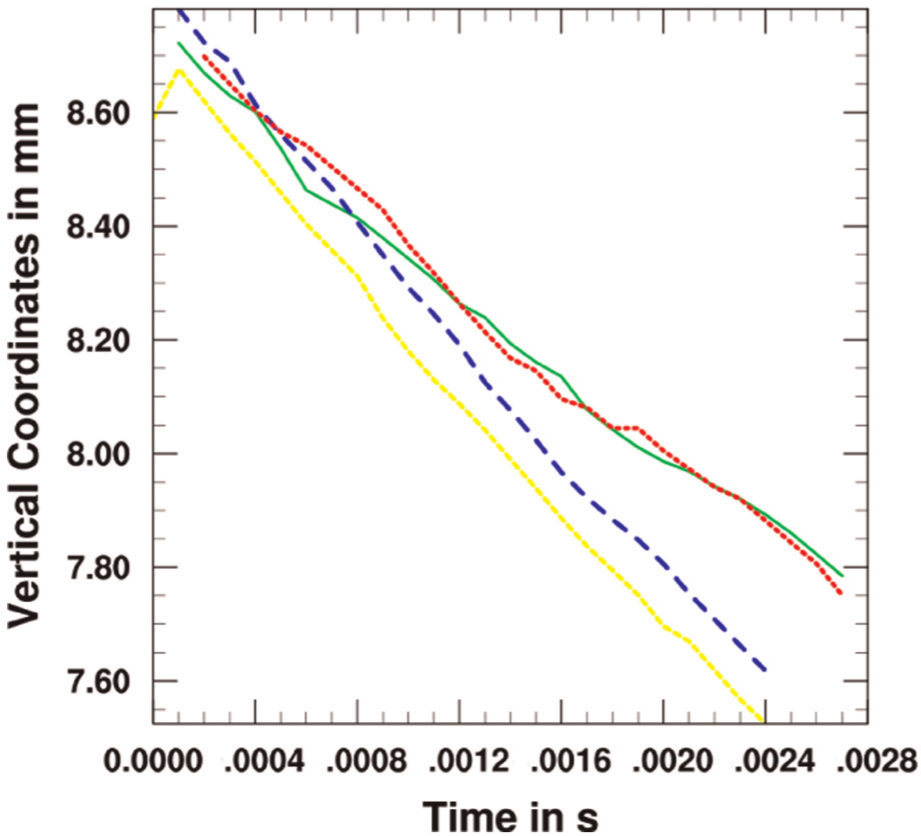
Vertical position of the center of mass of the droplet versus times. Velocities can be considered constant.
The position of the center of mass of the droplet relative to the vertical axis shows that the droplet has a constant speed. The speed is estimated between 350 and 500 mm/s depending on the pulse, and the free flight of the droplet lasts around 3 ms.
Discussions
The oscillations of the droplet give information on the competition between surface tension and gravity. 15 For the welding conditions of the experiment, the trajectories of the different pulse indicate that the forces acting on the droplet are in equilibrium or are negligible in respect to the size of the droplet.
Despite the 2D analysis, the result gives important information for simulation of the metal transfer process. If the droplet is assumed to be a sphere, the kinetic energy of the droplet just before the impact could be estimated. For our case, the radius of the droplet is estimated at 0.56 mm.
Even if the four trajectories are similar, some discrepancies could be outlined. The short time for the analysis let new perspectives for the algorithm for monitoring of the metal transfer. If a domain for good transfer from the tip of the electrode to the border of the weld pool is defined, droplet going out of this domain can be detected.
Conclusions
The collection of different libraries to identify profiles during noisy environment of welding process was successfully applied in the static PGMAW. The different algorithms developed allow us to detect PGMAW weld pool as well as metal transfer automatically once the region of interest in the camera frame is set. These could be very helpful for the investigation of dynamic behavior of the weld pool or for the real-time monitoring of the transfer.
From the measurement point of view, the coupling between image treatment, graph theory and computational geometry to identify profile during image treatment gives excellent results. This strategy enters the multiply and conquer concepts to find the right tool when necessary. The different algorithms are robust, with less than 10% of bad profile detection. The quality of the detection is also proved all along the “Results” section. The quick treatment of images foresees new perspectives for analyzing transient phenomenon in welding, which is one of the major challenges for quality enhancement.
The algorithm for droplet detection can be directly used with the same optical settings for real process when there is a relative motion between the wire and the weld pool. In this case, the macro drop is useless but could be used to appreciate the back arc profile of the weld pool.
Footnotes
Appendix 1
Funding
This study was supported by the Agence National pour la Recherche (ANR) that grants this research under the ANR-JCJC038 young scientist contract.