
Abstract
Limit dome height test is commonly used for evaluating the formability of sheet material. Through altering the geometry of specimens, different strain paths could be obtained to establish forming limit diagram of the material. By incorporating finite element analysis with ductile energy criteria, engineers can also predict the formability of material. The forming limit diagram or constants in ductile energy criteria are usually determined by experiments with linear strain path. However, the predictions may lose their accuracy when evaluating products with complex strain paths, which is commonly seen in sheet forming processes. Therefore, a better method for evaluating formability of material under complex strain path should be developed. In this study, novel specimen designs for limit dome height test are applied to generate different strain paths with two-step strain effect on the specimens. Different geometric parameters of the novel specimen design can alter the slope of strain paths and create different strain paths similar to the two-step deformation conditions occurred in actual sheet forming processes. Three different two-step strain path conditions are created experimentally, and the changes in strain path are verified with simulations. From the results, the predictions of forming limit based on linear strain path forming limit diagram could be overestimated or underestimated under two-step strain path conditions. Thus, the formability of material under two-step strain path conditions can be determined by corresponding experiments using novel specimen designs, instead of predictions made by linear strain path conditions.
Introduction
Sheet metal forming process is widely used in the automotive industry. For example, hood and body side outer panels are formed by this process. However, the engineers need to know the formability of the selected sheet metals before product engineers conduct product designs and feasibility study. The information is also necessary for finite element (FE) simulation and draw die development, die design and die tryout and fabrication, and so on. Incorporating FE simulations with product or process design enables the engineers to find an optimized solution for product or process design.1,2 The knowledge of formability of materials plays an important role in searching for the optimized design. For understanding the formability of sheet metals, limit dome height (LDH) tests are often used. The LDH test was originally proposed by Hecker, 3 indicating that the relations between dome height on the specimen and the load could be used for representing the formability of material. Originally, engineers only used the load–height relation obtained from LDH tests to describe the formability of tested sheet metal. But as the capability of FE simulation technology improved with time, people started to analyze the stress and strain states of LDH tests for more information. Knibloe and Wagoner 4 tried to use a rigid–viscoplastic FE model to analyze the strain distribution on LDH specimens under different test conditions. Their results showed that friction coefficient is important to the strain distribution on the specimen. They performed different simulations with different friction coefficient settings and then compared the experimental measured strain value at the pole position with simulation results. When the best match was found, the friction coefficient for simulation can be determined. The same methodology of the determination of friction coefficient for simulation settings is adopted in this article.
The American Society for Testing and Material (ASTM) standard 5 is widely used in industry for obtaining forming limit curve (FLC) of the sheet metals by conducting LDH tests. To establish a complete FLC, at least three different strain conditions must be created from the LDH test specimens, namely, tension–compression state, plane strain state, and biaxial tension state. The LDH test specimens designed by Nakazima et al. 6 could achieve this goal. Nakazima’s specimens were composed of sheet metal strips with different widths. The strain states on the specimens could be altered by controlling the ratio of strip width to punch tip diameter. However, fracture sites of the deformed specimens obtained from Nakazima’s design were not always at the center. Fracture near the clamping area could be found on some specimens. 7 In 1973, Hasek 8 modified the specimen design by introducing curved sides with different radii rather than straight edges. The fracture sites of the specimens were closer to the center of the dome top due to the curved sides. Therefore, Hasek’s specimen design concept would be adopted in this study for establishing FLC of material under linear strain paths.
Traditionally, circular or square grids are etched on the LDH specimens for measuring strain data. The accuracy of FLC is in relation to strain measurement method. What happened most is that the deformed grids near fracture site are hard to be recognized, so the FLC obtained is not accurate. With the help of digital camera and image processing techniques, engineers are capable of measuring strain data near fracture site with better accuracy. In recent years, optical strain measurement technique based on digital image correlation theory is widely adopted.9,10 It is proved that the optical strain measurement technique can be adopted not only in two-dimensional (2D) strain measurement 9 but also in three-dimensional (3D) strain measurement. 10 Considering the convenience of recording images, strain measurement in this article was accomplished with digital camera and image processing technique, instead of equipping optical measurement device on the testing machine.
Another important fact is that the strain paths in original LDH tests were all linear, and the prestrain effects were not considered when establishing FLC by the original LDH test method. Jain et al. 11 completed a series of tests on AA5754-O with the specimens first underwent LDH test and then deformed with reverse dome stretching. It is believed that the FLC of two-step forming limit diagram (FLD) should be different from linear strain path FLD. Prestraining in biaxial tension shifts the linear strain path FLD to the first quadrant of the diagram. The differences between these two curves could be the reason why the predictions made by linear strain path FLD may lose their accuracy under complex strain path conditions. Similar tendencies of the shifting effect from biaxial tension prestrains were also shown in other studies.12,13 In these studies, experiments with prestrains on the specimens were utilized to improve the accuracy of formability evaluation. The specimens should be unloaded from the testing machine after the prestrain state was applied and then reloaded for latter experiments. However, the positioning error and/or the Bauschinger effect could affect the accuracy of results through this forming sequence.
To eliminate these possible problems, it is important to study the scheme for creating complex strain path without unloading the specimens. A previous study of the author’s research team 14 was to develop a formability test for electromagnetic forming process under high strain rates. A set of novel specimen geometries was designed for the tests. The novel specimen design contained two holes on the central area, which could limit the material flow during deformation. The specimen was driven by electromagnetic forces and flied toward the punch on top of it. The strain paths had turning points almost at the same strain value, which can be regarded as two-step strain path conditions. In this study, same specimen design concepts were applied on LDH test specimens for creating two-step strain path conditions without unloading and reloading the specimens. However, the specimens of this study were designed with different clamping conditions and punch sizes for creating different constraints on the material flow of the specimen. Different clamping conditions and punch sizes might have strong influences on the strain path of deformed specimen. For example, Tabri et al. 15 applied six different designs on thick plate specimens for LDH tests. Among the six specimen designs, two of them were designed with circular notches on the specimen. The position of the hole was on the edge of the specimen, and the distance between the holes was much larger than the punch size. Different constraints from the specimen geometry and clamping condition might alter the strain path of the deformed specimen. However, these specimen designs were not intended for creating two-step strain paths. Therefore, a scheme that can create two-step strain paths with the LDH test apparatus under quasi-static strain rate should be studied.
In this article, novel specimen designs are applied on LDH tests for creating two-step strain paths. How to alter and control the strain paths by the geometric parameters will be studied. The forming limits will also be predicted for two-step strain paths with the proposed specimen design. Simulations are conducted to verify whether strain paths on different specimens can be altered and controlled as expected. The predicted forming limits can be used in product or process designs with similar strain path conditions.
Experimental setup
The LDH tests were carried out on a 100-ton hydraulic press with a set of dies. The layout of the apparatus is shown in Figure 1. The die cavity can hold specimens up to 90 mm in diameter. According to the handbook, 16 the blank holding force for specimens with this size should be 10 kN. The blank holding force on this die design is controlled by at most six springs in the bottom part. The springs are adjustable and changeable, so the clamping force can be controlled by selecting and adjusting the spring and displacement, respectively. The specimens were prepared through wire-cut electric discharge machining (EDM), and some tensile specimens were also prepared from the same batch of material. Two different friction conditions used for the LDH tests were as follows: (1) no lubricant and (2) with dry film polytetrafluoroethylene (PTFE). Detailed experimental conditions are listed in Table 1.
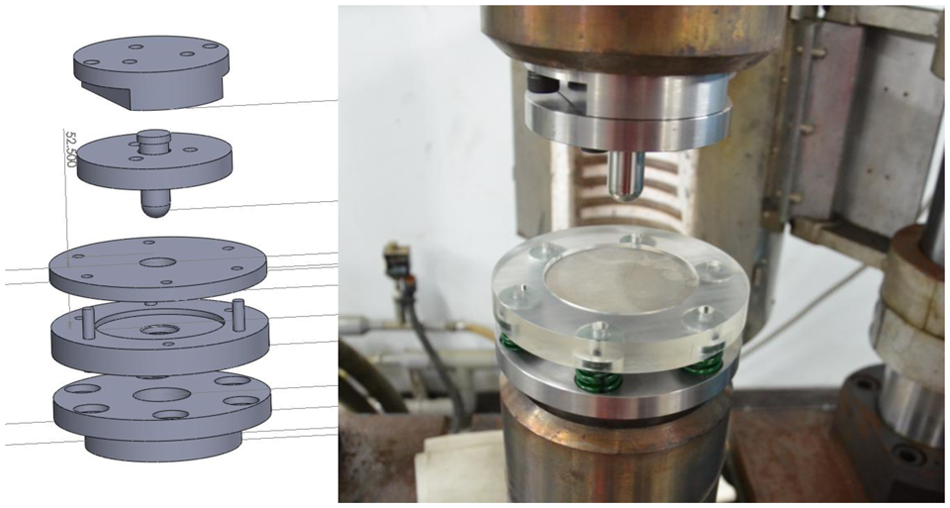
Components of die set for LDH test.
Experimental condition of LDH tests.
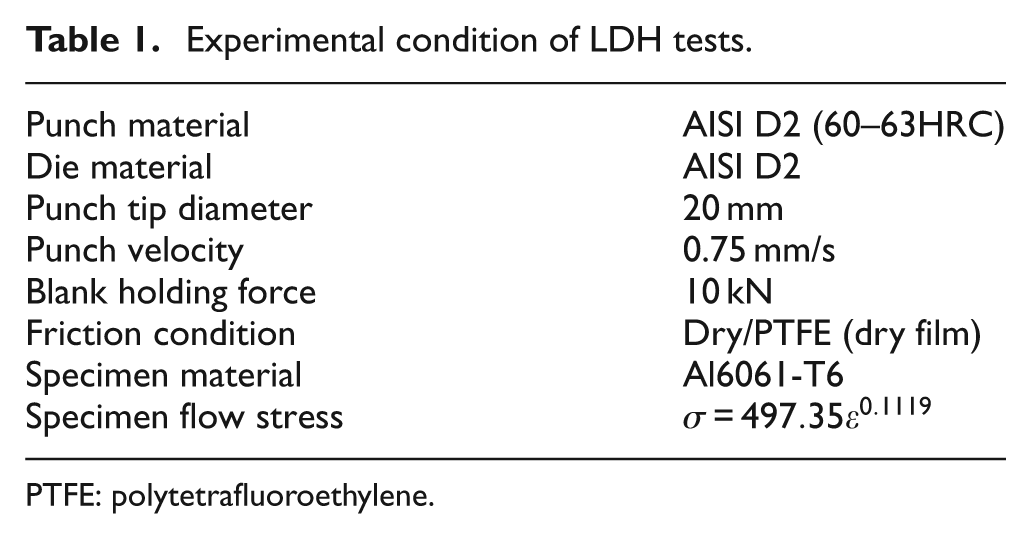
PTFE: polytetrafluoroethylene.
The linear FLC of material in this study was established by the apparatus mentioned above. To obtain fracture strain data within the full strain range, specimens modified from Hasek’s design concept 8 was adopted. Hasek’s design concept was to apply curve sides with different radii on round specimens. The main purpose of applying the curve sides was to alter the specimen width at the central portion. According to our experience, when the width becomes half of the punch tip diameter, the specimen would deform under tension–compression state. When the width is equal to the punch tip diameter, the specimen deforms under plane strain state. To obtain fracture strain under biaxial tension state, the width of specimen should be twice as large as the punch tip diameter. In this study, the geometries of specimen were determined according to this empirical rule. The contours of the specimens are shown in Figure 2, and their dimensions are listed in Table 2.
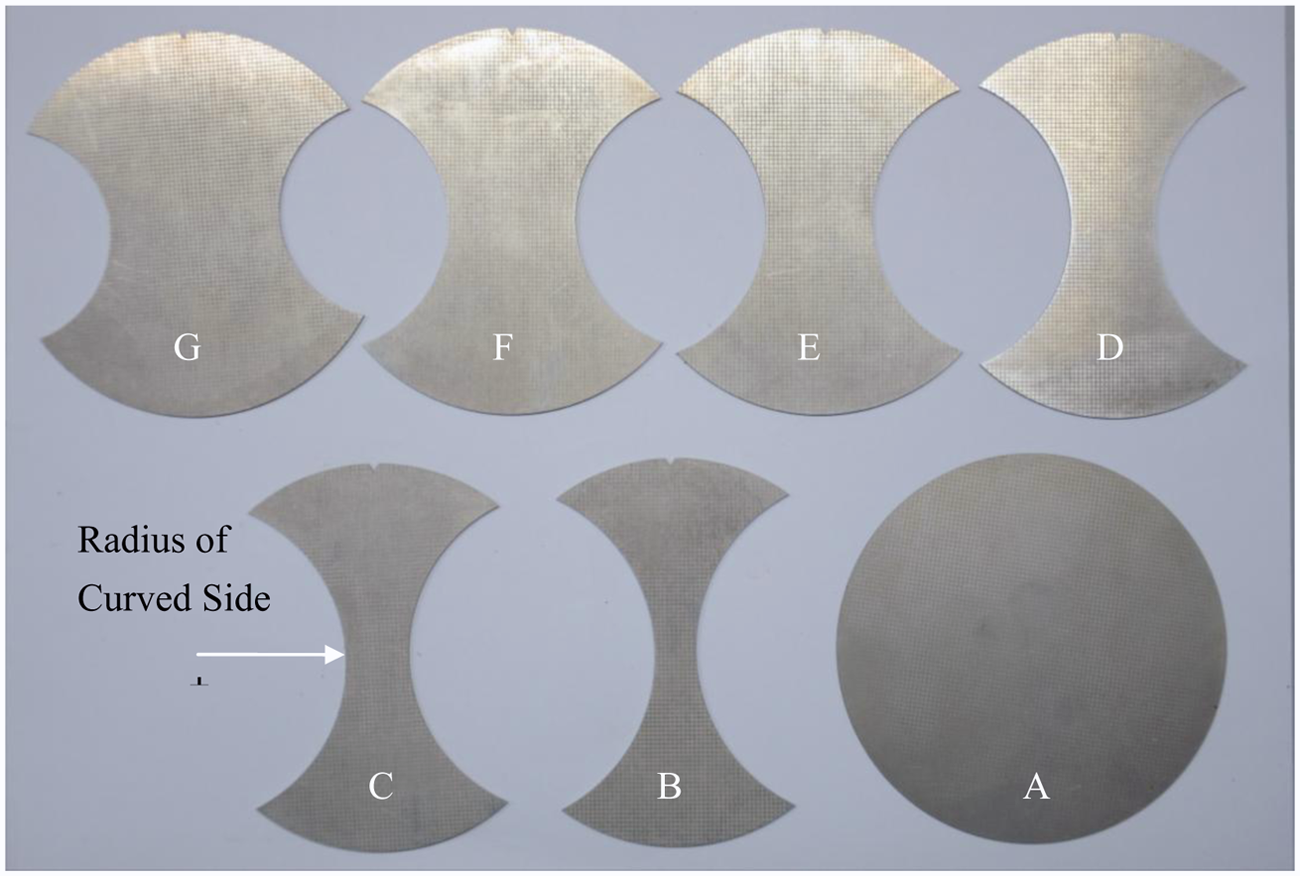
Geometries of linear strain path specimens.
Dimensions of LDH test specimens.
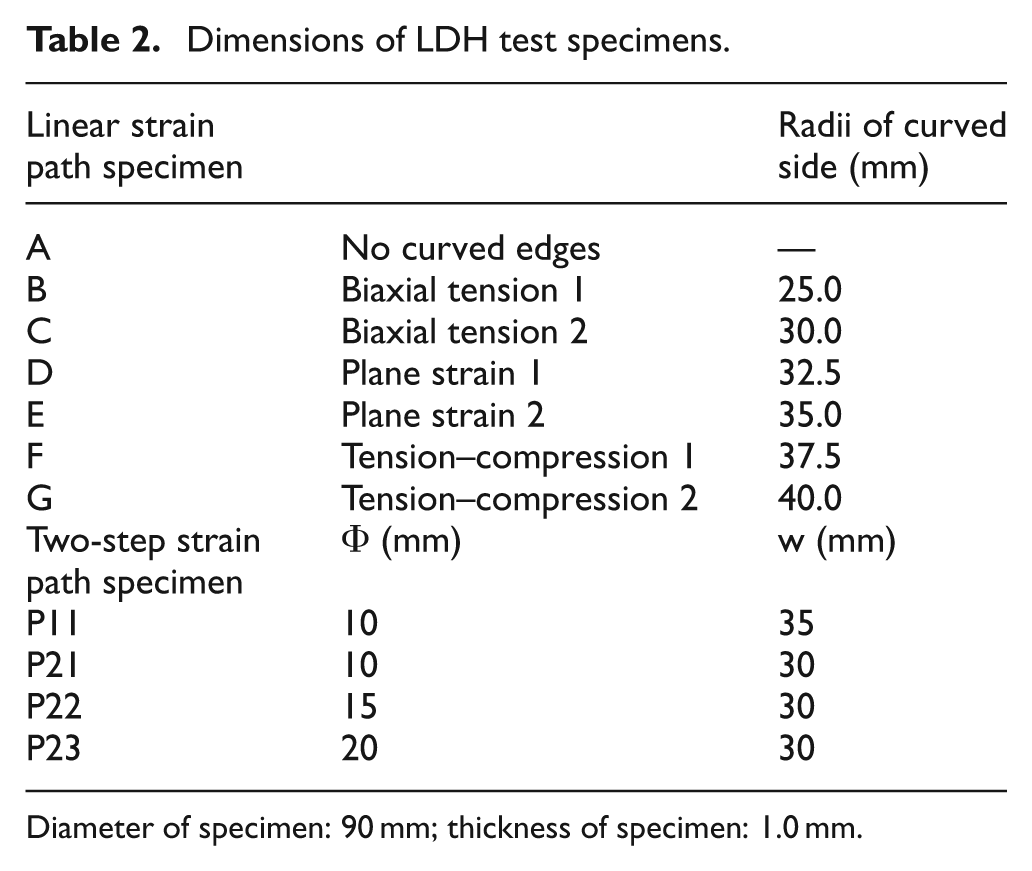
Diameter of specimen: 90 mm; thickness of specimen: 1.0 mm.
The specimens for two-step strain path conditions are designed following the concept proposed in a previous study done by the authors’ research team. 14 The geometries are shown in Figure 3, and their dimensions are listed in Table 2. For example, the original specimen P00 is the round sheet without any hole feature on it. Specimen named P11 has two holes on the round sheet of which the diameter of the holes is 10 mm, and the distance between the holes was 35 mm. Since the punch tip diameter and specimen diameter remain the same, different hole diameters and distances create different constraints and material flow conditions.
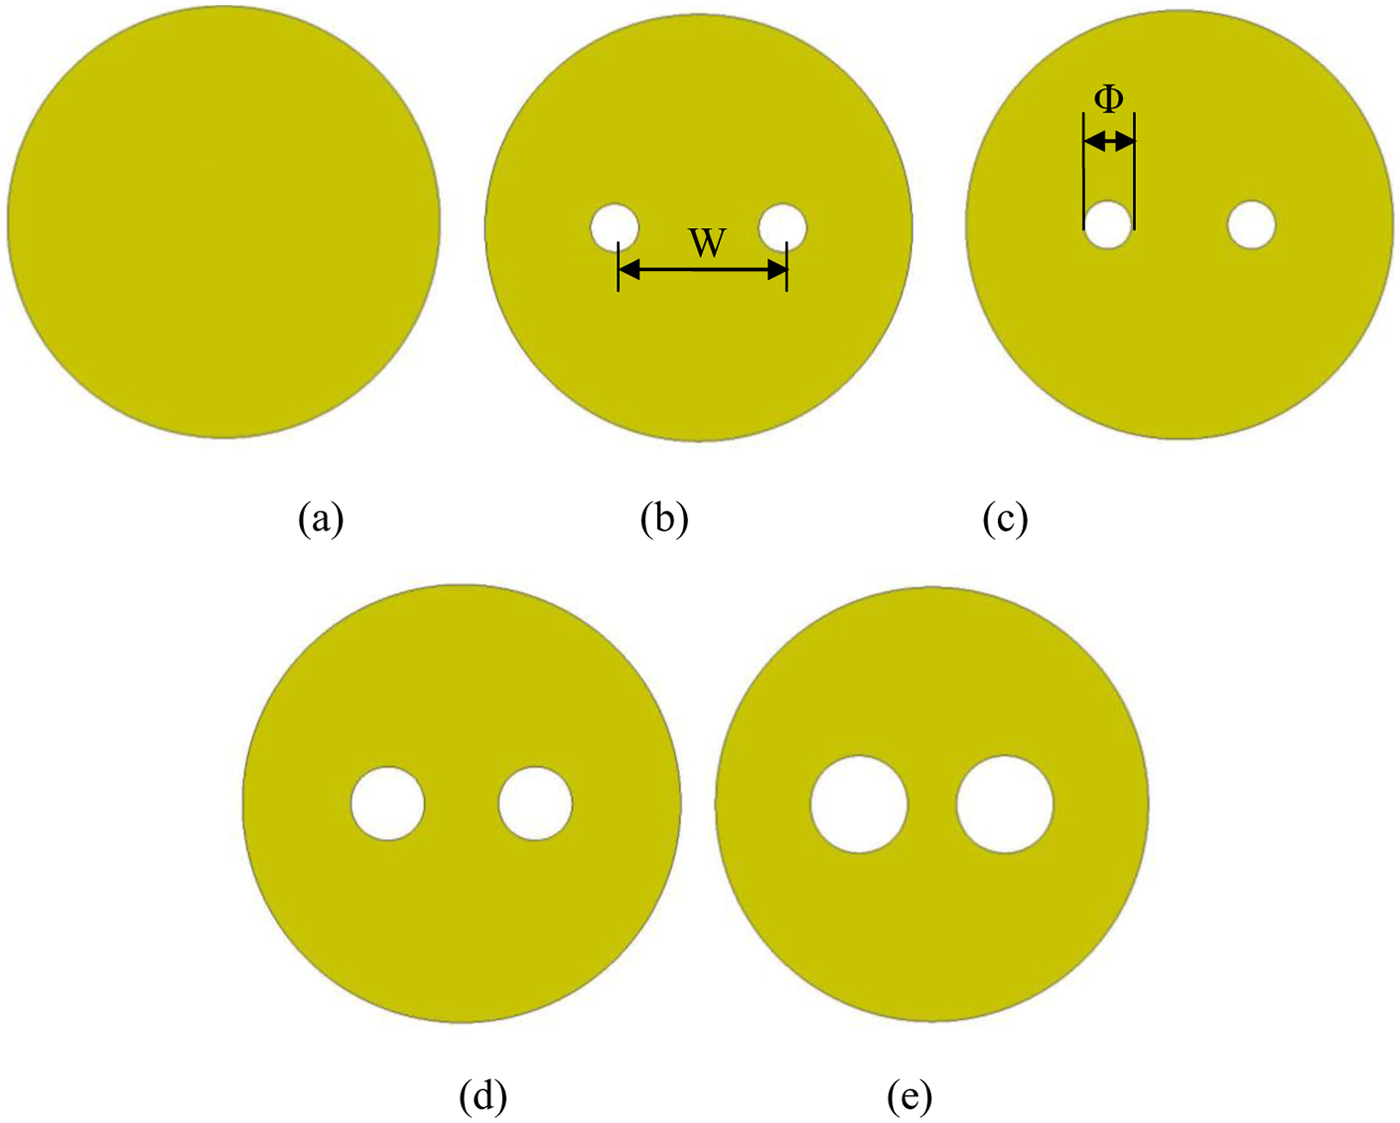
Geometries of two-step strain path specimens: (a) P00, (b) P11, (c) P21, (d) P22, and (e) P23.
Figure 4 shows a specimen with square grids (1 mm × 1 mm) of which the line width is 0.2 mm. In order to seek for fracture initiation on the specimens, incremental tests were executed. At the first trial, the LDH test was performed until the load dropped down or the specimen fractures. From this trial, the maximum stroke of the punch could be obtained. At the rest of the trials, different percentages of the maximum strokes were set such that the strain history on the specimen can be traced and examined to make sure the geometry design generates a two-step strain path condition.
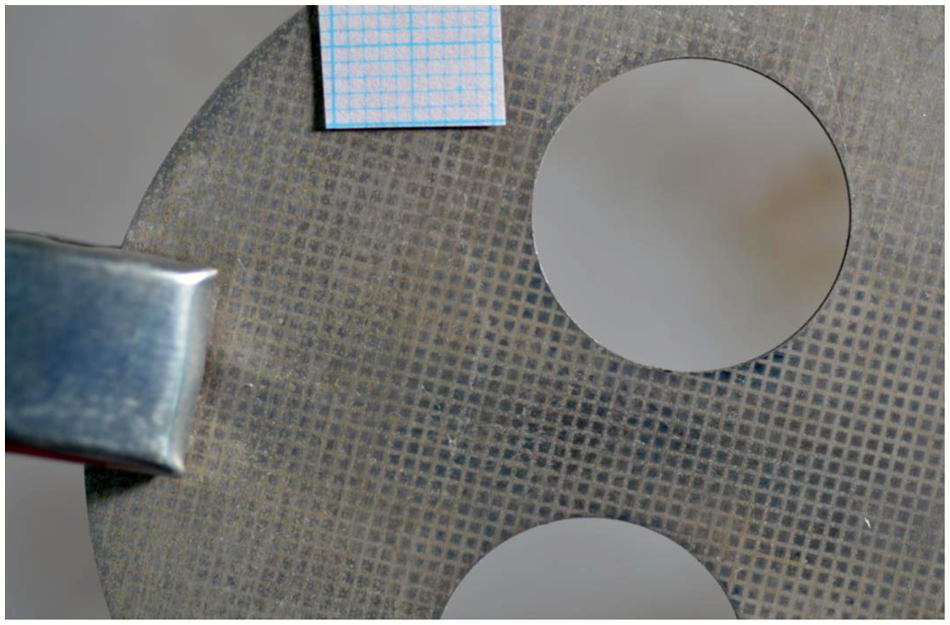
Grids etched on the specimen for strain measurement.
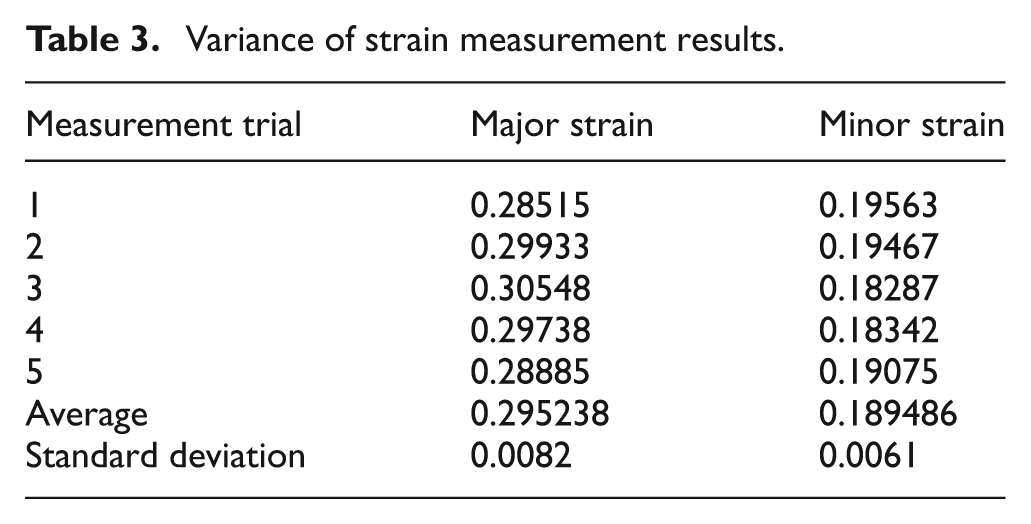
After the experiments have been completed, image processing techniques were used to measure the strains on the specimens. A standard grid template was taken along with the deformed specimens for calibration. The photos were taken with a digital single lens reflex (DSLR) camera with a resolution of 16.2 megapixels. The camera adopted a macro lens for taking close-up photos of the grids on specimens with a reproduction ratio of 1:1. Therefore, the errors in image processing should be controlled to the lowest degree. The scale of picture taken by this apparatus is controlled by the distance from specimen to the camera. An actual length of 1 mm is displayed by at least 100 pixels on the pictures used for strain measurement in this article. To test for the capability of this image processing technique, a deformed grid on P00 specimen was measured five times. The measured strain measurement results are demonstrated in Table 3. The results show good consistency with little deviation, and the range of measured strain values is within ±0.02 mm/mm. Comparing with the strain data measured by optical strain measurement technique, 10 an accuracy of ±0.02 mm/mm should be enough for establishing an accurate FLC.
Variance of strain measurement results.
Simulation setup
In this article, simulations of tensile test and LDH tests are conducted to verify whether the strain paths of each specimen are altered as expected. Packaged software SolidWorks and LS-DYNA3D are used for generating computer-aided design (CAD) models and for forming simulations, respectively. Boundary conditions are set in LS-PrePost according to the experimental setup. The material properties and simulation settings are listed in Table 4. Figure 5 shows the engineering stress–strain curve of the material obtained from tensile tests. Softening effect after ultimate tensile stress point is not significant on the curve, so it is assumed that the material deforms under linear strain path in the simulation of tensile tests. When the material properties of material are obtained, simulations of tensile test are conducted to obtain the stress and strain distributions on the tensile specimen. From the postprocessor of the FE software, data of major strain and minor strain can be exported for plotting the simulated strain paths on FLD. The simulated strain paths ended at the point that had reached the lowest necking strain value measured from experiments. With the simulated strain paths and experimentally measured strain data, engineers could confirm if two-step strain path conditions were created as expected. According to simulation results, three different types of two-step strain path conditions were created by the proposed specimen geometries.
Simulation settings.
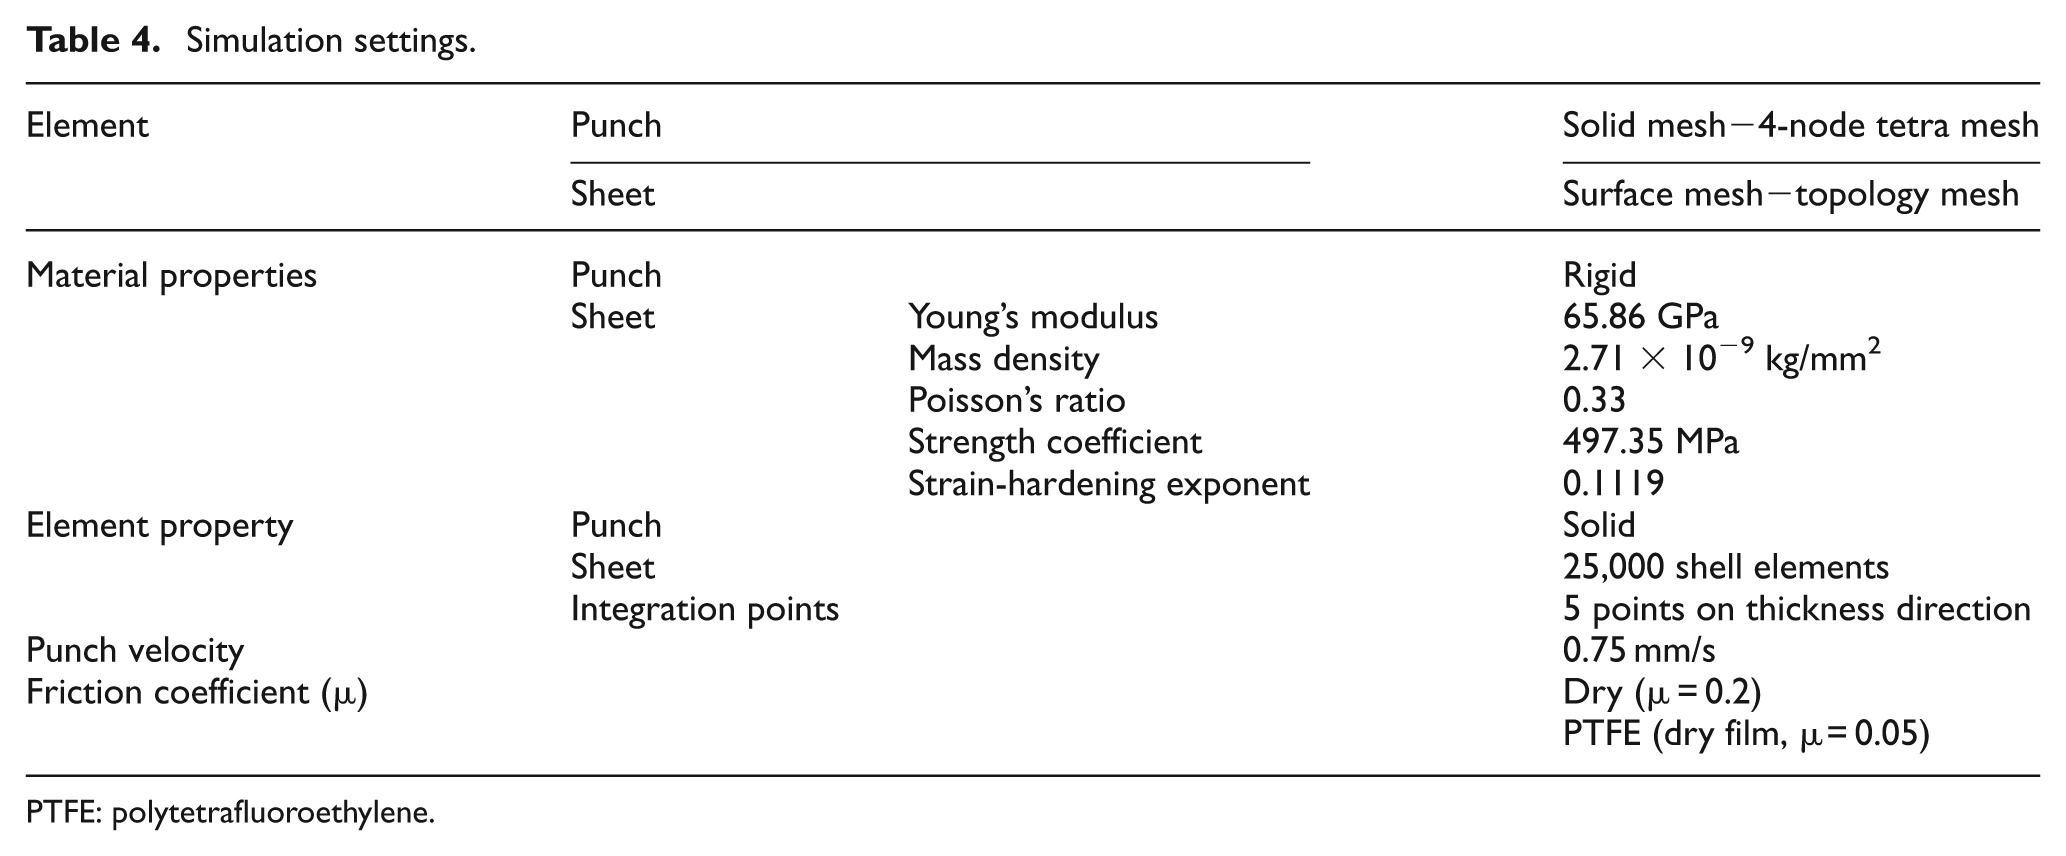
PTFE: polytetrafluoroethylene.
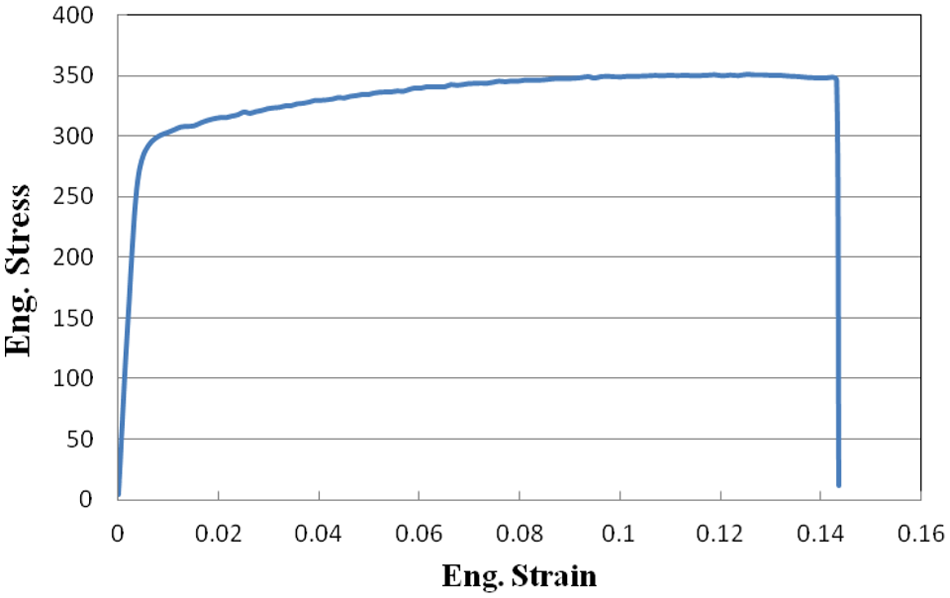
Engineering stress–strain relation of Al6061-T6.
In the simulations of LDH tests, the friction coefficients in the simulations are set with 0.05, 0.1, 0.2, 0.3, 0.4, and 0.5. Then, simulated results are compared with LDH test specimens under dry tests and tests lubricated with dry PTFE films. As the settings of friction coefficient changes in simulations, load data and effective strain distribution on the dome top would be varied. The friction coefficient can be determined by watching the effective strain between the simulated results with those of the experiments. Figure 6 shows the picture of deformed specimen and its effective strain distribution on P00 specimen in simulation. A circle of rougher surface can be observed on the dome of the specimen. This area is assumed to be the position where necking has started. A circle of high effective strain values is observed in simulation. As the friction coefficient becomes larger, the radius of the circle expands outwardly. The increase of effective strain value in this area indicates that material flow is restricted in this area due to surface friction. If fracture would occur on the specimen, it is most likely to occur in this ring area. Therefore, the position and radius of the high effective strain area should coincide with the position of rougher surface on specimens. According to this matching procedure, the friction coefficient in simulations under dry condition is determined to be 0.2. Figure 7 shows the results when the specimen is lubricated with dry film PTFE. Fracture did not occur under this lubrication condition, but the dome height is increased. By matching the load by experiment with that of simulation, the friction coefficient for lubrication with dry film PTFE is determined to be 0.05.
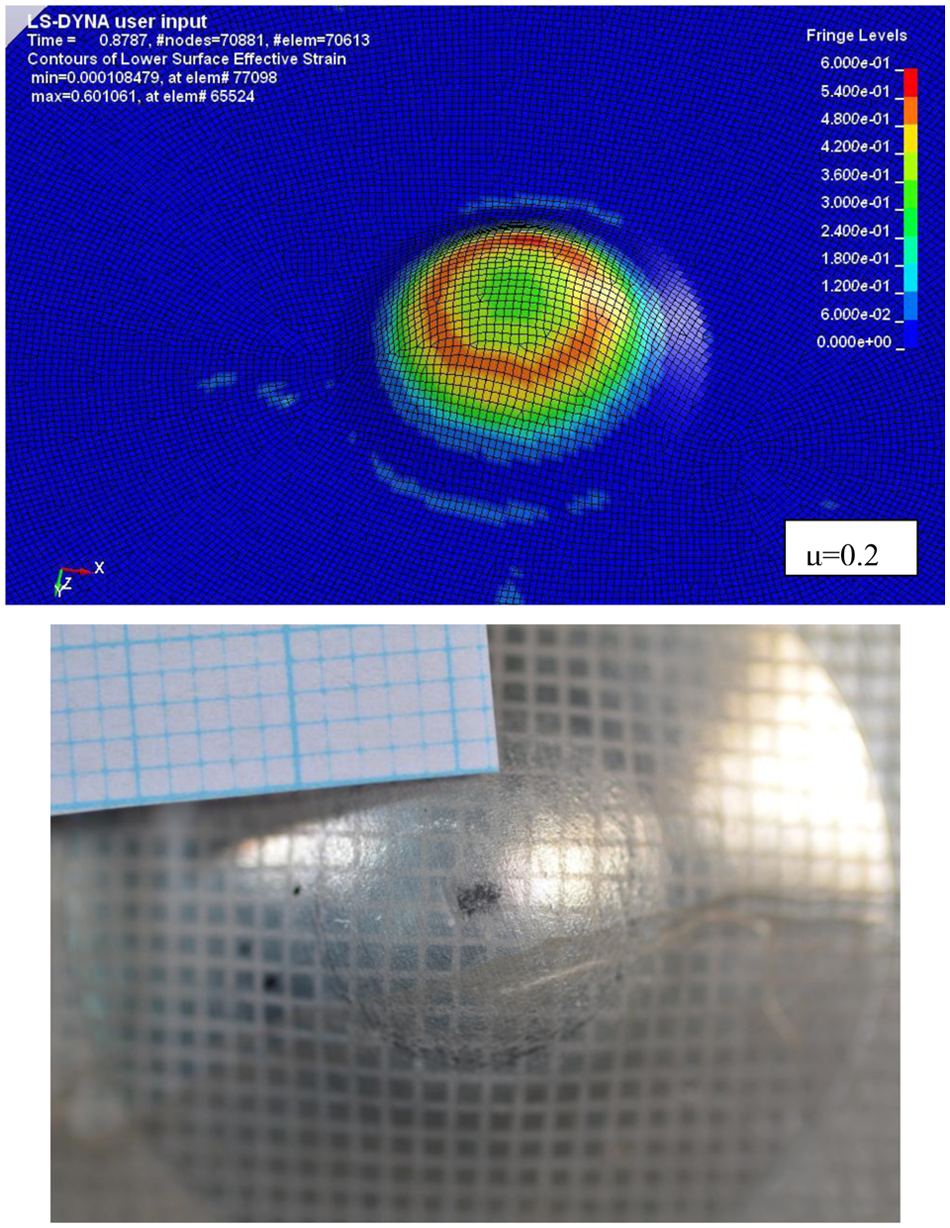
Experimental and simulation results of P00 under dry friction conditions.
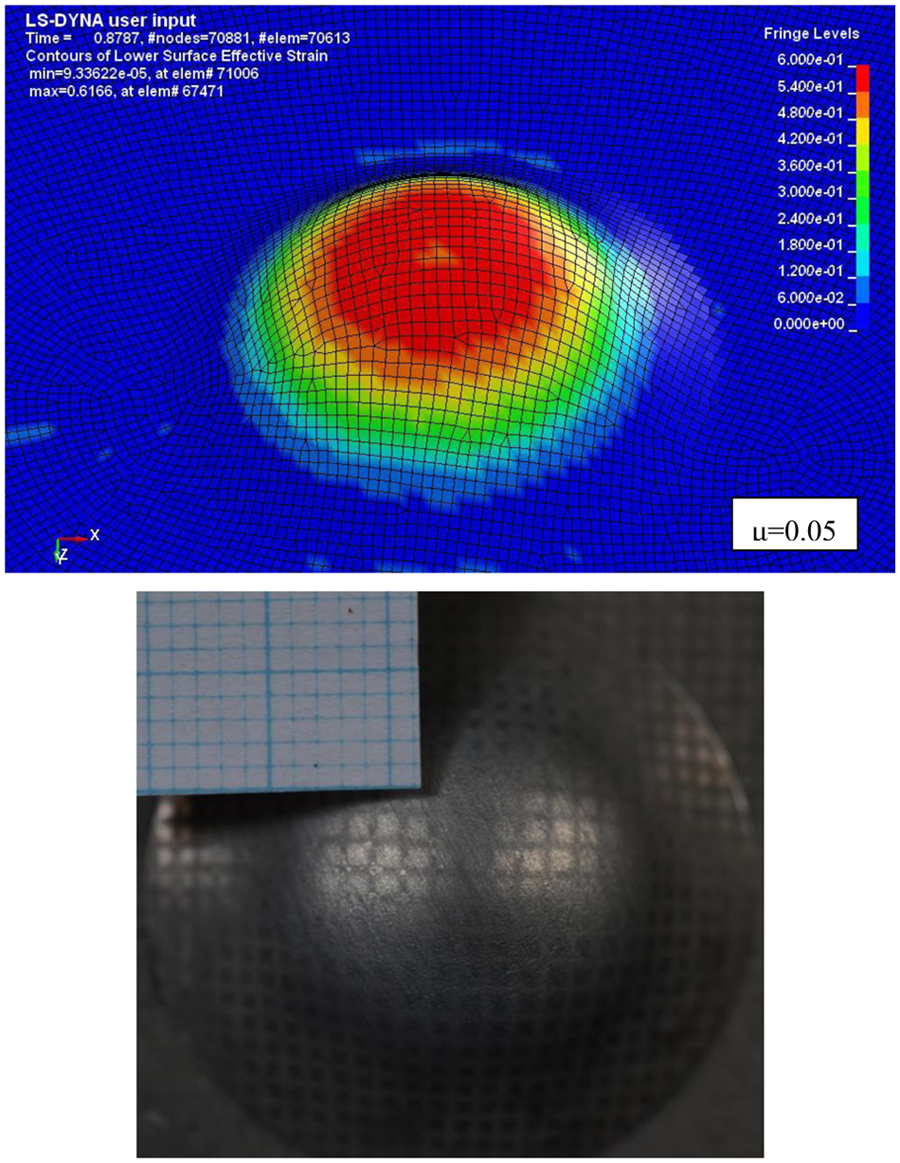
Experimental and simulation results of P00 under PTFE lubricated conditions.
Results and discussions
Experimental results
Load and maximum dome height are two important factors to evaluate the formability of material in LDH tests. Figure 8 shows the experimental load–stroke relation under two different lubrication conditions on P00 specimens. The results show that load is lowered with PTFE lubricant. With better lubrication, the maximum dome height has increased 36% from the original maximum dome height. Comparing the load in LDH experiments among all the specimens, the tendency is shown in Figure 9. The load–stroke relation of specimen P11 is almost the same with P00, but the maximum dome height is relatively smaller. This indicates that the influence of load decreasing is not obvious if the holes on the specimen are too small and the distance is large. As the diameter of the holes becomes larger, the load required for fracture initiation decreases. The maximum load of P23 is less than 4 kN, less than half of the load of forming P00 specimen.
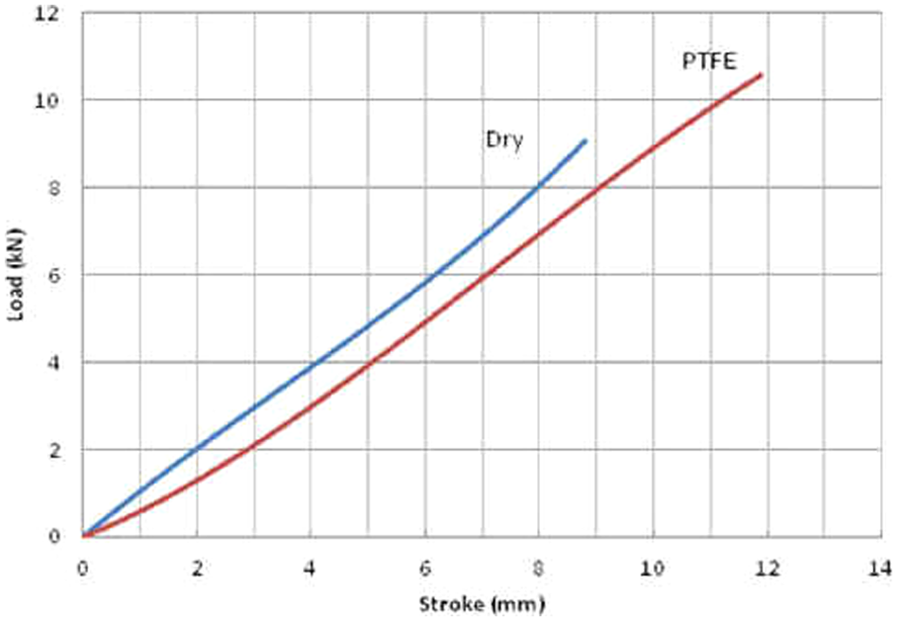
Load–stroke diagram for P00 under different lubrications.
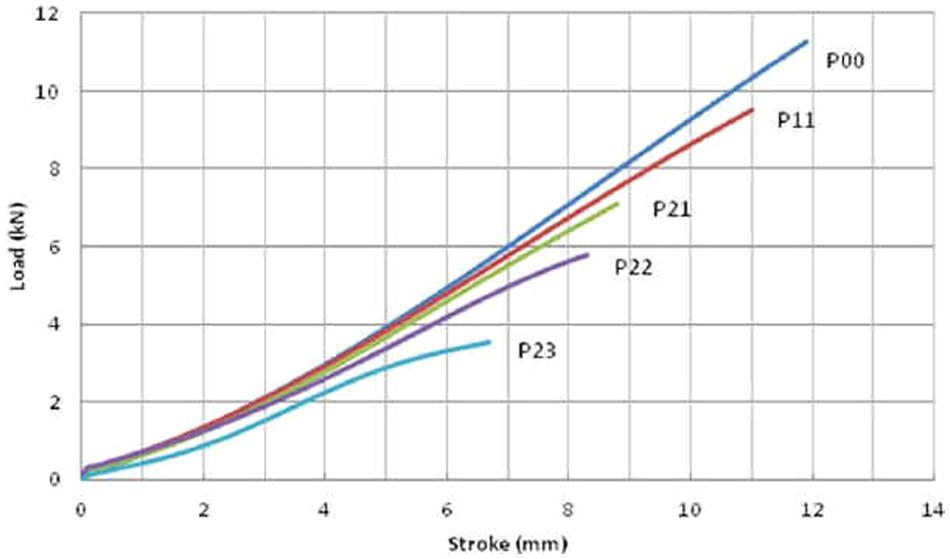
Load–stroke diagram for PTFE tests.
After incremental tests were finished, the strains on the deformed areas under different dome heights were measured. The strain data in the first quadrant were measured from P00 specimens under different dome heights, and the data in the second quadrant were measured from tensile test specimens. When fracture occurred on the specimens, the grids on the fracture site could not be recognized for measurement. Therefore, the complete grids close to the fractured grid were used for strain measurement and labeled as necking grids, as illustrated in Figure 10.
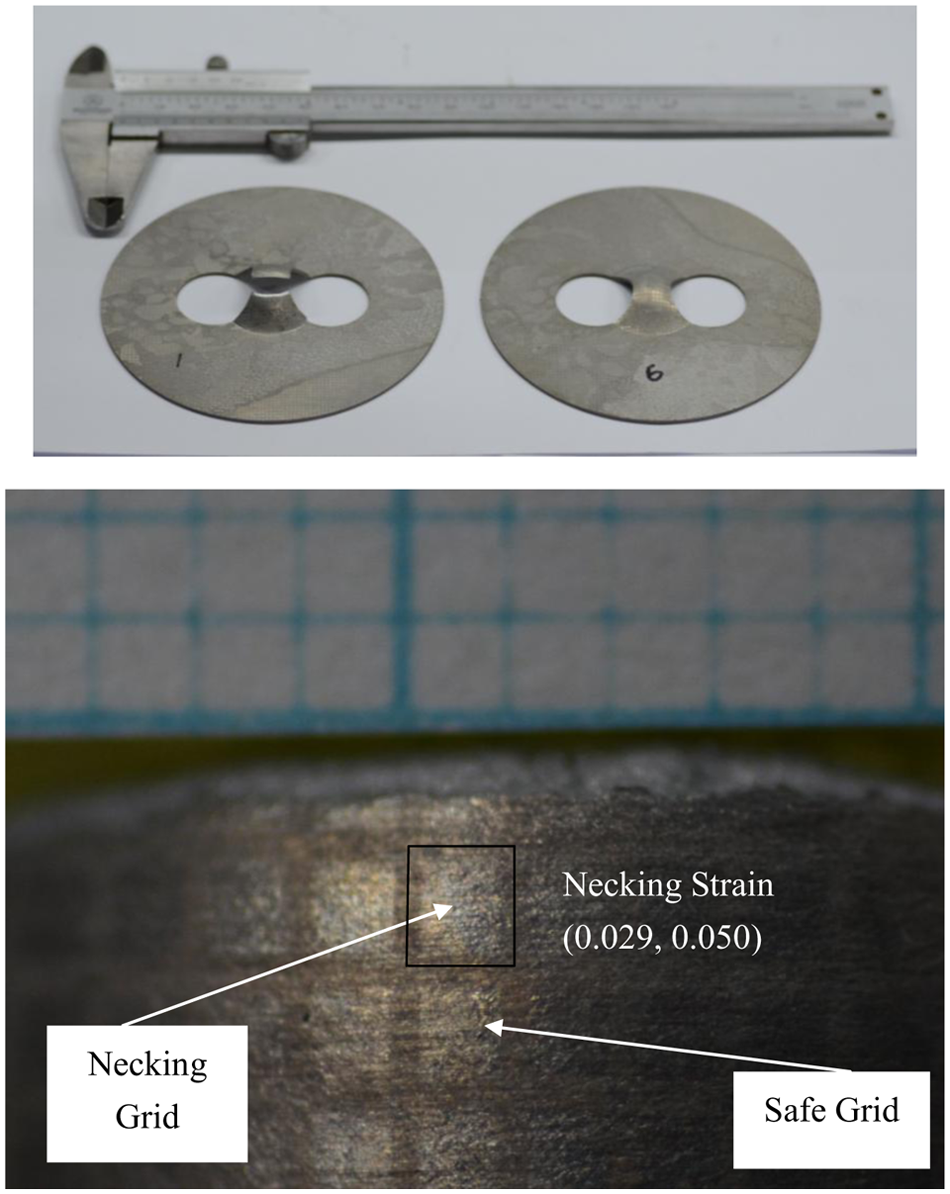
Safe and necking grid on deformed specimen.
The linear FLC of the material is shown in Figure 11. The circular data points in Figure 11 represent safe strain values, which are measured from safe grids under various dome heights. Data points with X marks are measured from necking grids on specimens. A linear regression line that passes through the lowest necking strain values is drawn for illustrating the linear FLC. The established FLC based on linear strain path conditions is used for predicting the forming limit of specimens with two-step strain paths. After the deformed specimens had been obtained from different incremental tests, safe and necking strain values were obtained. By comparing simulation results with experimental strain data points, changes in the slope of strain paths could be shown.
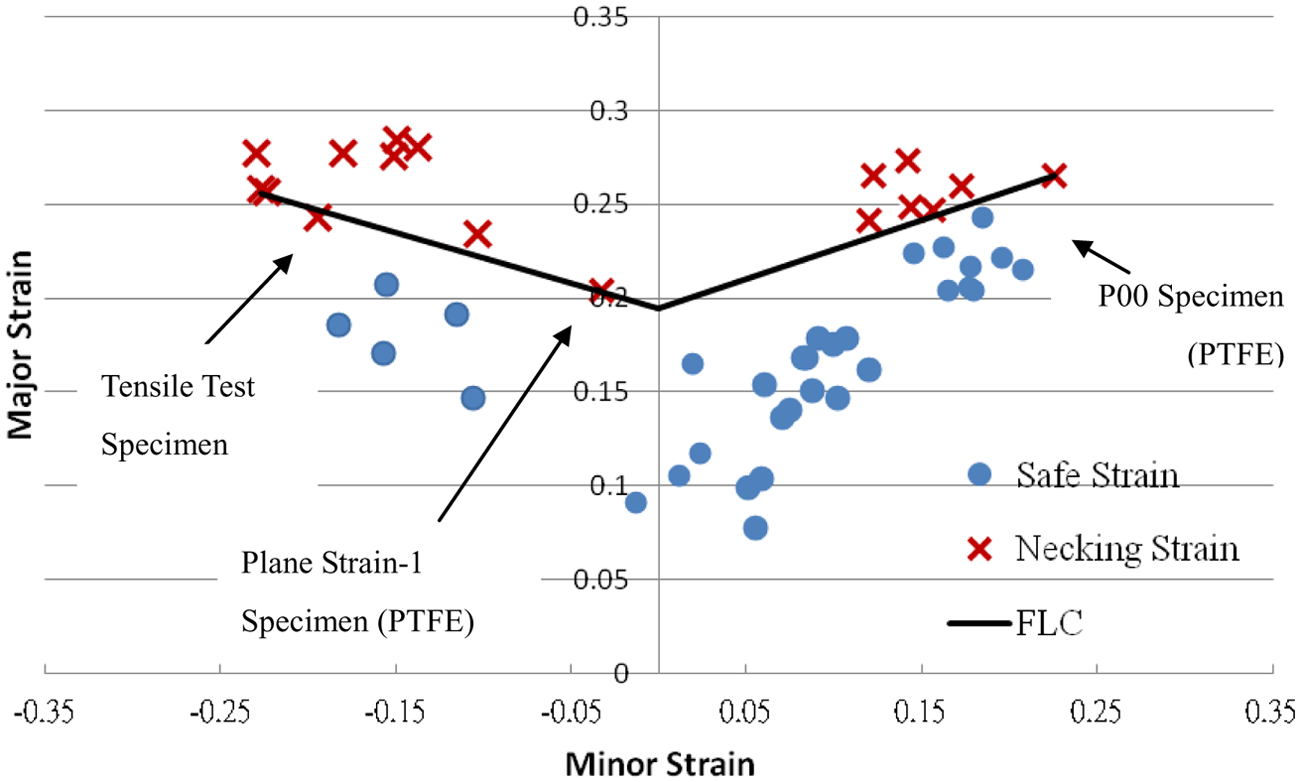
FLD of Al6061-T6.
Discussions
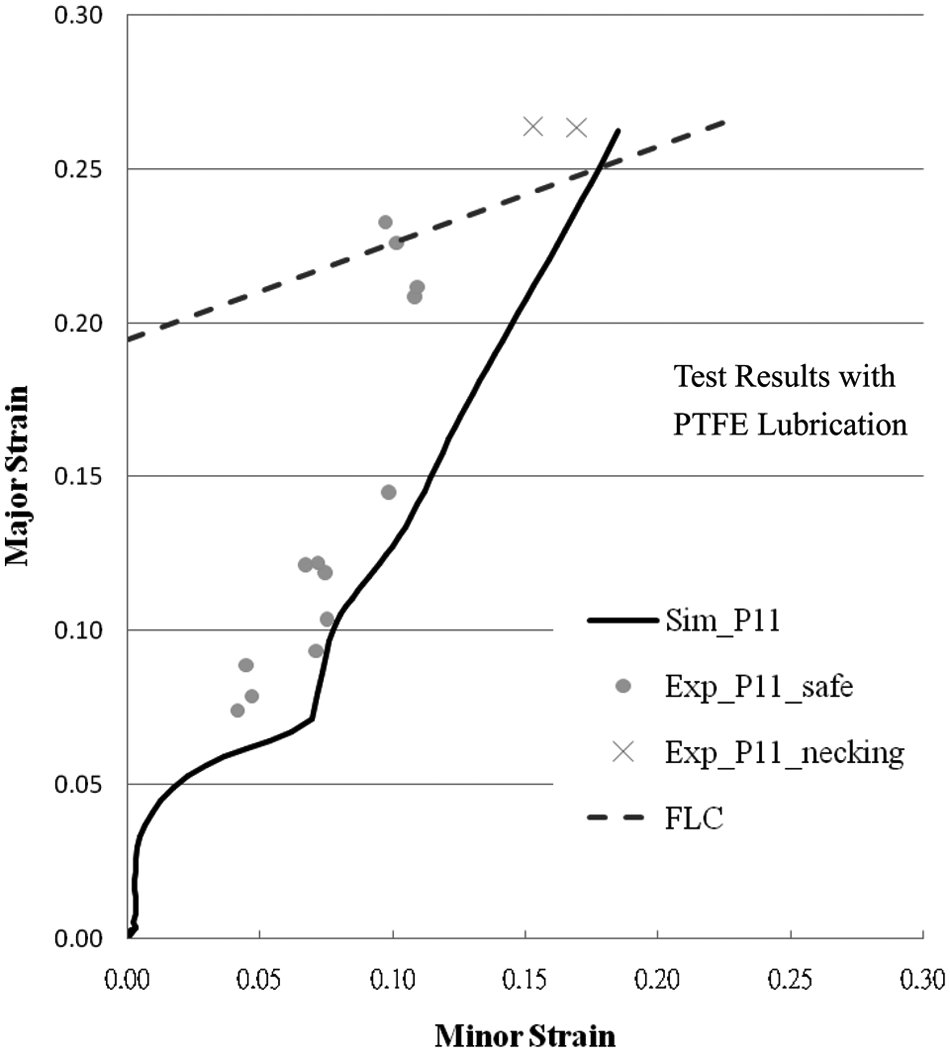
Figure 12 shows the comparison of simulated strain data and experimentally measured strain data of P11 specimen on FLD. Circular points represent the strain values measured from safe grids, and the points with X marks are strains measured from necking grids. The dashed line is the linear FLC in the first quadrant in Figure 11, and the solid line represents the simulated strain path. Same labels are used in Figures 13 and 14.
Strain path verification of P11 specimen.
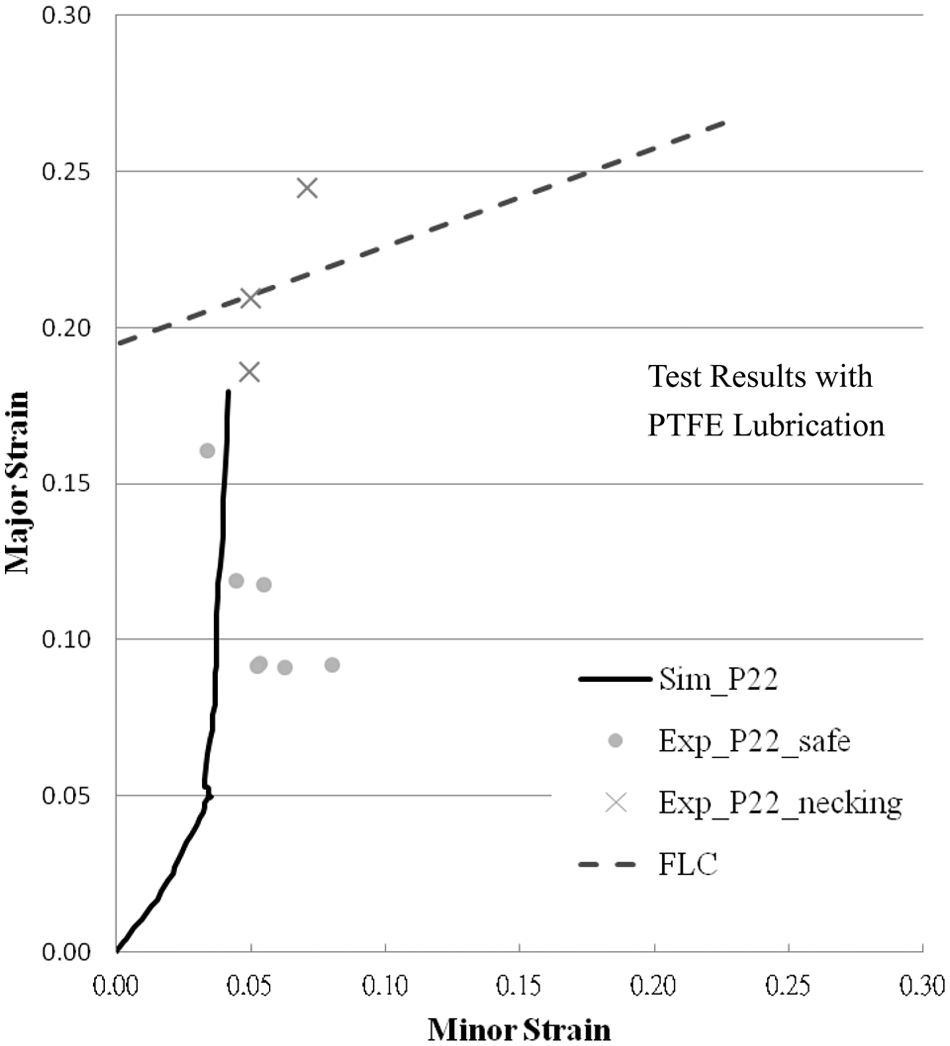
Strain path verification of P22 specimen.
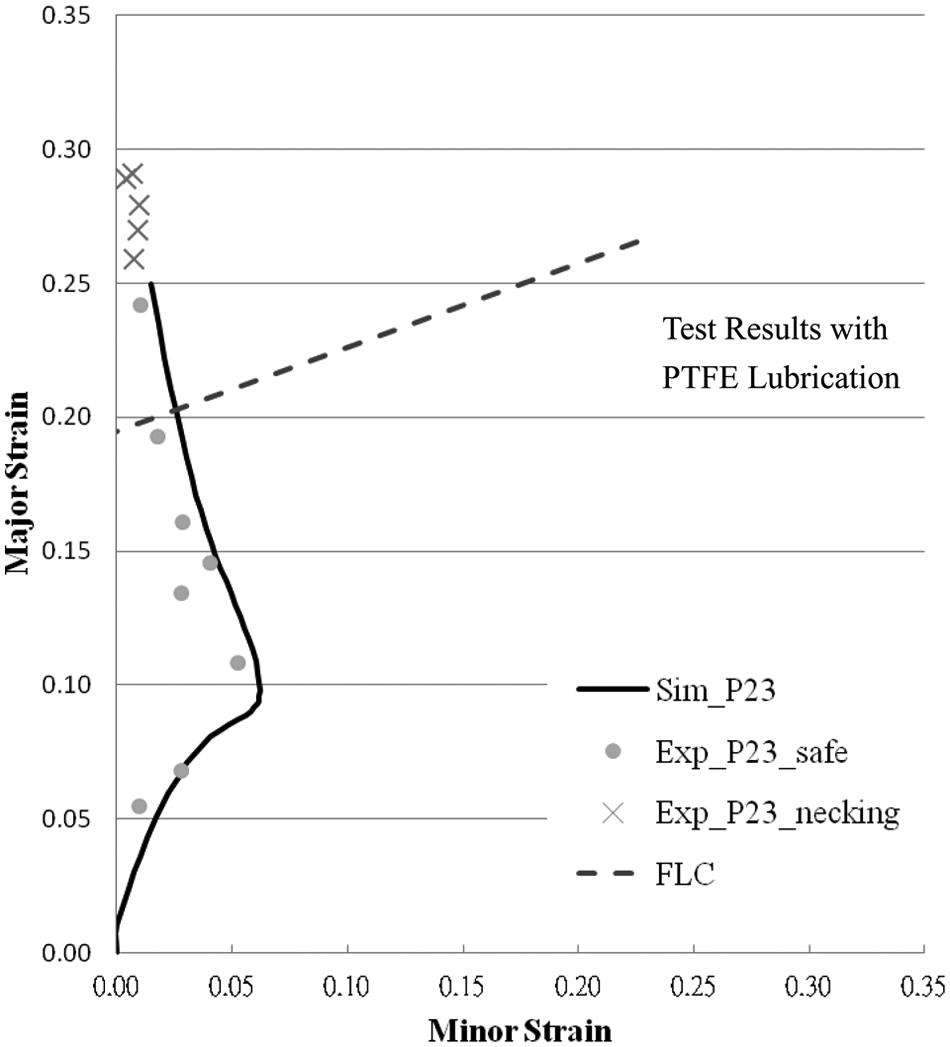
Strain path verification of P23 specimen.
According to the results in Figure 12, the simulated strain path for P11 specimen does not show a significant turning point. The strain ratios from the start of deformation to the end are always positive. This indicates that P11 specimen undergoes biaxial stretching throughout the deformation. The experimentally measured necking strain values nearly coincide with the FLC obtained from linear conditions. It indicates that the prediction made by linear FLC is underestimated in this circumstance.
Figure 13 shows the strain path of P22 specimen. According to experimentally measured strain values, a strain path following plane strain condition at the second step is observed. This result proves that by altering the specimen geometry, the strain path may vary from biaxial tension to plane strain. Also, the two-step strain path was created via the applied specimen design. However, it is worth noticing that the necking strain values measured experimentally are below the linear FLC. This implies that the formability of material under this circumstance could be overestimated when using linear strain path FLD for formability evaluation. Fracture might occur earlier on the products unexpectedly. Thus, two-step strain path formability test is needed under this circumstance.
When the strain ratio at the second step becomes negative, that is, strain reverse (P23), a two-step strain path can be observed clearly both from experimental results and from simulations, as shown in Figure 14. According to the experimentally measured strain values, the strain ratio at first step is positive, which means the material deforms under biaxial stretching condition. When the strain values reached around (0.10, 0.06), the strain ratio changes to a negative value. Experimentally measured strain data agree well with simulated strain values, indicating that a two-step strain path with strain reverse is created with the P23 specimen. In Figure 14, the measured necking strain values are higher than the linear FLC. The formability of material under strain reverse condition would be better than linear strain path conditions. This phenomenon is the same as that of reversed LDH tests given by Jain et al. 11
To conclude, predictions made by linear FLC would be underestimated or overestimated under two-step strain path conditions. The FLC would shift upward or downward when prestrain effect exists in the forming processes, just like the experimental results showed by Jain et al. 11 If a sheet metal is deformed through a two-step strain path, using a linear FLC for fracture prediction could cause problems such as unexpected occurrence of fracture. For process and product design purpose, the forming limits under two-step strain path conditions determined by experiments are still required. The novel specimen design concept is proved to be capable of creating two-step strain paths in LDH tests. Through altering the diameters of the hole and distances between holes on the specimen, two-step strain path with plane strain and strain reverse conditions can be established. With the specimen design concept, it is possible to establish a FLC of two-step strain path conditions through experiments.
Conclusions
In this article, novel specimen designs are applied on LDH test specimens. The specimen designs are capable of creating continuous two-step strain paths on FLD without unloading. This advantage would help to decrease the variations in experiments. Different geometric parameters of the design create different strain paths on the deformed specimen, which is capable for evaluating the formability of material under various strain ratios. The capability of creating different two-step strain paths has been shown by experimentally measured strain data and has been verified by simulation results.
The novel specimen design can create various two-step strain paths, such as stretching, plane strain, and strain reverse. With the novel specimen design concept, forming limit strains of material under two-step strain paths can be obtained instead of predicted using linear FLC.
Footnotes
Acknowledgements
The authors would like to gratefully acknowledge the experimental helps from Mr F.W. Lo, Mr C.J. Huang, and Mr H.Y. Chiu.
Funding
This research received no specific grant from any funding agency in the public, commercial, or not-for-profit sectors.