
Abstract
Finite element models were established to simulate the quenching processes of aluminum alloy 2024 blocks under different quenching conditions. The surface cooling curves of aluminum blocks in different quench media were obtained by experiment. Inverse heat-transfer calculations were applied to determine the heat-transfer coefficient curves. Finite element model was used to predict residual stresses developed after quenching process by quenching aluminum blocks with different thicknesses (20 mm ≤ d ≤70 mm) into two kinds of quenchants (water and polyalkylene glycol solution). The influence of block thickness and quenchant on residual stresses was investigated by both finite element method simulation and experiments. To validate the simulation results, the X-ray diffraction method was used to measure the residual stresses developed in aluminum alloy 2024 blocks after quenching process. The agreement between model and experiment was good. It was concluded that both block thickness and quench media had critical influences on residual stresses. When the thickness of the aluminum block increased from 20 to 50 mm, the residual stress value at the center of the block increased by 100% and the increase of the residual stress became insignificant after 50 mm. In d = 20 and 30 mm cases, polyalkylene glycol quench conditions were proved to cause lower levels of residual stress than water quench conditions.
Introduction
High-strength aluminum alloys are widely used in aerospace engineering because of their high fracture toughness and resistance to stress corrosion cracking after quenching and aging process. 1 The 2000 series alloys gain their strength through heat-treatment in high temperature solution followed by rapid quenching and subsequent aging treatment. However, when the heated parts are suddenly immersed into cold water, severe thermal gradient between the center and the surface will result in inhomogeneous plastic deformation and high residual stress.2,3 Generally, residual stress has a negative effect on component quality because it may induce premature failure through stress corrosion or hydrogen cracking, and cause distortion and dimensional variation.4,5 Therefore, it is important to investigate the parameters that affect the magnitude and distribution of residual stress in order to improve the quality and reliability of manufactured parts.
Extensive research has been carried out in the field of quenching residual stress reduction. First, quench conditions such as quench medium and the temperature at which quenching begins should be designed properly. 6 Second, the geometry and size of the part also have obvious effect on the stress distribution. 7 Quench warping and cracking can be strongly reduced if quenching condition and part shape are suitable. Third, a number of methods can be applied after quenching to reduce residual stresses such as cold working process, 8 low frequency magnetic field treatment,9,10 electro-pulsing treatment 11 and uphill quenching treatment, 12 or combination of the above.
Residual stress cannot be measured directly; thus, plastic deformation is measured to calculate residual stress. The methods to obtain residual stress include destructive and nondestructive methods. The destructive methods require removing a specific part off the sample and using the sample deformation to calculate the residual stress. These methods consist of hole-drilling method, 13 crack compliance method, 14 removal of layer method, 15 and so on. Of the above-mentioned methods, the hole-drilling method is the most widely used. As for nondestructive methods, residual stress is derived through the measurement of electromagnetic, optic, and other physical phenomena in the residual stress field; thus, the specimen is not to be destructed. The nondestructive methods include X-ray diffraction method, 16 neutron diffraction method, 17 ultrasound method, 18 and so on. The X-ray and neutron diffraction methods have been extensively used to measure quench residual stresses.19,20 However, these methods are confined to relatively near-surface measurements only. Although the neutron diffraction and synchrotron X-ray methods can measure through thickness quench residual stresses within the depth of several centimeters, they are limited to relatively small samples. 21
Although the experimental measurement of the residual stress is more reliable than before, most of the methods tend to be complicated and expensive. Therefore, finite element method (FEM) has been used to predict temperature distribution and residual stress. Quench is a complicated process; thus, finite element (FE) models with high accuracy are necessary. Previous works have proven that heat-transfer coefficient (HTC) between hot metal and quench media is the biggest uncertain factor in quench simulation.22,23 The HTC can be calculated through an inverse heat-transfer analysis,24,25 but the surface temperature variation during quenching is needed. However, measuring the surface temperature is very difficult. Generally, it is preferable to measure the sub-surface temperature, although this may bring in some error because sub-surface temperature is not exactly the same with surface temperature. The heat-transfer boundary condition can also be defined by surface temperature variation during quenching; the result will be similar with HTC boundary condition. 24 As for numerical simulation approach, the temperature–displacement simulation was often decoupled to thermal simulation and structural simulation for fast convergence and low computational cost.22,24
Although extensive research has been carried out on quench simulation, much of them focused on steel.19,20,26–29 A group of Japanese scientists developed a heat-treatment database on gears; the database involved heat-treatment quality prediction and optimization of quench conditions. As reported in the literature, the database can predict hardness, displacement, and residual stress after quench with good accuracy.30–33 For aluminum alloy quench simulation, some researchers were interested in the distribution and magnitude of quench residual stress after quenching while the others investigated the parameters that affect residual stress and stress reduction.4,21–24,34 Part geometry and quench temperature has been proved to have a strong influence on residual stress distribution. Tanner 25 discovered that while the specimen thickness varied from 8 to 26 mm, the surface residual stress magnitude increased. However, the effect of thickness on residual stress magnitude when the block thickness varies from 20 to 70 mm is yet to be studied. Kocx et al. 4 carried out a study on residual stress magnitude and distribution after quench and on the reduction of residual stress through cold working by developing a FE model. But their study did not include the analysis on the parameters that affected the magnitude of residual stress in block-structured parts.
In this study, an FE model was built to simulate quenching process of Al 2024 blocks. The connection between block thickness and residual stress magnitude was investigated using the FE technique. To investigate the effect of different quenching media on residual stress, two types of quenching media (water and 15% polyalkylene glycol (PAG) solution) were applied. The residual stress distribution in quenched blocks was measured using X-ray diffraction method for verification of the developed FE model.
Description of the quenching process
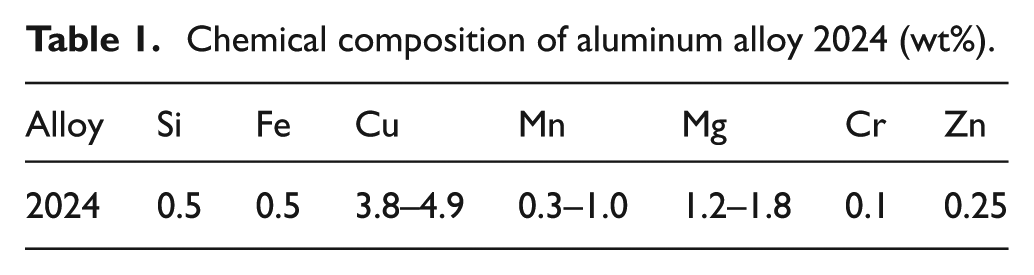
The 2024 alloy is one of the heat-treatable high-strength aluminum alloys; its composition is listed in Table 1. As shown in Figure 1, when the heating temperature is above the recrystallization temperature of 2024 aluminum alloy, α phase exists in the alloy. When cooled down rapidly, α phase is changed into supersaturated α phase without any new phase being generated.
Chemical composition of aluminum alloy 2024 (wt%).
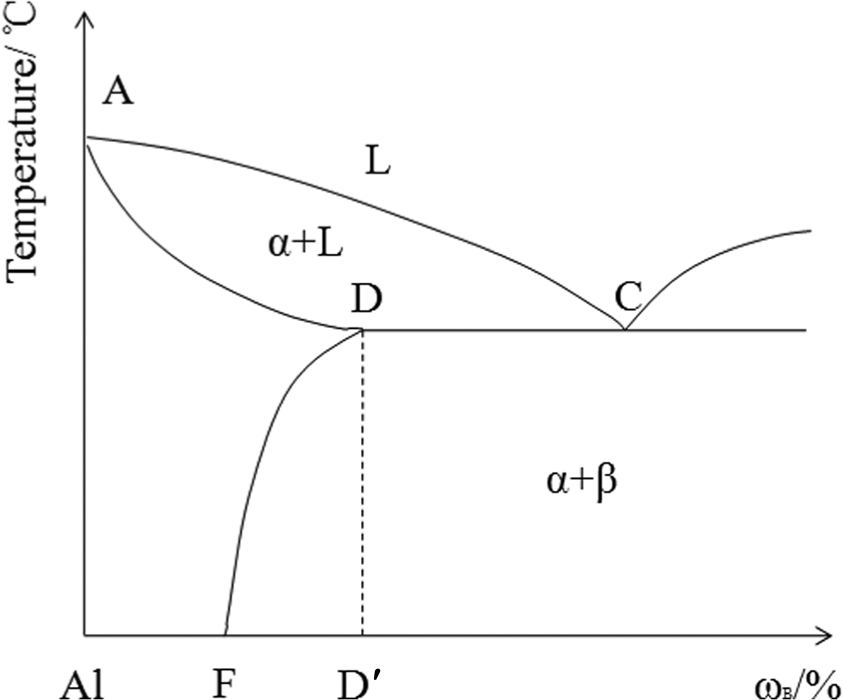
Aluminum alloy phase diagram.
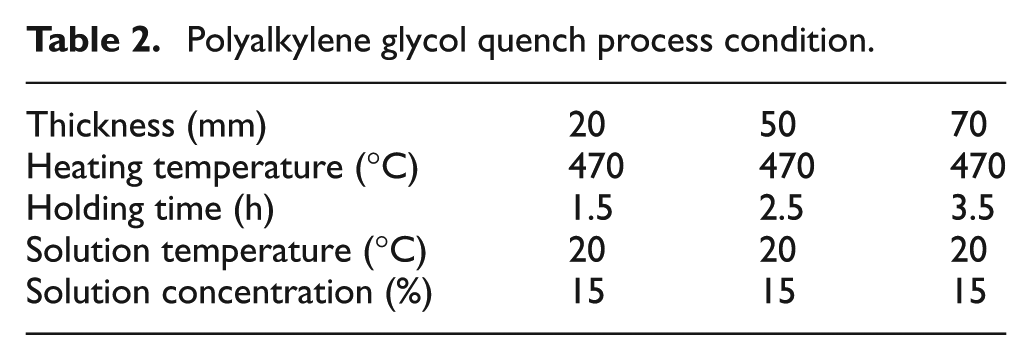
In this study, three different types of aluminum alloy 2024 blocks were used to apply quenching process. The dimensions of the blocks were 100 mm × 90 mm × 20 mm (block A), 100 mm × 90 mm × 50 mm (block B), and 100 mm × 90 mm × 70 mm (block C). Tables 2 and 3 showed the quench conditions for water quench and PAG quench.
Polyalkylene glycol quench process condition.
Water quench process condition.
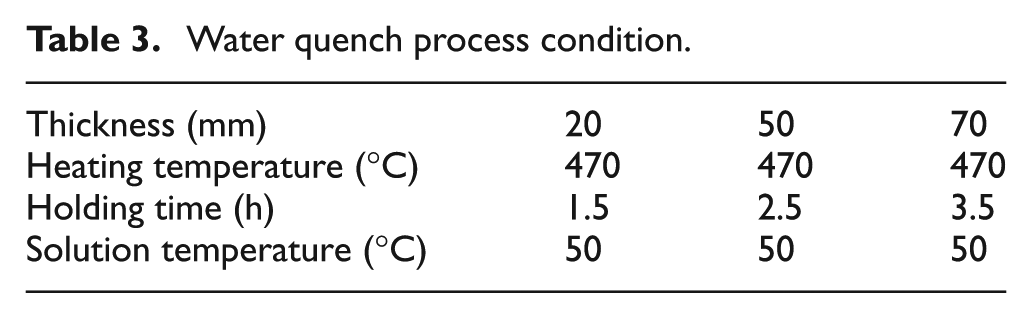
During the experiment, aluminum blocks of different thickness were heated up to 470°C in a heating furnace, which was above the recrystallization temperature of 2024 alloy. Then the furnace temperature was held at 470 °C for 3.5 h for the longest case in order to achieve a uniform temperature and phase. In the quenching process, aluminum blocks with a uniform temperature of 470 °C were respectively immersed in 15% PAG solution at 20 °C and water at 50 °C with stirring until the aluminum block was cooled down to a uniform temperature. For each block thickness, the quench experiment under the same quench condition was repeated three times in order to control the error induced from experimental operations.
FE analysis (FEA) of quenching
The FE model
Quenching is a multiscale process; during quenching, coupled physical phenomena such as heat transfer, phase transformations, and deformation occur simultaneously. For most cases, three aspects should be considered in FEM analysis: (1) thermal, (2) mechanical, and (3) metallurgical. However, during the quenching process of aluminum alloys, it is generally assumed that no phase change takes place during the process, which is due to the metallurgical properties of aluminum alloy. As a result, current model ignores phase change during the process. This assumption, which is proven to be reasonable during the following numerical experiments, greatly simplifies calculation and also reduces computing time.
The heat-transfer process can be simplified as a transient heat-transfer process with convective boundary conditions and internal heat source. Different HTC curves were used to distinguish different quench media. Researcher Grum 35 has previously discovered that 10% deviation of HTC can lead to 30% deviation between the calculated value and the experimental value of the temperature field distribution while calculating the quenching temperature field of steel 42CrMo. Thus, it is necessary to acquire accurate data of HTCs in order to build a model with reliable accuracy. However, the HTC varies with shape of the heat-transfer surface, physical properties of quenching media, temperature difference between quenching media and part surface, and so on. It is hard to find detailed results from previous research. Therefore, in the following section, an indirect method is used to determine the HTC curves between aluminum alloy 2024 and quenching media.
In this study, elastic-perfectly plastic FEA of the quenching process was performed using a commercial FEM code, ABAQUS/Standard. It was assumed that no residual stress existing at the beginning since 470 °C was above the recrystallization temperature. A three-dimensional (3D) 20-node coupled temperature–displacement element was selected to perform the analysis. This element was named C3D20RT in the ABAQUS library. The element size was around 2.38 mm × 2.14 mm × 1.25 mm; thus, the mesh density is about 2.48E+9 elements/m3. The work completed by Tanner has proved that a mesh density of 6E+6 elements/m3 was fine enough for a 70-mm cubic block quench simulation. Thus, the mesh density in this model should be fine enough. As illustrated in Figure 2, a simplification of the FE model was possible by using one-eighth of the blocks to reduce the CPU time for the simulations since the geometry and the boundary conditions were symmetrical. Displacement constraints were defined on three faces of the one-eighth block because these faces were symmetrical planes of the blocks.
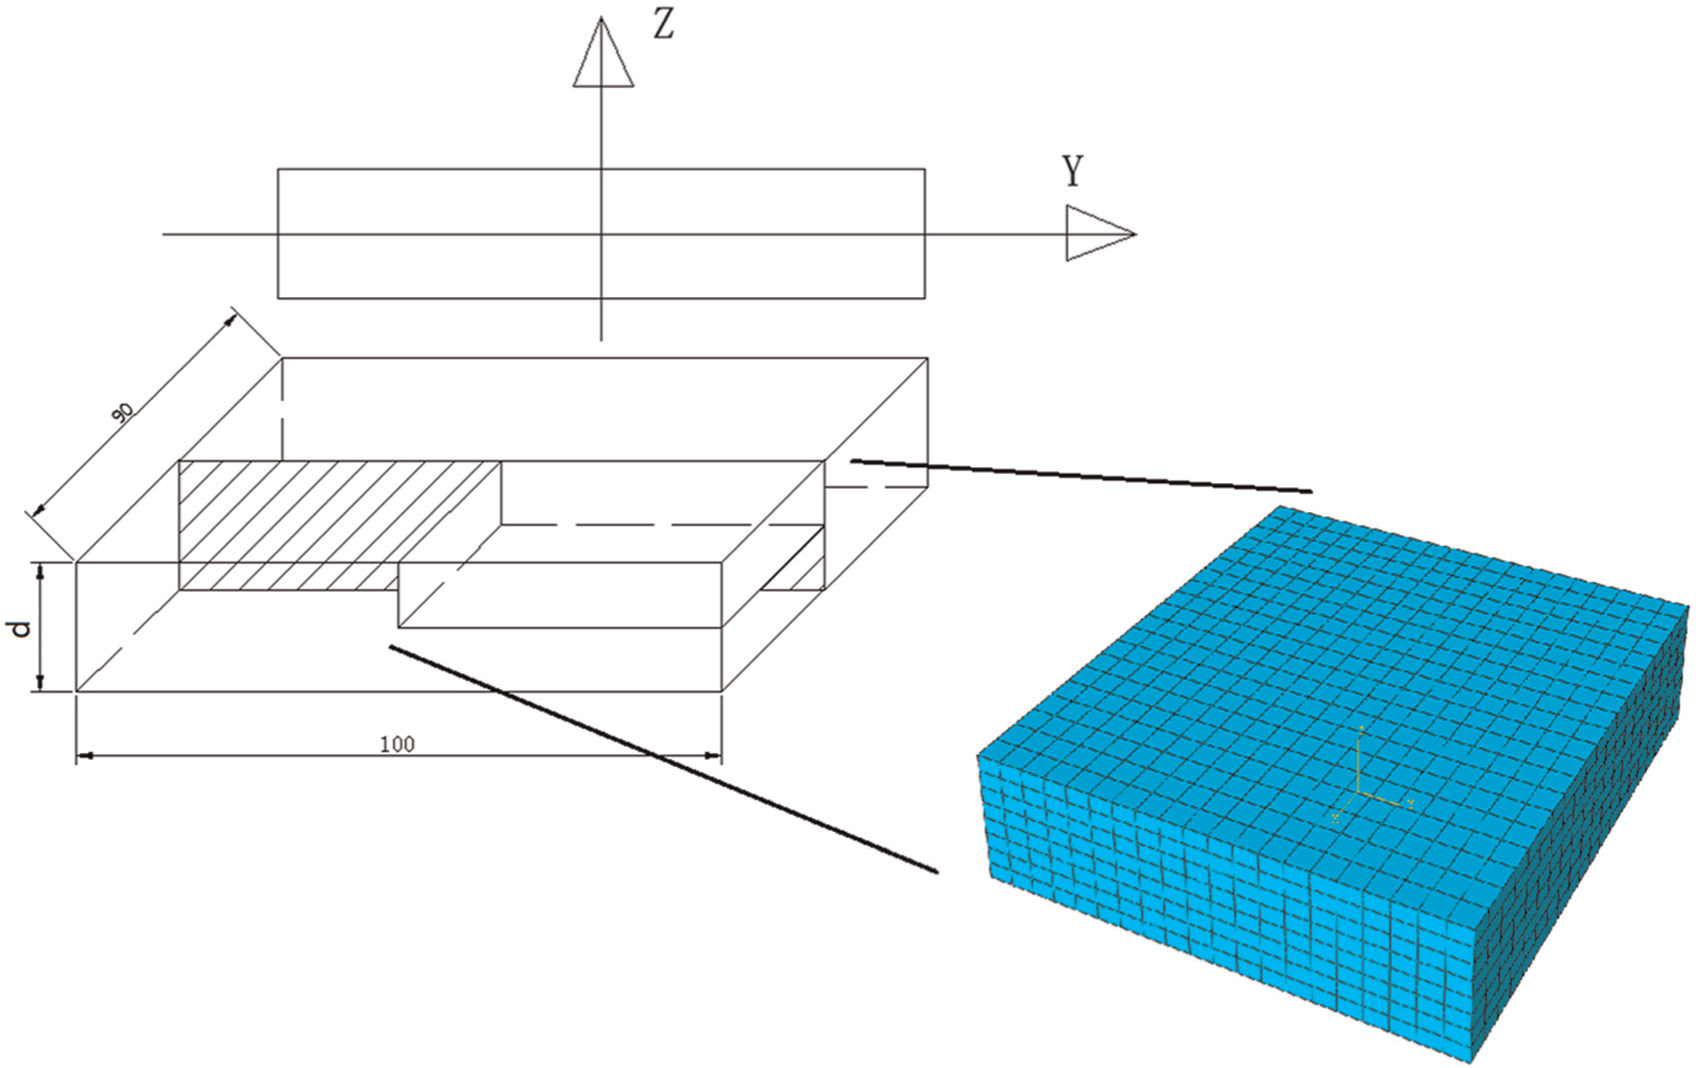
Finite element model, block shape and mesh.
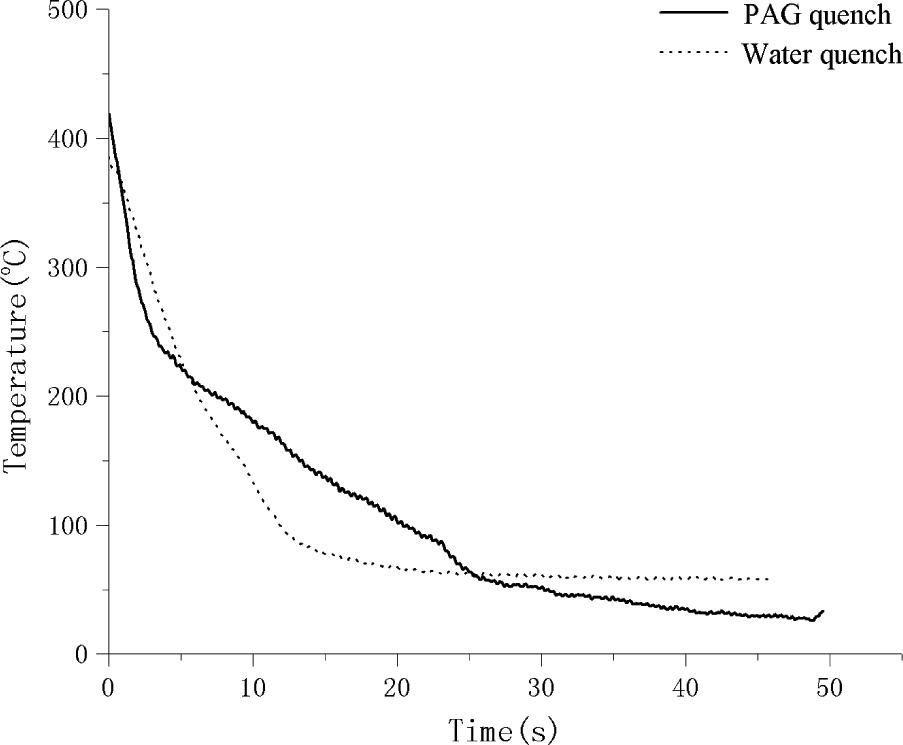
During the simulation, Von Mises yield criterion was used to determine whether the material yielded or not. The Von Mises yield criterion can be expressed as
where
Determination of HTC curves
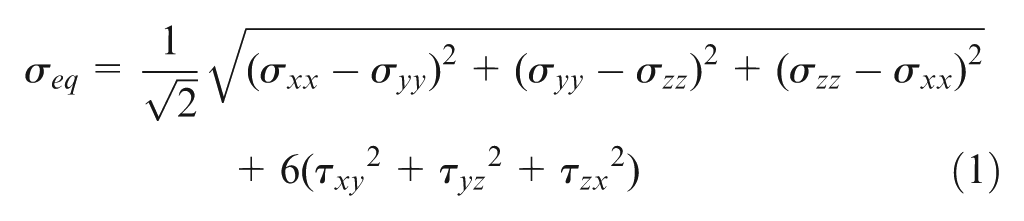
The HTC cannot be measured directly; thus, there are two steps to determine the HTC curves. First, an experiment was carried out to measure the cooling curves of aluminum blocks during quenching process. In this experiment, two 2024 aluminum blocks (block 1 and block 2) of 100 mm × 90 mm × 50 mm were used for the measurement of cooling curves. One blind hole was drilled on each aluminum block to place the thermocouple, as illustrated in Figure 3.
Position and size of the blind hole.
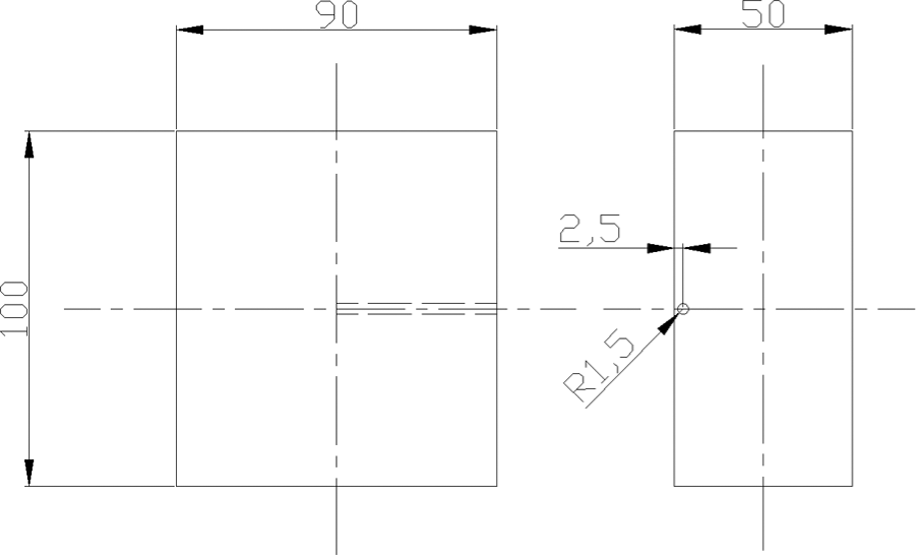
The two blocks were slowly heated in a heat-treatment furnace from room temperature to 470 °C, which was above the recrystallization temperature of 2024 aluminum alloy. To assure the uniformity of temperature and phase condition throughout the entire volume, the temperature was held at 470 °C for another 2 h. Then the heated blocks were taken out of the heat-treatment furnace and thermocouples were quickly planted in the pre-drilled blind holes. Block 1 was quenched into warm water and block 2 was quenched into PAG solution with stirring. The data acquisition (DAQ) card connected to the thermocouples collected the cooling curve data and a PC was used to store the data. The cooling curves acquired were illustrated in Figures 3 and 4, while the sampling frequency of DAQ card was set to 20 Hz.
Cooling curves.
As illustrated in Figures 4 and 5, the moment aluminum blocks immersed into the quenching media was defined as time 0. The blocks suffered a sudden drop in temperature at the beginning of the quenching process, and then the cooling speed decreased with increasing time. The initial temperature of cooling curves was lower than the ideal situation (470°C) because the surface temperature of the blocks dropped after they were taken out of the heating furnace. However, the temperature difference between the thermocouple and heated blocks also led to temperature drop of the blocks. The shape of two curves displayed a significant difference, which indicated the different heat-transfer characteristics of two quenching media.
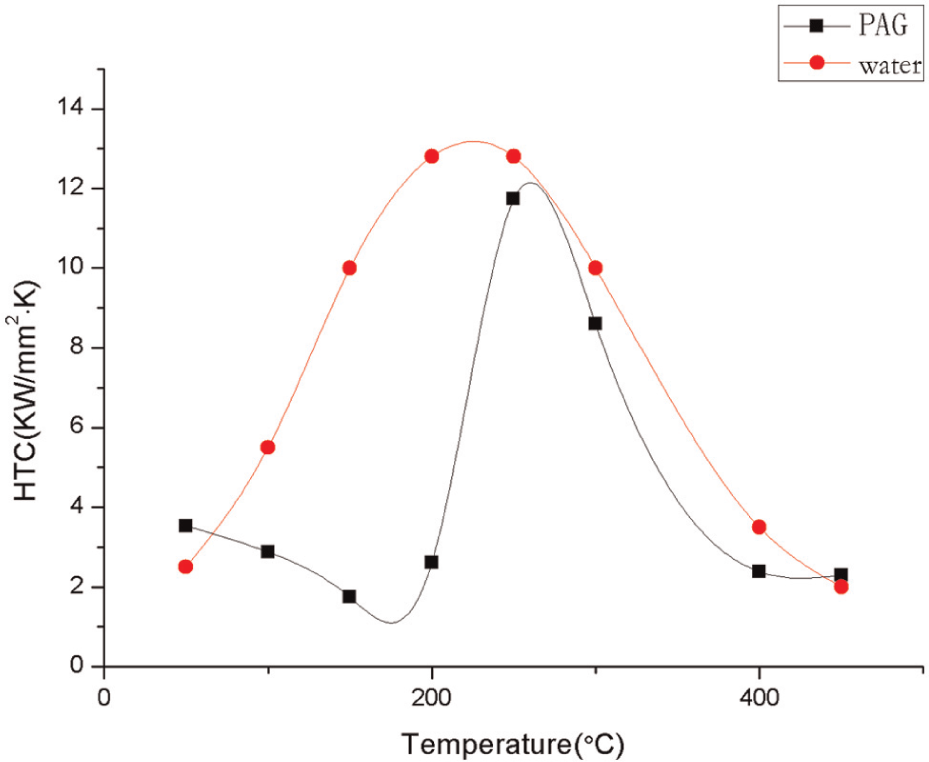
Water and PAG quench HTC curves.
After the cooling curves were obtained, the inverse heat-transfer analysis was performed using DEFORM-3D. During this process, surface temperatures at the thermal couple location were used as boundary conditions for each solving step, and the HTCs between block surface and quench media were exported as calculation results.
The HTCs were set as a function of temperature of the block surface. The cooling curves were used as input data in the analysis and the HTC curves were obtained. As shown in Figure 5, the shape of the HTC curves differed under various quench conditions, which meant that different heat-transfer characteristics existed in different quench media and this might result in different residual stress distribution after quenching.
FEM analysis
In this study, the FEM analyses were performed for both water and PAG quench process. In the water quench process, aluminum blocks of 2024 alloys with a temperature of 470 °C were immersed in water at a temperature of 50 °C until the aluminum block was cooled down to a unified temperature. In the PAG quench process, the heated blocks were immersed in 15% PAG solution at a temperature of 20 °C. A coupled temperature–displacement analysis was performed to determine the temperature variations as a function of time during quenching (heat-transfer analysis) and calculate residual stress due to temperature changes (stress analysis).
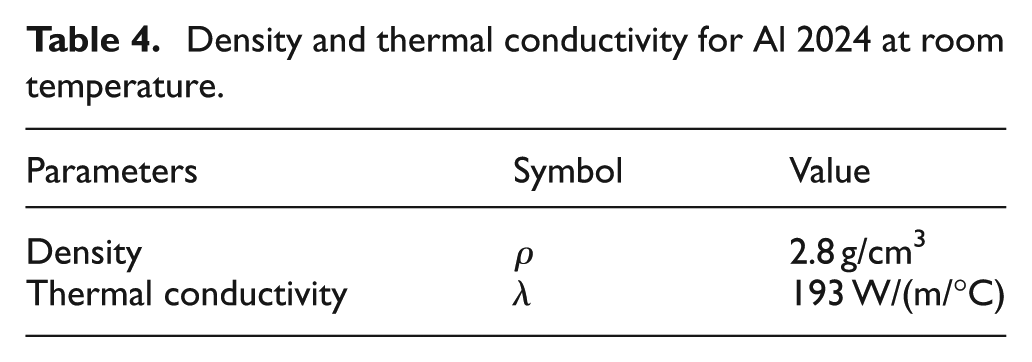
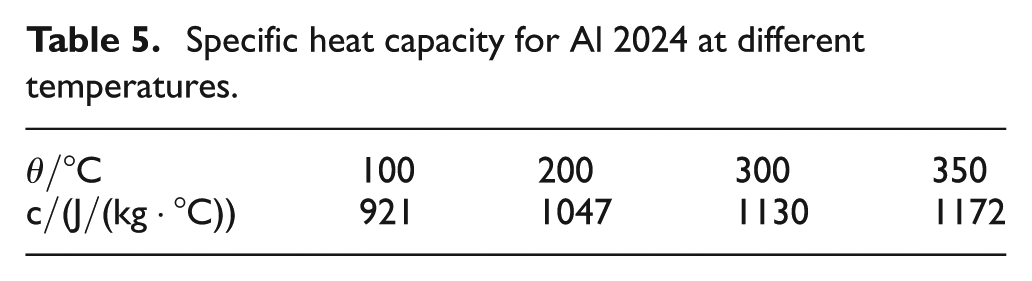
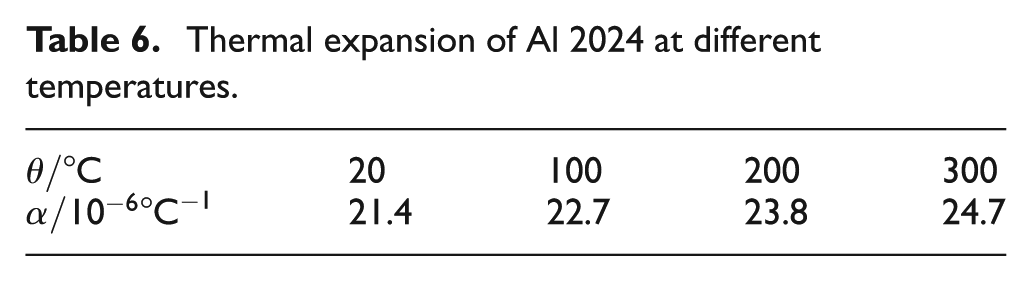
As mentioned in section “Description of the quenching process,” blocks with different thicknesses (10, 20, 30, 40, 50, 60, and 70 mm) were used in this study to analyze analyze the influence of thickness on residual stress. Tables 4–7 describe the material properties used in this study, and the data were taken from the Practical Handbook of Engineering Materials 36 (2001). Table 8 shows the mechanical properties of alloy 2024. These parameters were measured with a Gleeble 1500 thermal simulator and tensile strength tester.
Density and thermal conductivity for Al 2024 at room temperature.
Specific heat capacity for Al 2024 at different temperatures.
Thermal expansion of Al 2024 at different temperatures.
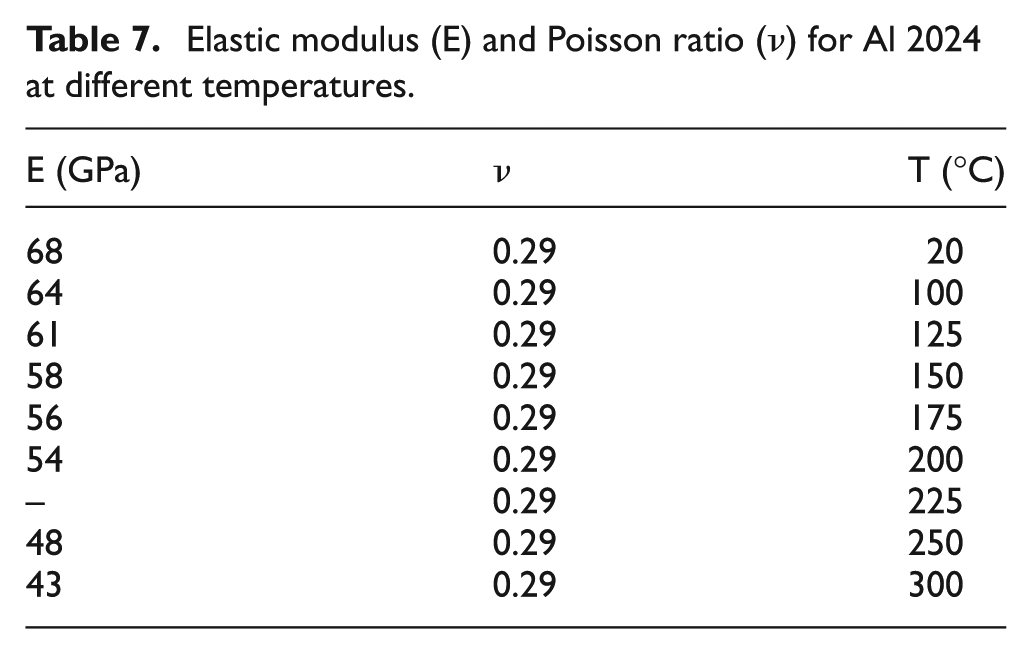
Elastic modulus (E) and Poisson ratio (ν) for Al 2024 at different temperatures.
Stress–strain values for Al 2024 at room temperature and yield strength at different temperatures.
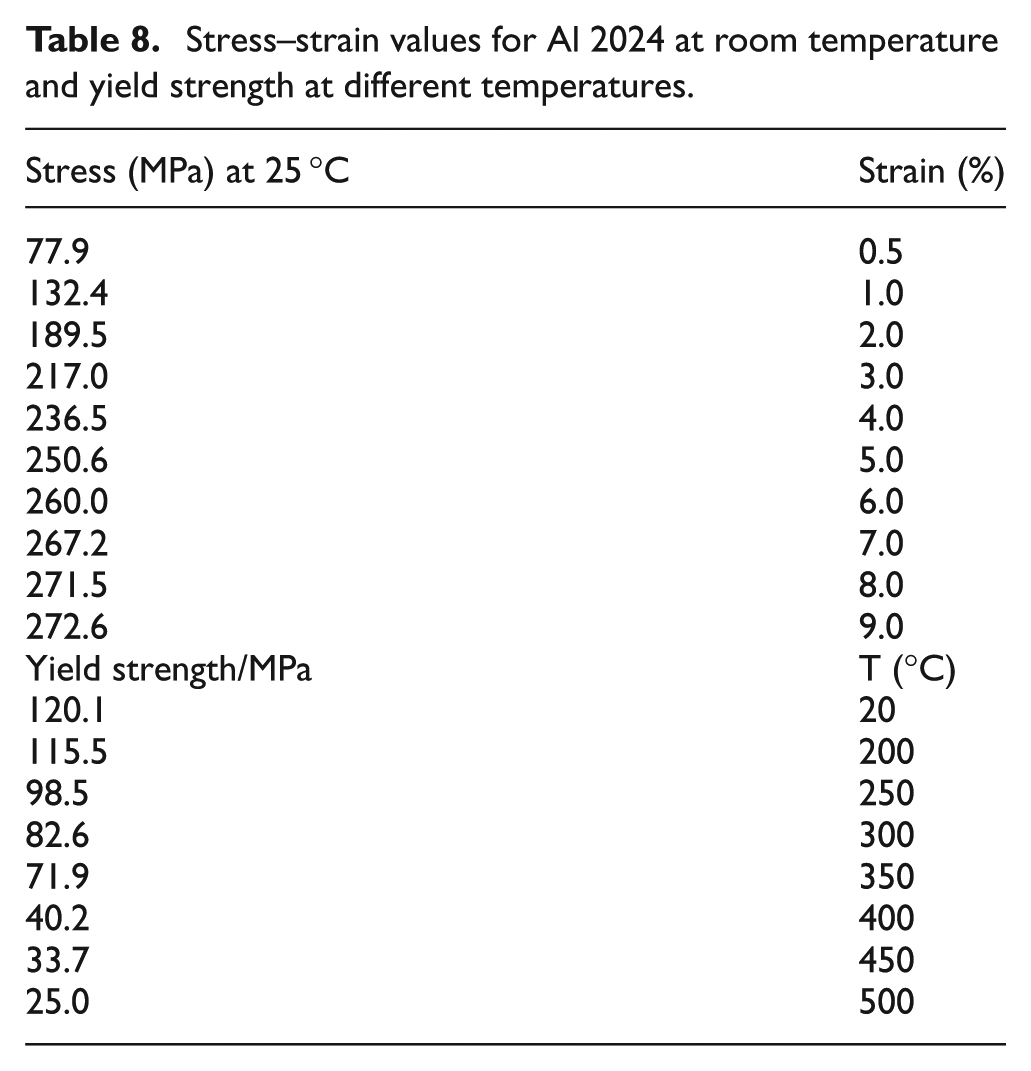
In this study, a coupled thermal–mechanical analysis was carried out. Before the simulation, the aluminum blocks were set to a uniform temperature of 470 °C using a predefined temperature field. The displacement boundary condition and heat-transfer boundary condition were also set on the relevant faces. It was assumed that no heat flux went across the symmetric planes. At the beginning of simulation, the environment temperature were set to 50 °C under water quench condition (20 °C under PAG quench condition), and then the thermal analysis was performed over a specific time step; the thermal data listed in Tables 4 and 5 were used to calculate the temperature field. After that, the mechanical analysis was performed, and the data listed in Table 6 were used to obtain the deformation field throughout the block. The σ–ε curves under different temperatures obtained by a Gleeble 1500 thermal simulator were imported into the model in a tabular form, which represented the material mechanical properties of aluminum alloy 2024 at elevated temperatures. Besides, the hardening behavior of the material was also represented by the σ–ε curves, to a specific strain, the code could acquire the stress under a certain temperature through interpolation. The data in Table 8 were then used to decide whether the material would yield. The FE code automatically moves on to the next time step to continue the calculation.
Results and discussion
Quench simulation
In accordance with the experimental conditions, blocks of different thickness were heated over the recrystallization temperature, and sunk into warm water and 15% PAG solution in the simulation experiment.
Figure 6 shows the residual stress distribution in d = 50 mm PAG quench block. The block suffered compressive stress on the surface and tensile stress in the center; this was in reference to the temperature gradient during quenching process, which was well proved by former researchers. 4 The center of the block suffered high-level biaxial tensile stress, 147.6 and 134.1 MPa on the x- and y-directions, respectively. Such high level of tensile stress is negative to part quality and may incur quench crack or crack in following machining.
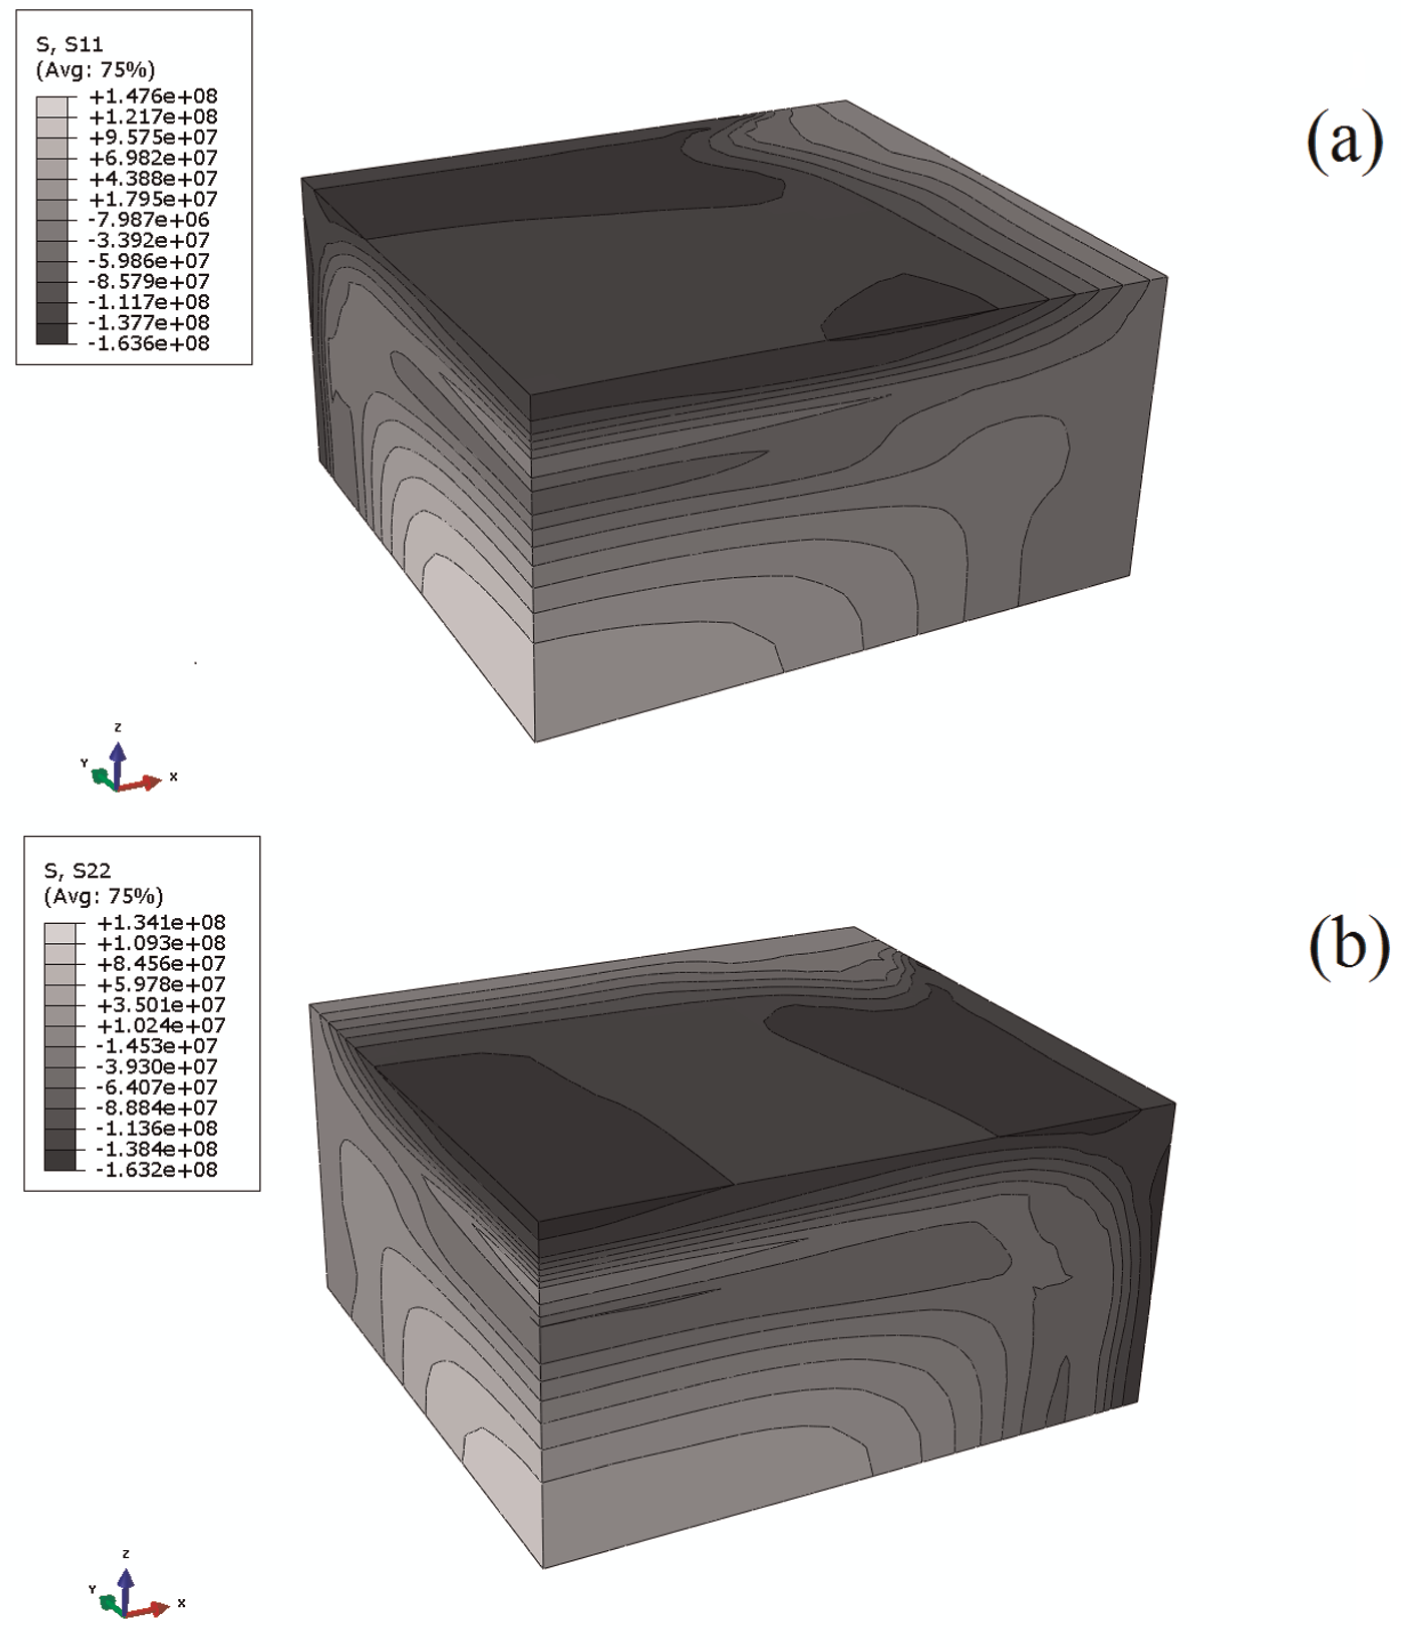
Residual stress distribution in d = 50 mm polyalkylene glycol quench block: (a) x-component stress and (b) y-component stress.
As shown in Figure 7, the center of 100 mm × 90 mm face (key point B) and the geometric center of the blocks (key point A and C) were selected as key points on the block to determine the residual stress change both on the surface and in the core.
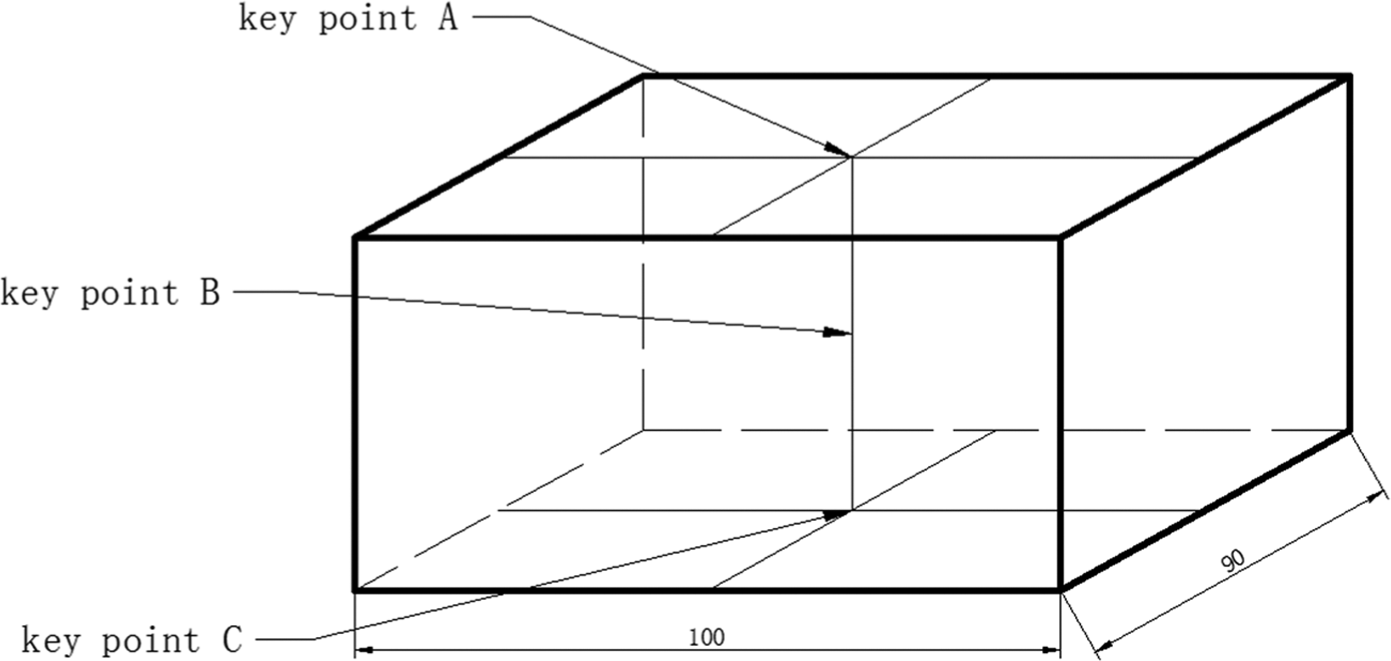
Position of the key points.
The simulation results of residual stress in water-quenched blocks were shown in Figures 8–10. The magnitude of quenching residual stress rose as the thickness of the blocks increased. The quench residual stress at point A and B increased by 21.4% and 64.5%, respectively, when the thickness of blocks was up from 20 mm to 50 mm. This was because larger dimension resulted in higher temperature gradient and eventually higher residual stress level. When the thickness increased from 50 mm to 70 mm, residual stresses at point A and B slightly decreased 5.6% and 8.4%, respectively. This is because that the temperature gradient between center and surface was affected by the cool-down rate. For different thickness, there were two stages: first, cool-down rate of the center strongly decreased as the block got thicker; and second, the block was thick enough that the cool-down rate of the center did not decrease as much even though the block became thicker. Initially, the residual stress increased along with thickness; thereafter, the residual stress would not increase much even if the block thickened.
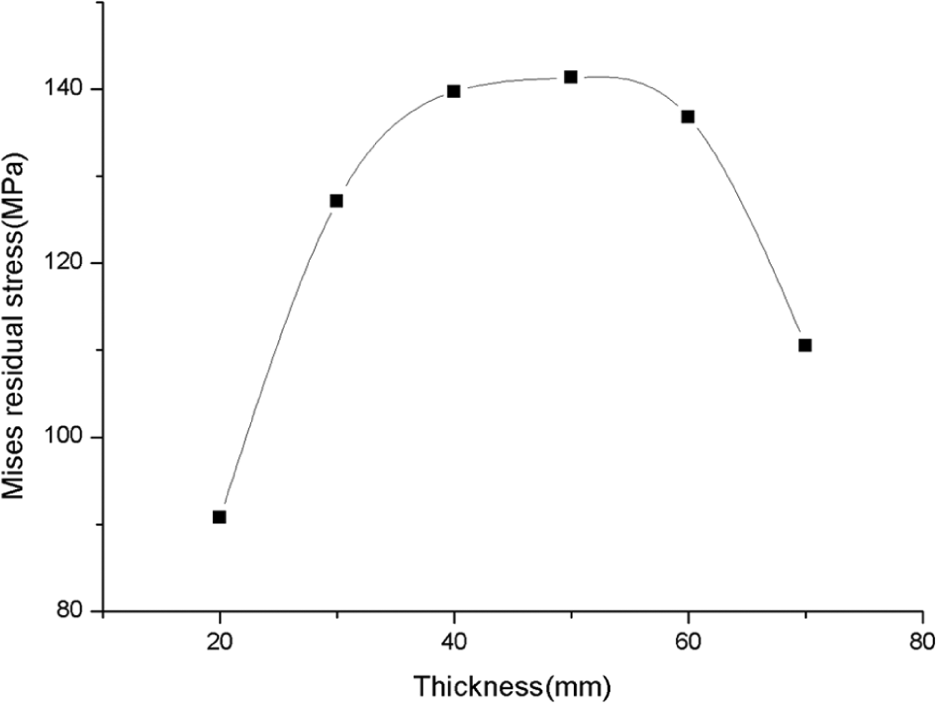
Water quench residual stress curve at key point B (Mises principal).
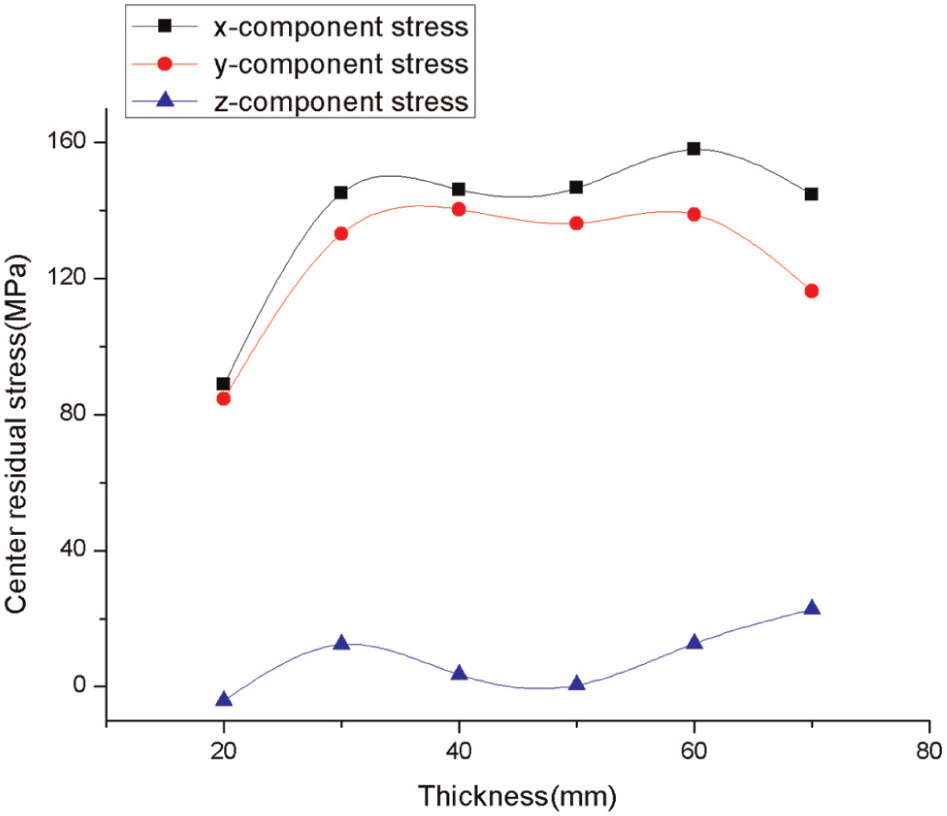
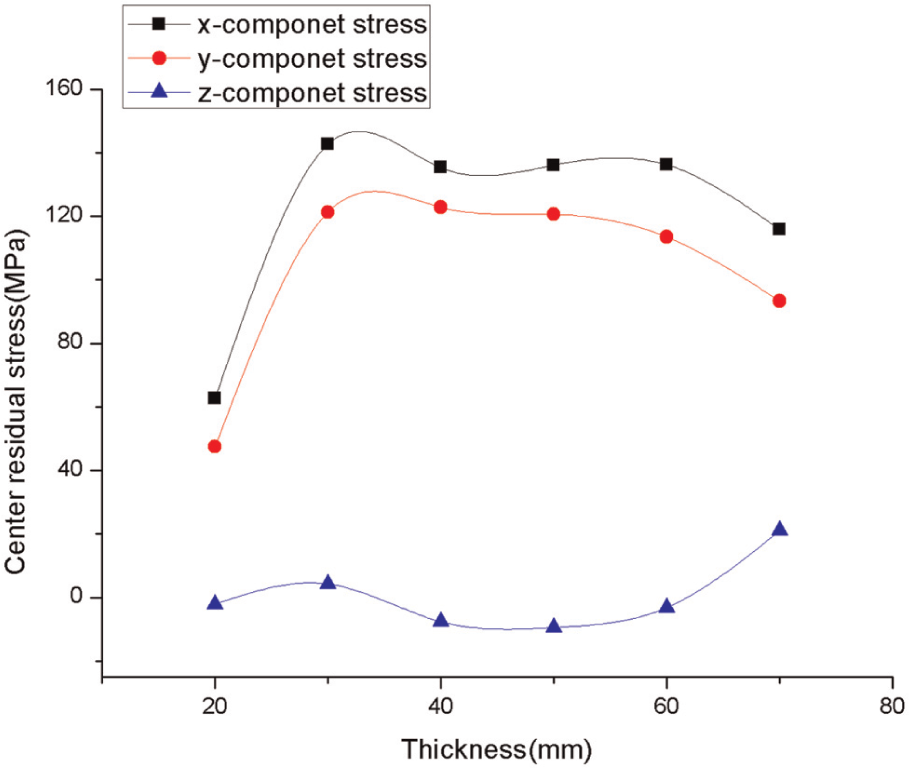
x-, y-, and z-component residual stress curves at key point B (water quench).
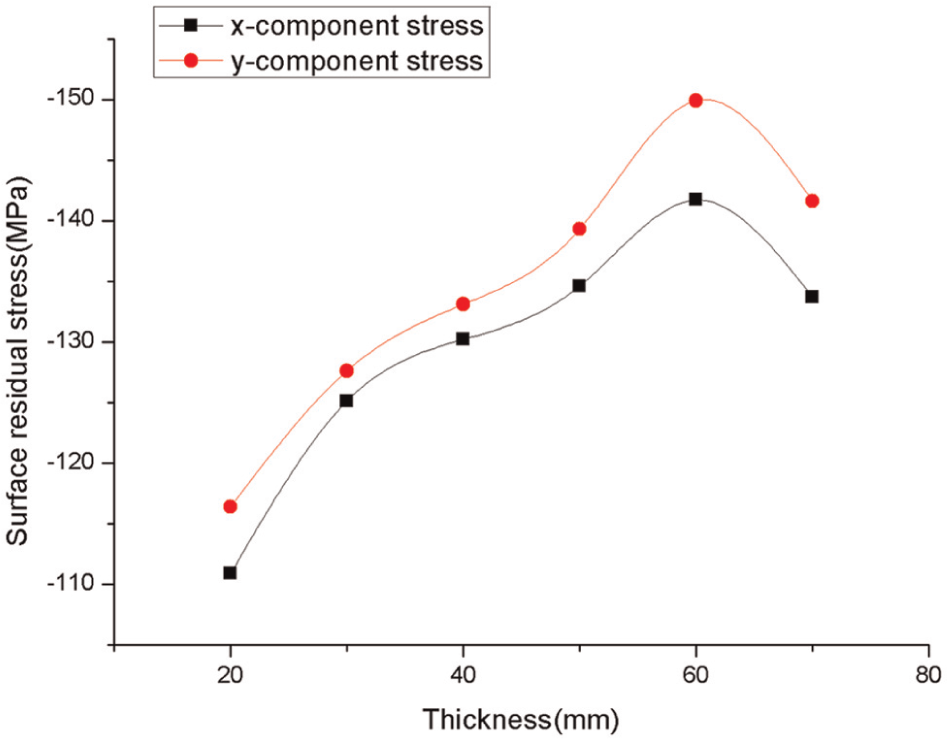
x- and y-component residual stress curves at key point A (water quench).
Figures 11–13 show the simulation results of residual stresses in the PAG-quenched blocks, which displayed a similar trend to the water quench cases. However, in d = 20 and 30 mm cases, the surface residual stress caused by PAG quench conditions was lower by 70 and 50 MPa compared with that under water quench condition, respectively, which meant that the PAG quench condition was more conductive to residual stress reduction than water quench condition. This was most likely due to the inverse solubility of PAG in water. A film of solute PAG was formed on the surface of blocks with temperature increasing. Thus, the heat flux through block surface was reduced; in turn, lower temperature gradient and lower residual stresses were formed. When the thickness of the blocks was between 30 mm and 50 mm, little difference was observed. In addition, z-component residual stress was proven to be small enough to disregard both for water and PAG quenching; therefore, it was omitted in most figures.
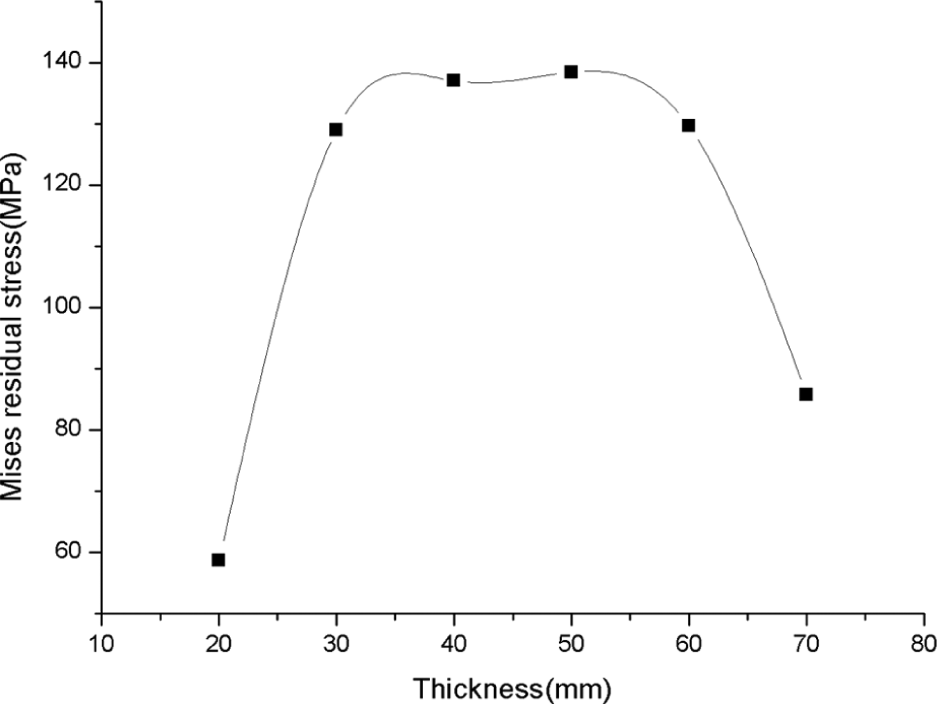
Polyalkylene glycol quench residual stress curve at key point B (Mises principal).
x-, y-, and z-component residual stress curves at key point B (polyalkylene glycol quench).
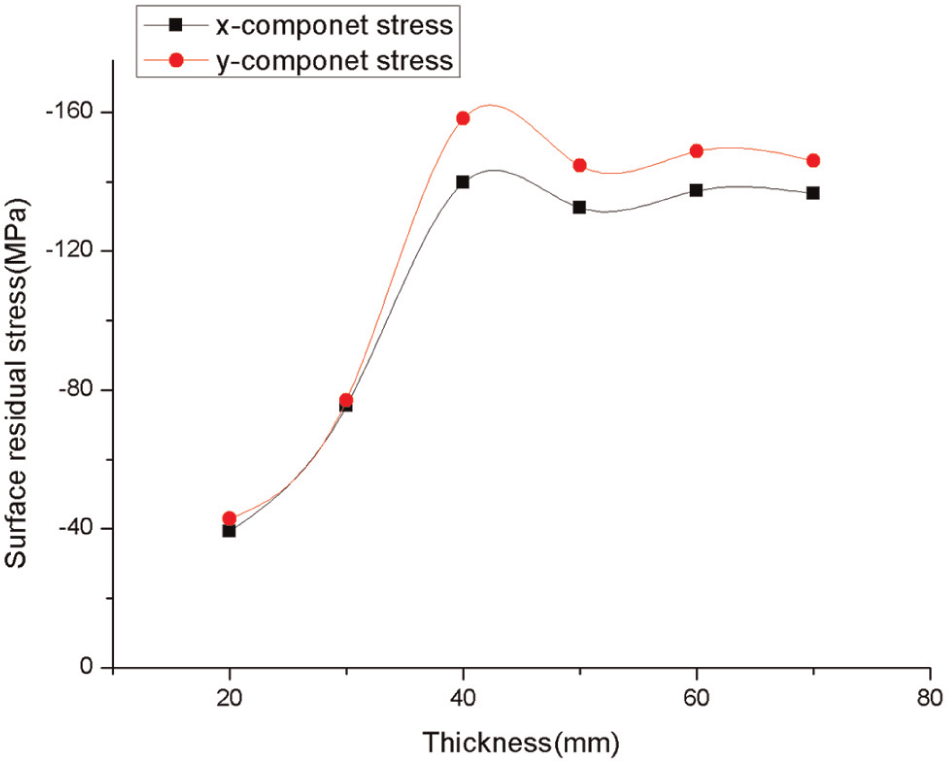
x- and y-component residual stress curves at key point A (polyalkylene glycol quench).
Determination of residual stress by X-ray diffraction method
The X-ray diffraction technique is one of the most widely used nondestructive methods for residual stress determination. In the X-ray diffraction residual stress measurement, the strain in the crystal lattice is measured, and the residual stress producing the strain is calculated, assuming a linear elastic distortion of the crystal lattice. According to Bragg’s law

where n is an integer denoting the order of diffraction,
In this study, the X-ray diffraction method was used to determine residual stress that developed after quenching for the validation of simulation results. The X-ray diffraction stress measurement is confined to the surface of the sample. A condition of plane stress is assumed to exist. That is, a stress distribution described by principal stresses
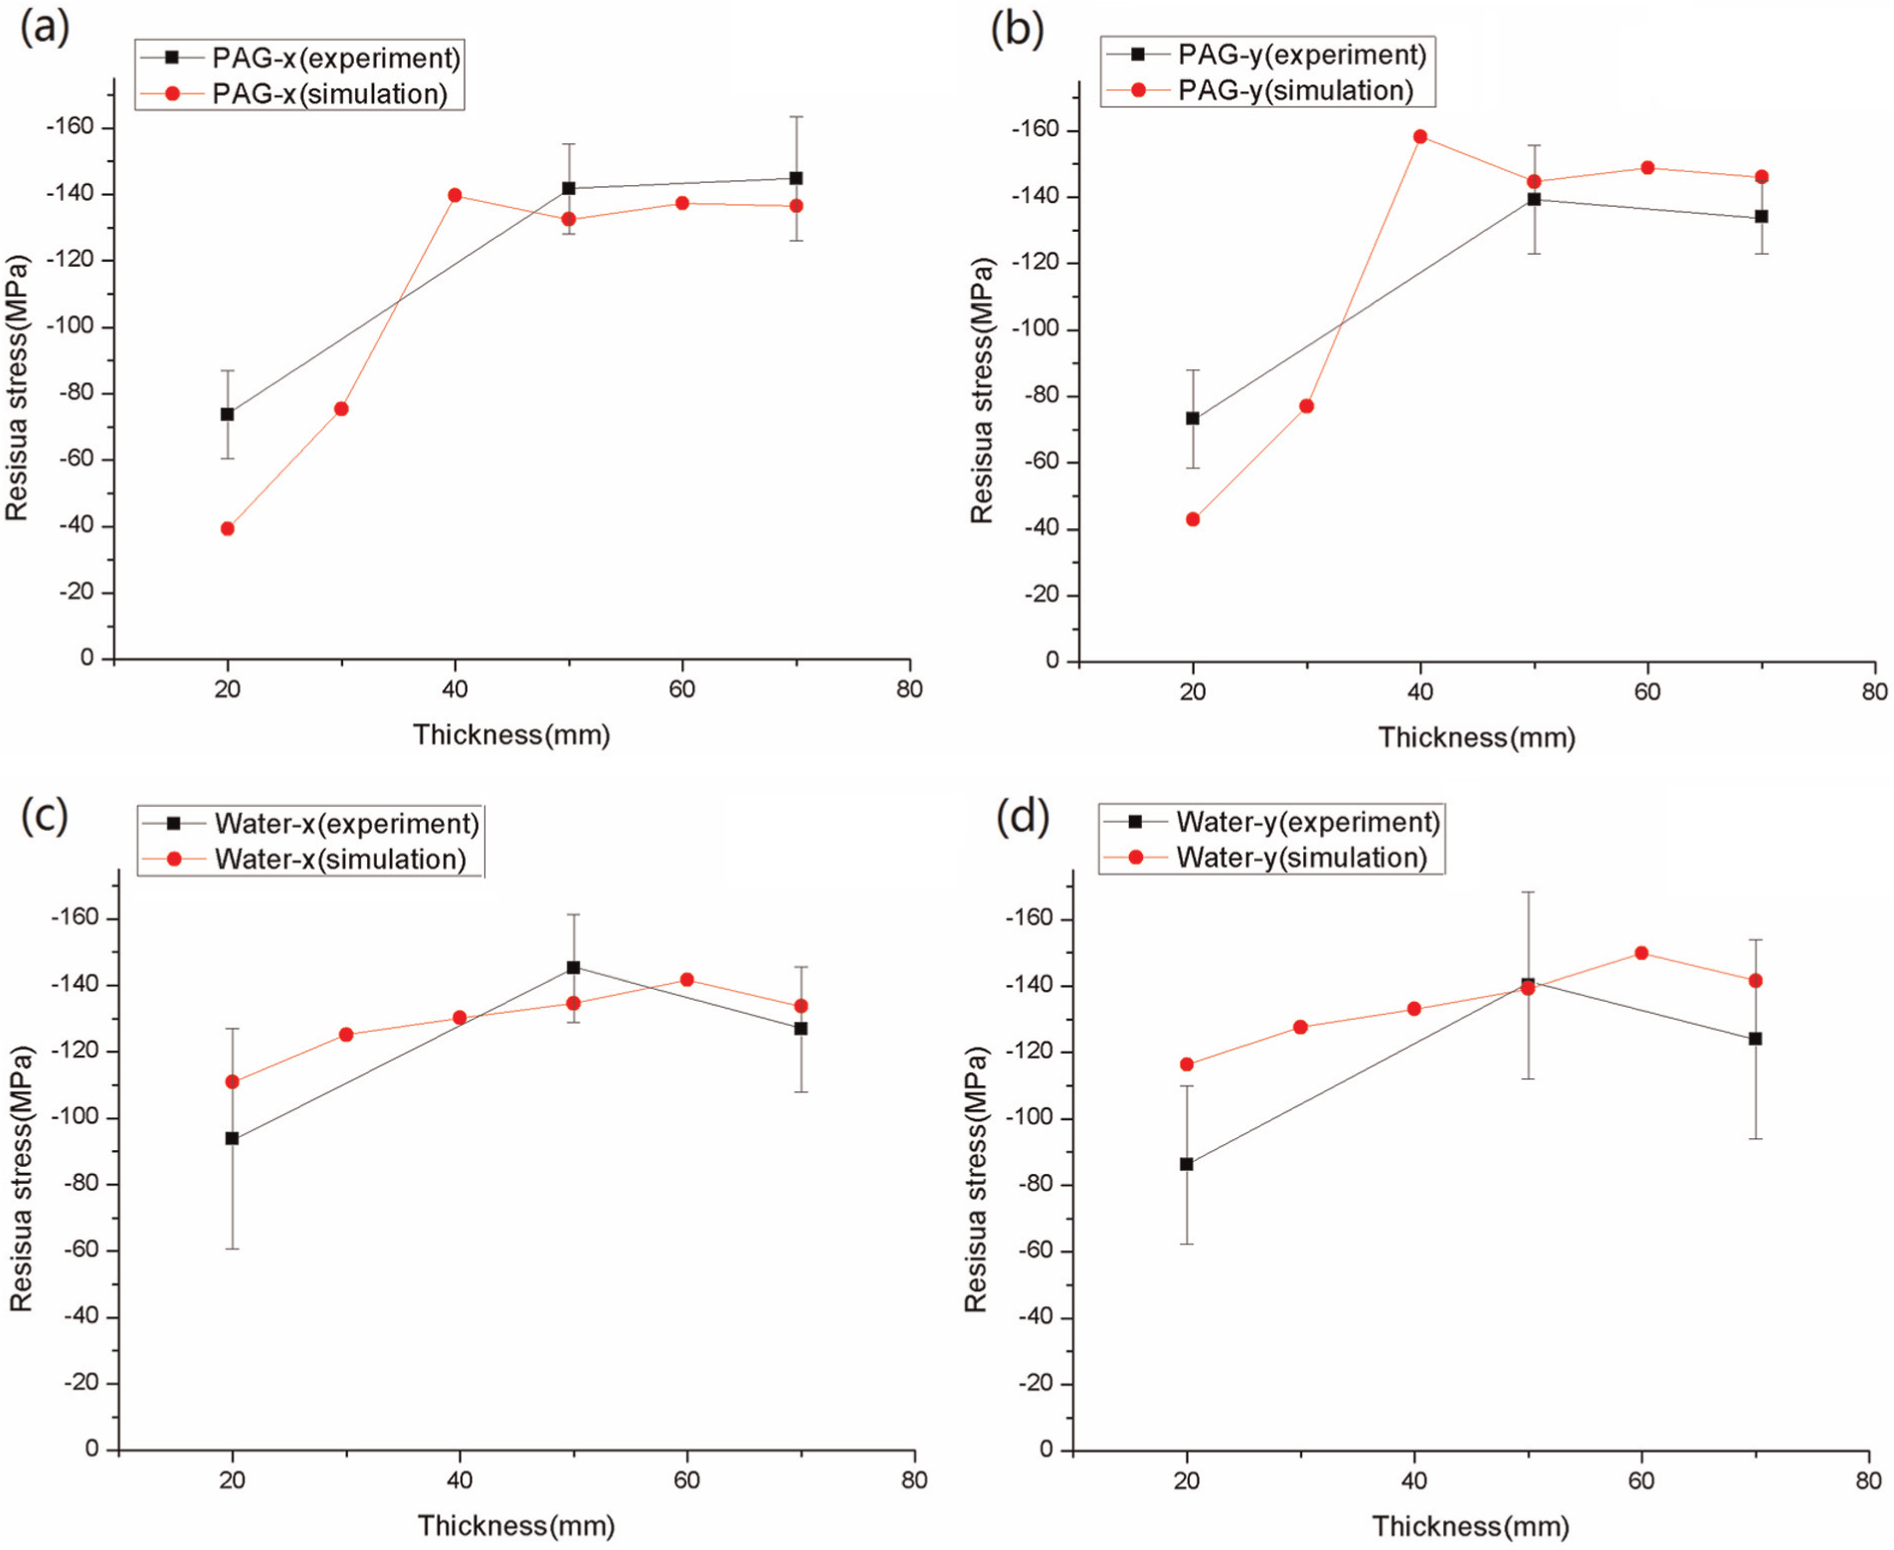
Comparison of simulated values and measured results of residual stress: (a) PAG quench x-component; (b) PAG quench y-component; (c) water quench x-component; and (d) water quench y-component.
As the figures illustrated, the simulated values were consistent with the experimental measurements for the 100 mm × 90 mm × 50 mm and 100 mm × 90 mm × 70 mm blocks with a deviation of approximately 20 MPa at worst for both the water quench and the PAG quench cases. However, for the 100 mm × 90 mm × 20 mm blocks, a deviation of 30 MPa existed; this might be caused by the inaccuracy of the HTC values at low temperature. In future research, more factors that affect the HTC values such as geometric shape and surface condition of quenched part will be considered.
Both the experimental measurements and simulation results obeyed the same rules that the magnitude of quenching residual stress rose nonlinearly as the thickness of the blocks increased. For example, the value of x-component residual stress of PAG quench condition increased to 70 and 100 MPa, respectively, according to experimental value and predicted value, when thickness of the blocks increased from 20 to 50 mm. On the contrary, residual stress did not increase much as the thickness increased from 50 to 70 mm.
Conclusion
The comparison of experimental and FEA results for the quenching process indicates that the 3D FEM simulation of quenching process through FEM can be achieved with reasonable accuracy as long as the thermal and material properties of specimens are known. Compared with experiments that require experts and expensive equipments, the FEA is cheaper and more efficient. Comparison of simulation results suggests that the thickness and quench media have a great effect on residual stress distribution. The results of this study can be summarized as follows:
The thermal boundary condition of aluminum-quenching process can be simplified as heat-convection process. Current model using different HTC curves to represent different quench media was proved to have reasonable accuracy as long as the HTC values were accurate.
Quenching residual stress rose as the thickness of the blocks increased until block thickness reached 50 mm, that is, when the thickness is below 50 mm, the thicker the block, the higher the residual stress. When the thickness is above 50 mm, the increase of residual stress is insignificant.
Different quench media also result in different residual stress values. In d = 20 and 30 mm cases, the surface residual stress caused by the PAG quench conditions were lower by 70 and 50 MPa compared with that under water quench condition, respectively. This indicates that for 2024 blocks, the PAG solution is more conductive to residual stress reduction than water.
Footnotes
Acknowledgements
Support for this research was provided by Beijing Institute of Control Engineering.
Funding
The authors thank Beijing Institute of Control Engineering for sponsoring this research.