
Abstract
Manufacturing managers are continuously trying to decrease production costs by focusing on activities and resource costs besides the relevant cost drivers. Through a case study, we show how to implement activity-based costing and time-driven activity-based costing techniques in a production planning problem environment. The results can significantly reduce production costs and improve manufacturing profitability index.
Keywords
Introduction
One of the key challenges in production planning problems is the lack of an advanced cost-accounting system to calculate total cost of activities and determine the effects of unused capacity of resources on production total cost, particularly in multiproduct multiperiod (MPMP) problems. Two significant techniques commonly used are activity-based costing (ABC) and time-driven activity-based costing (TDABC).
ABC is a cost calculation technique that allocates resource costs to activities based on resource consumption rate. Cooper and Kaplan described ABC as an approach to solve the problems of the traditional cost management systems. Everaert et al. 1 and Kaplan and Anderson 2 argued that managers irritated of high time and cost should update and execute ABC. TDABC is another model proposed by Kaplan and Anderson.2,3 The breakthrough of TDABC lies in the usage of time-oriented equations in order to estimate the amount of time spent by resources and activities. 1 Recently, health-care organizations have started to invest in advanced cost-accounting systems such as ABC and TDABC. 4 However; most studies on different contexts have relied on the traditional ABC systems. Most researches have been done in health-care organizations. However, only a few studies have focused on production planning problems. Therefore, in this article, we examine the applicability of ABC and TDABC in production planning. The theme of this study is to develop Noori’s proposed model to make it more applicable and flexible. This article attempts to determine production profitability trend by applying advanced managerial accounting approaches.
Research methodology
Basically, the MPMP problem can be converted into a project scheduling in which capacity constraints are taken into consideration. Therefore, in order to determine total cost and total rate of production based on these capacities with linear programming (LP) models and simulation runs, 12 steps should be taken into account based on the study of Noori et al. 5 Then, after obtaining the optimized total cost (step 1), ABC and TDABC phases are started. The steps applied in this article are summarized in the following (as shown in figure 1).
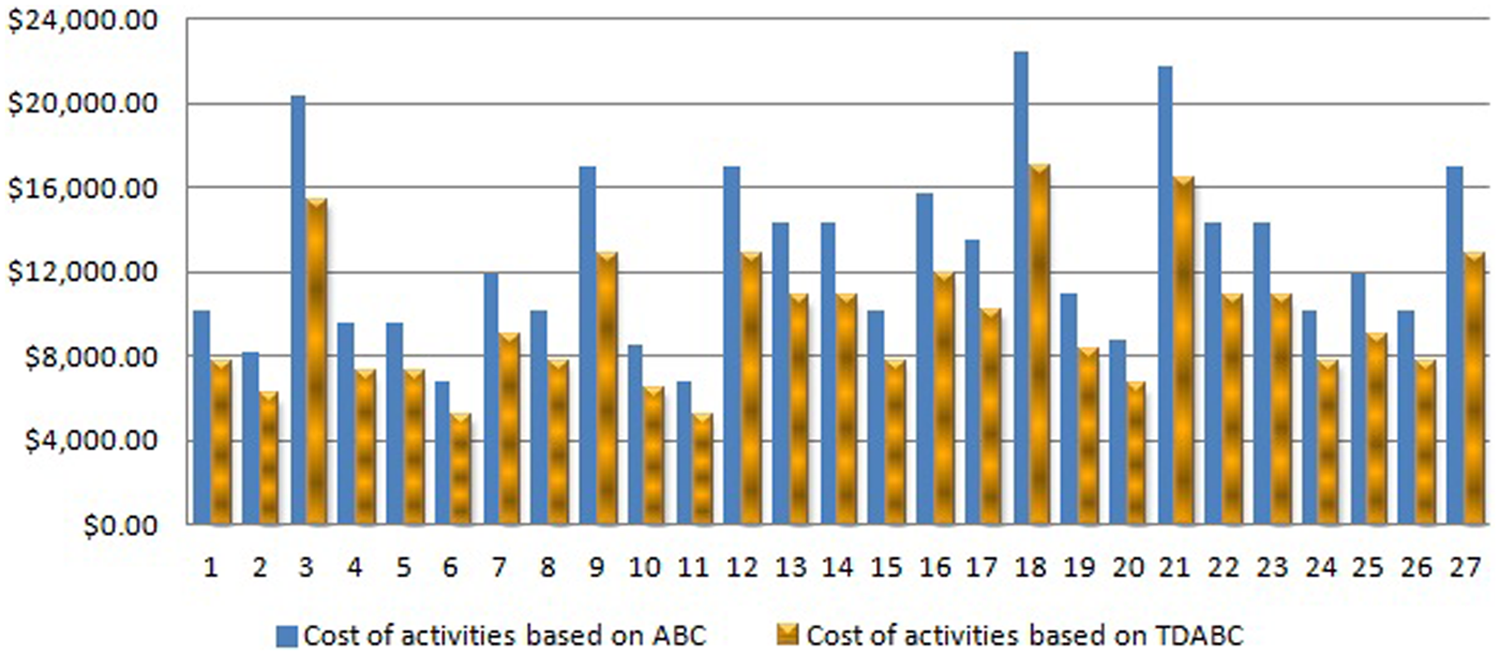
Comparison between results obtained by ABC and TDABC.
ABC steps are as follows:
Step 1. Run the steps proposed by Noori et al. 5
Step 2. Identify the different overhead activities
Step 3. Assign the overhead costs to the different activities using a resource driver
Step 4. Identify the activity driver for each activity
Step 5. Determine the activity driver rate by dividing the total activity costs by the practical volume of the activity driver
Step 6. Multiply the activity driver rate by the activity driver consumption to trace costs to orders, products, or customers
TDABC steps are as follows:
Step 1. Run the steps proposed by Noori et al. 5
Step 2. Identify the various resource groups
Step 3. Estimate the total cost of each resource group
Step 4. Estimate the practical capacity of each resource group
Step 5. Calculate the unit cost of each resource group by dividing the total cost of the resource group by the practical capacity
Step 6. Determine the time estimation for each event, based upon the time equation for the activity and the characteristics of the event
Step 7. Multiply the unit cost of each resource group by the time estimate for the event
More details are provided by Everaert et al. 1 An activity cost driver (ACDR) introduced in step 4 of ABC is any factor that directly explains the cost incurred by the activity.
The ACDR for one activity is calculated using the following equation
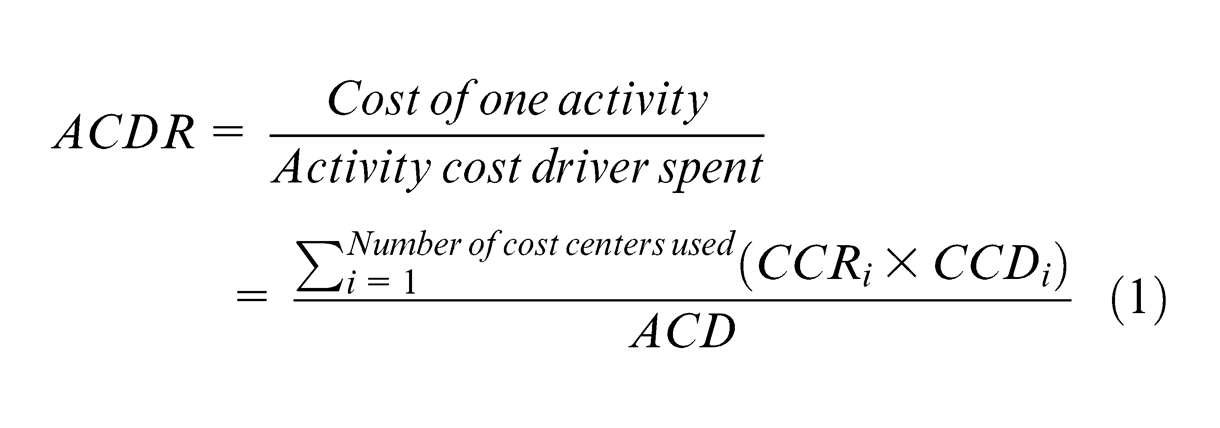
where CCDi is the amount of the driver of center i used for the activity, and ACD is the amount of the ACDR used.
Case study and discussion
The optimized total cost obtained according to the LP model proposed by Noori et al. 5 is used in the following case. The application of this model is to utilize the remaining capacity of the machining centers and maximize the total production rate and total production cost. It must be noted that the main reason for applying the aforementioned LP model is the good performance in comparison with other related models available in the study of Byrne and Bakir. 6
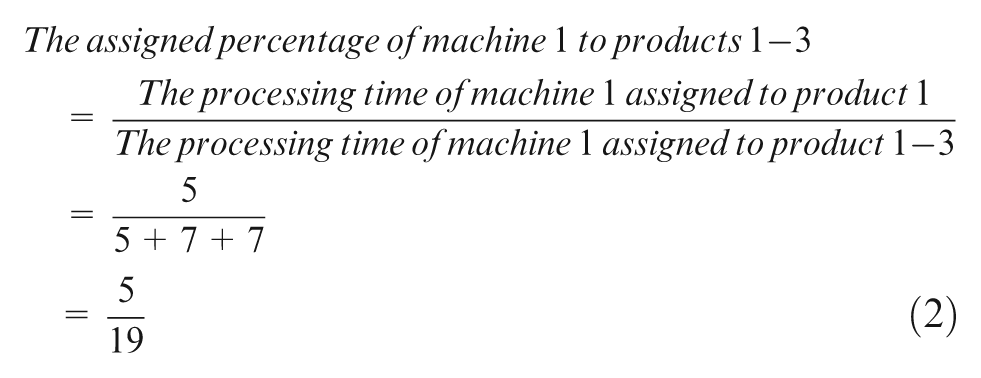
In this article, a case study as given in the study of Noori et al. 5 is examined. The objective is first to check the feasibility of applying ABC and TDABC techniques as given in the mentioned reference. Second, the aim is to compare the strength and weakness of these two techniques with mathematical models proposed in the study of Noori et al. 5 The case study is a three-period three-product production planning problem that has to be processed through four machining centers each of which includes a machine and an input buffer. The capacity constraint for each machine is equal to 2400 min per week. The cost component coefficients for each product, at each period; customer demand; and processing times are listed in tables 2 to 4 according to what Noori et al. 5 explained. All the calculations are performed with regard to the initial data given in the study of Noori et al. 5 Transforming the data in the tables from MPMP problem to project scheduling, a Gantt chart with 27 activities with different times and ordering assigned machines were produced according to table 5 and figure 2. Capacity analysis for four machines also has been shown in the mentioned reference in figures 3 to 6. It must be noted that 2400 min per week is equal to 480 min per day if five working days assumed. With regard to calculations done in the study of Noori et al., 5 total cost (× 1000) for the developed LP model is 346. The percentage of resources assigned to each product based on table 3 5 is calculated using the following equations. Equation (2) shows the procedure as an example for machine 1.
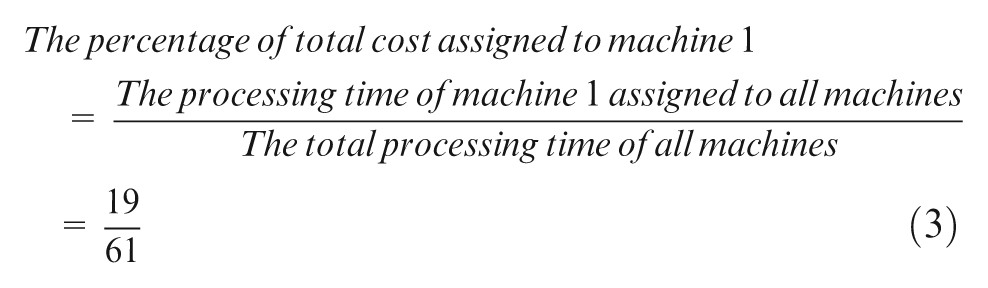
Distribution of total cost to each machine also obtained based on equation (3) as an example for machine 1.
In Table 1, the percentages of total cost assigned to different machines and products are shown. For example, cost for the activity P1–Pr1–MC1 based on the steps proposed in section “Research methodology” is calculated as follows
Calculations based on ABC and TDABC.
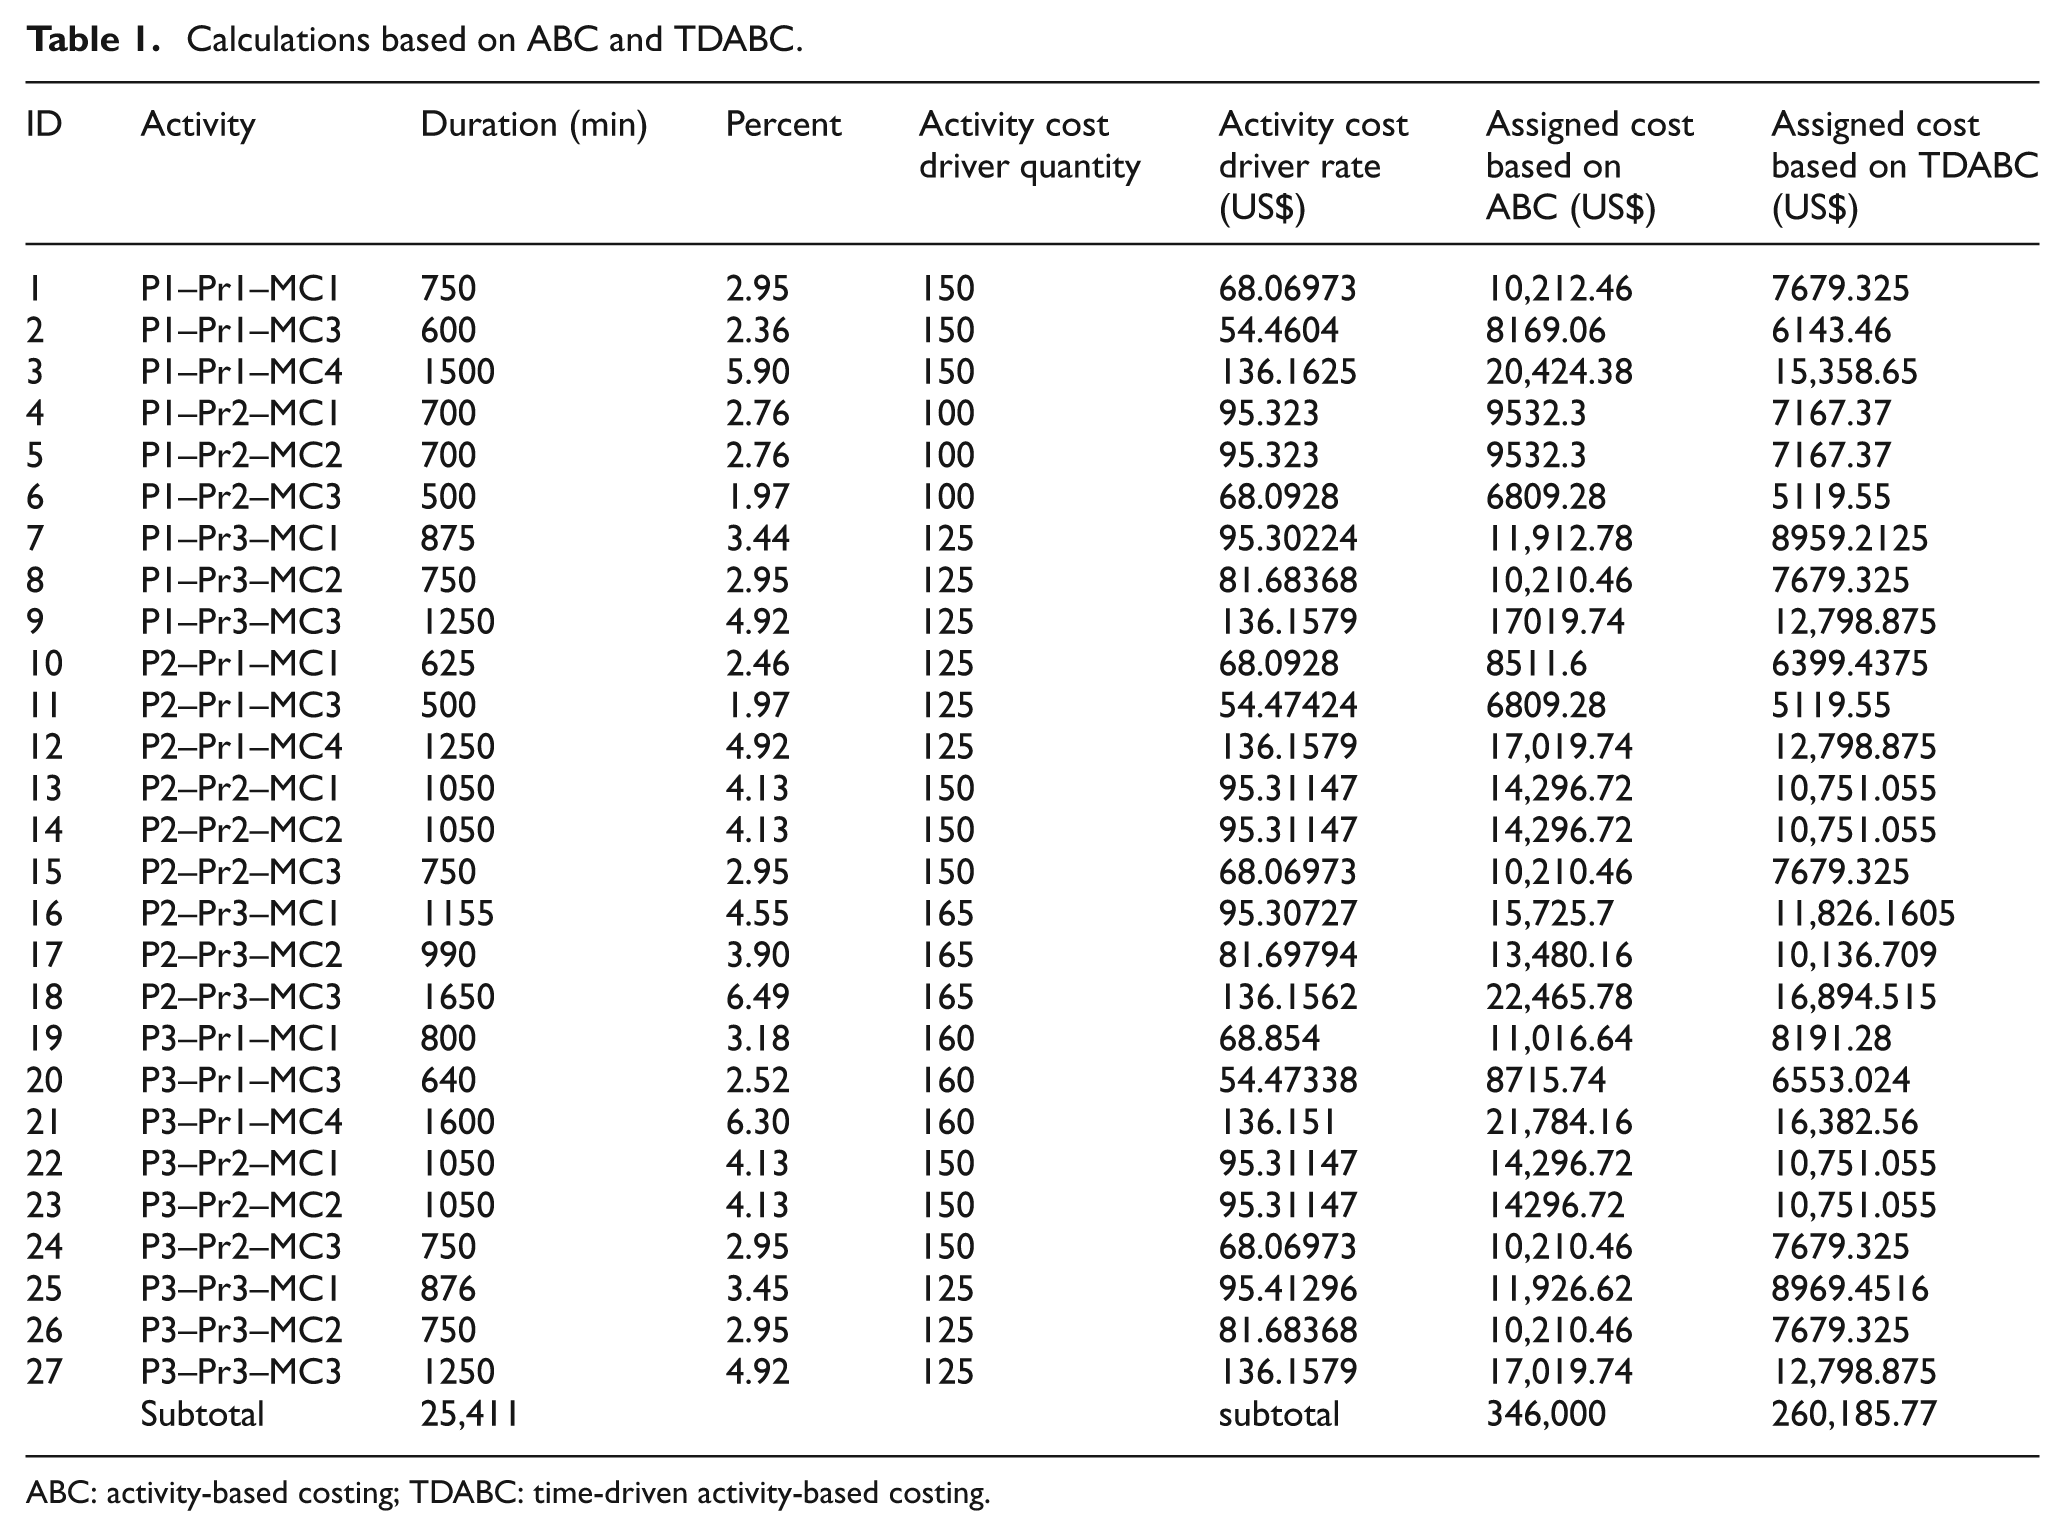
ABC: activity-based costing; TDABC: time-driven activity-based costing.
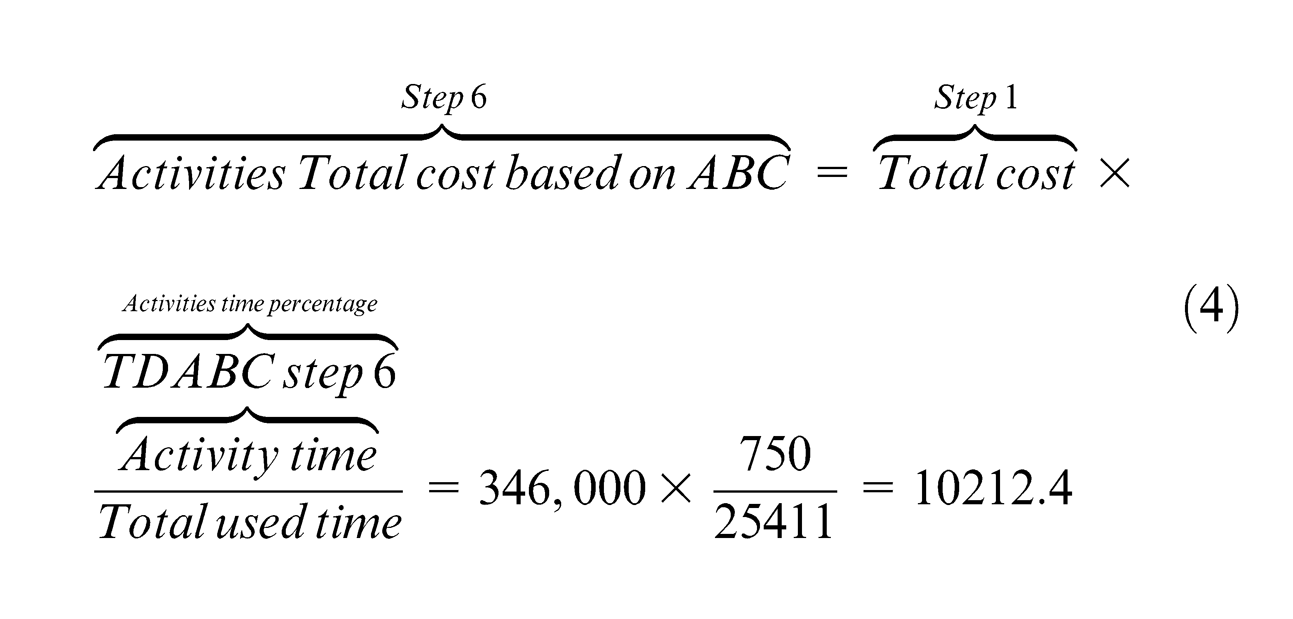
In Table 1, not only total cost (346,000) is distributed among activities by different percentages, but also activity cost rate is obtained based on the customer demand. Finally, total cost and total time for all activities are shown by summation cost and time of each activity.
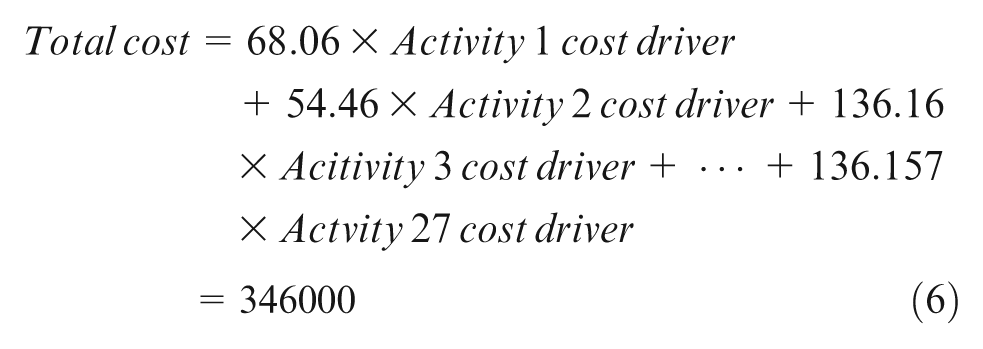
Figure 1 shows the differences between the results in ABC and TDABC, as given in Table 1. As it is clearly obvious, the costs of activities obtained based on TDABC provide much less than ABC. Total cost equation based on ACDR rate for the case study is obtained as follows
According to Table 2, if the used capacity and available time of resources (unused capacity) are compared, it is shown that not only better understanding of the profitability of each resource can be correctly computed, but also the new price for each resource.
New pricing for the resources based on used capacity.
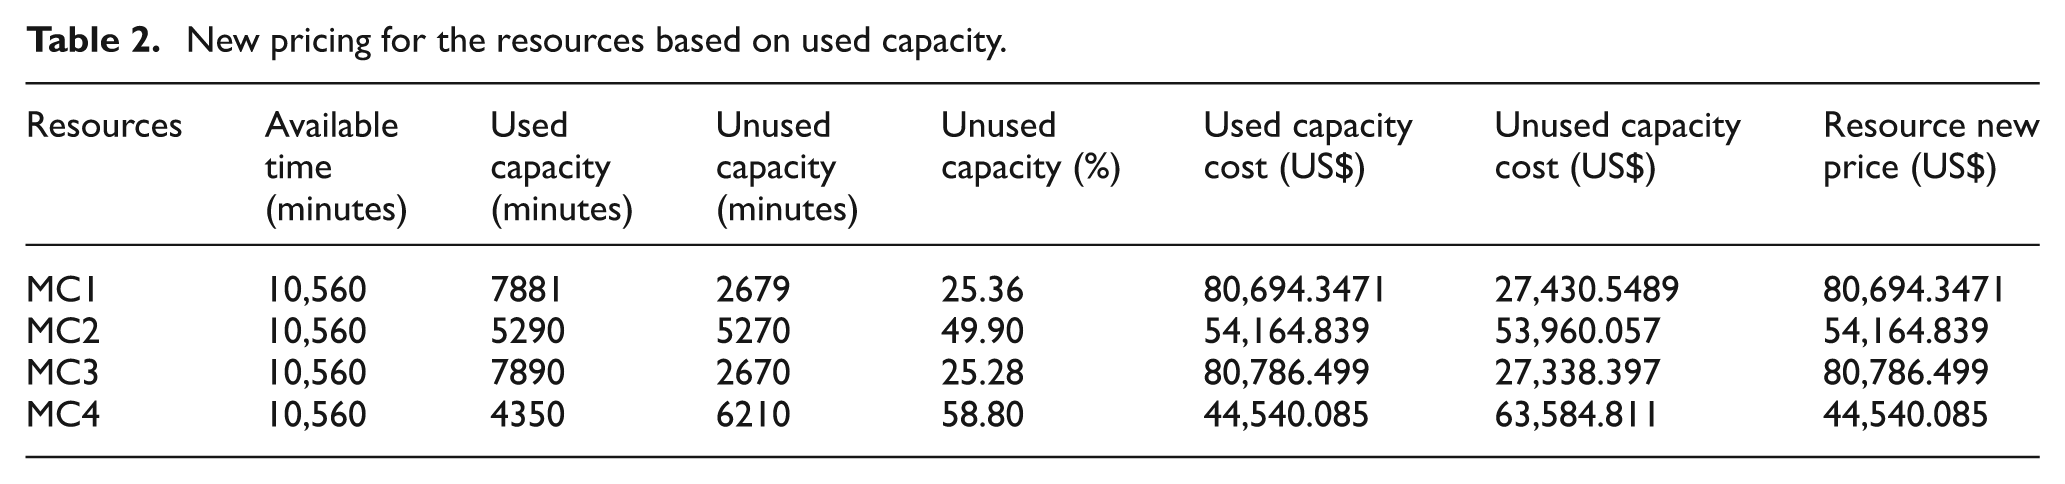
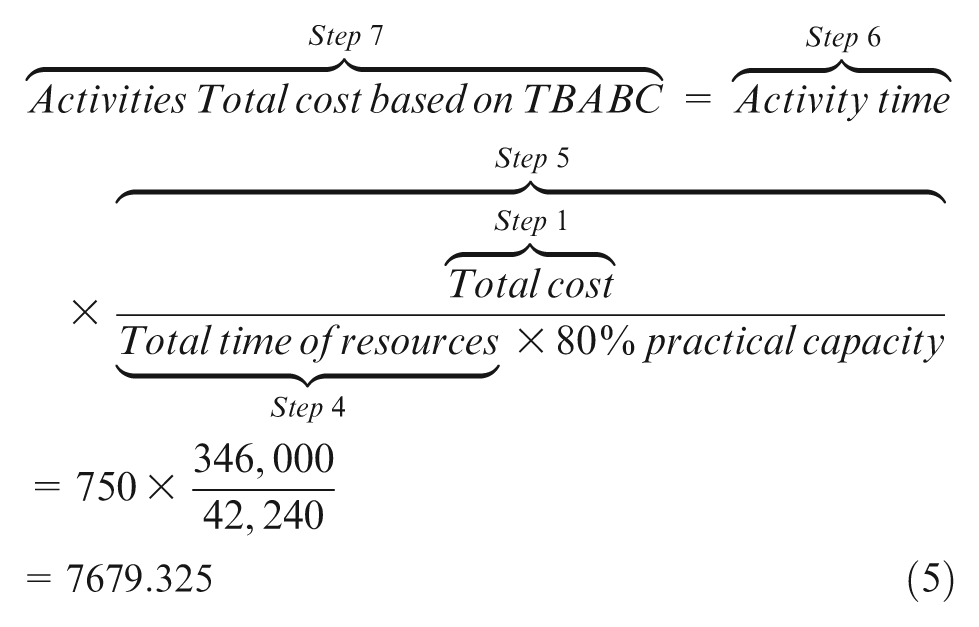
By focusing on used capacity of resources, the total time and total cost based on TDABC calculations are 25,411 min and US$260,185.8, respectively. Although the total supplied time and total activities cost obtained from ABC by considering 80% of theoretical capacity for the machines is 33,792 min and US$346,000, it can be concluded that 8381 min and US$85,814 are being spent redundantly. Considering unused capacity reduces the extra expenses within production cycle time and labor idle time. Practical capacity of resources is calculated as follows
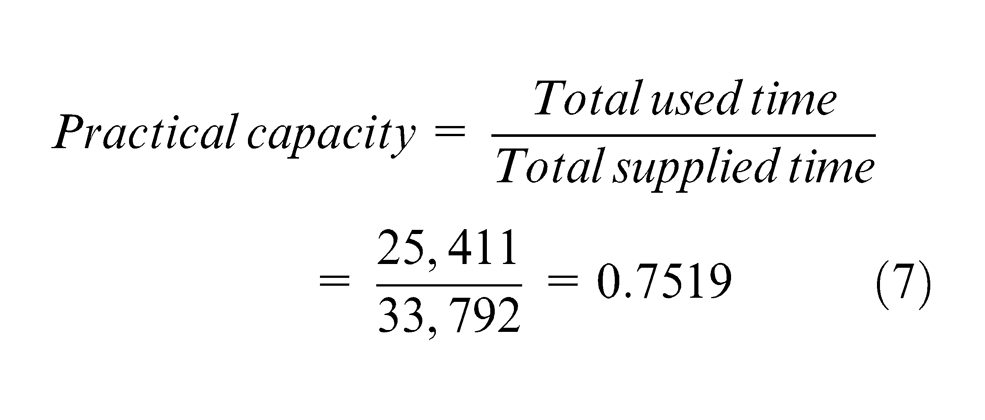
Since the cost per unit time is obtained based on 80% theoretical capacity, according to the above-mentioned calculations, 75% of theoretical capacity is practical for the existing resources.
According to the precedence relationships that must be fulfilled during the production of each product, each machining center may become idle at several points of time. The more unused capacity of resources produced the more resource cost. In this case, by applying the proposed methodology, preventive maintenance—or even corrective action—can be planned within machine idle times.
Conclusion and future research
In this article, two well-known management accounting techniques (ABC and TDABC) are presented in a manufacturing system. Through this study, the effect of total unused capacity on total production cost is investigated. Both ABC and TDABC are adapted through a MPMP problem, and the obtained results were then compared. The TDABC has shown an approximately 25% decrease in total cost in comparison with the ABC results. Moreover, TDABC results show realistic characteristics than the relevant performance obtained by ABC (Table 3). As a future direction, it is recommended to incorporate uncertain and probabilistic conditions through the modeling procedure.
Comparative analysis.
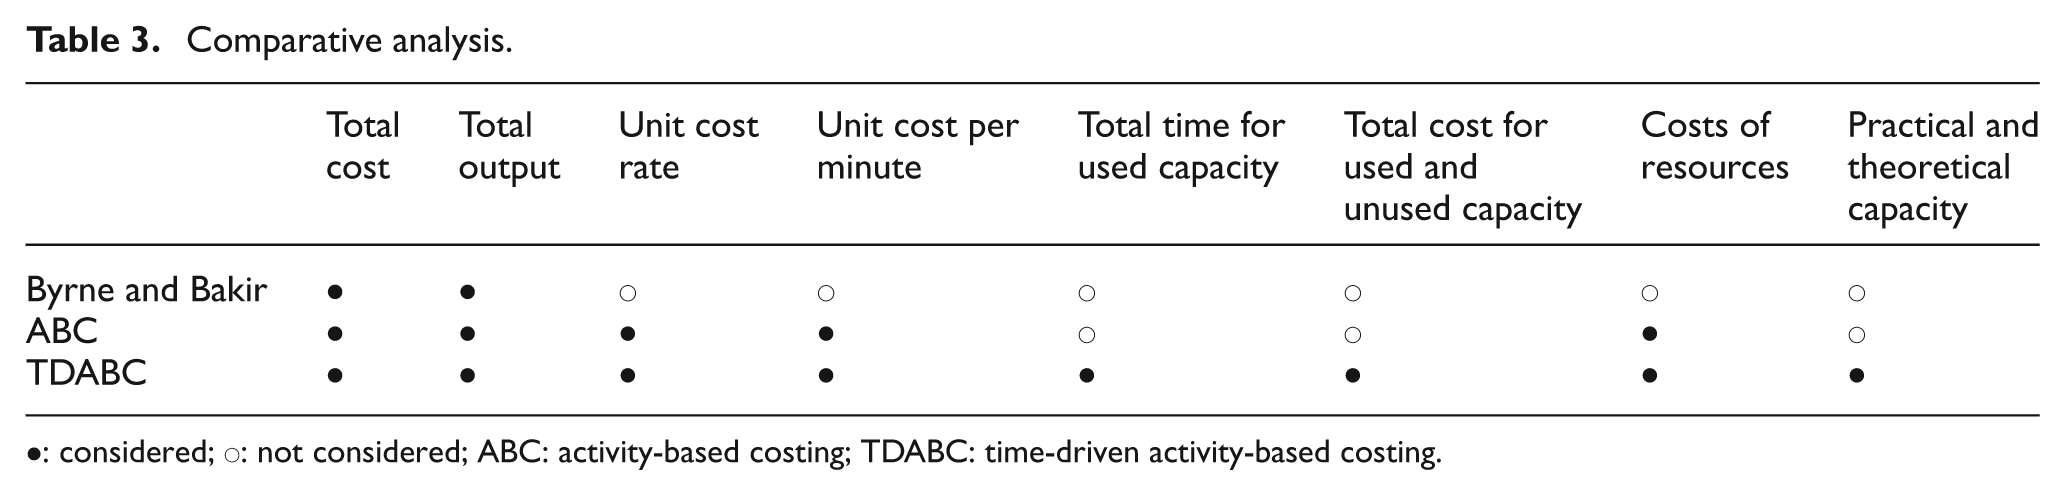
•: considered; ○: not considered; ABC: activity-based costing; TDABC: time-driven activity-based costing.
Footnotes
Funding
This research received no specific grant from any funding agency in the public, commercial, or not-for-profit sectors.