
Abstract
This article presents a stability problem of milling process of the Al7075 aluminium alloy. The problem of cutting process stability was often considered in the past but mainly as theoretical research. Here, the stability limit of real cutting process is shown. First, stability lobes diagram was created on the basis of parameters obtained during impact test of end mill cutter. Next, the cutting forces were measured during the test at increasing axial cutting depth. Finally, a methodology of stability analysis based on recurrence plot and recurrence quantification analysis was applied to experimental data. Additionally, new stability indexes were proposed.
Introduction
Productivity and quality are undoubtedly the main aspects of modern manufacturing processes. A demand for steadily growing effectiveness leads most often to an increase of cutting speed or the depth of cut. The first way is quite safe and has many advantages. For instance, in the study by Yousefi and Ichida, 1 a cutting experiment for an aluminium alloy cut with a machine equipped with an active magnetic bearing spindle was carried out. Cutting speeds changed from 20 to 260 m/s in order to elucidate the effect of cutting speed on the quality of finished surface. Generally, the results demonstrated that the surface roughness tended to decrease with the increase in cutting speed. The results of certain investigations showed that the improvement of finished surface with the increase in cutting speed was inconclusive because of burnishing action attributable to the tool wear, smaller chip load used and dynamic responses of the cutter. 1 However, the increase of productivity can be achieved by larger cutting depth, but this is the simplest way to obtain instability, manifesting itself by self-excited chatter vibrations. The description of physical mechanisms causing the chatter phenomenon can be found in the study by Wiercigroch and Budak. 2 Usually, the regenerative chatter (also called the secondary chatter) is one of the most common causes of instability in the cutting process. However, Grabec 3 and Wiercigroch et al. 4 showed that frictional effect is also important, as it causes the so-called frictional or primary chatter. The chatter phenomenon, generated during cutting, can deteriorate the final product surface, shorten the tool’s lifetime or even destroy the tool or a workpiece. Self-excited vibrations may occur at certain combinations of the spindle’s speed and the axial depth of cut. In case of relatively soft material, for example, some aluminium alloys, instabilities exist for quite big cutting depth. Despite that researchers are still looking for an efficient method of avoiding or suppressing chatter. Parus et al. 5 listed several methods of self-excited vibration elimination, for example, tools with active elimination of vibrations, a change of phase between the external and internal modulation in case of trace regeneration and a change of dynamic properties of the machine–tool system by the use of vibration eliminators. The decrease of trace regeneration effect through a change in the phase shift was performed by means of a variable spindle speed. 5 The method mentioned above is mainly applied for one-edge tools (e.g. in turning) because for machining with multiple-edge tools, the system’s vibrostability could be enhanced by changes in tool geometry, for example, the rake angle or unequal spacing of cutting plates in the mill head. Turner et al. 6 developed an analytical model of cutting to predict the chatter stability of the variable helix end mills. This work provided a comparative study of the performance of variable helix or variable pitch end mills. Dombovari et al. 7 obtained similar effect by applying serrated milling tools. Another idea of chatter suppression used a vibration eliminator system that was based on the control of the energy flow in the system. Such system took advantage of the principle of force compensation, which became significant in the resonance of the main system and decreased the amplitude of resonance vibration. 5
As far as cutting of aluminium alloy is concerned, the analysis of high-speed machining of the Al7075-0 alloy using polycrystalline diamond (PCD) and cemented carbide (K10) cutting tools was presented in the study by Davim et al. 8 The study was carried out using a commercial finite element software called ‘Advantage’. In consequence of simulations, it was concluded that the polycrystalline tool had a superior performance in terms of cutting and feed forces, when compared to the cemented carbide tool. An interesting problem was shown in the study by Davies and Balachandran, 9 where the high speed machining (HSM) was applied to thin-walled aluminium components for aircraft. The flexibility of tool and workpiece, the high spindle’s speeds and the inherent impact non-linearities in the milling process led to complicated tool–workpiece interactions. Delayed space reconstructions and calculations of pointwise dimension showed that the workpiece motions were characterized by fractal geometry. The auto-bispectra suggested quadratic phase coupling among the spectral peaks associated with the cutter frequency. Finally, the authors proposed a mechanics-based model with an impact in order to explain the obtained results. Their predicted outcomes agreed well with the experimental observations. Thin-walled aluminium structures were also tested by the finite element analysis in the work, 10 where chatter vibrations were analysed.
Most often in the literature, stability conditions of machining process were visualized by stability charts called stability lobes diagram (SLD), which plotted the maximum chatter-free chip width or depth of cut as a function of the spindle’s speed. Theoretical stability analysis was performed by many researchers, who investigated theoretical cutting models11,12 and used linear or non-linear cutting force models for this purpose. Elias-Zuniga et al. 13 reported that the use of non-linear cutting force provided better prediction of process stability than the linear one. The results were confirmed experimentally by 5% radial immersion milling with an aluminium workpiece. Another method of chatter prediction, especially eagerly used in industry, was commercial software, for instance, the CutPro, which took advantages of the spindle–tool system modal analysis, as well as the properties of workpiece material. However, the verification of SLD correctness remained an open problem. Therefore, other researchers measured the acoustic emission during milling process to obtain an experimental SLD, for example, in the studies by Ismail and Ziaei 14 and Morgan et al. 15 The first study focused on finding and drawing chatter regions for an aluminium alloy. In the second one, the authors built the expert system utilizing a fuzzy logic–based process in order to interpret the cutting force signals and to recommend possible alterations to the process for achieving high-performance milling operations. To improve the accuracy of the SLD prediction, which was based on classical modal analysis done at 0-r/min test, Zaghbani and Songmene 16 performed the operational modal analysis during machining. They showed the methodology for applying this technique. Their results demonstrated that at some depths of cut, the process seemed to be stable with standard stability lobes, but it manifested instability, when the operational modal analysis was applied for stability lobes creation. In general, the problem of stability prediction turned out to be dependent on the methods, which were applied to achieve the proper results. This matter was described in previous studies.17–20
A complex approach to the problem of milling process and its optimization was presented in the studies by Merdol and Altintas.21,22 The authors developed computationally efficient mathematical models for the purpose of predicting the milling state variables, such as the chip load, the moment of force and the cutting edge engagement at discrete cutter locations. The cutters were modelled parametrically, and the intersections of their helical cutting edges with workpiece features were evaluated. Since the tool’s geometry influenced the process, its stability and damping properties, this question was also raised in previous studies.23,24
Although Tlusty and Polacek 25 and Tobias 26 developed their regenerative model of cutting in 1960s, the problem of milling stability remained an open question. Therefore, in the following article, the stability of milling process of the Al7075 aluminium alloy was taken into consideration. The results of experiments were compared with analytically obtained SLDs. Finally, recurrence quantification analysis (RQA) was performed in order to recognize unstable cutting regions.
Theory
The research on cutting process stability consisted of a few steps presented schematically in a flowchart shown in Figure 1. In the beginning, a one-point classical modal analysis was performed in order to obtain the cutting system’s parameters, such as the natural frequency, the stiffness (k) and the damping (c) coefficient. For a simple, one-degree-of-freedom (dof) structure governed by the following equation
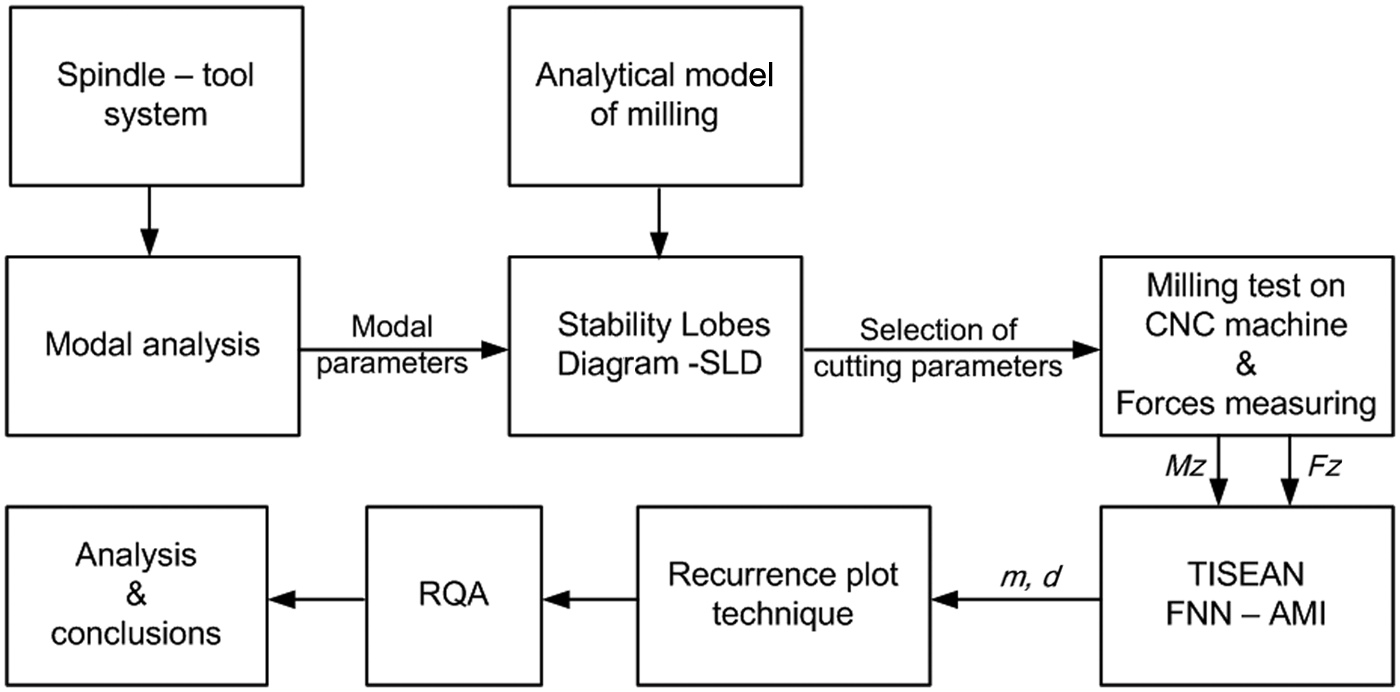
Flowchart of stability research.

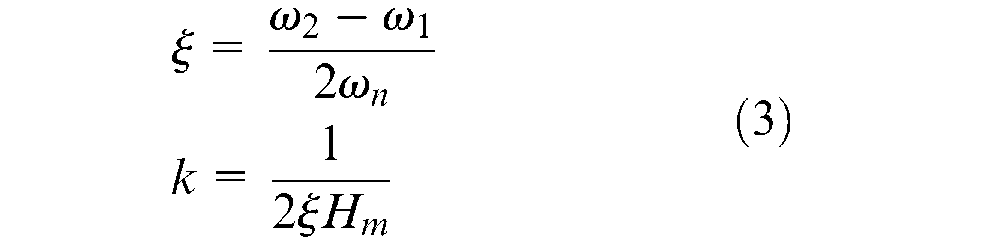
The real G(ω) and the imaginary H(ω) parts of the frequency response function (FRF) based on an impulse hammer tests were calculated according to the following equations
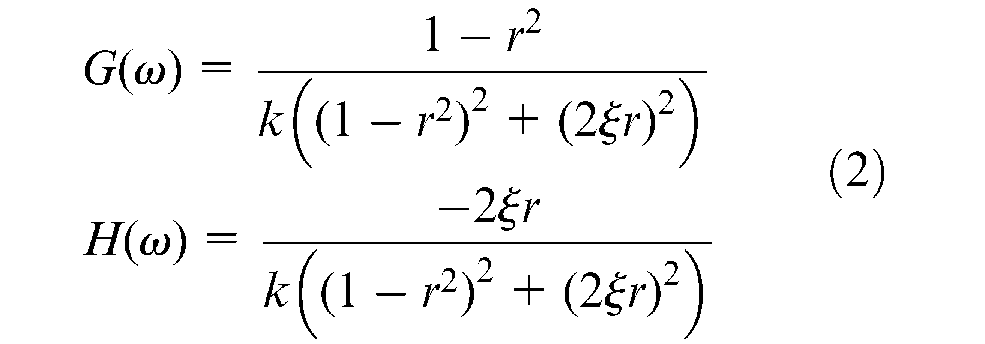
where
In case of a 2-dof system, the modal parameters for two directions should be determined. Having these system parameters, the CutPro version 9 software was used to generate the SLD analytically. The software is based on 2-dof system of orthogonal cutting with the regenerative effect, which is described by two second-order differential equations with time delay. The model and the procedure of stability problem solving were presented in detail in the study by Altintas and Budak. 27 Roughly speaking, the algorithm uses the transfer function matrix to identify the cutter–workpiece contact zone, and the dynamic cutting coefficients are evaluated depending on the workpiece material, the cutting tool and the radial immersion of the cut. As a result, the stability border can be drawn on the plane of the depth of cut and the spindle’s speed.
However, an experimental verification of stability was performed with the help of the recurrence plot (RP) technique. The RP approach provides a qualitative interpretation of hidden patterns of dynamical systems, based on phase space reconstruction. This technique was originally introduced by Eckmann et al.
28
General idea of phase space reconstruction assumes that any time series xi can be presented as a delayed vector

Here m is the embedding dimension and d means the time delay. Usually the embedding parameters, that is, the time delay (d) and embedding dimension (m) can be estimated with a proper application of the average mutual information (AMI) function and the false nearest neighbour (FNN) method. More information about the AMI and the FNN can be found in previous studies.29–32 In this study, in order to obtain the embedding parameters, the TISEAN software 33 was used. The RP technique is the graphical method designed for locating recurring patterns, non-stationary and structural changes. A RP is a graph that shows all the time instants at which the state of dynamical system recurs. A RP can be expressed as the matrix

where θ is the Heaviside step function, ε is a tolerance parameter (the threshold) and
From the practical point of view, the RPs can be presented in a more useful and certainly more convenient form with the help of the RQA. The RQA is a method that quantifies the number and duration of recurrences of a dynamical system presented by its state–space trajectory. The measures of RQA were elaborated by Zbilut and Webber 34 and then developed and introduced to the MATLAB software by Marwan and colleagues.35,36 The measures of RQA are based on the recurrence point density and the diagonal and vertical line structures of the RP. In this article, the recurrence rate (RR), the determinism (DET), the laminarity (LAM), the laminarity-to-determinism ratio (LAM/DET), the divergence (DIV) and the L- and the V-entropy (Lent, Vent) were applied to analyse the milling stability. The measures were defined as follows:
RR was the density of recurrence points in a RP. The physical meaning of RR was the probability that the system will recur

DET was the fraction of recurrence points forming diagonal lines

LAM was the fraction of recurrence points forming vertical lines. The vertical lines were typical for intermittency

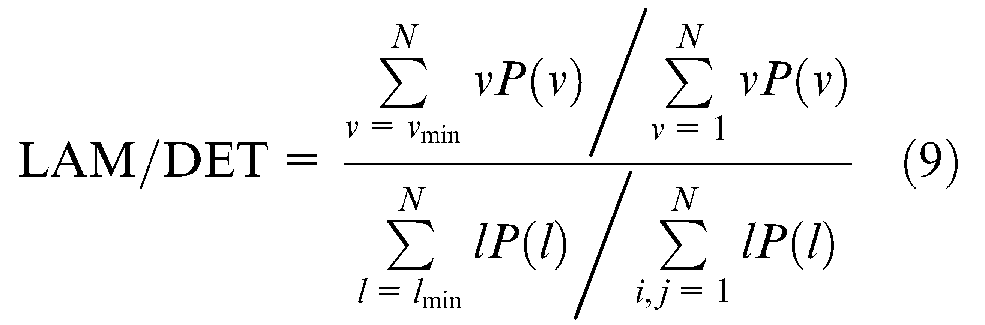
LAM/DET is defined as
DIV meant an inverse of the longest diagonal length

Lent was the Shannon’s entropy of diagonal line segment distribution

Vent was the Shannon’s entropy of vertical line segment distribution

where P(l) is the histogram of the lengths l of the diagonal lines, P(v) is the histogram of the lengths v of the vertical lines, N is the number of points on the phase space trajectory.
The RQA can provide useful information even for short and non-stationary data, where other methods fail. The RQA can be applied for various kinds of data to recognize the dynamical behaviour. 37
Experimental methods
The experimental investigations were conducted on the aluminium alloy Al7075, which was cut on a computer numerical control (CNC) milling machine (Haas MiniMill). The experimental set-up, presented schematically in Figure 3, was divided into two branches: a modal analysis system and a dynamometer system. The former, which was used to measure tool–holder stiffness and damping coefficient, consisted of the PCB 086C03 modal hammer, the PCB 352B10 accelerometer and data acquisition card DAQ’s NI9234. The latter subsystem was used for measurements of the respective components of the cutting force (Fx, Fy and Fz) and the moment of the force (Mz). The main part of the set-up was formed by the Kistler 9123C rotating piezoelectric four-component dynamometer. It was connected to the Kistler’s 5223 signal conditioner and the 2855A4 type data acquisition card. Both experimental branches were integrated into one computer system and controlled by the DynoWare software responsible for recording of the measured signals.
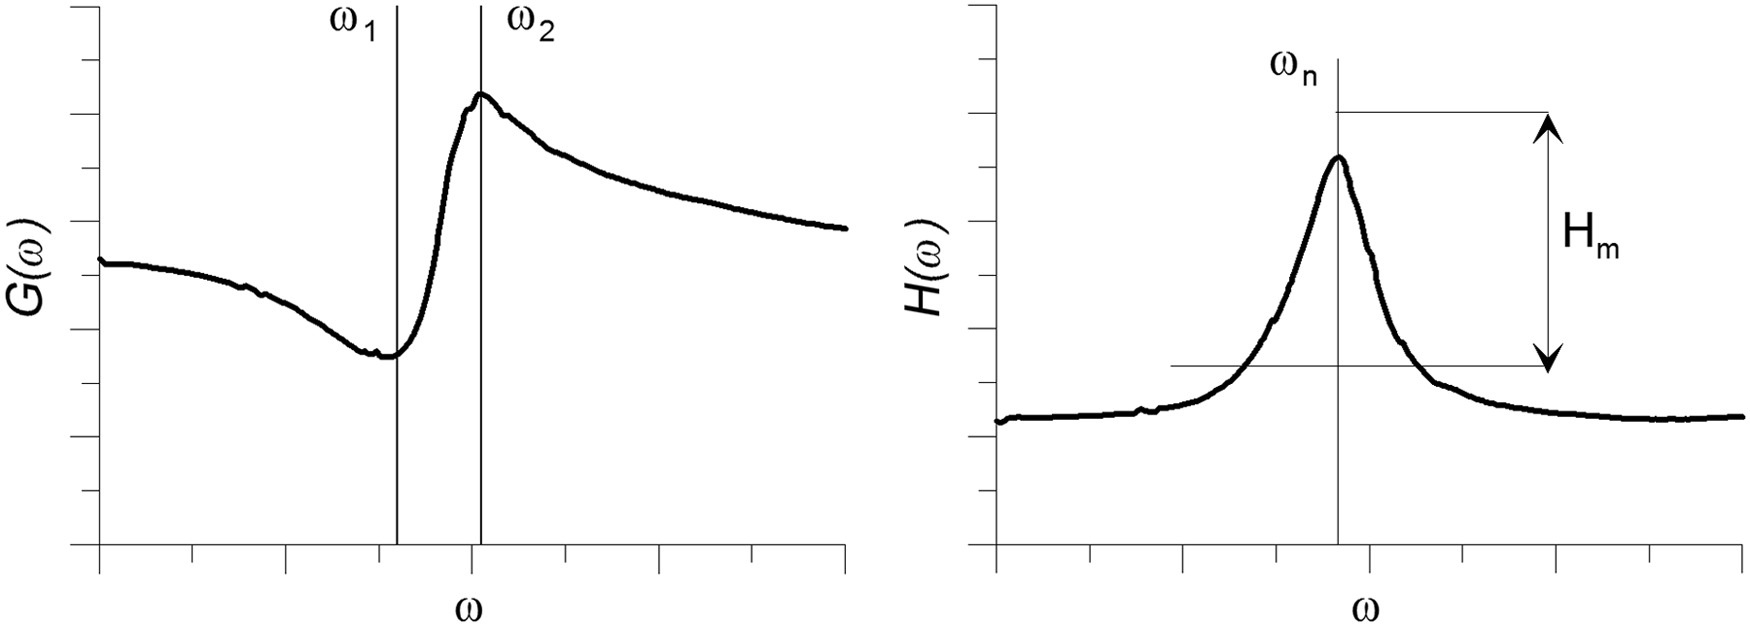
Theoretical real G(ω) and imaginary H(ω) parts of frequency response function (FRF).
The measurements were conducted in two steps. In the first one, the impact test was done in order to obtain stiffness, natural frequency and damping ratio of the spindle–tool system. The modal hammer was used to excite the tool and then the resulting vibrations were measured by a low-mass accelerometer mounted at the tool’s tip. Next, the modal parameters for x and y directions, in the form of FRF (Figure 4), were implemented in the CutPro version 9 software, which allowed to determine the SLD analytically. The SLD, presented in Figure 4, was generated for up-milling of the Al7075 aluminium alloy and the end milling cutter with a diameter of 16 mm and two flutes made of PCD (Guhring WNR-05492-16). Stable cutting occurred in the region below the stability region’s boundary, while unstable machining was expected above the lobes. According to the diagram, the cutting depth below the critical value apcr = 9 mm should be stable all the time, regardless of the spindle’s speed.
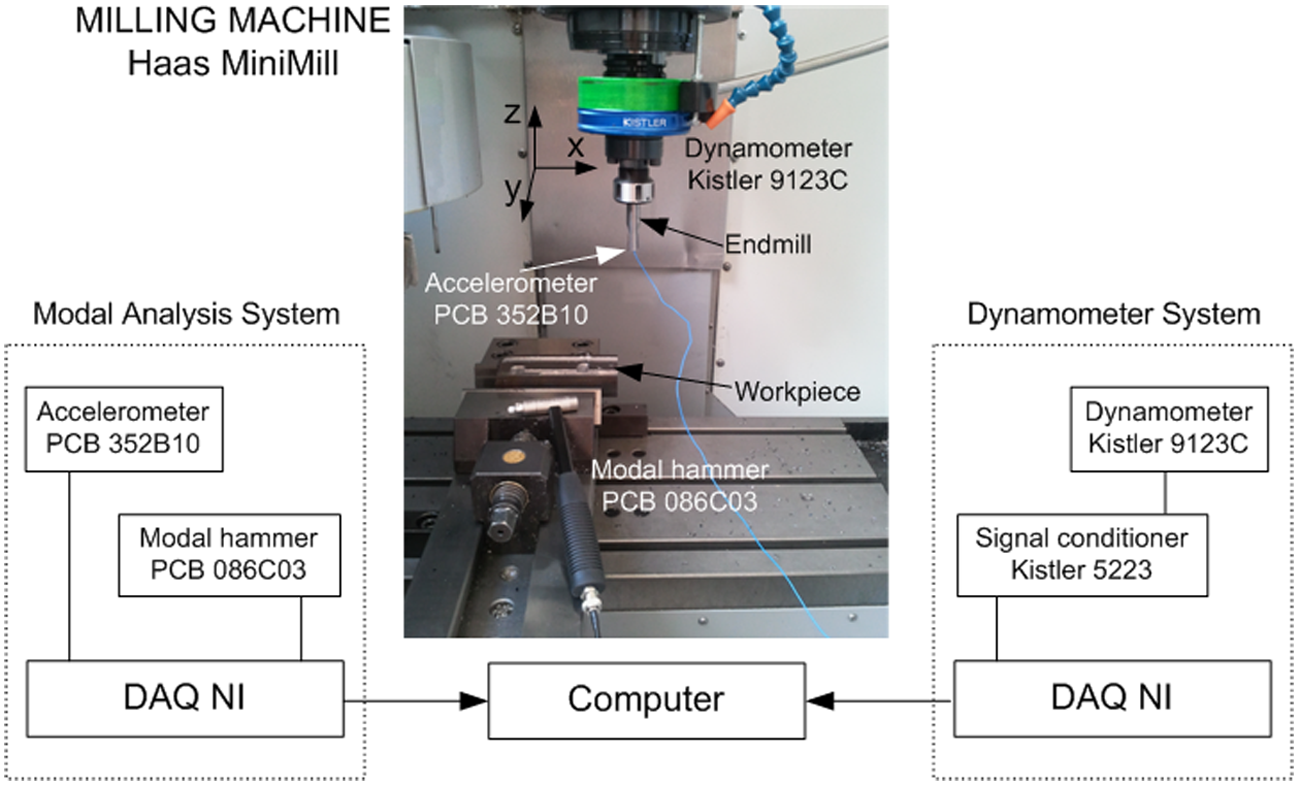
Scheme of experimental measurement set-up.
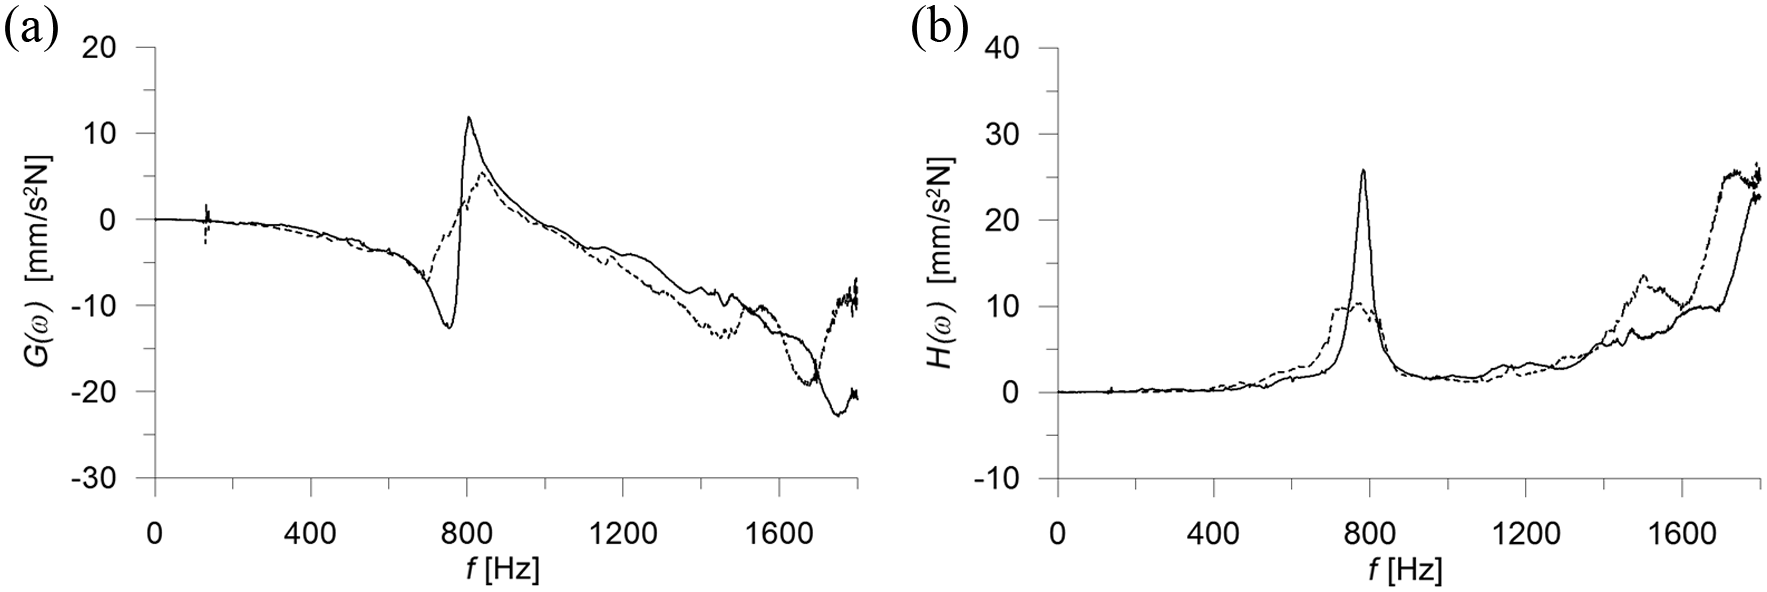
FRF for spindle-end mill system: (a) real part G(ω) and (b) imaginary part H(ω).
In the second part of the experiment, the spindle’s speed was fixed at 3600 r/min, radial depth of cut equalled 4 mm and feed per flute was 0.05 mm. The axial depth of cut ap (called shortly depth of cut) was continuously growing from 0 to 12 mm (Figure 6), crossing the instability boundary at apcr = 9 mm (Figure 6). During the milling process, the force components Fx and Fz and the moment Mz were recorded with a sampling rate of 2 kHz, which was the necessary minimum in order to fulfil the Nyquist–Shannon sampling theorem, as the natural frequency of the spindle–tool system was about 740 Hz. However, the sampling rate was small enough to record the long-lasting process of milling with slowly increasing cutting depth. Moreover, very long time series made the RP and the RQA analyses difficult. In order to avoid the aliasing phenomenon, the Kistler’s measuring system was equipped with an anti-aliasing filter.
The subsequent analyses were performed in the following section to check whether the theoretical critical depth of cut was proper and to define some dynamic conditions of passing through a stable region to an unstable region.
Results and discussion
Having analytically determined SLD for up-milling of the aluminium alloy (Figure 5), the time series of cutting forces for continuously growing depth of cut and fixed spindle’s speed was analysed here (Figure 6). The forces Fz and Fx, as well as the moment Mz, had similar courses, but the values of Fz were bigger in comparison to Fx– about eight times – achieving even 4 kN at the end of test.
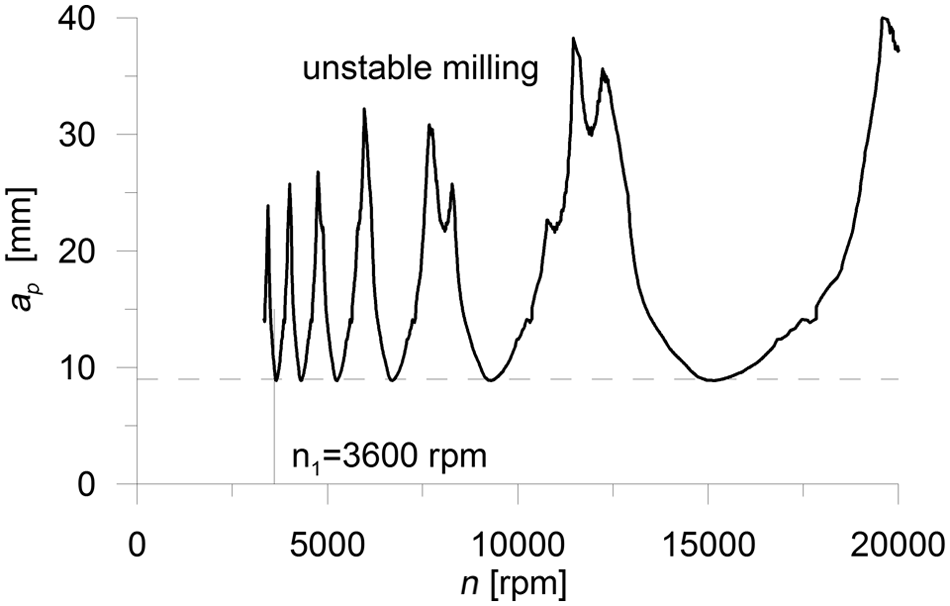
Stability lobes diagram determined by the CutPro version 9 software.
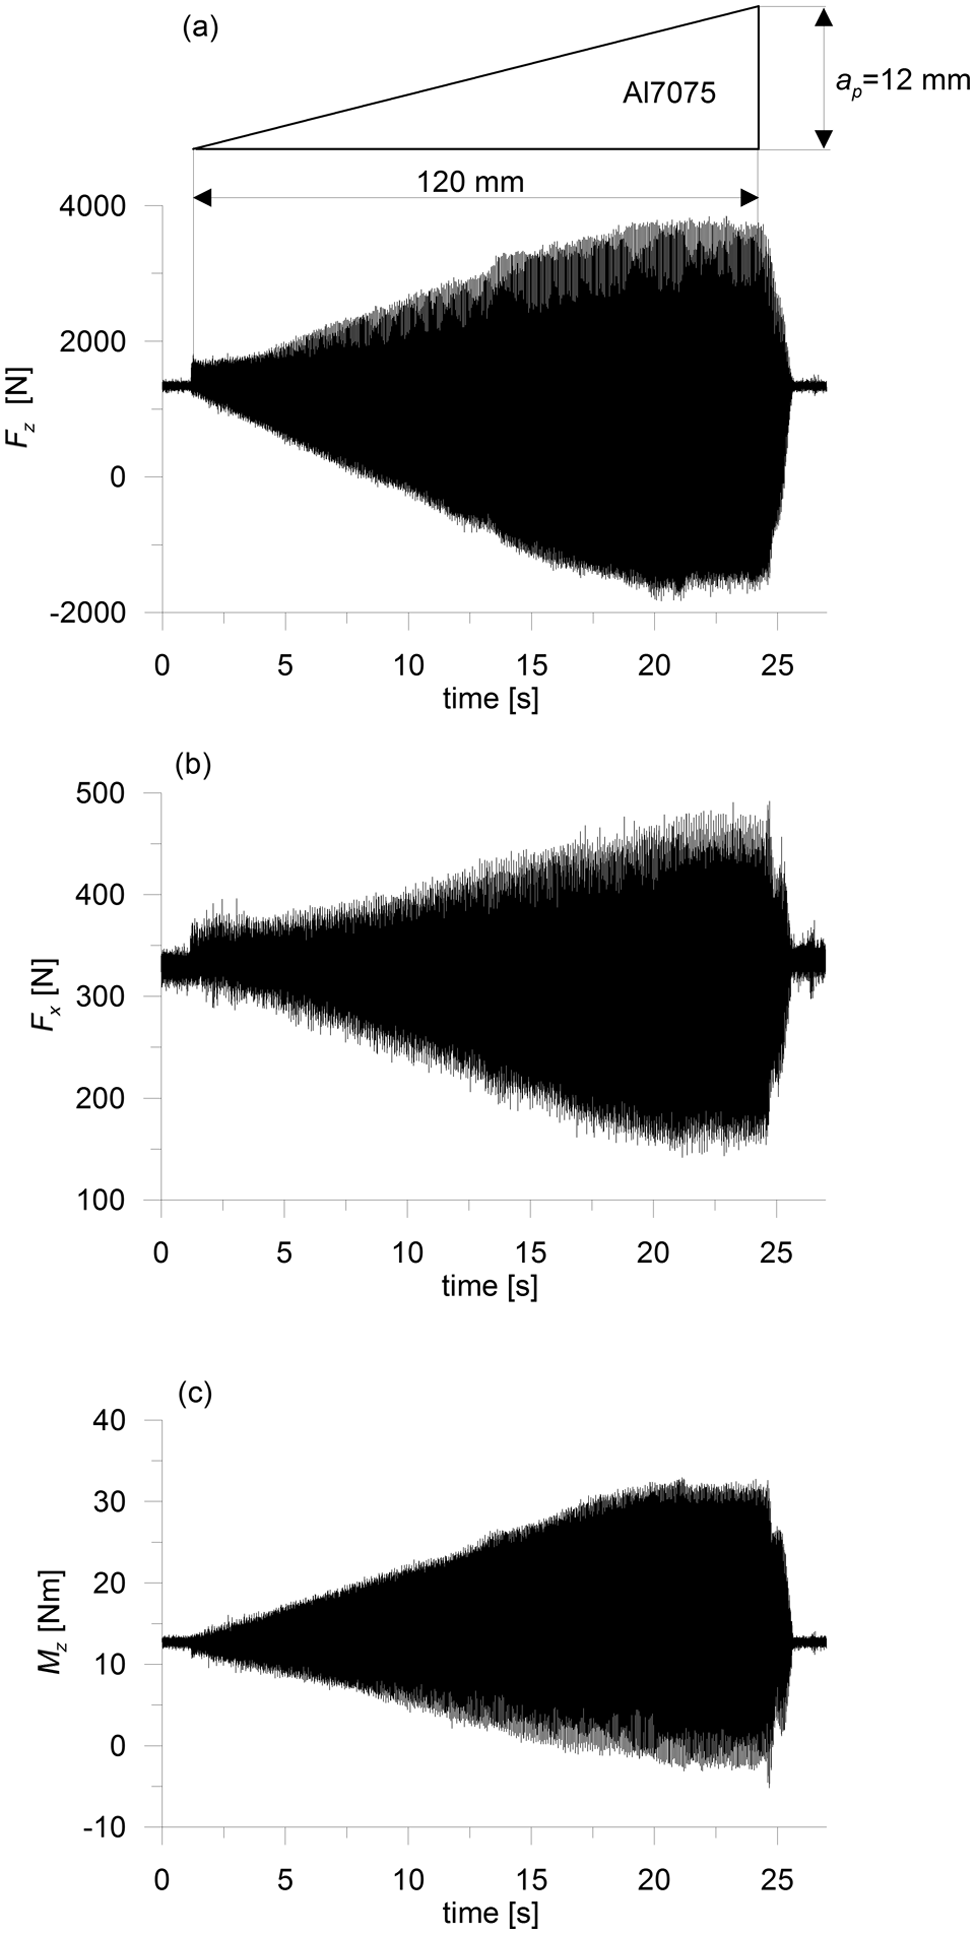
Cutting forces (a) Fz and (b) Fx and (c) moment Mz during Al7075 alloy milling with continuously growing depth of cut.
For further analysis, the moment Mz and the force in the feed direction Fx were considered as representative parameters of milling dynamics. In order to show the transition between chatter-free and chatter-including cutting, the RP method was applied. This technique was successfully implemented in research of superalloy cutting29,31 and composite milling.30,37 Here, the RPs were engaged to show a beginning of chatter during milling of aluminium alloy (Al7075). According to the SLD (Figure 5), the critical depth of cut was apcr = 9 mm, whereas, looking at the RPs of experimental data (Figure 6), one could notice an ‘earlier’ change of the system state – at about 6 mm. The qualitative change of the RP was indicated by a dashed line. Interestingly, the critical depth of cut read out from the RP of moment Mz (Figure 7(a)) was equal to 6.2 mm, while the value taken from the RP of the force Fx (Figure 7(b)) was almost 7.2 mm.
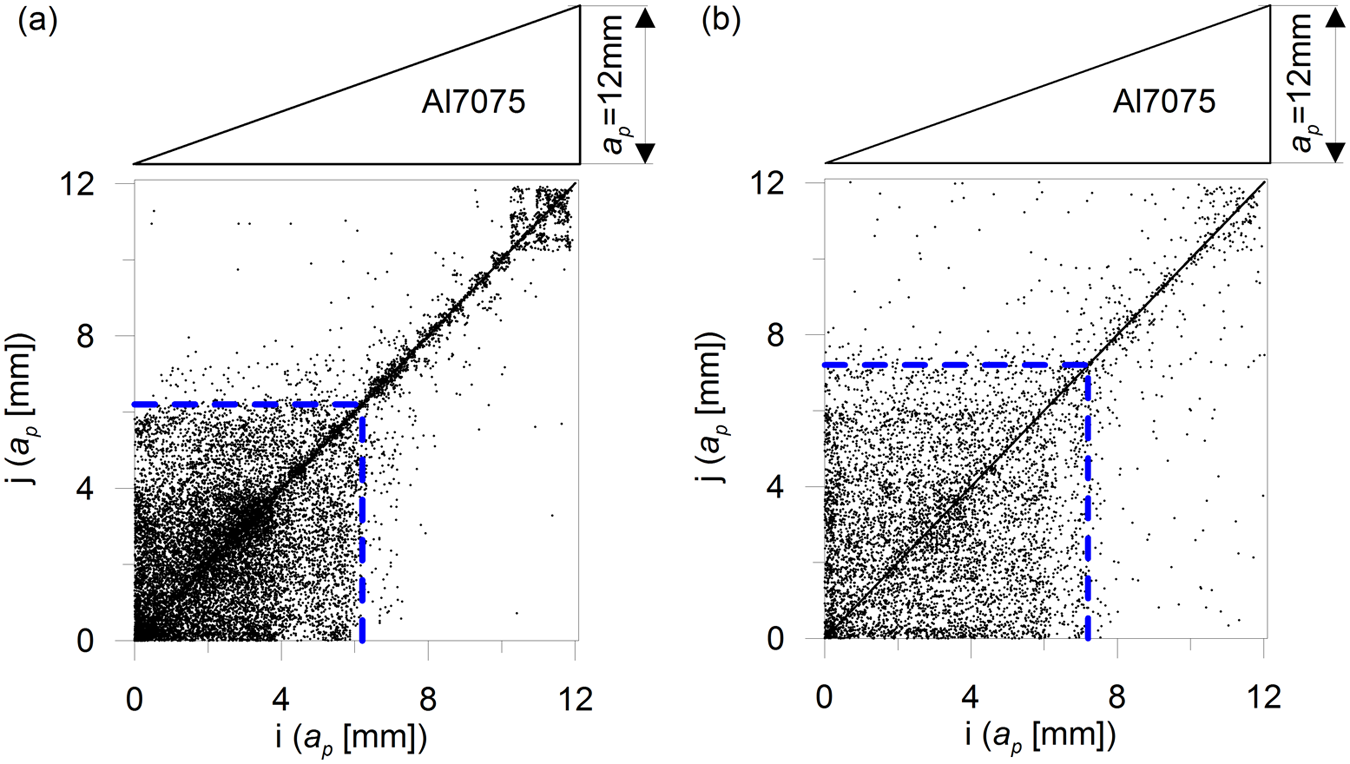
Recurrence plots for milling at n = 3600 r/min, ae = 4 mm, Fz = 0.05 mm; (a) moment Mz and (b) force Fx.
The RP observation was not easy to interpret; therefore, the more user-friendly RQA was applied here. The results of the RQA for the moment Mz and the force signal Fx were demonstrated in Figures 8 and 9. In total, 14 measures of RQA can be specified. 38 All of them exhibit some changes in their values during transition from chatter-free to chatter-exhibiting vibrations, but here, only a few of them, that is, the most useful, were presented – in Figures 8 and 9 for Mz and Fx, respectively. Basically, there were no qualitative differences between Mz and Fx. That confirmed the well-known statement that only one signal (time series) was desired to determine the process dynamics with the help of the RP technique. In other words, every time series provides the same information about the process. Looking at the measures of the RQA presented in Figures 8 and 9, one can clearly note that the critical depth of cut was apcr = 8 mm. This value was the same, both for Mz and Fx, and besides, they were higher compared to apcr yielded by the RPs but smaller than what the SLD showed (see Figure 5). This was consistent with the results obtained from the operational modal analysis presented by Zaghbani and Songmene. 16 They pointed out that the critical depth of cut obtained on the basis of classical modal analysis was bigger than the one obtained from the operational modal analysis. In Figures 8 and 9, the chatter-free region exists on the left side of the dashed line, whereas on the right (higher up than apcr) self-excited chatter vibrations appear.
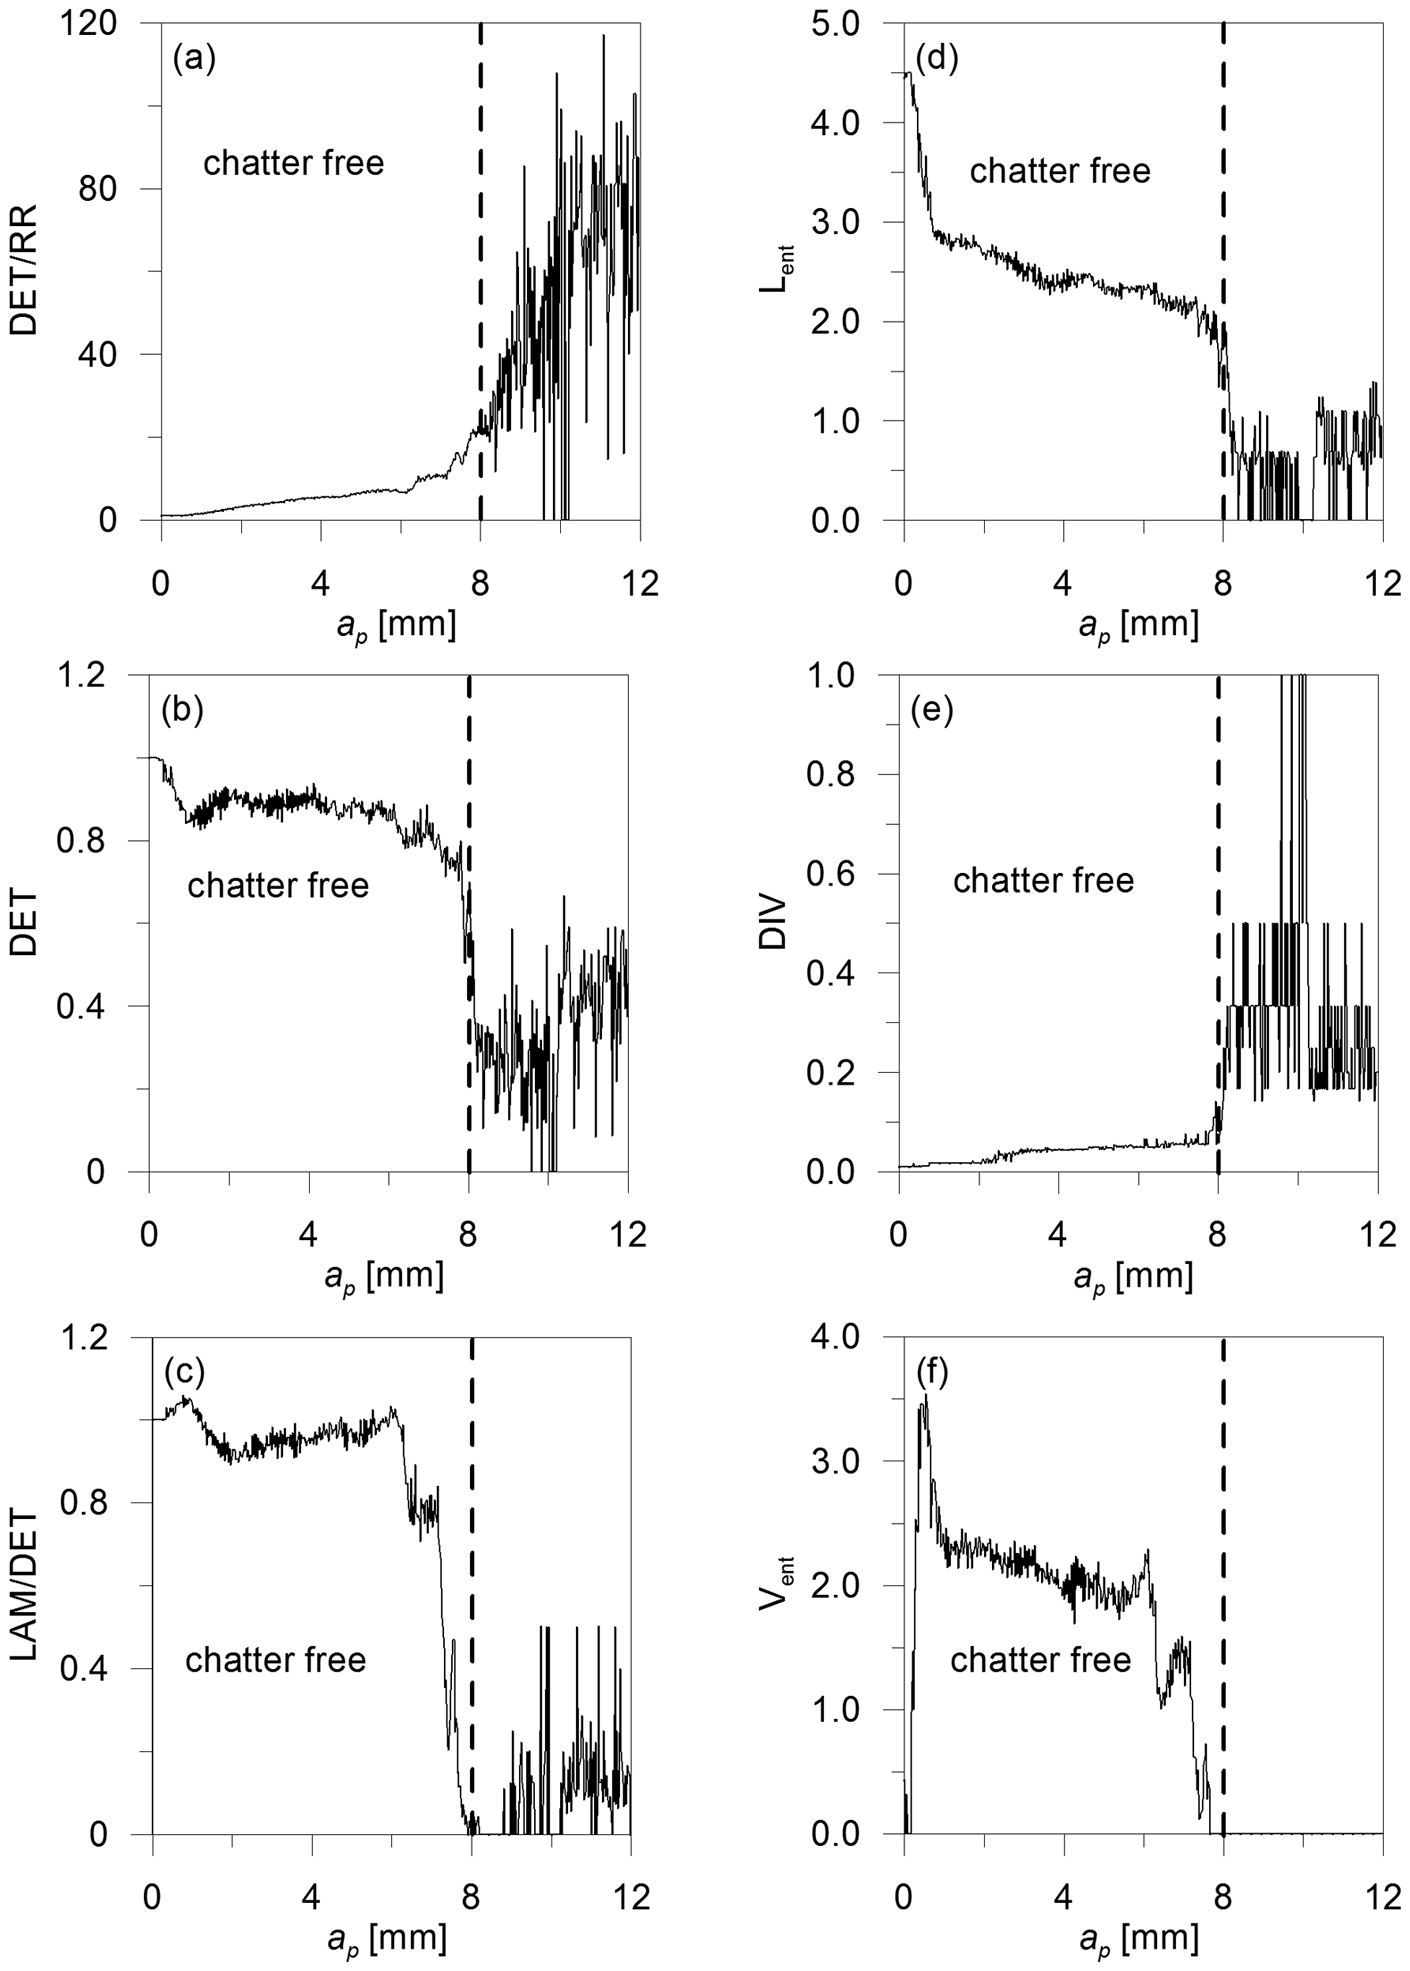
RQA for Mz: (a) determinism to recurrence rate ratio (DET/RR), (b) determinism (DET), (c) determinism to laminarity ratio (DET/LAM), (d) L-entropy (Lent), (e) divergence (DIV) and (f) V-entropy (Vent).
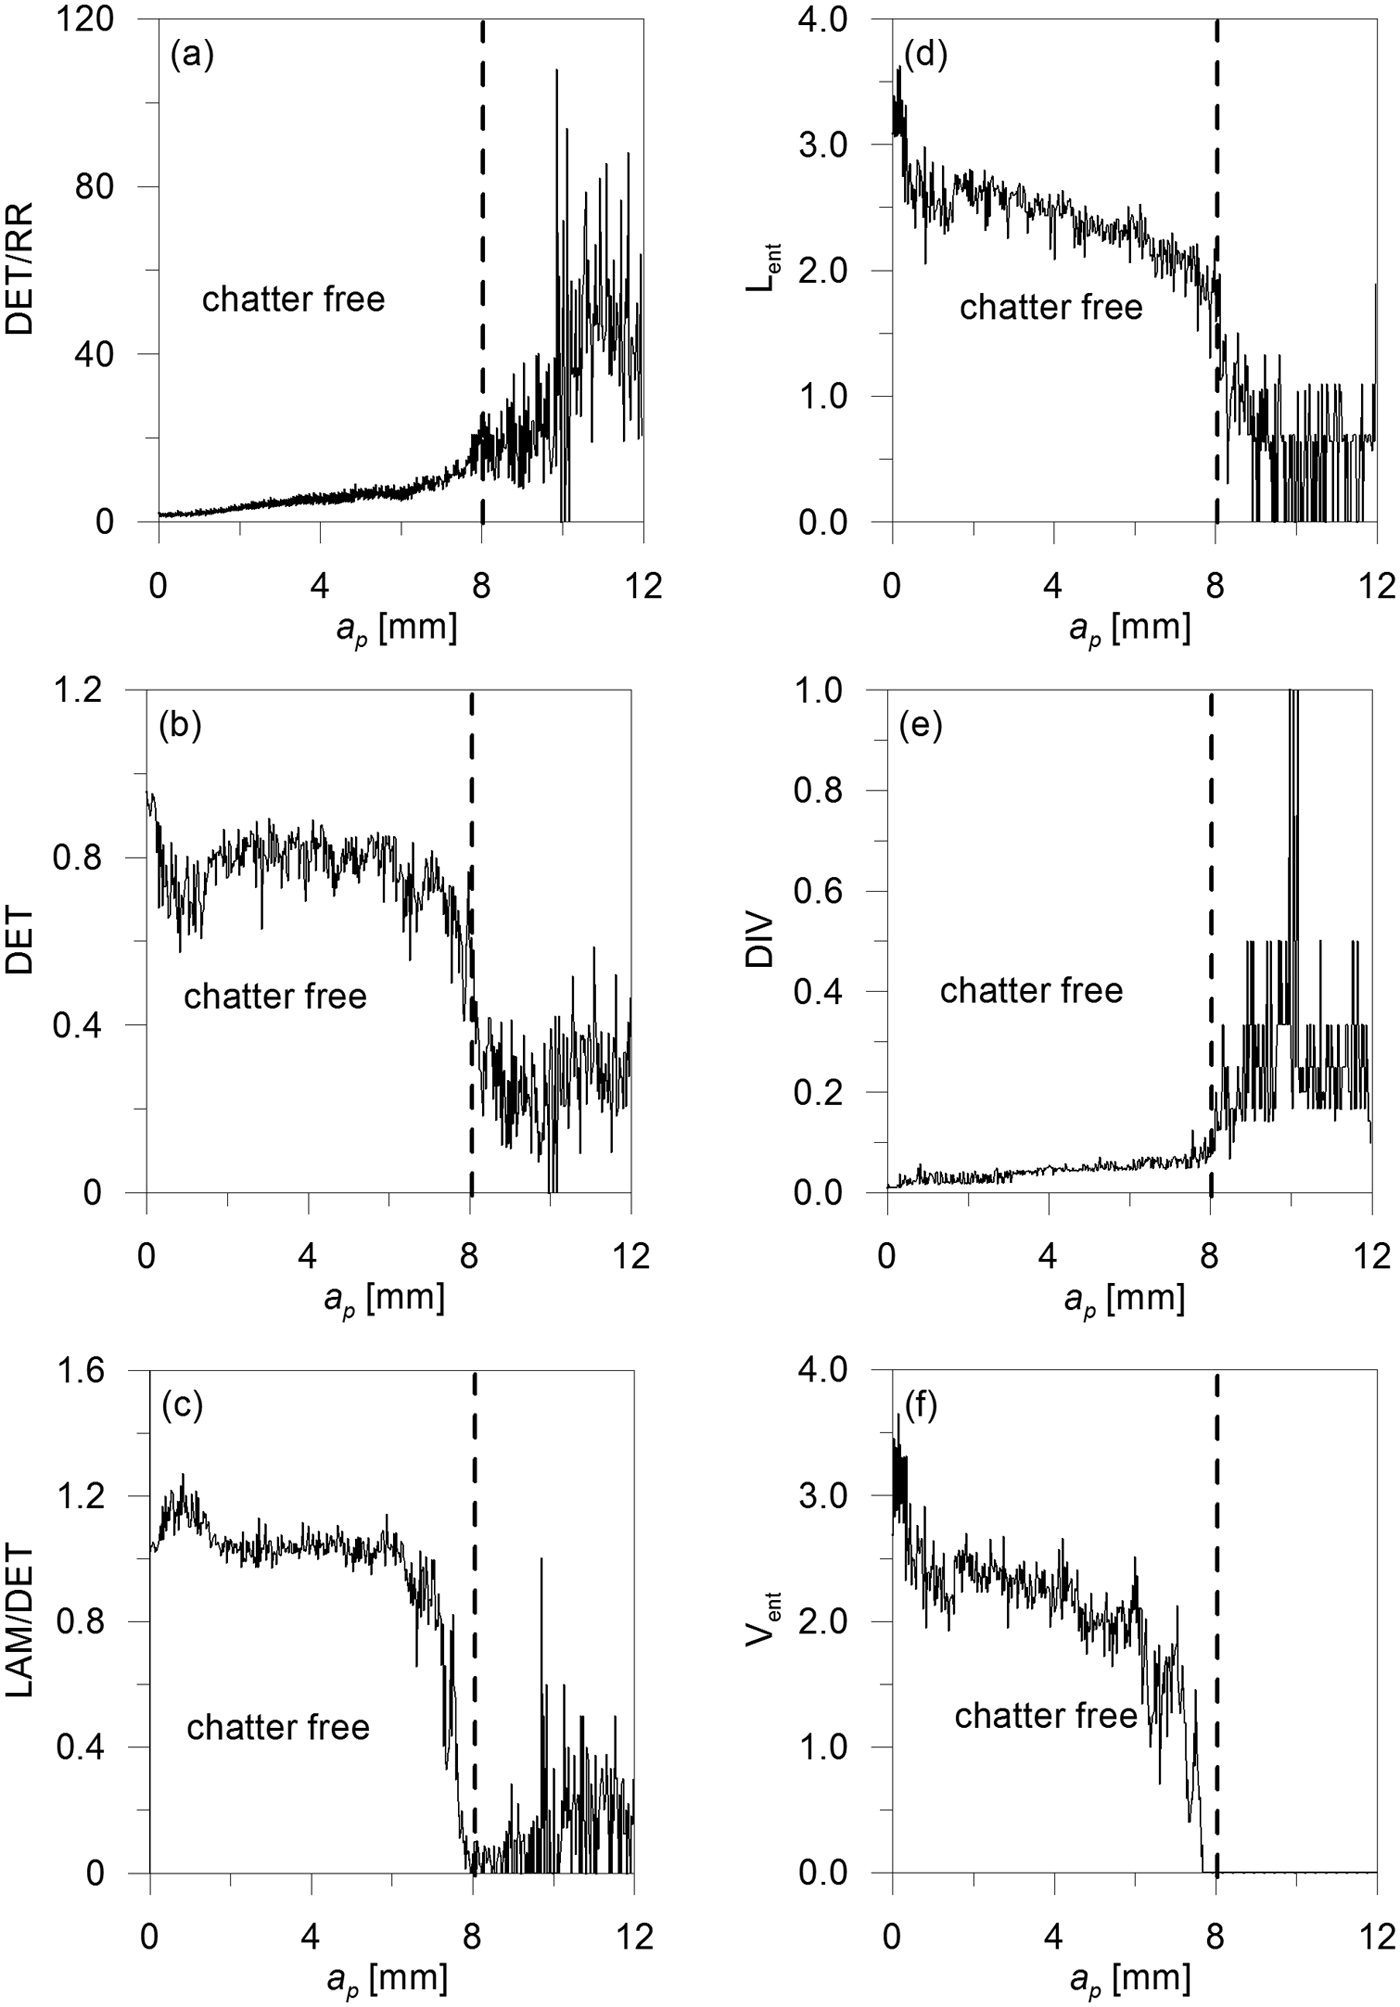
RQA for Fx: (a) determinism to recurrence rate ratio (DET/RR), (b) determinism (DET), (c) determinism to laminarity ratio (DET/LAM), (d) L-entropy (Lent), (e) divergence (DIV) and (f) V-entropy (Vent).
Recently, there were discussions about the kind of chatter vibrations, that is, whether they were regular, periodic, quasi-periodic, sub-harmonic or chaotic.39–42 This problem is still unsolved, but generally various kinds of vibrations are possible in case of chatter. The long diagonal lines in the RP correspond to volumes about regularity of the analysed time series, while the vertical lines indicate an irregularity. The measure of the quantity of diagonal lines was described by the DET and other indexes, like the DET/RR and the LAM/DET ratios, whereas the irregularity was described by the LAM. Despite the fact that the DET decreased (Figures 8 and 9), the DET/RR increased. This indicates the regularity of the cutting forces (and moments) in case of chatter, compared to chatter-free regions. The DET/RR and the DIV were increasing, when the cutting process crossed the stability boundary (dashed line in Figures 8 and 9). The rest of the measures were decreasing. Vent attracts attention because its value changes dramatically to zero. From the practical point of view, DET/RR, LAM/DET, Lent and DIV are quite good stability indices, but Vent seems to be the best and therefore can be implemented in dynamical supervision system of cutting process.
Conclusion
This study focused on the assessment of milling process stability with the help of the RP technique. First, the stability diagram was drawn on the basis of modal parameters of end mill, which was fixed in the milling machine’s spindle. Next, the experiment was performed in order to verify stability limit and especially to find useful index to identify unstable region where chatter could exist.
Stability limit for milling process of the aluminium alloy Al7075 determined by the commercial software CutPro version 9 was higher compared to the experimental results, which were analysed with RPs. This suggests that classical modal analysis is not good enough to predict the SLD or the model of cutting force dependence used in CutPro version 9 is not accurate enough. In practice, a precision estimation of stability limit based on the RP is not easy because it consists in subjective evaluation of a pattern in the RPs. Therefore, according to the presented results of the investigations, the measures of the RP gave better outcomes, which were shown in a simpler form, as stability indexes. Among all the RP measures, five of them, namely, the DET/RR, LAM/DET, Lent, DIV and Vent were chosen to identify transition between stable (chatter-free) and unstable (chatter-exhibiting) processes. A very important advantage of the RP and the RQA method is the possibility to analyse short time series. Therefore, the method can easily be adopted to monitor cutting processes.
Footnotes
Acknowledgements
The author would like to thank Prof. Kruszynski for the opportunity to use the laboratory of Institute of Machine Tools and Production Engineering at Technical University of Lodz.
Funding
The study was supported by Structural Funds in the Operational Programme – Innovative Economy (IE OP) financed by the European Regional Development Fund – Project No POIG.0101.02-00-015/08-00.