
Abstract
Nowadays there has emerged a series of rapid prototyping processes with great potential, and designers and engineers need to know the accuracy performance of these processes to compare and select the best solution. There is a significant lack of published data related to rapid prototyping processes and feature accuracy. This research was conducted to minimize this gap and provide much needed accuracy in terms of dimensional and geometric information. The methodology includes the summarization of previous studies and definition of a benchmarking part that is composed of elementary shapes representative of different features most likely to be found in a final product. The benchmarking part was controlled in terms of dimensional accuracy, geometric precision and freeform deviation. The sources of errors controlled by the final user were analysed, like Standard Tessellation Language (STL) file format resolution and build direction. Four custom rapid prototyping processes have been used and compared: stereolithography, selective laser sintering, fused deposition modelling and three-dimensional printer. Computer numerically controlled machining has been used as an alternative prototyping process in this study as a standard to compare costs and accuracy.
This work assessed measures that can be used to quantify the accuracy performance for a given part so that the choices for prototyping can be made based on scientific knowledge and best working practices. These results are very useful for designing products to be prototyped or manufactured through direct methods. The results can be used to improve the functionality of prototypes and the decision process through the best systematic approach.
Keywords
Introduction
Rapid prototyping (RP) processes represent a set of technologies that enable the production of physical three-dimensional (3D) parts of arbitrary shape, directly from computer-aided design (CAD) models in a few minutes or hours, with little need for human intervention. Using RP technologies designers and engineers have the freedom to produce physical models of their drawings more frequently, allowing them to check the assembly and function of the project parts, as well as discussing downstream manufacturing issues with an unambiguous prototype. 1
Owing to the evolution of RP technologies and the availability of sub-contracting services, it has become possible today to obtain models and parts in a very short time. A small company with limited resources must be able to analyse and evaluate the various RP system capabilities, justify the technical and financial benefits in adopting the technology into product development process and also decide if they must acquire equipment or, if on the other side, will use the business providers of prototypes to supply their specific needs. 2
RP technologies may be divided broadly into those involving the addition of material with layered manufacturing processes and those involving the removal of material like cutting milling process. Both processes allow the prototype or the part to be obtained directly from the information generated in a 3D CAD system. The removal material is the oldest process and the computer-aided manufacturing (CAM) system is used to calculate the tool cut paths and generates the programme for controlled machines with computer numerical control (CNC). This makes the CNC machining process more complex to use and less independent of operator skills, but not less important.
Selection of the most suitable RP process for a specific part creation is a difficult task owing to the proliferation of RP processes and materials. Multiple considerations, such as good dimensional accuracy, fine surface finish, short manufacturing time, and low production cost, are desired and no one process is superior in all aspects.3,4
For a wide variety of applications the question of accuracy is more or less irrelevant, like conceptual modelling, anatomical modelling, medical applications, design adds, etc. But for the most important applications, such those involving connections and assemblies or fitting and functional components, the dimensional and geometric precision issues are of primordial importance.5,6
The evolution in RP processes has initiated new possibilities in terms of the geometry, and currently the main challenge is to achieve fabrication of a multi-functional part with requirements of precision and tolerance in order to integrate them into function tests and small production.7,8 In recent years, the advent of 3D printing (TDP) technologies came to the foreground of competitive advantages of these equipments in terms of cost and manufacturing speed. 9
The ZPrinter (Zprinter ® technology) is probably the most recognized TDP process and despite the developments occurred in these equipments they are still seen as a ‘concept modeller’. The objectives that should be taken into consideration when a designer or engineer selects TDP equipment relatively to other RP processes depends on the actual knowledge of existing equipment in terms of capabilities to reproduce the design intend, but increasingly want to ensure that the geometric and dimensional accuracy of parts obtained fits the requirements set and assist the designers in the task of performing a better use of RP technologies.7,9,10
This work surveys the current state of TDP technology, specifically the ZPrinter process in terms of expected geometric and dimensional accuracy compared with other RP processes to obtain models directly from 3D CAD applications. It also gives advice to designers for the development of proposals for new products. Issues related to the dimensional and geometric accuracy of the models obtained by RP is often avoided and thus is not easy to estimate accurately the error values obtained in the functional surfaces of the models.
There are three questions that this study tries to answer.
The continuous generation of finer STL models improves the geometric and dimensional quality of physical model?
What is the influence of layers orientation on geometric and dimensional quality of the model?
The processes that allow the best dimensional quality to be obtained are also those that provide greater dimensional accuracy?
Background and research approach
A number of benchmark designs have been reported previously for the comparison of different RP technologies. Several articles, works, books, conferences and journals have been published. Some books written by Johnson 11 and Jacobs12,13 have actually looked into a unified description of all RP technologies based on their fundamental principles. Ippolito et al. 14 made use of stereolithography (SLA), Solid Ground Curing (SGC), fused deposition modelling (FDM) and Laminate Object Manufacturing (LOM) to investigate and compare dimensional accuracy and surface finish. Dickens 15 gave a brief qualitative and historical overview of existing developments in RP technology in terms of their techniques and applications. A qualitative and quantitative assessment is also provided by Chua et al. 3
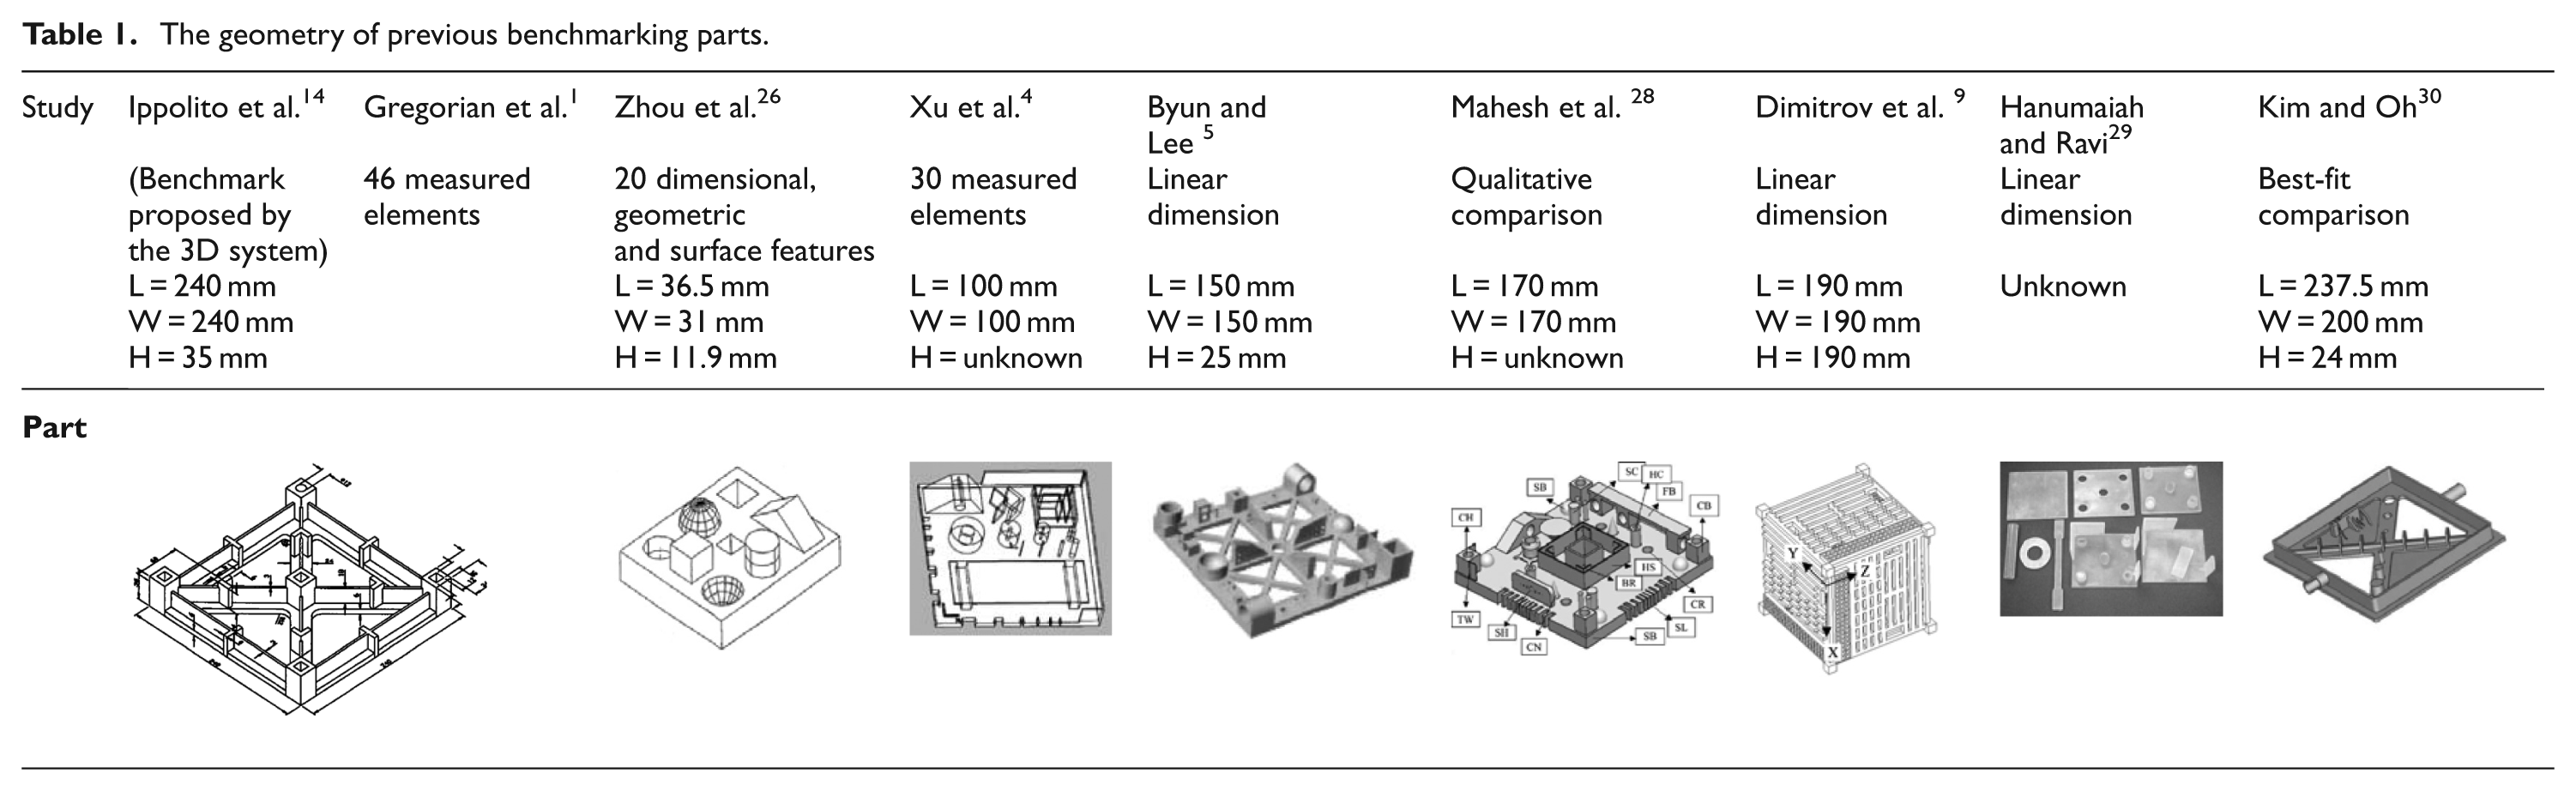
Metrics to evaluate RP system performance are speed, cost and dimensional accuracy. Current approaches for analysing these factors have been done based on building ‘benchmark’ parts. Several benchmark parts have been developed to evaluate specific RP systems or particular aspects of a RP process (Table 1). These benchmark parts have typically resulted in user-dependent or system-dependent tests that do not provide meaningful data for comparison with other applications, systems or parts. Current benchmark parts often benefit a specific process or do not fully represent the features of ‘real-world’ parts.
The geometry of previous benchmarking parts.
Accuracy is evaluated based on dimension errors, geometric errors and surface roughness of fabricated parts. To improve RP accuracy/quality we can act on the technology and equipment, or on the other hand adopt systematic methods more in line with scientific knowledge and best working practices. The most common sources of inaccuracy in a RP process can be categorized into mathematical error, process-related error and material-related error. 16 These categories cover such aspects as data preparation process and tessellation, slicing orientation and location and staircase effect.17–23 The inherent characteristics related to materials are solidification, shrinkage and distortion, which are also reported as a source of errors.10,24–26 It is difficult to separate process-related issues from those related to the material and it is better to analyse the errors of the system as a whole.
It is, however, remarkable how the question of accuracy, even in most published works, is carefully avoided. Other publications give only a superficial view on the matter without concrete data for proper analysis and evaluation of the expected prototype accuracy.5,6,27 Previous works developed are present in the Table 2.1,4,9,14,28,29
Summary of the results of studies published.
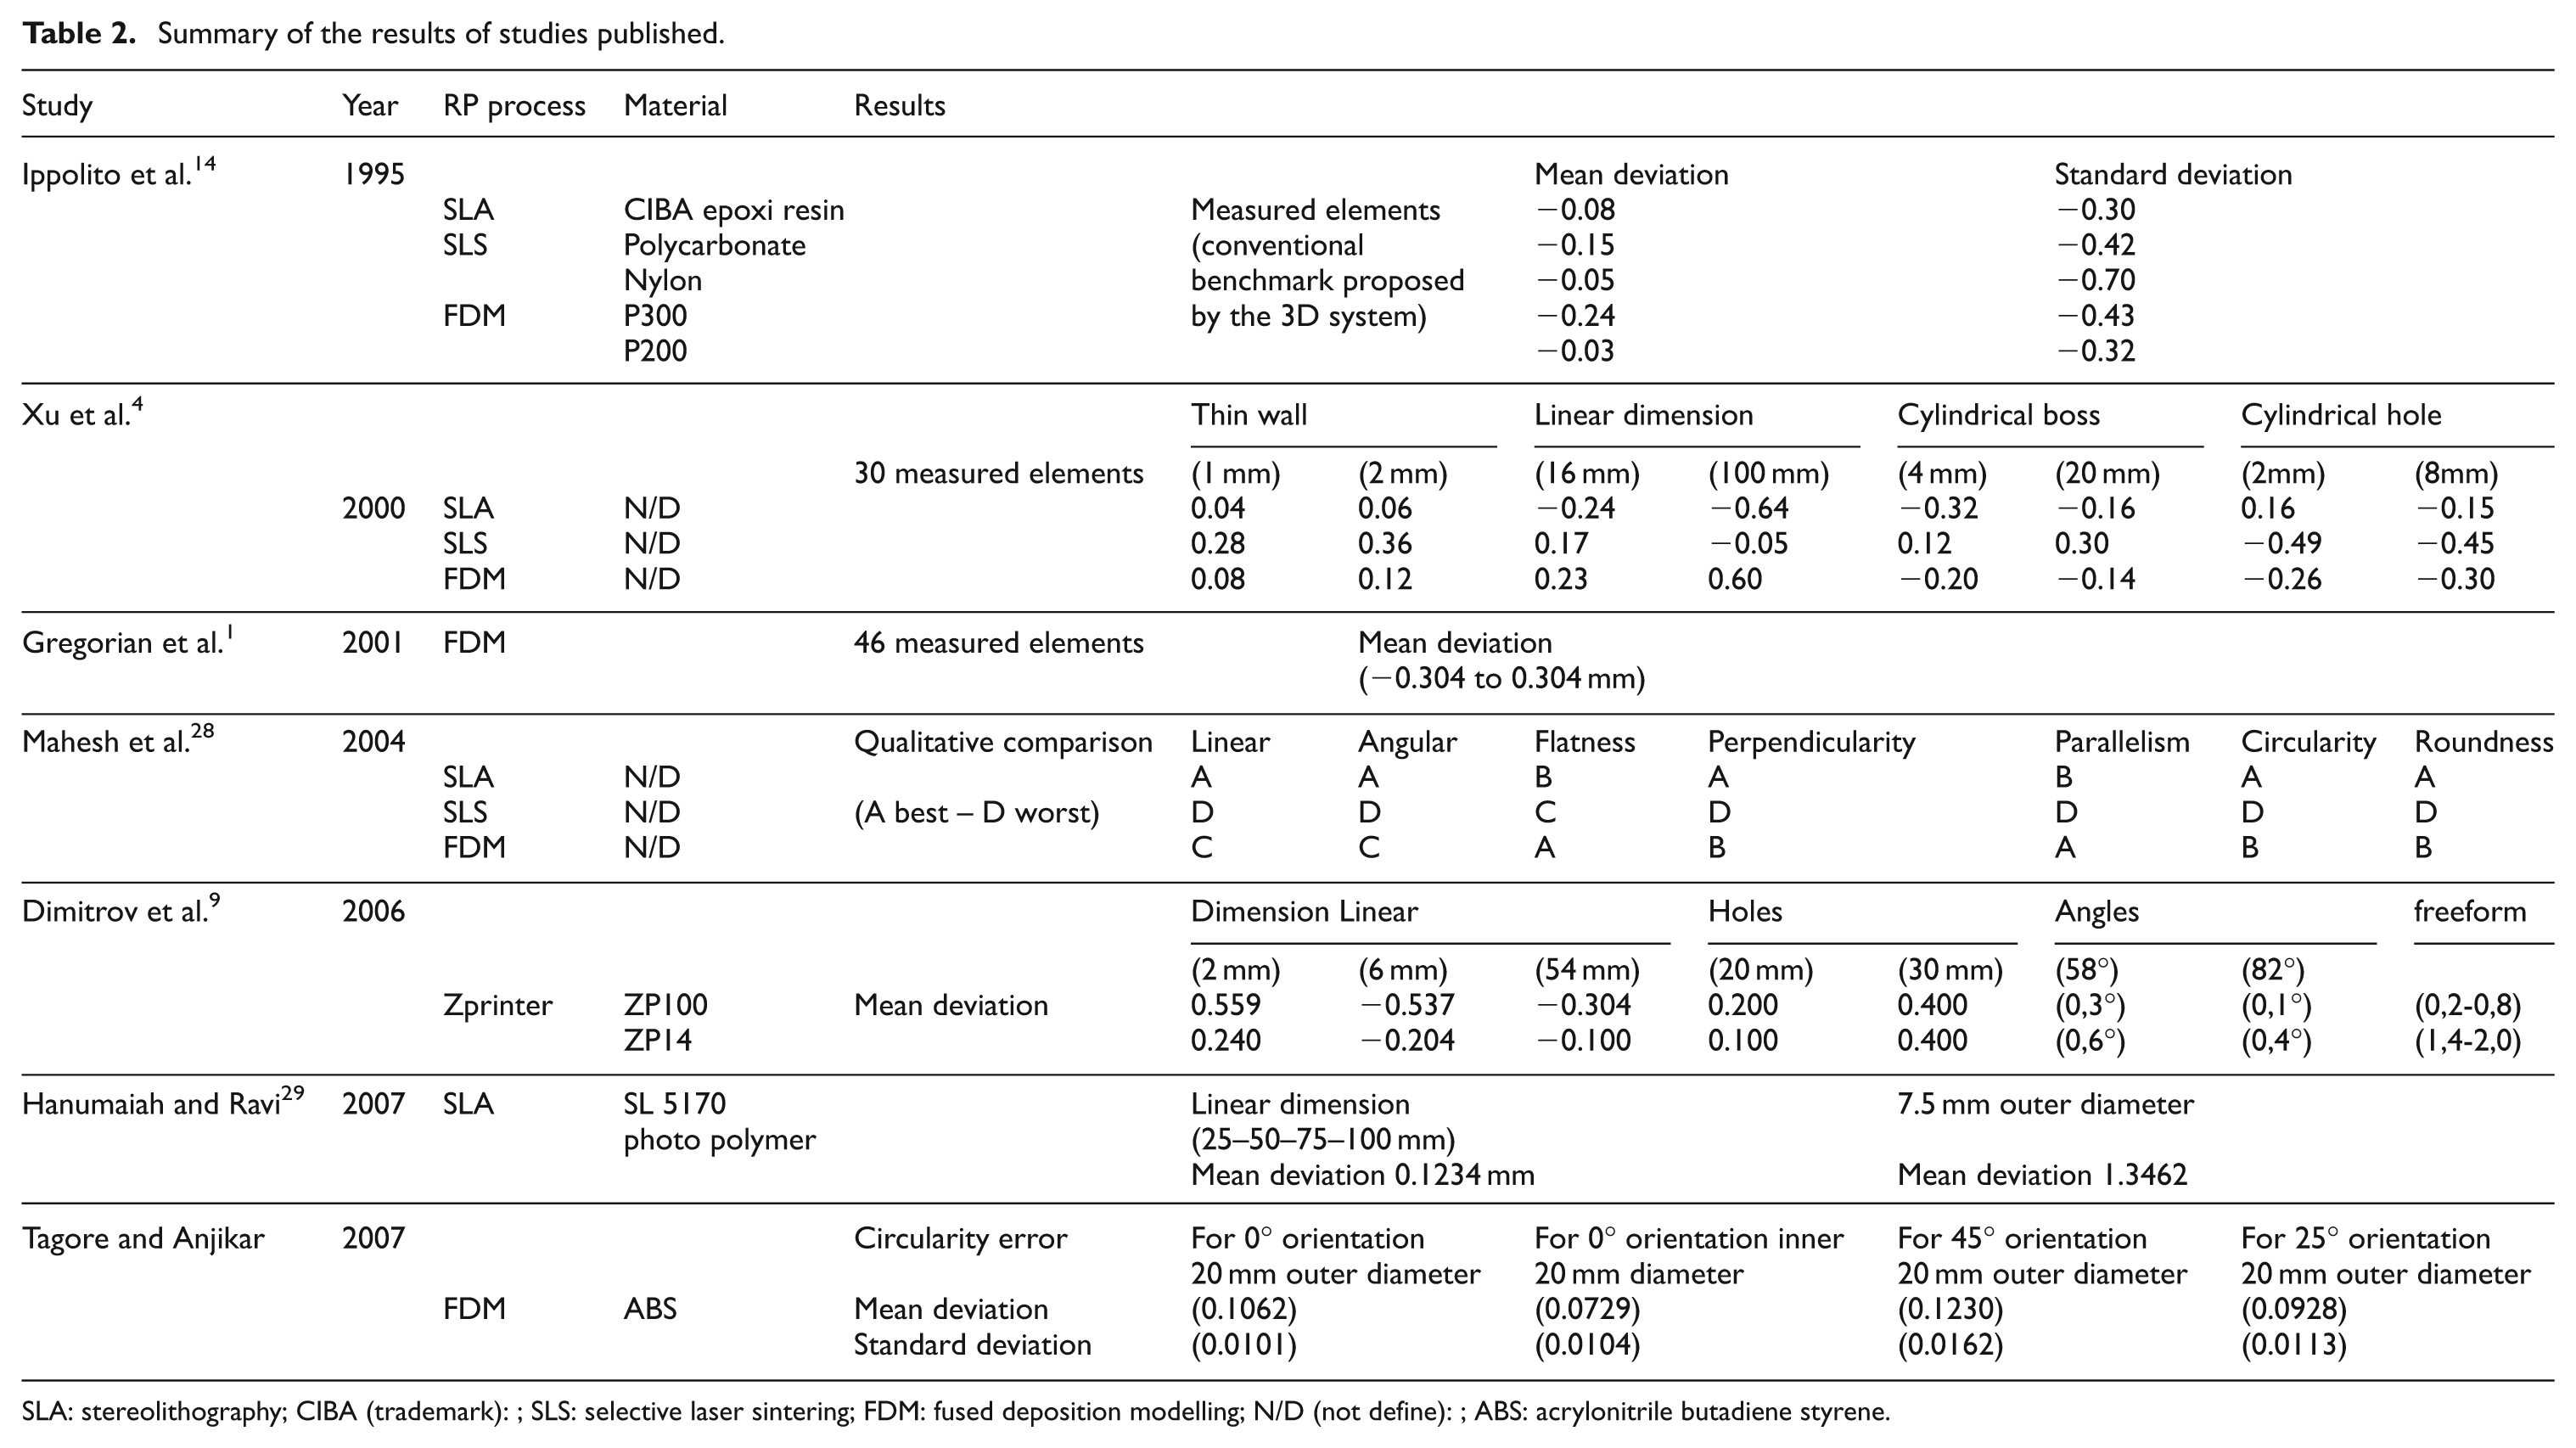
SLA: stereolithography; CIBA (trademark): ; SLS: selective laser sintering; FDM: fused deposition modelling; N/D (not define): ; ABS: acrylonitrile butadiene styrene.
The most recent study presented by Kim and Oh, 30 a completed benchmarking was conducted in terms of mechanical properties, such as tensile and compressive strength, hardness, impact strength, heat resistance, surface roughness, geometric and dimensional accuracy, manufacturing speed and material costs, involving various specimens and parts models fabricated by SL/SLA, selective laser sintering (SLS), fused deposition modelling (FDM), LOM, TDP and Polyjet processes. However, the measuring of geometric and dimensional accuracy was performed in two parts using the ‘merging process’ or ‘best-fit comparison’. This process allows obtaining the deviations between a point cloud of the surface of the model obtained through a 3D laser scanner and compare with 3D CAD data of model. This process only gives an idea of the error distributions but does not provide a concrete value to quantify the error of wall thickness or the deviation of cylindricity of the holes for example.
Material and methods
The approach used in this work was designed to be unbiased regarding any specific process or material and can enable users to generate meaningful data for comparison and evaluation of RP processes. In RP processes, not only the building time and building cost has implications on the selection of RP processes. The dimensional accuracy and quality related to the geometric features of the part are also important in the process. Analysis procedures for various feature characteristics can be defined, including for example flatness surfaces, roundness of holes and cylinders, thickness of walls and other feature aspects.
Based on an extensive literature study of previous research and in-house experience, a benchmarking procedure was developed aimed to evaluate the performance capabilities regarding rigorous geometric shape and dimensioning accuracy. In this way it is possible to create functional and non-functional features of real parts and also free-form surfaces, fillets and draft angles can be tested. The developed part and inspected features are showed in the Figure 1.
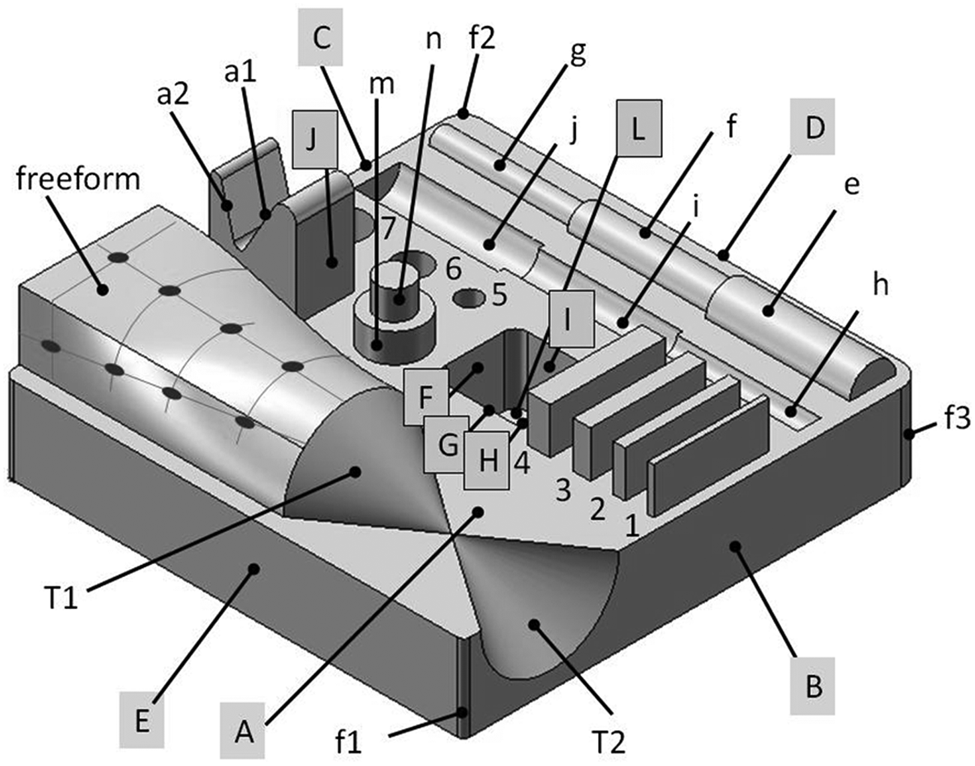
The benchmarking part and inspected features.
Thirty-eight geometric shapes, 22 dimensional elements were inspected, plus 12 points of the freeform surface. The geometric inspection includes the most relevant features that can be found in parts manufactured with RP processes.2,7,31 For dimensional accuracy, a range of fine, small, medium and large distances, radius and diameters, and taper amplitude were considered. The diagrams of the controlled elements are showed in Figure 2.
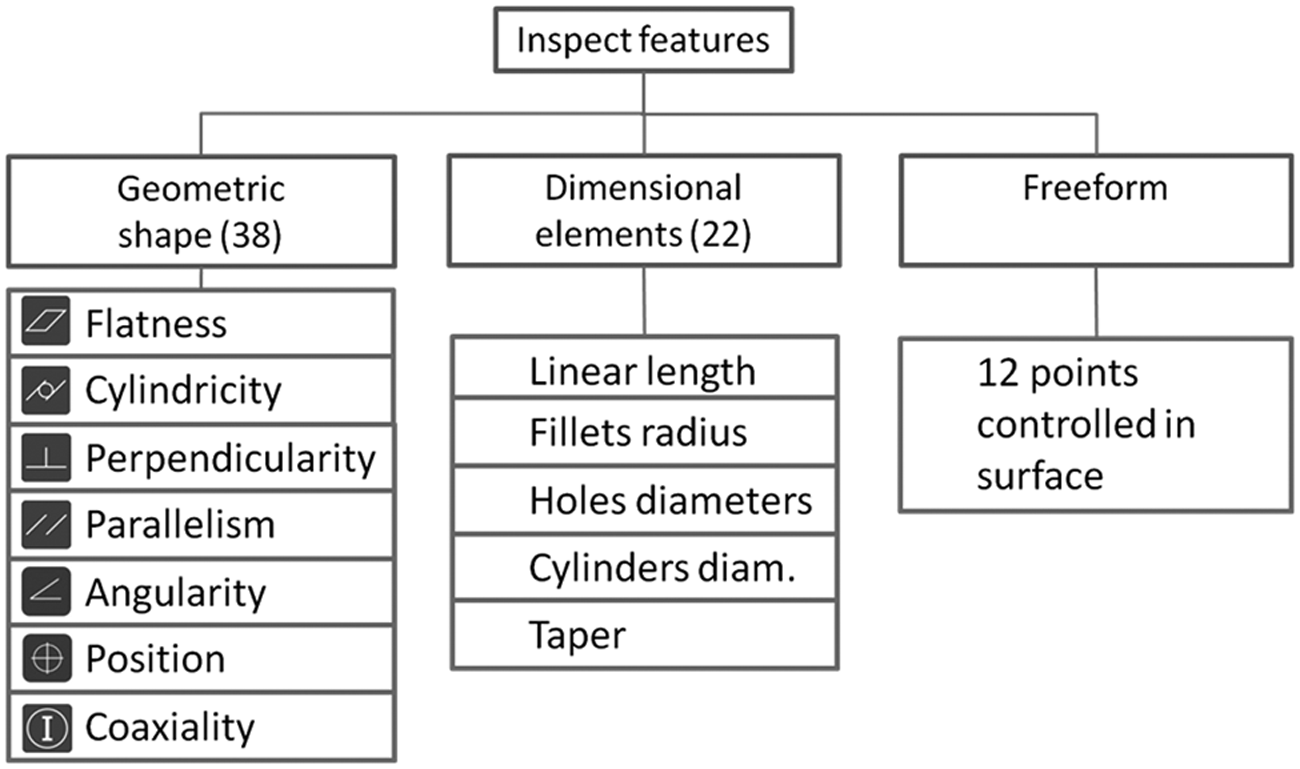
Types of features inspected.
First, the experimental study was conducted to demonstrate the use of the benchmark for the performance evaluation of the TDP (ZPrinter) process. Then, the methodology involved the comparison of the TDP process with other RP processes and also CNC machining, this last one allows obtaining parts and models directly from CAD information. Figure 3 presents the systematic approach methodology.
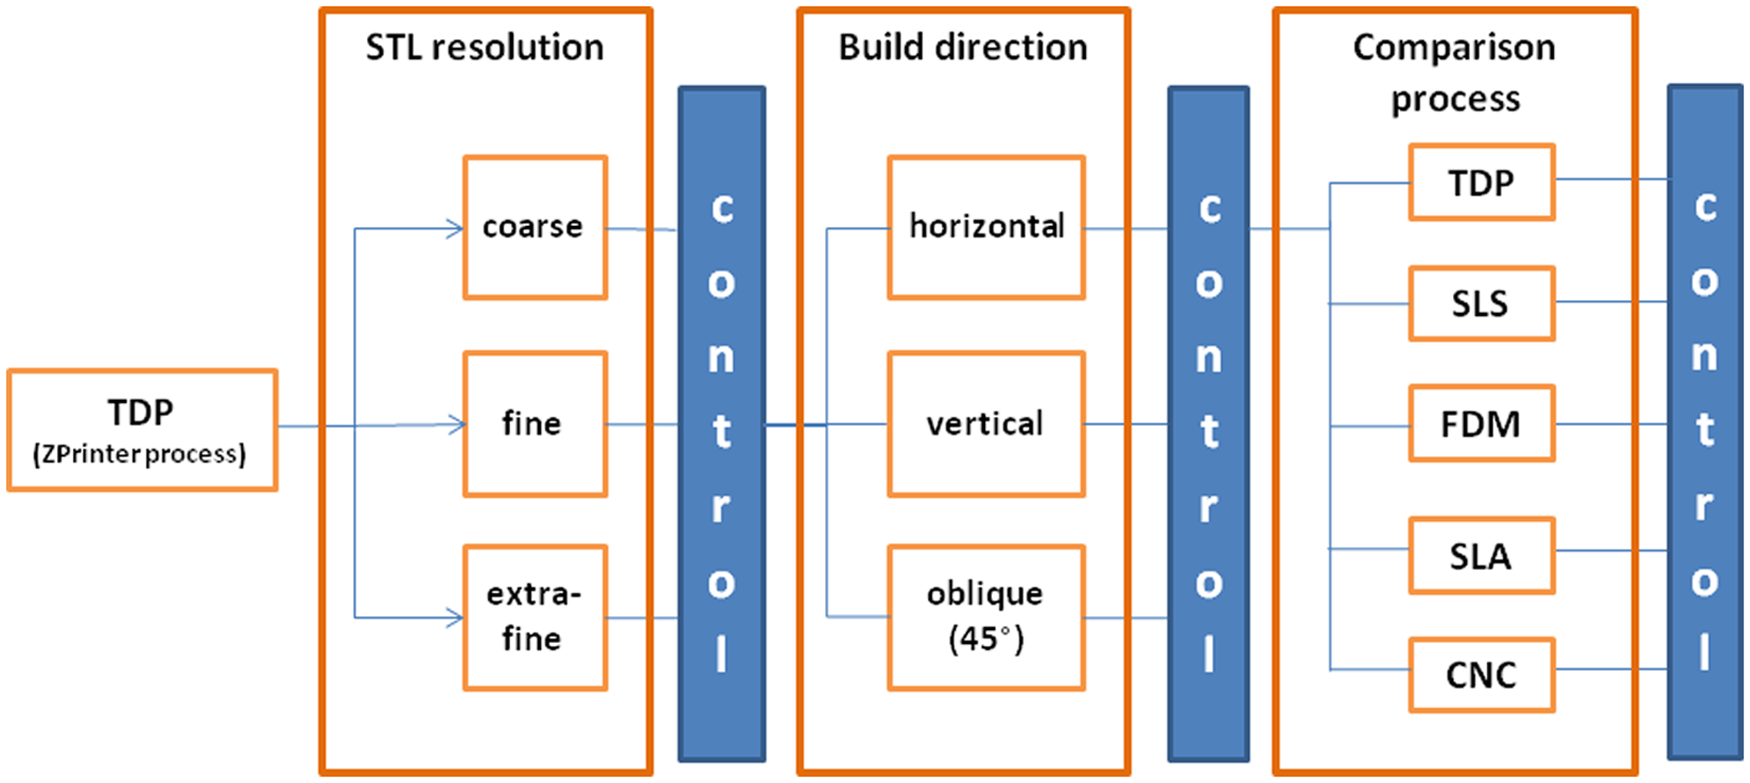
The systematic approach methodology.
Four well-known RP processes have been used in our study: SLA, SLS, FDM and 3D printer (Zprinter ® technology). CNC machining is an alternative process commonly disposable in prototyping online request service, and was also used in the study.
SLA produces parts in a polymeric resin based on a photo polymerization process. 12 The benchmarking part was produced in a Viper Si2 machine (3DSystems Corp., SC, USA). The FDM 1 was produced by the Dimension SST machine (Stratasys, Inc., MN, USA) in acrylonitrile butadiene styrene (ABS). The SLS 13 benchmarking part used in this study was obtained from a SinterStation 2500 Plus (3DSystems Corp., SC, USA) in durable polyamide material (DuraForm® PA Plastic). Finally, the benchmarking part used to assess the TDP technology was obtained in a ZPrinter 310 Plus (ZCorporation, MA, USA) using ZP 130 (powder) and ZB 58 (binder) material.9,10 The part obtained using a CNC machining process32,33 was machined in a polymeric material (RenShape BM 5460) with a Roland MDX 650 milling machine (Roland DG Corporation, Japan).
The benchmarking parts were modelled with a 3D CAD software (Solidworks 2010, Dassault Systèmes SolidWorks Corporation, MA, USA) and a STL file was used as a CAD/RP data interface. The STL part file format is a standard CAD to RP data interface used by all RP systems. 34 This format generates an approximate model and frequently it is not a robust interface. Although, other interfaces have been proposed for use to translate models from CAD to RP systems,35,36 the STL file is still the most used format.
The first step of the study was to determine the better STL resolution to convert 3D CAD models. Three benchmarking parts were built using TDP with different STL resolution (coarse, fine and extra-fine). The model in STL format designed by ‘fine’ allowed to obtain the better results and was generated with 2838 triangles and chordal deviation tolerance of 0.054 mm, angular deviation tolerance 10° and file size 141,984 (bytes). No gaps were detected in the ‘STL model’ and another inherent problems of this format37,38 did not prevent the production of the model.
The second step of the study was to determine the better building direction or how it affects the accuracy of the model. There are several studies on the best part orientation to satisfy different objectives.23,39–41 Build orientation can also be considered as a solution to problems of trapped materials, particularly for some RP processes.42,43 This study confirms that the horizontal build direction is the best to produce the part. The horizontal position minimizes the number of required layers to obtain the model and maximizes the area corresponding to the part for each layer. Considering the topology and orientation of the features used in the benchmarking model, the horizontal direction allowed more accurate parts.
Additionally, and before analysing in detail how accurate the models are, we also investigated the manufacturability cost by simulation through three online quotations to request services. The results represent the average values and they are presented in comparative terms. The 100% corresponds to the expensive value obtained by the CNC machining process with 340 Euros and the cheaper was the ZPrinter process with 75 Euros.
Figure 4 resumes the comparative results obtained for the STL resolution analyses, building direction and processes comparison. The analyses of the dimensional and geometric performance were done summing all the results measured in the coordinate measuring machine (CMM) control.
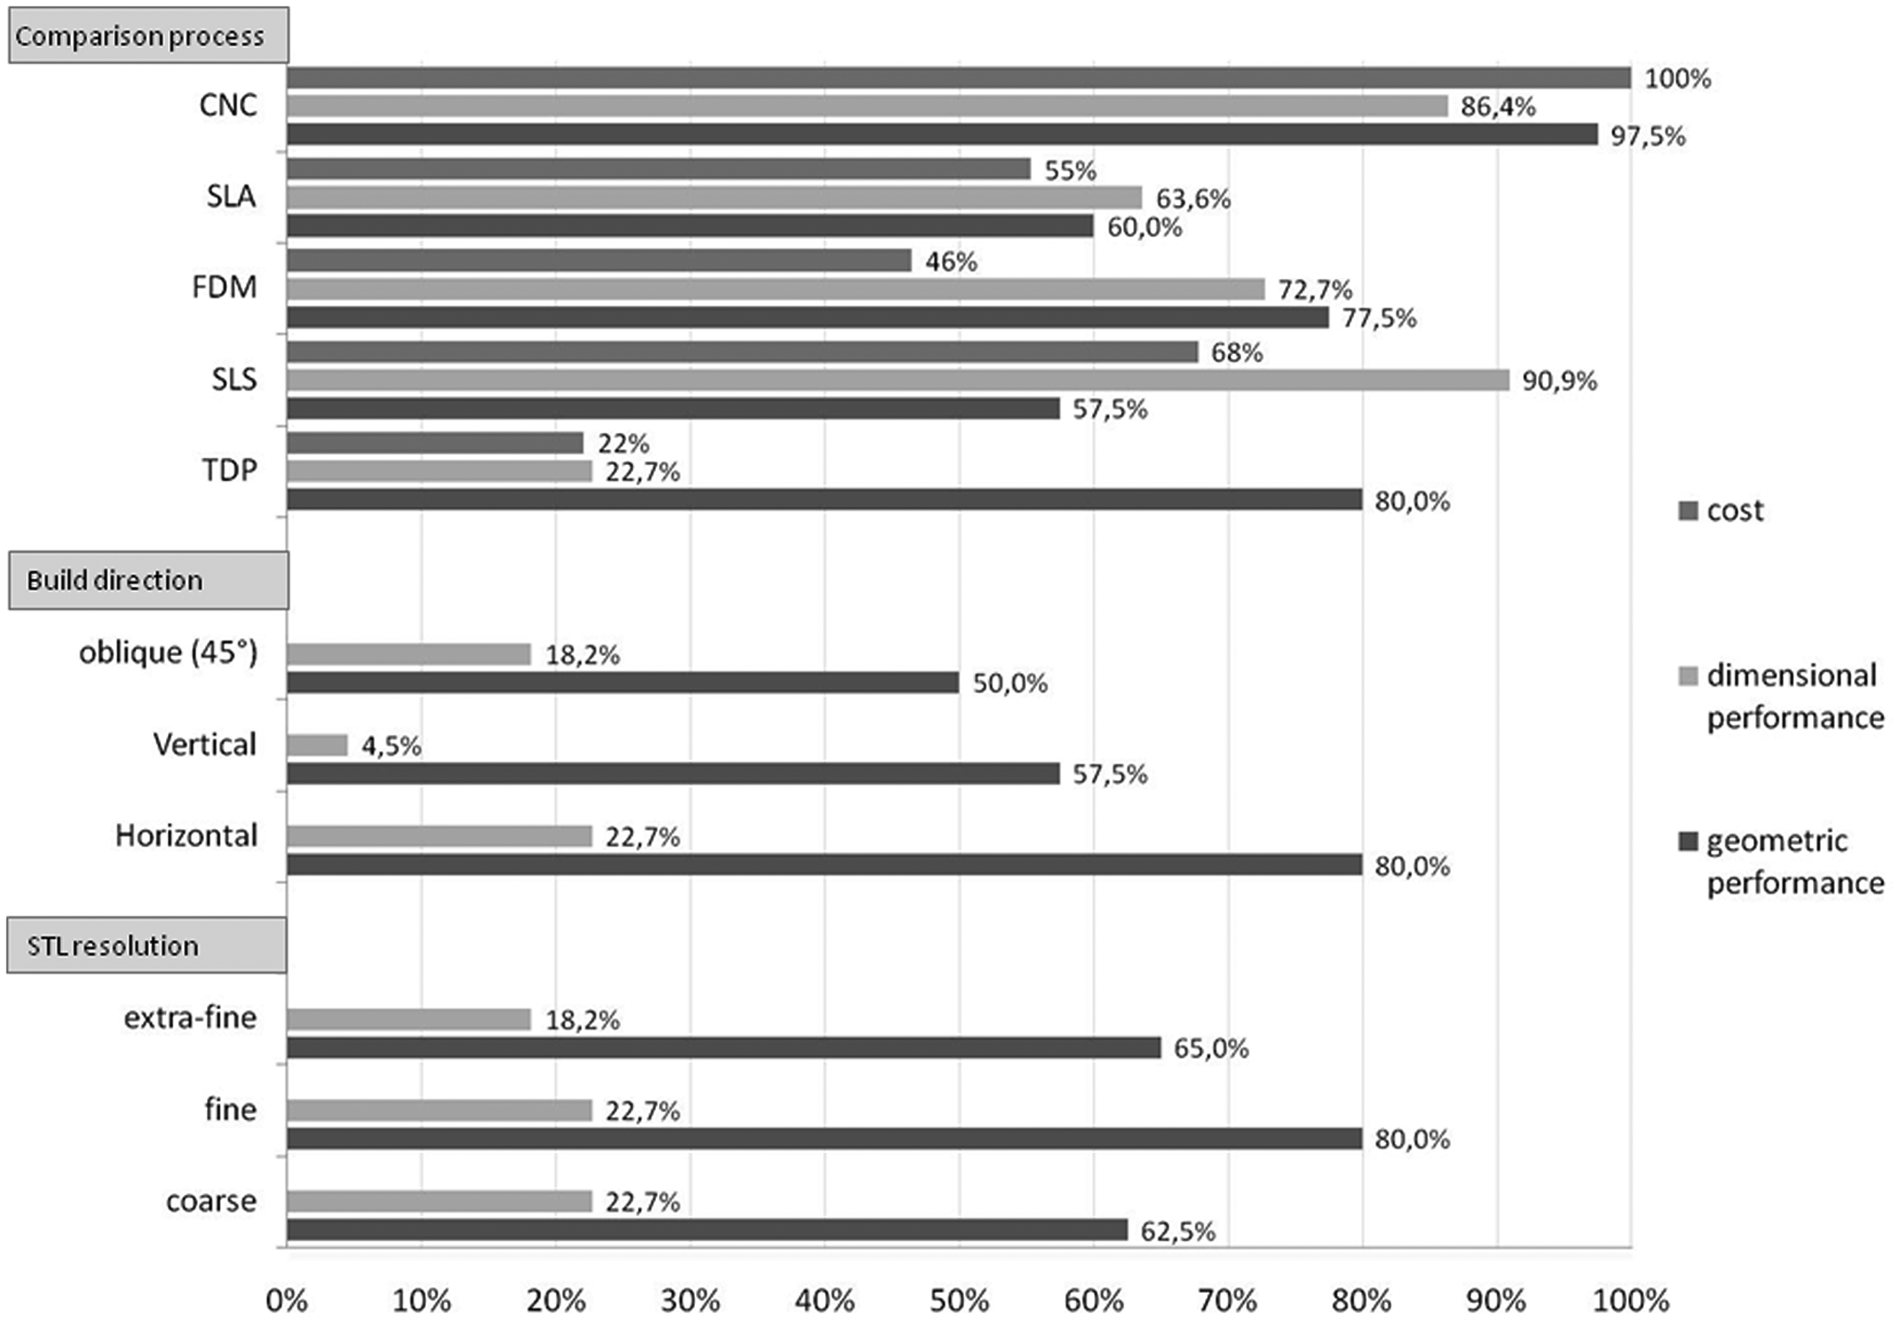
Global results obtained.
Measurement of the benchmark part with CMM
To analyse the accuracy of all models obtained, these were measured and compared with the original digital CAD model. The comparison of the benchmarking part was realized with a computer controlled coordinate measuring machine (MAXIM, Aberlink, UK) equipped with PowerInspect software (Delcam, Birmingham, UK). The implementation of the procedure began with the referencing of the models (Datum define) using the PLP alignment (plane-line-point). 31 Surface ‘A’ was chosen as the reference plane, and surface ‘C’ and centre of hole #7 were chosen to define the line and point, respectively.
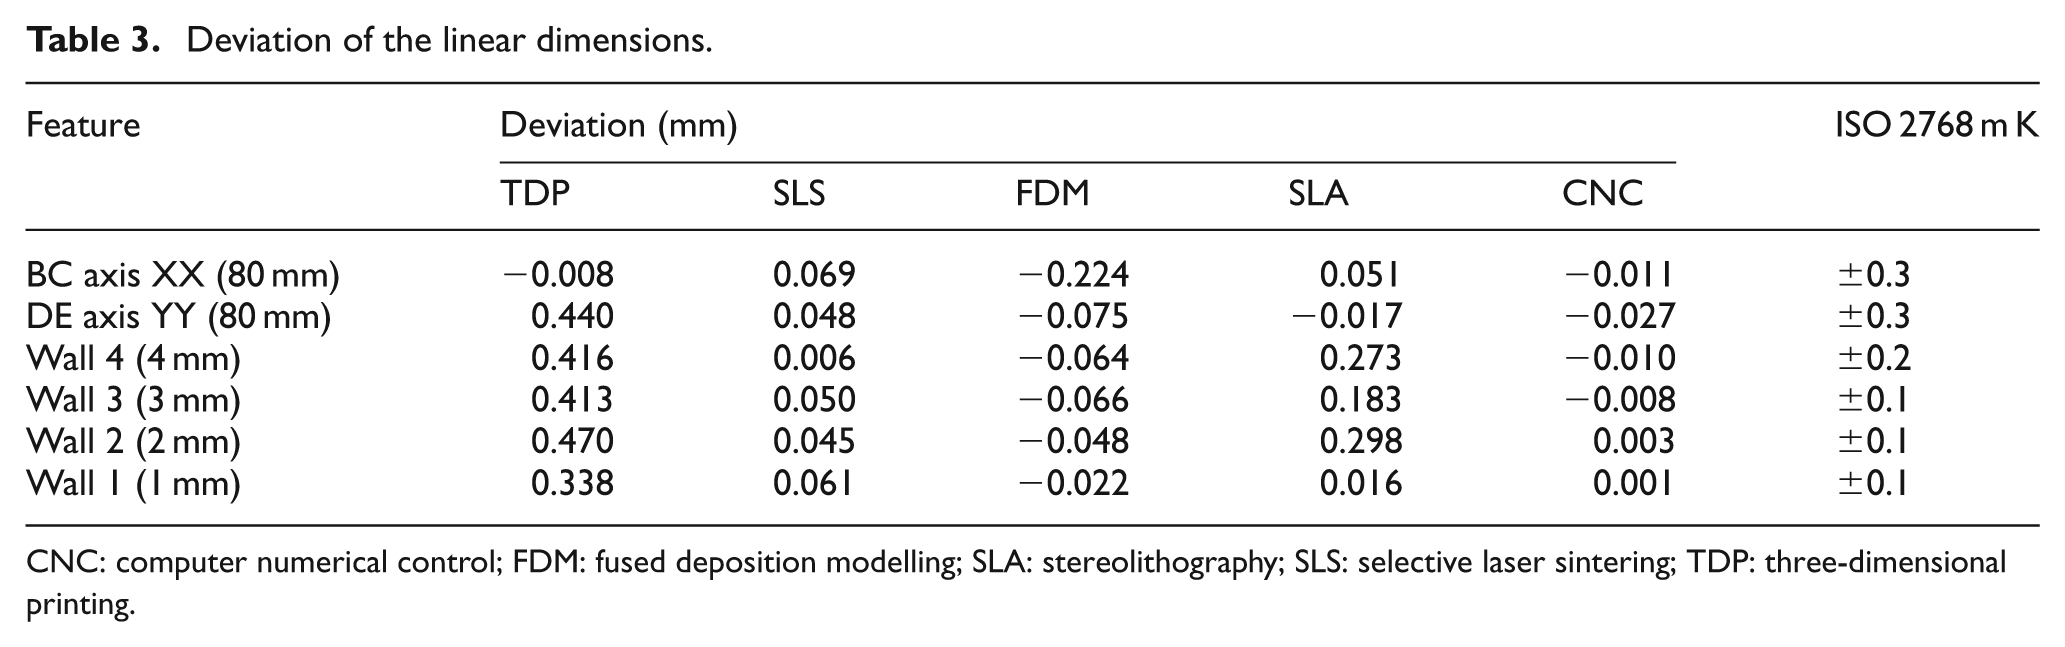
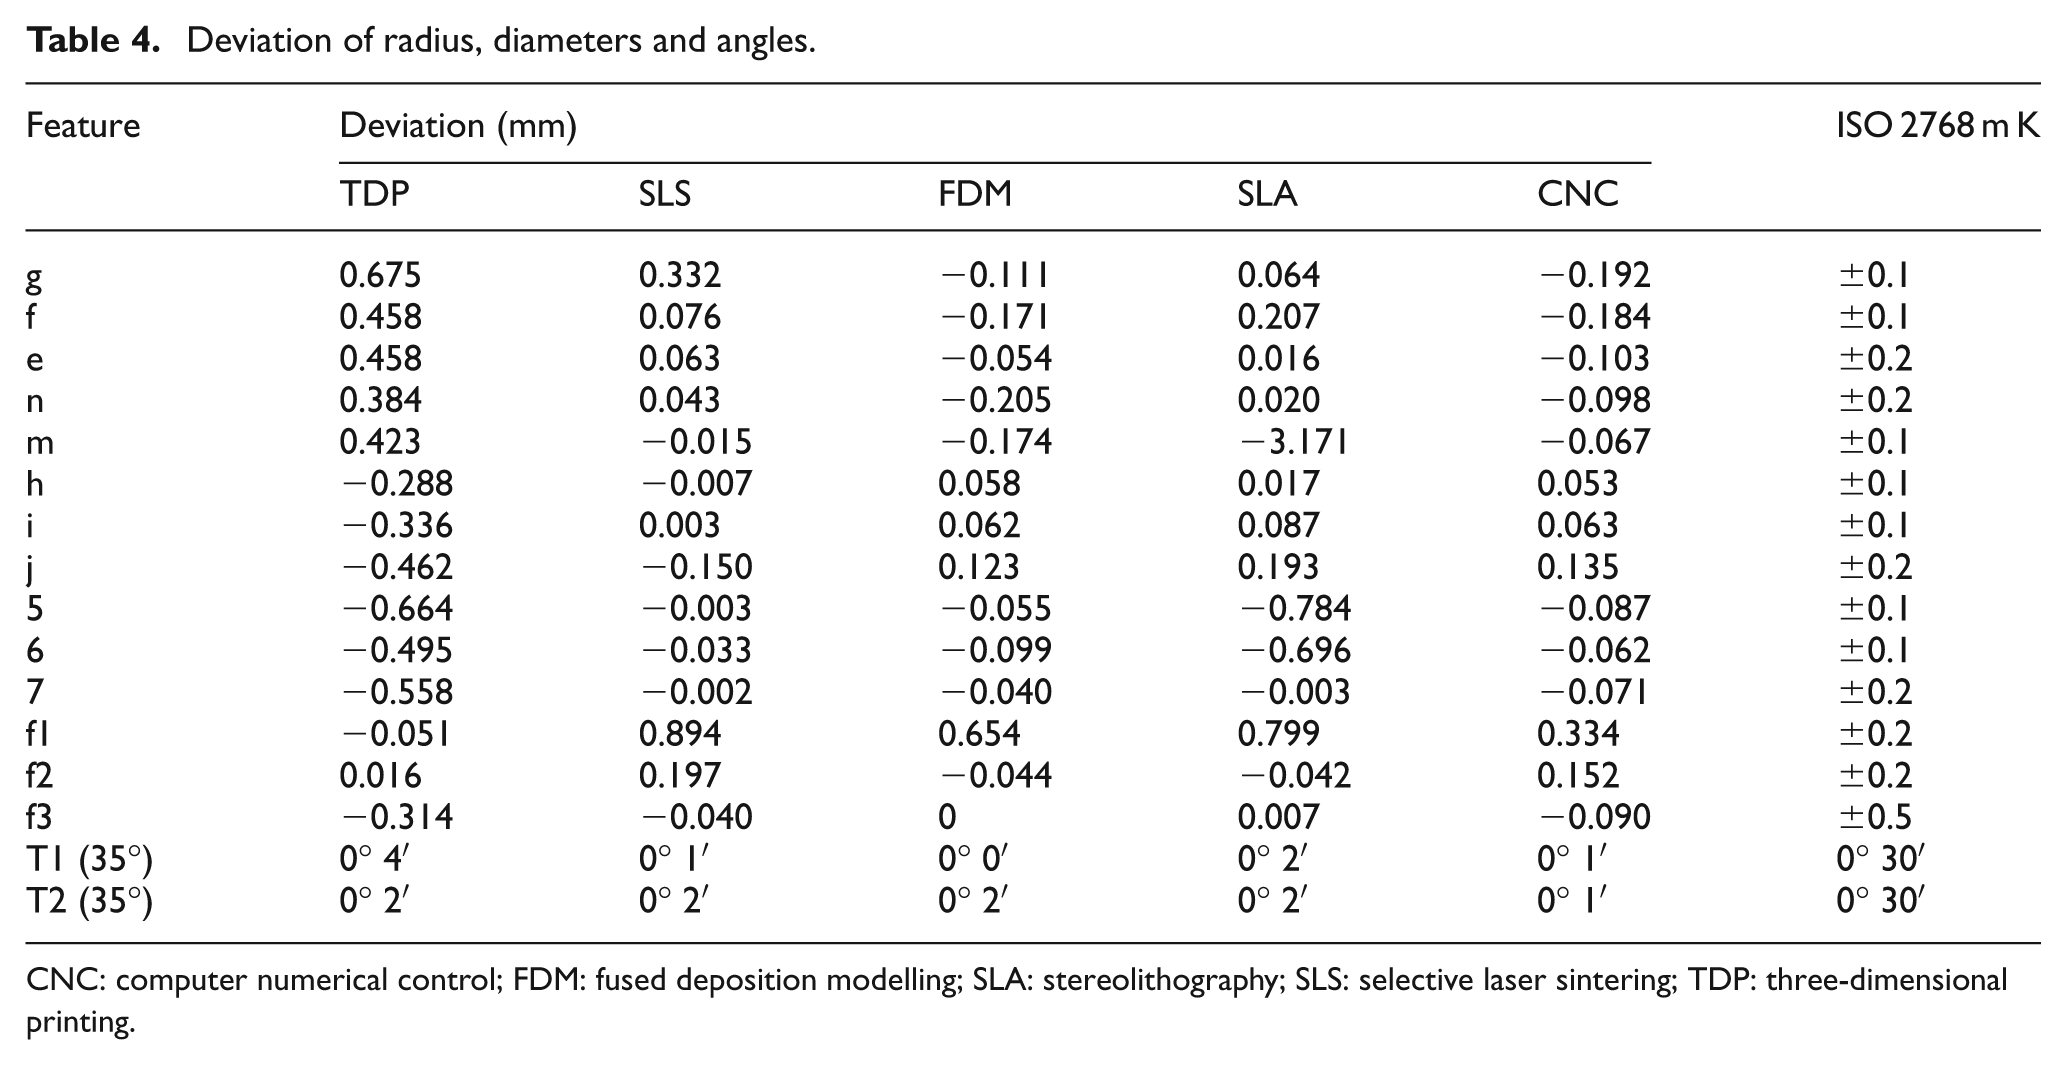
Tables 3 and 4 compares the features built by the various RP processes in terms of dimensional accuracy. The standard ISO 2768-mk was established as the criterion of tolerance to validate the accuracy of each model. The features analysed were: total length of the part, thickness of the walls (#4, #3, #2, #1), external radius (g, f, e), diameters (n, m), internal radius (h, i, j), diameters of the holes (#5, #6, #7) and slope of the cone (T1 and T2). The results of geometric control are presented in Tables 5 and 6 and ISO 2768 mk was again selected to define the criteria of tolerance.
Deviation of the linear dimensions.
CNC: computer numerical control; FDM: fused deposition modelling; SLA: stereolithography; SLS: selective laser sintering; TDP: three-dimensional printing.
Deviation of radius, diameters and angles.
CNC: computer numerical control; FDM: fused deposition modelling; SLA: stereolithography; SLS: selective laser sintering; TDP: three-dimensional printing.
Geometric deviation of flatness and cylindricity.
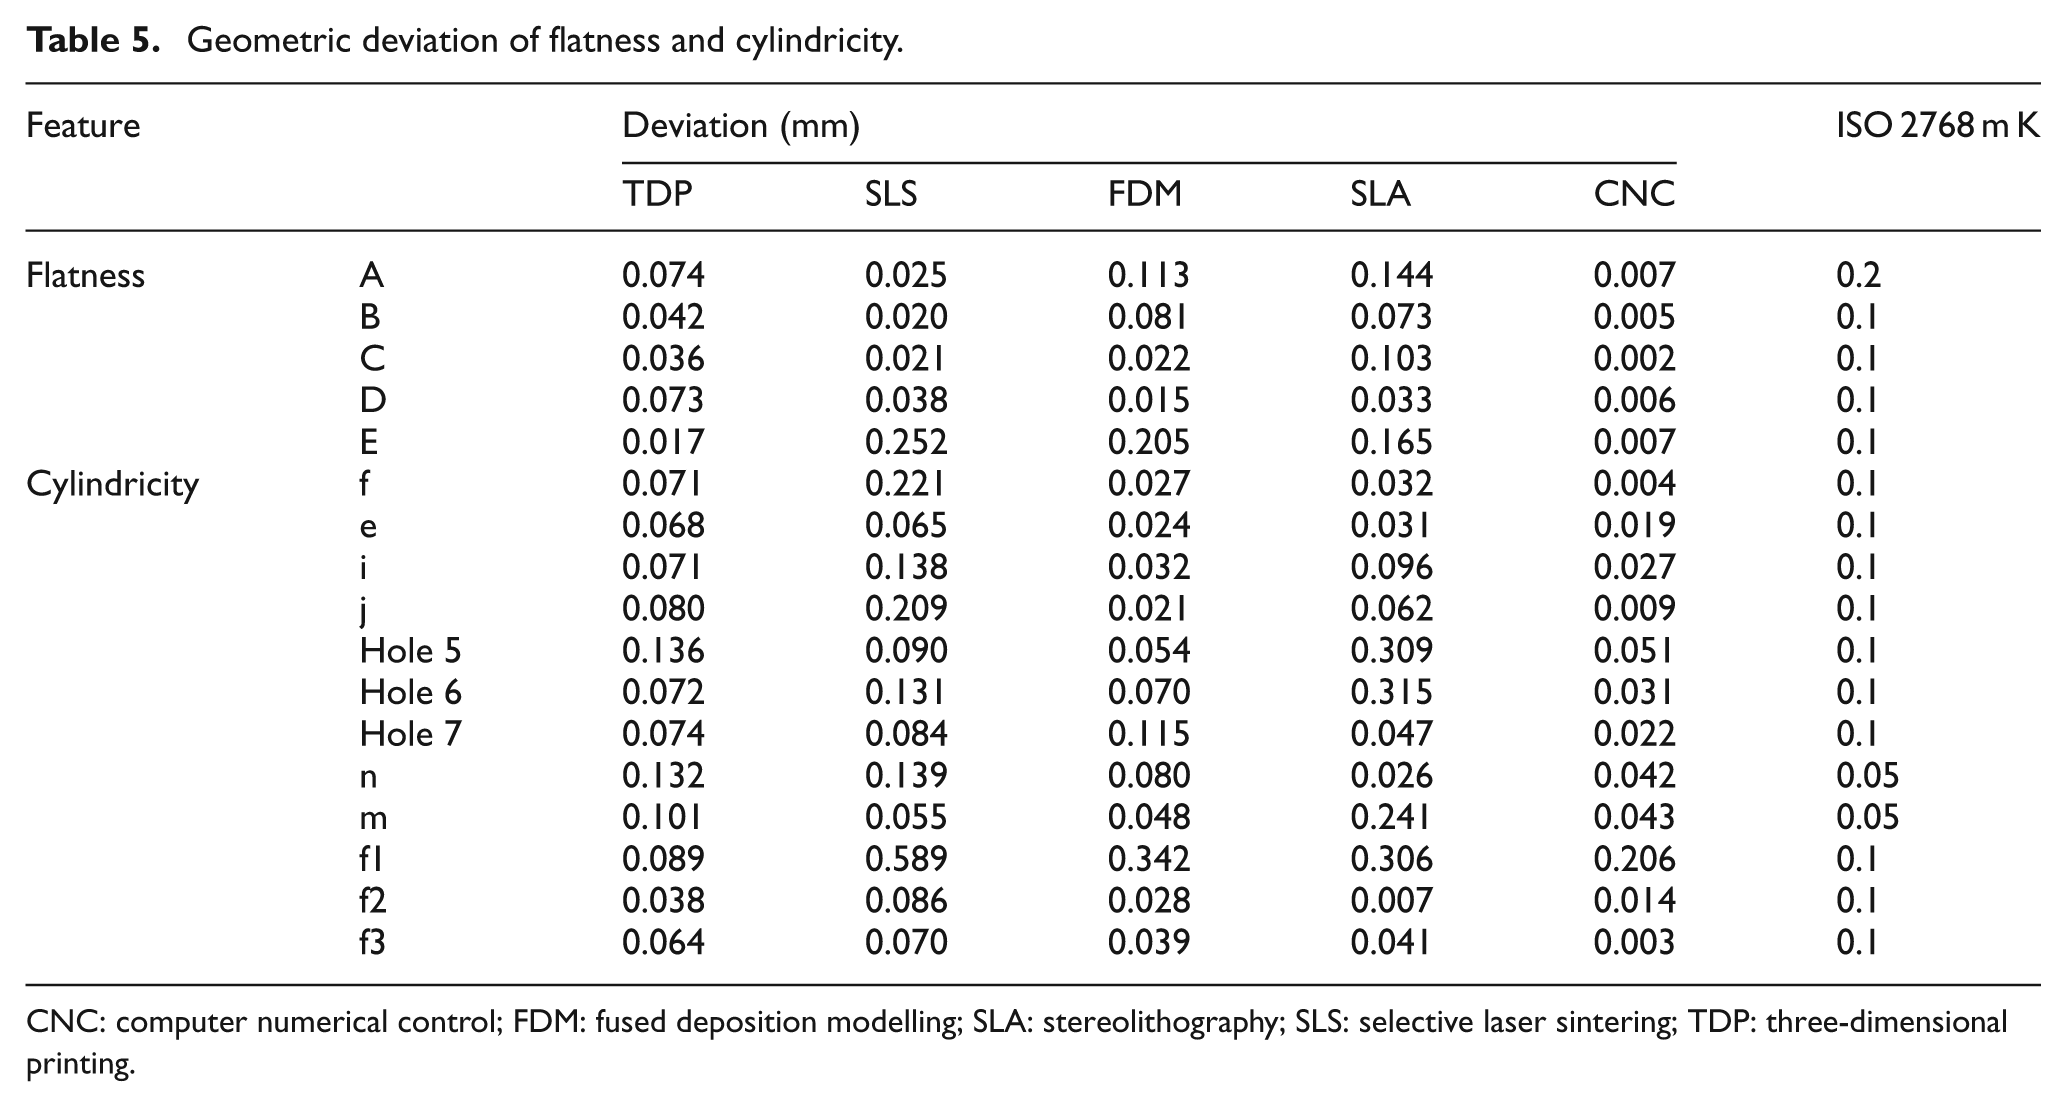
CNC: computer numerical control; FDM: fused deposition modelling; SLA: stereolithography; SLS: selective laser sintering; TDP: three-dimensional printing.
Geometric deviation of perpendicularity, coaxiality, parallelism, position and angularity.
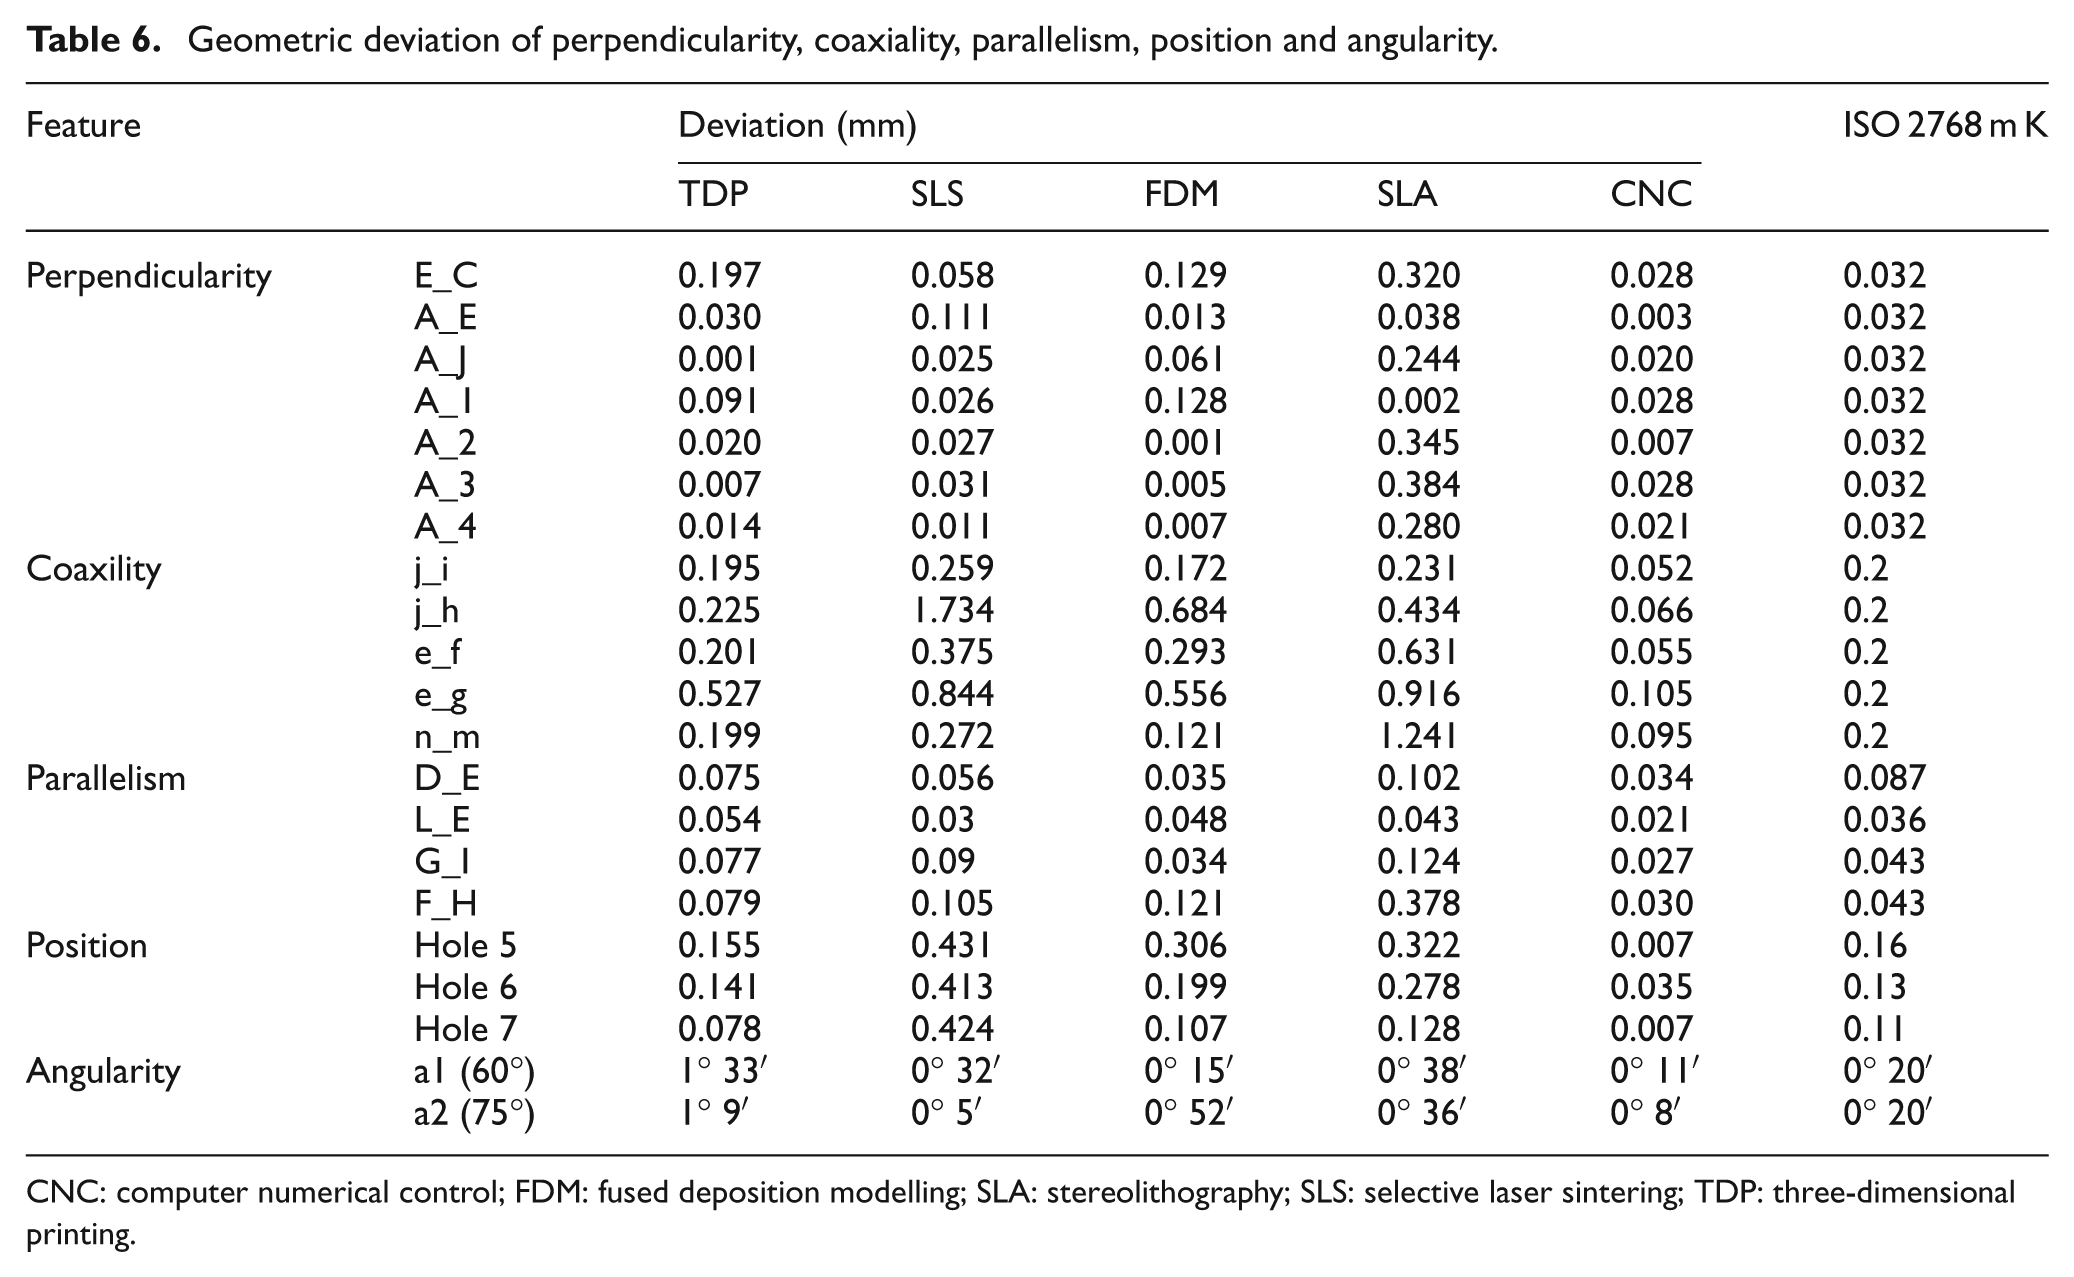
CNC: computer numerical control; FDM: fused deposition modelling; SLA: stereolithography; SLS: selective laser sintering; TDP: three-dimensional printing.
For the measurements of the freeform surface of the benchmarking part, twelve points were controlled comparing the volumetric deviation (X, Y and Z position) recorded in a physical model with respect to its theoretical position indicated by the 3D CAD model. Table 7 contains a summary of the most significant values. Figure 5 presents the individual results registered for each point of the freeform shape of the benchmarking part.
Results of the measurements made on the freeform surface.
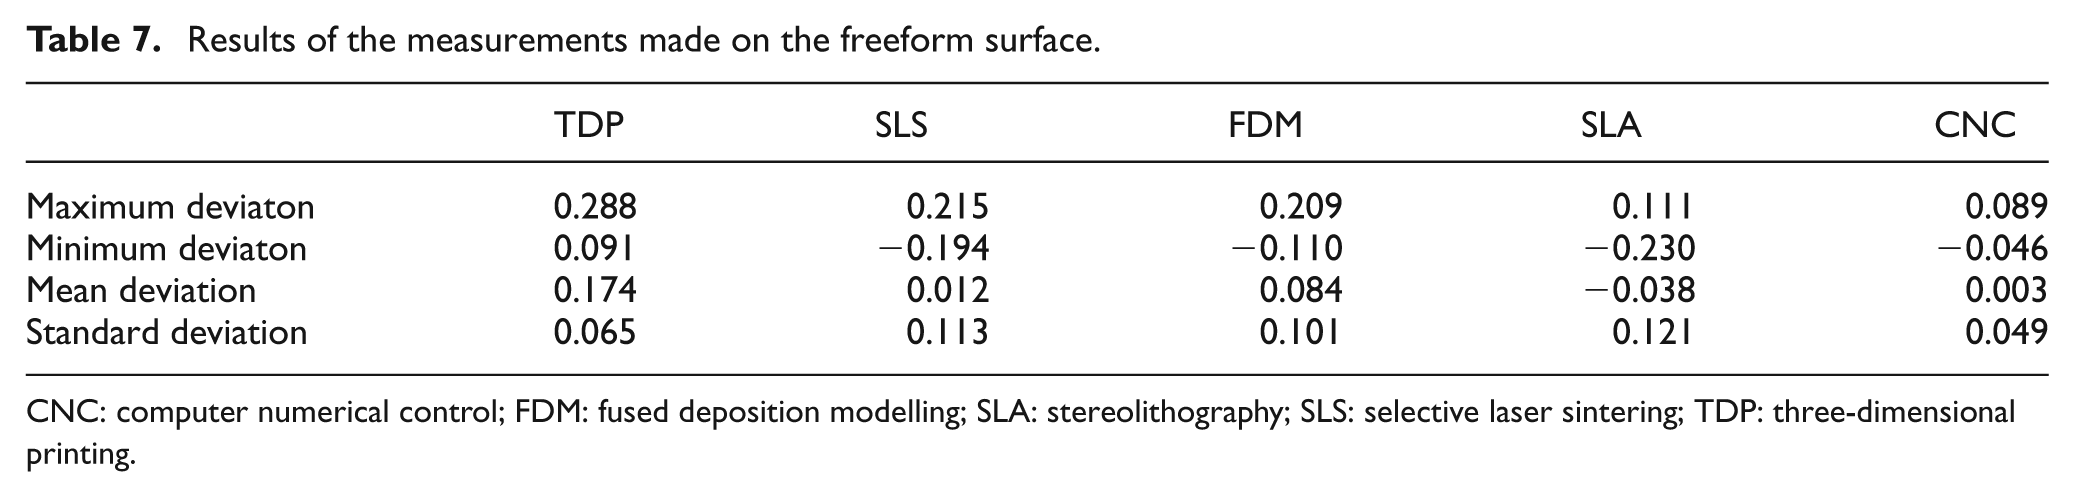
CNC: computer numerical control; FDM: fused deposition modelling; SLA: stereolithography; SLS: selective laser sintering; TDP: three-dimensional printing.
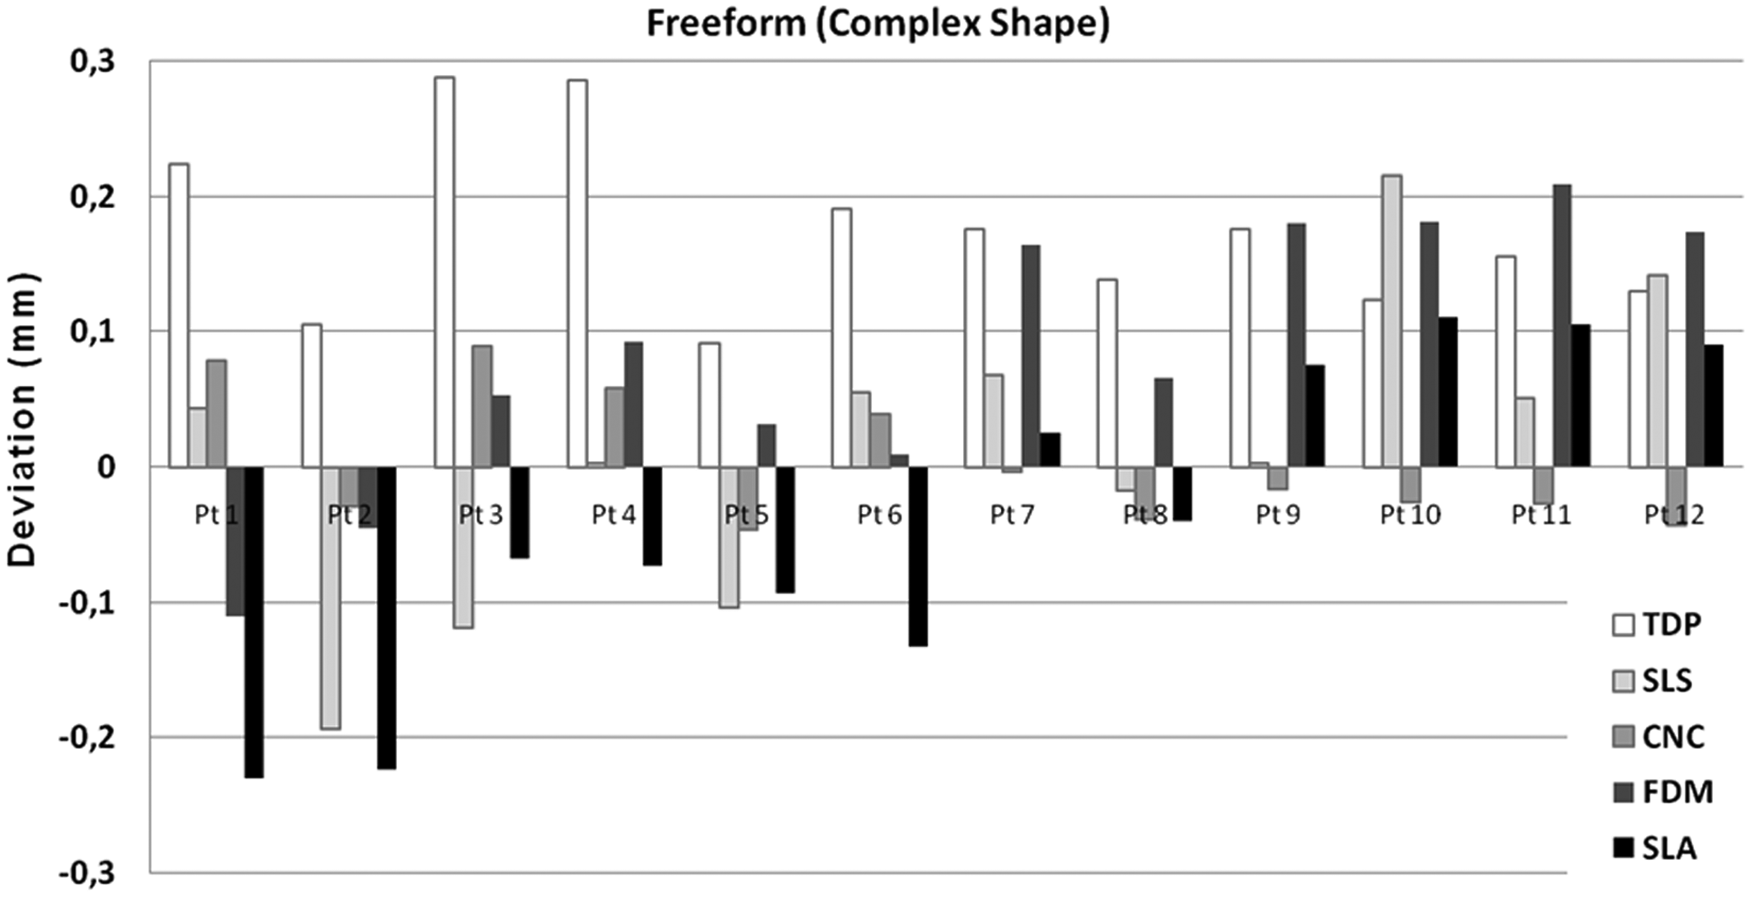
Freeform control measurements.
Discussion of results
The dimensional inaccuracy can help users to select an adequate RP process to produce prototypes where dimensional tolerance is required. The experimental results show differences of accuracy performances for the RP processes used in this study (Figure 6). Of the twenty two features controlled, the SLS part presented the greatest number of elements within the defined tolerance (20) and the other RP process evidenced a performance superior to 60%, except the TDP part.
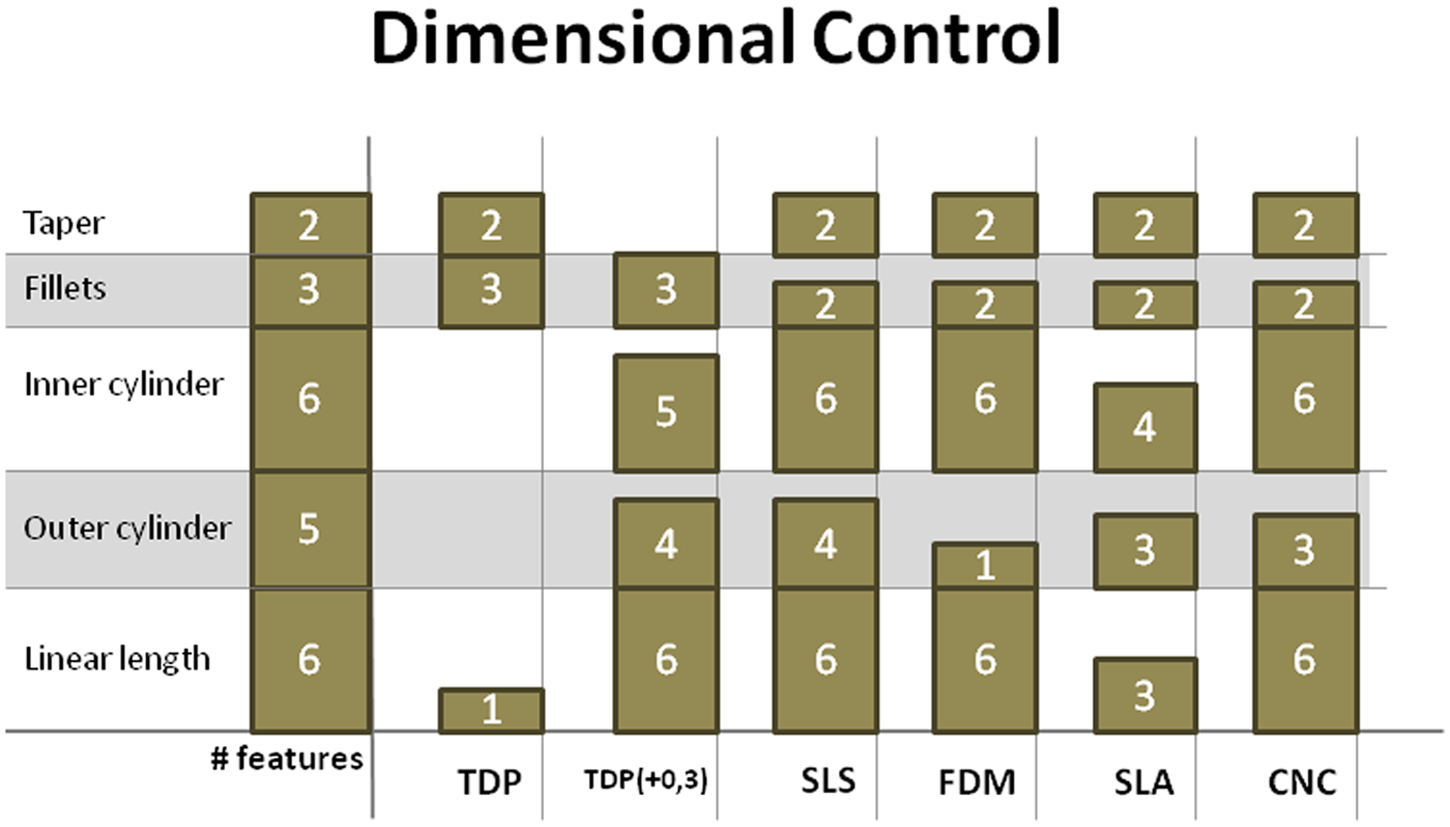
The dimensional control results.
In preliminary tests made we observed that the size of TDP parts did not correspond accurately to the data records. The deviations were from 0.3 and 0.4 mm, which can be explained by the TDP process that builds the models through the agglutination of a powder producing surfaces with a grainy texture. If the cleaning process of the surfaces is too abrasive, this may result in the loss of definition of the edges and even wall thickness. Thus, we decided to undertake a simple cleaning of the surfaces of the model, with imperfect cleaning but certainly without loss of definition. After some preliminary measurements we concluded that there was a thickness of material of around 0.3 mm in the XY direction in all dimensions. These observations are in accordance with other studies. 9
For the TDP part (TDP+0.3) under these considerations, we found that 18 dimensions were inside of tolerance zone, representing 80% of performance. This can be relevant because the deviation is always positive, which represents a thickness of additional material that can be easily removed during finishing of the prototypes.
Unfavourable features exist in almost all RP processes. The measurements made and listed below can serve as guidelines in the selection of a process to avoid the unfavourable effects of some features of RP processes. The CNC machining process presented almost all features inside the geometric tolerance except for the cylindricity of the fillet radius of 1 mm. The TDP process revealed no problem with the cleaning of surfaces, and in terms of geometric control presented the second best performance with 26 elements inside of tolerance, but these results also show the inadequacy of the process to reproduce small tilt surfaces. The SLA part had 11 features inside the tolerance band, which was worse than the SLS part, which contradicts the results obtained by Mahesh et al. 28 This can be explained by the fact that we used a SLA machine different from those used in previous studies and the warpage owing to the resin photo curable may have contributed in an adverse effect over the geometric accuracy of the fabricated parts. Figure 7 presents the results of the geometric control.
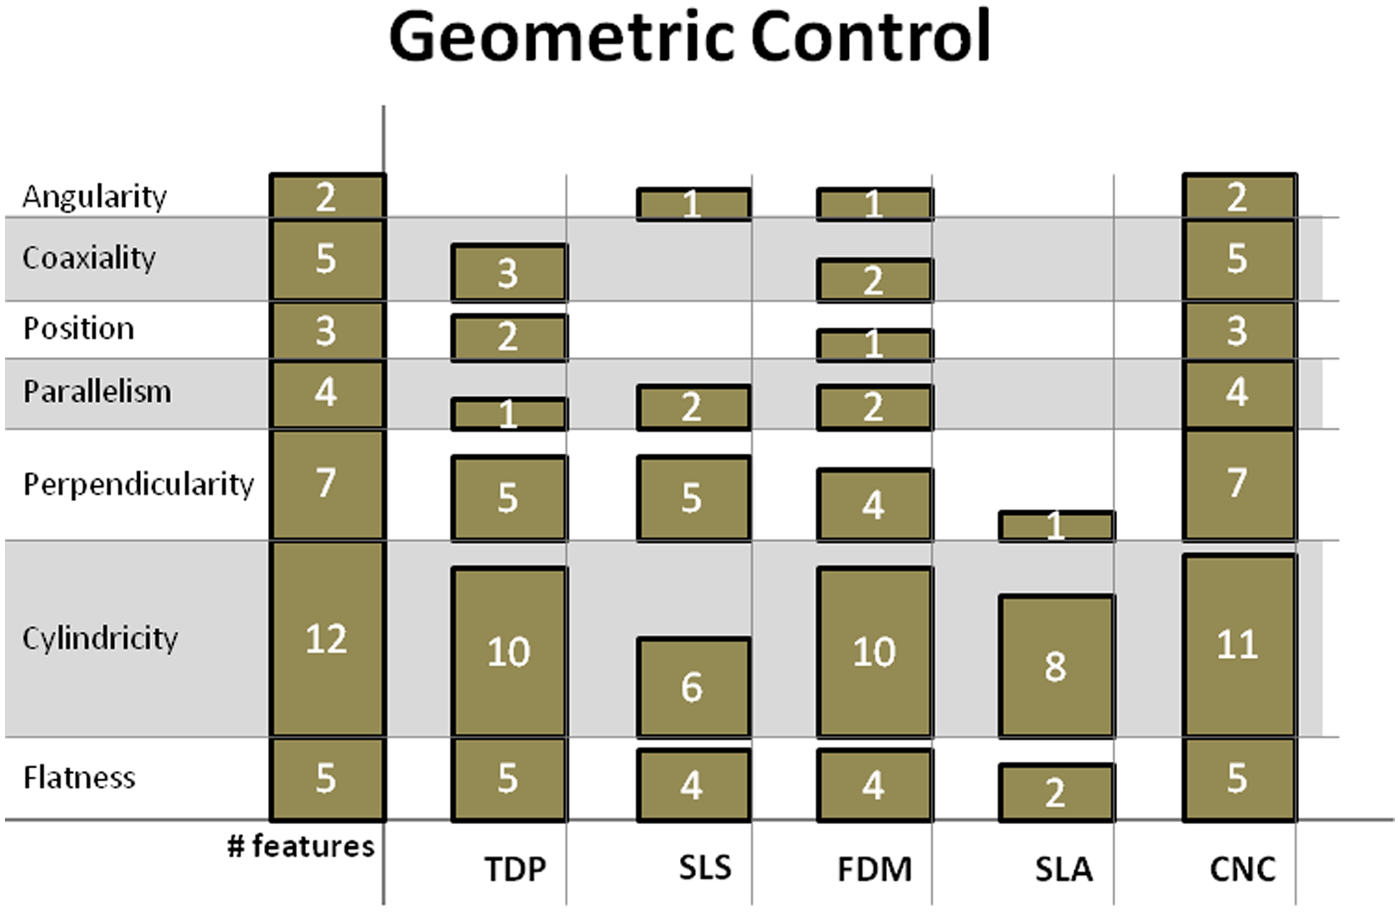
Results of the geometric control.
The FDM part (Dimension SST) showed levels of dimensional and geometric accuracy consistent with previous studies and can revive with other RP systems that are more costly, like the SLS process. The SLS part (DTM 2500) revealed good dimensional accuracy, but not so good in terms of geometric accuracy and costs of equipment acquisition and operating, which makes the selection of this process a more difficult task.
Conclusions
The conclusions from this study can be summarized as follows. For analysis of RP process accuracy it is necessary to distinguish between accuracy of the linear deviations with geometric accuracy of the feature elements of the final part.
For the CAD data transfer to RP equipment there are no benefits in generating STL files with extremely high resolutions. This kind of refinement does not necessarily result in obtaining more accurate models. The results relative to the analyses of build direction showed that the accuracy in X–Y orientation is better than the Z direction reaching a linear deviation improvement of almost five times. This is particularly important for designers and engineers when there is a need to produce models and prototypes by RP processes.
In this study the dimensional accuracy results are according to previous accuracy studies, and general perceptions and tolerance order of ISO 2768-mk seem to be the quality most suited for the prototyping processes analysed. The processes generally classified as 3D printing technology, and here designated by FDM (Dimension) and TDP (ZPrinter), showed that despite the technological developments that have occurred in these equipments they still maintain the tendency to produce dimensional inaccuracies that can exceed ±0.300 mm in range. This fact shows that these technologies may be acceptable as a concept modeller, but it is necessary to be carefully in using them for parts with certain functional requirements.
The results of geometric accuracy are reasonable and the users of this technology can reasonably expect to see the parts with respect to the original shape and obtain the reproduction of details more or less rigorous. The SLA process feels poorly in this study in terms of dimensional and geometric accuracy and is an exception that contradicts results of other studies.
The use of CNC machining to produce models and prototypes is very conditioned by its greater complexity related to the process of cutting materials and machines programming and this is necessarily reflected in time consuming and manufacturing costs. However, this study demonstrated that it can be an alternative process when the user needs high dimensional and geometrical accuracy. However, there is greater unpredictability of the cost since it depends greatly on the complexity of the part, which does not happen with other RP technologies.
Footnotes
Funding
This research received no specific grant from any funding agency in the public, commercial, or not-for-profit sectors.