
Abstract
The light guide plate is an essential key component in the development of the panel industry. In pursuit of lighter and thinner computer, communication, consumer (3C) electronics products, the panel industry continuously introduces new types of products to meet contemporary needs. Applications of a thinner light guide plate have become increasingly important. However, in the thin injection molding process, the control of geometric size and surface quality may be difficult to achieve owing to variations in conditions, such as injection pressure and temperature. Under the pressure of pursuing higher injection molding speed and lower cost, the injection industry strives to improve injection process capabilities to achieve higher quality yield, reduced production costs and processing time, and enhanced processing quality to maintain profits. Regarding the control of the Y-axis size of injection molding, this study proposed an experimental design method for injection quality improvement and injection process performance enhancement. The relevant injection parameters included temperature, back pressure, holding (dwell) pressure, and length measurement. The purpose of this study is to identify the best light guiding injection parameters to establish stable injection conditions and improve process capability. By employing the five stages of define, measure, analyze, improve, and control, this study conducted empirical research on the injection molding size stability processes of a photoelectric light guide plate, in a specific injection molding plant in Taiwan, in order to establish a process optimization model for injection molding Y-axis size stability. The research methodology integrated the parameter design method of Taguchi quality engineering and the gray sequencing method to identify the combinations of optimization parameters and experimental levels in injection molding. The experimental results suggested that C pk has been improved from 0.6 to 1.44, with a significant increase in process capability. The prediction result error rate meets accuracy requirements, which can help improve the control of capability, stability, and quality of the light guide plate injection molding size process. The research findings can provide Taiwan’s injection molding precision processing industry with a reference in quality.
Introduction
Injection processing has long been recognized as one of the key technologies to achieve high productivity of the back light unit, and digitally controlled injection processing has become an essential part in most precision injection molding processes. Traditionally, the injection parameter settings apply experiential or trial-and-error methods to determine relatively better parameter combinations by repeated molding tests. In addition to the waste of time and cost, such methods cannot determine the best molding conditions. Owing to processing complexity, variance factors, and diversified customer needs that optimize the degree of customization, it is very difficult to improve working efficiency and achieve precision quality by traditional processing experiences.1–6
Regarding injection molding, Huang et al. 3 used both semi-crystalline polypropylene (PP) and amorphous polystyrene (PS), which parts were molded by injection–compression molding. The Taguchi method was utilized to investigate the effects of six processing parameters, including mold temperature, compression speed, compression time, compression distance, delay time, and compression force, on part shrinkage uniformity (SU), as represented by the standard deviation of shrinkage. The optimal processing parameters for improving the SU of both parts were determined and verified experimentally. Song et al. 5 used the orthogonal experiment method (Taguchi method) and numerical simulation, to influence the different process parameters (e.g. injection rate, injection pressure, melt temperature, metering size, and part thickness) of the molding process for ultra-thin wall plastic parts. The results showed that part thickness is the decisive parameter for molding, metering size, and injection rates, which are the key factors of molding processes. Moreover, accelerating the injection rate can result in an increased filling ratio.
Regarding application of the Taguchi method, its two major tools are orthogonal array and signal-to-noise (SN) ratio, which emphasize that quality issues should be taken into consideration during product and process design. In other words, it emphasizes “how to reduce product performance variances and quality, while optimizing deviations from target values in order to be free from the impact of uncontrollable environmental factors”. 7 The injection molding stability process proposed in this study emphasizes nominal-the-best characteristics, thus, the Taguchi method was selected as one of the parameter setting methods. Chen et al. 8 optimized electro-discharge machining (EDM) parameters for machining ZrO2 ceramic. The machining characteristics associated with the EDM process, such as material removal rate (MRR), electrode wear rate (EWR), and surface roughness (SR), were explored through experimental study according to an L18 orthogonal array based on the Taguchi experimental design method. A practical and convenient process for shaping electrically non-conductive ceramics was developed, with the features of high efficiency, high precision, and excellent surface integrity. Yang et al. 9 described a new approach for optimizing the cutting process using the Taguchi method. A comparison with the wear of the Weibull modulus showed that the most optimal cutting parameter is A1B3C3. The experimental results suggested that the Taguchi method provides the optimum parameters for cutting glass fibers. Song et al. 10 identified the optimal welding conditions for laser hybrid welding of 5052-H32 aluminum alloy, and applied Taguchi’s parameter design method to establish the optimal welding parameters, which minimize residual stress and strain. Using such approximation processes, the relationships between welding conditions and thermo-mechanical responses can be easily estimated according to parameter variations.
Regarding the application of the gray theory, Chen et al. 11 used an integrated approach, as presented in this article. First, a decision matrix is flexibly established according to requirements, and then, the attribute weights of the decision matrix are calculated using the combination weighting method. The preference-order of the candidates is then provided to enable decision makers to choose suitable partners using gray relational analysis. Finally, an illustrative example is used to explain an application of the proposed approach. Kim and Lee 12 used the analysis of variance (ANOVA) approach, and significant welding parameters were determined. The results showed that the optimum welding conditions determined using gray relational analysis are much better than the original preliminary set of experimental conditions.
Based on the above, this study employed the numerical analysis method to design the optimized processing parameters, according to the product processing objectives and constraints, to determine a group of more appropriate processing parameter combinations as the basis for injection quality control and stable processing. This study focused on the light guide plate (LGP) of plastic injection processing in Taiwan, and attempted to determine a process of injection processing stability development. Regarding experimental data optimization analysis, this study applied the define, measure, analyze, improve, control (DMAIC) approach, which is widely discussed and accepted as appropriate for product data management processes, according to the preference of prevention over improvement. Using the DMAIC approach and gray sequencing method for research and application, this study analyzed the business process of injection processing plants in Taiwan in order to determine a process suitable for the development of the injection processing industry. The analysis results can serve as a reference for the development environment of the injection processing industry and the development of competitive business strategies for the industry. This study employed the DMAIC approach to establish project processes, combined with the Taguchi experimental design and gray relational analysis, in order to obtain parametric variables and quality key factors affecting the stability of the injection machine tool, as well as determining process optimization.3,8,10,11
Research method and case study
This study first conducted a literature review to generalize the concepts of DMAIC, the Taguchi method, and the gray sequencing method to serve as the theoretical framework of the study. The purposes of this study are intended to provide integrated methods to the relevant industries for improving injection molding process stability.
Define
This research conducted an empirical study on the LGP object process of a domestic injection molding plant to measure processing stability, and explored control factor level combinations for measurements of Y-axis size control, in order to minimize the system sensitivity to noise factors and improve system robustness.
Objective characteristics
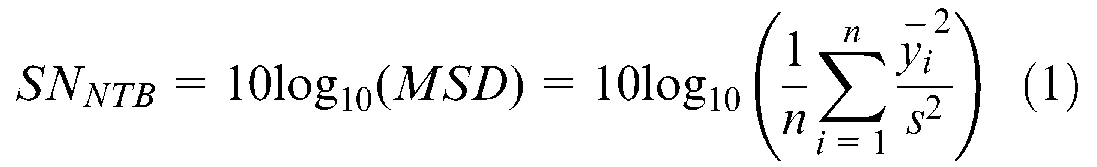
This study used the measurement stability of the object by the injection molding process as the response value, namely, the objective characteristic, in order to determine the molding object stability of size settings. It is the characteristic of nominal-the-best to discuss the optimization of size settings. The nominal-the-best characteristic of the SN ratio can be defined by deduction, as shown in equation (1), where y i is the experimental data of the ith group, and n is the total number of experiments
Experimental instruments and materials
The experimental instruments, materials, and measurement instruments used in this study are as shown in Figure 1. The digital injection machine tool, when adjusted by high-precision digital parameters, can result in a precision level suitable for high-precision plastic molding products. The measurement instrument uses a three-dimensional (3D) size measurement instrument. Figure 2 illustrates the molding sizes of the LGP, where L1 is the left side of the mold, and L2 is the right side of the mold.
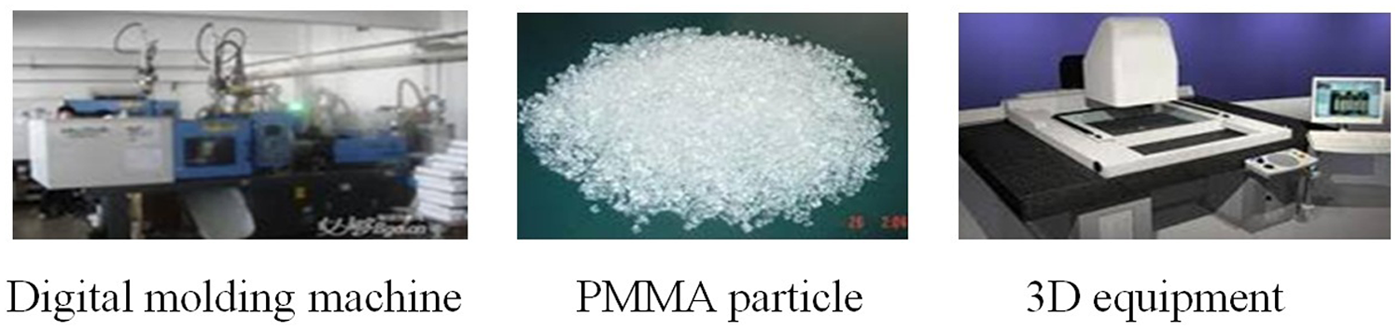
Experimental set-up for materials and measurement instruments.
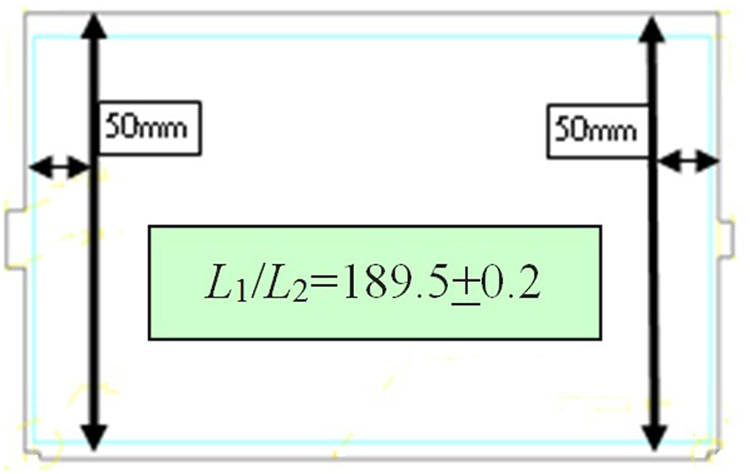
LGP molding size.
Measure
Yang et al.
9
suggested that improvement of yield can be regarded as the most important capability indicator in any current production or management field, as yield improvements represent improvements in performance perception. Traditionally, yield analysis is measured by the
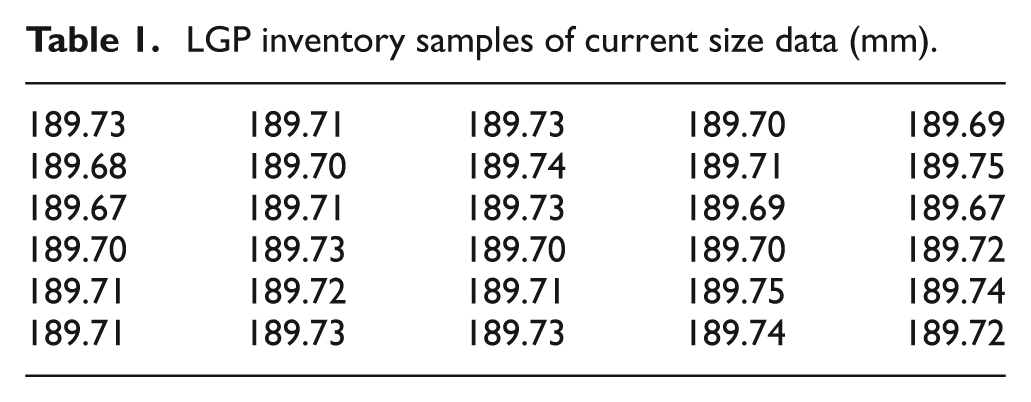
The sizes of the 30 randomly selected LGP samples are as shown in Table 1.
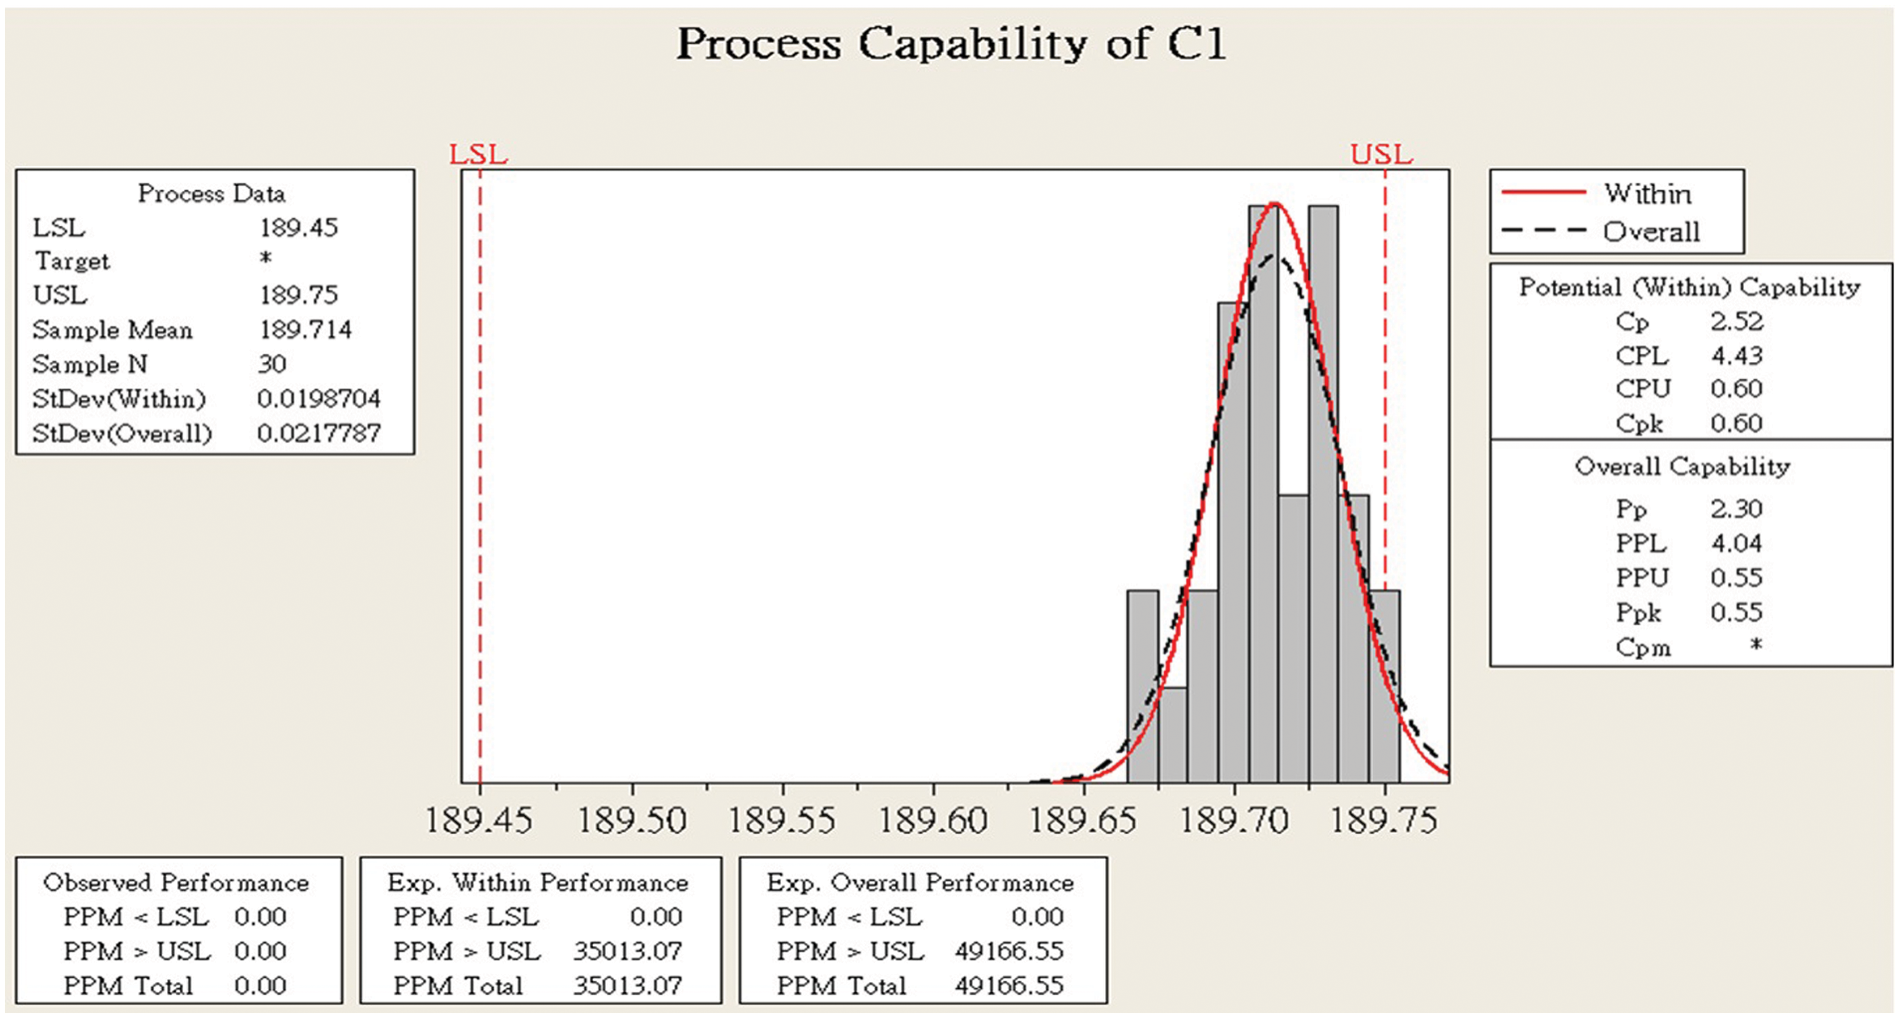
The size process capability index
LGP inventory samples of current size data (mm).
Current process capability calculation results.
Analyze: gray sequencing method
The gray sequencing method can facilitate the optimization selection of injection molding stability process impact factors, as this method can determine the impact of change factors on decision-making parameters.
14
Based on changing the operating costs of different factors, this study employed the gray sequencing method for priority ranking of 10 control factors, and selected the top four control factors. The top four control factors
Gray sequencing method estimation result.
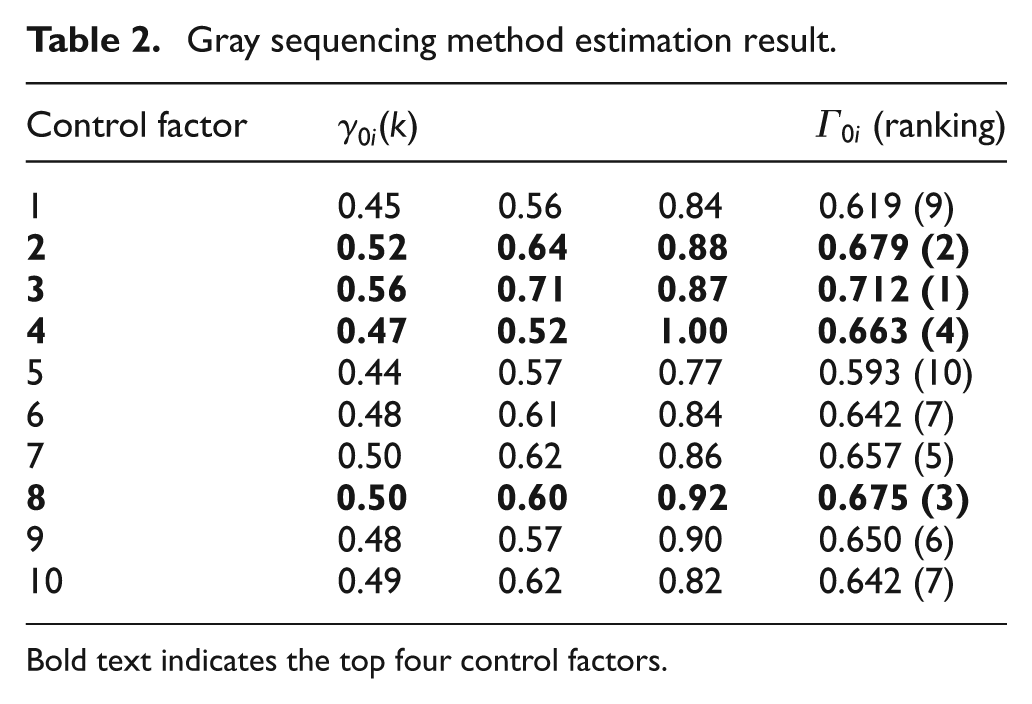
Bold text indicates the top four control factors.
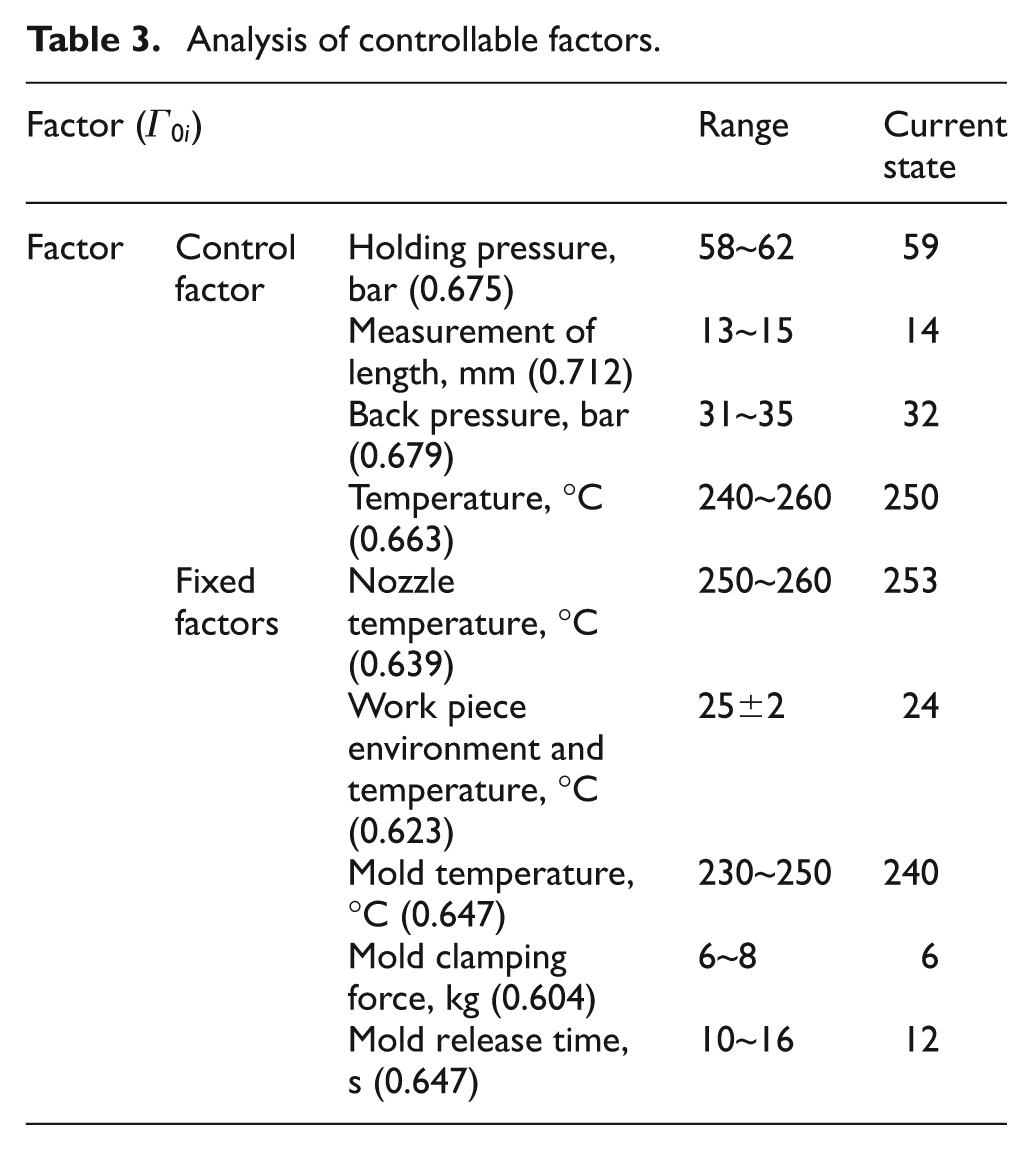
Analysis of controllable factors.
Experimental response value and SN ratio.
SN: signal-to-noise.
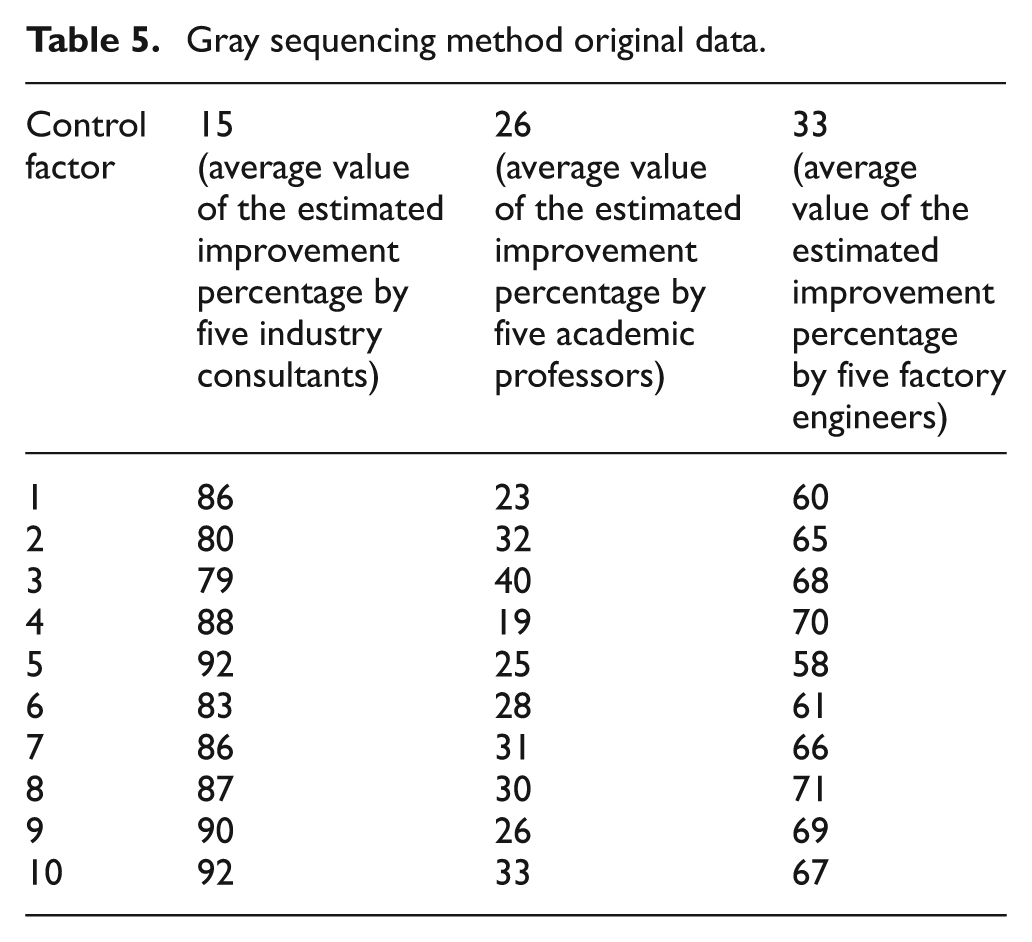
Regarding control factors, Table 5 illustrates the original data of the gray sequencing method, and shows the scores given by different experts regarding the impact and cost of various control factors. Factors 6 and 7 are regarding costs, with higher scores representing higher costs, and the score range is 1–100 points. According to the calculation results of equations (2)–(7) (to be discussed), the importance ranks of 10 control factors are as shown in Table 2.
Gray sequencing method original data.
Step 1: Normalizing the original data. Normalized by dividing the original data
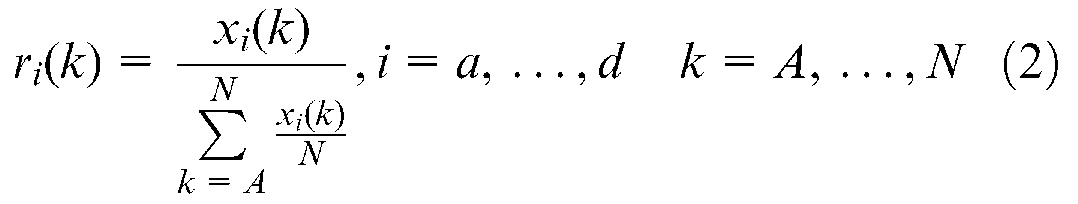
where,
Step 2: Specify standard columns to calculate the difference sequence. Difference sequence

Step 3: Calculate the maximal difference


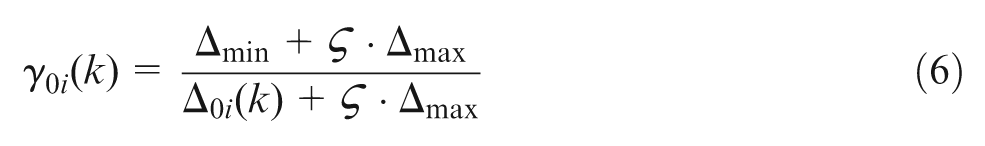
Step 4: Calculate the gray relational coefficient:
Step 5: Establish the gray relationship

Step 6: Conduct sequencing according to the gray relationship.
Factorial analysis
Based on a literature review of the injection plant experience and the gray sequencing method, this study concluded the major factors that may affect injection molding LGP,3,10,11 as shown in Table 2.
Experimental factors and level selection
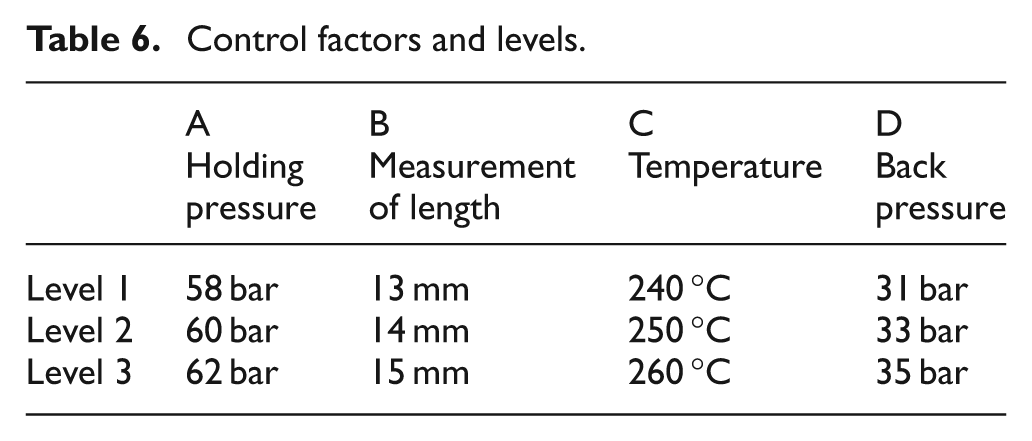
According to project panel discussion and the gray sequencing method, the factorial level selection, as based on previous experience, is determined and shown in Table 6. 15
Control factors and levels.
Improve
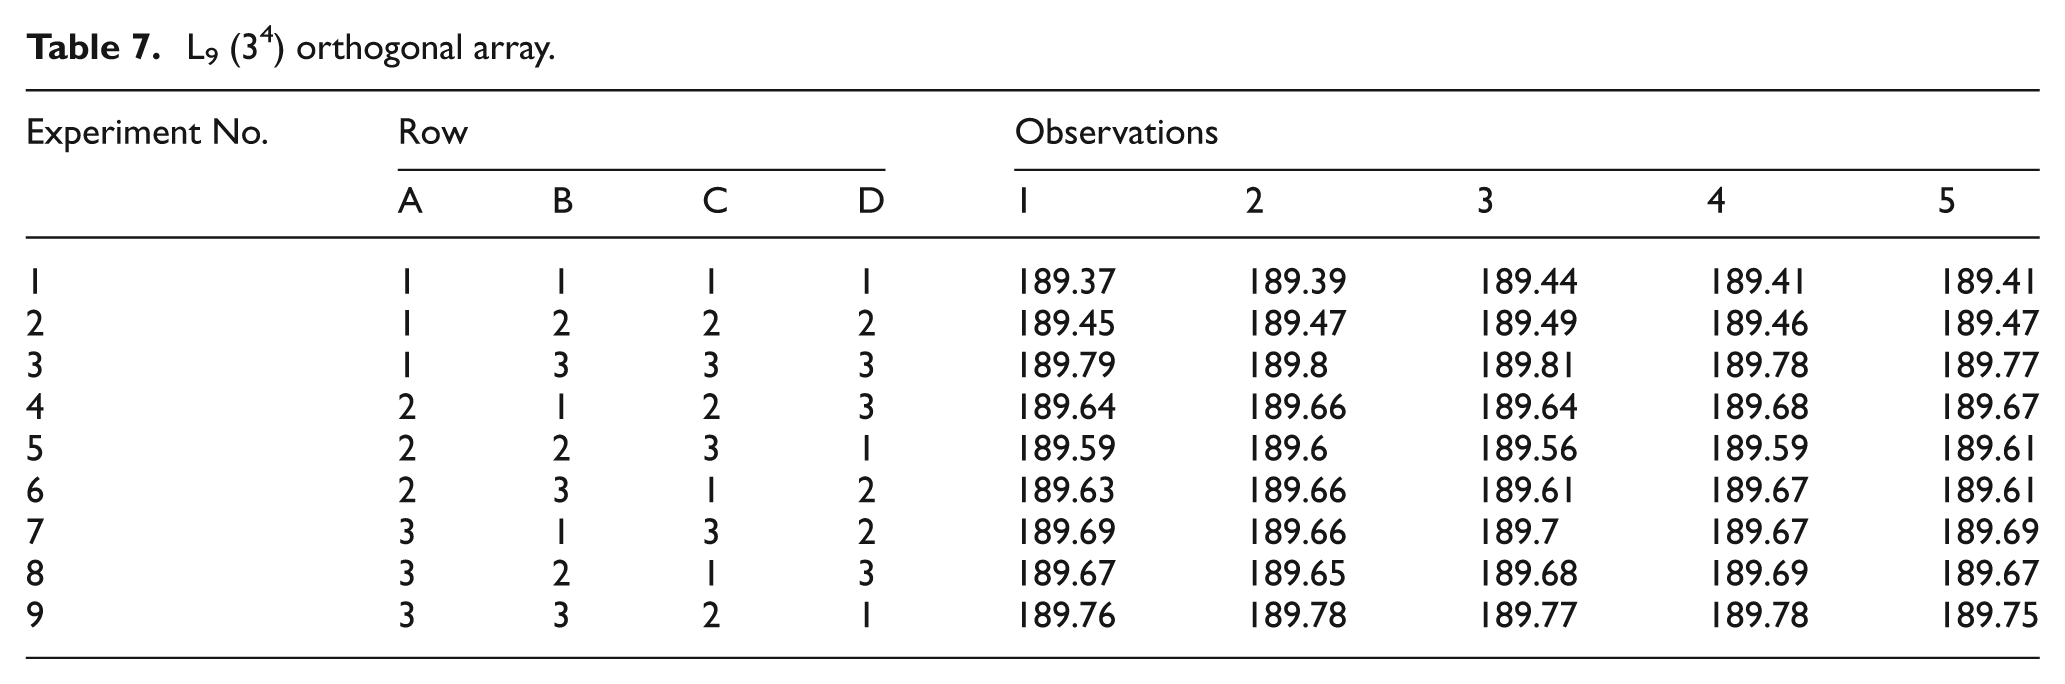
Su 7 suggested that the Taguchi experimental method can improve quality through parameter design, as it determines target function for attributes that require improvement, determines the factors and levels affecting target functions, and uses the orthogonal array to determine the factorial configuration and experimental times. The method can obtain the same amount of data through fewer experiments, as compared with full-factorial experimentation. Considering cost effectiveness in identifying the optimal management level combination, this study employed the Taguchi method for experiments. As the interaction of various experimental factors is insignificant, the effects of interaction can be regarded as a part of the experimental errors. The number of experimental factors is four, and each factor has three levels. Without considering the interaction, the L9(34) orthogonal array is selected and the factorial level is set, as shown in Table 7.
L9 (34) orthogonal array.
Experimental data analysis
This study repeated the experiment five times, as based on the experimental factorial level planning by the Taguchi experimental design. This experiment employed the nominal-the-best characteristic as the tool for analysis of LGP size molding stability (the ideal value is 0) in order to obtain a group of optimal experimental parameter combinations. The nominal-the-best characteristic SN ratio is defined as equation (1), and the experimental response values and SN ratio data are as shown in Table 8.
L9 (34) orthogonal array experimental response value and SN ratio.
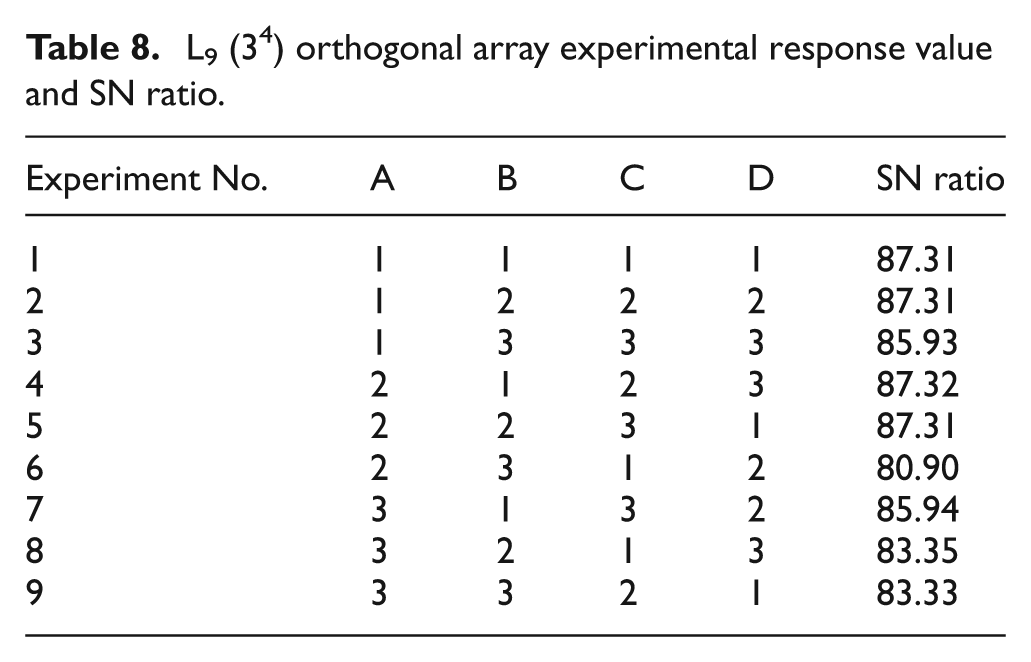
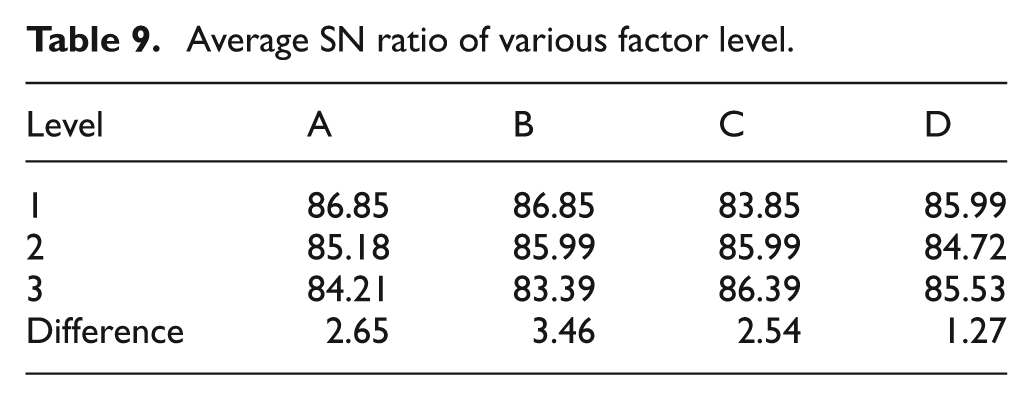
As a larger SN ratio indicates better quality (smaller loss), the parameter level combination with the largest SN ratio is the best. A product under the optimal parameter levels will achieve the smallest variance. As seen from the experimental SN ratio data, the optimal level factor combination is A1-B1-C3-D1, as shown in Figure 4 and Table 9.
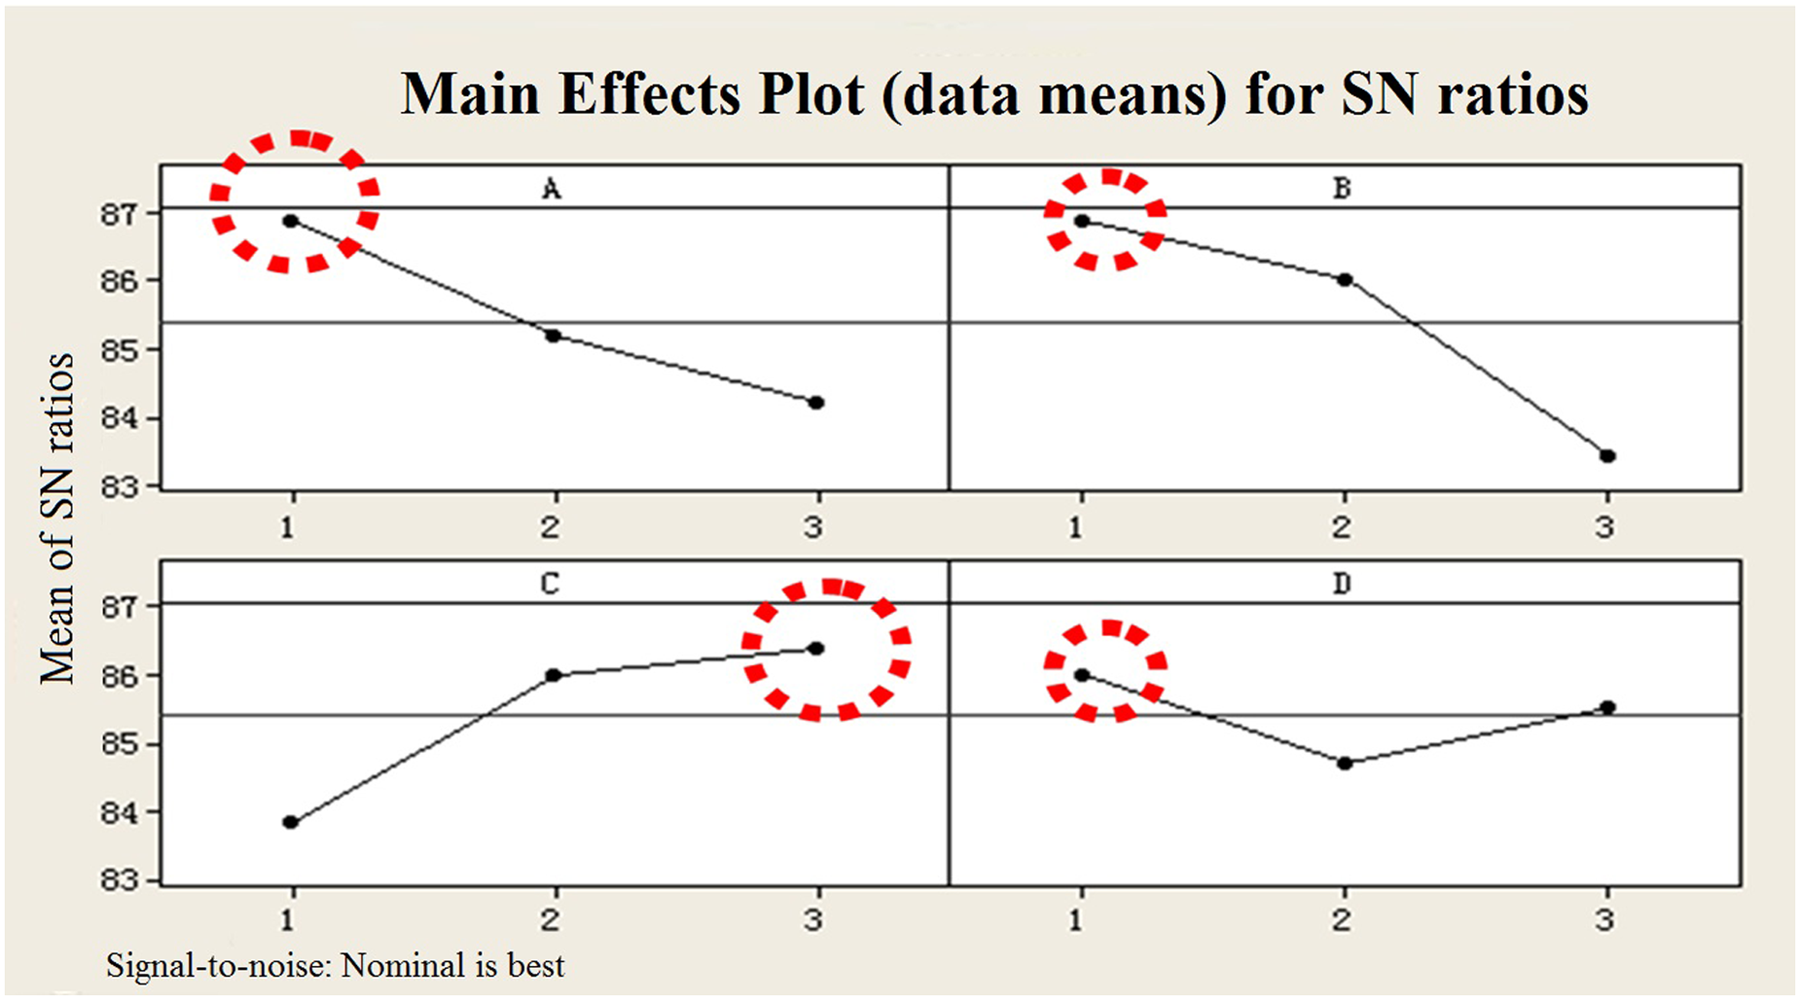
Main effects for SN ratios.
Average SN ratio of various factor level.
ANOVA
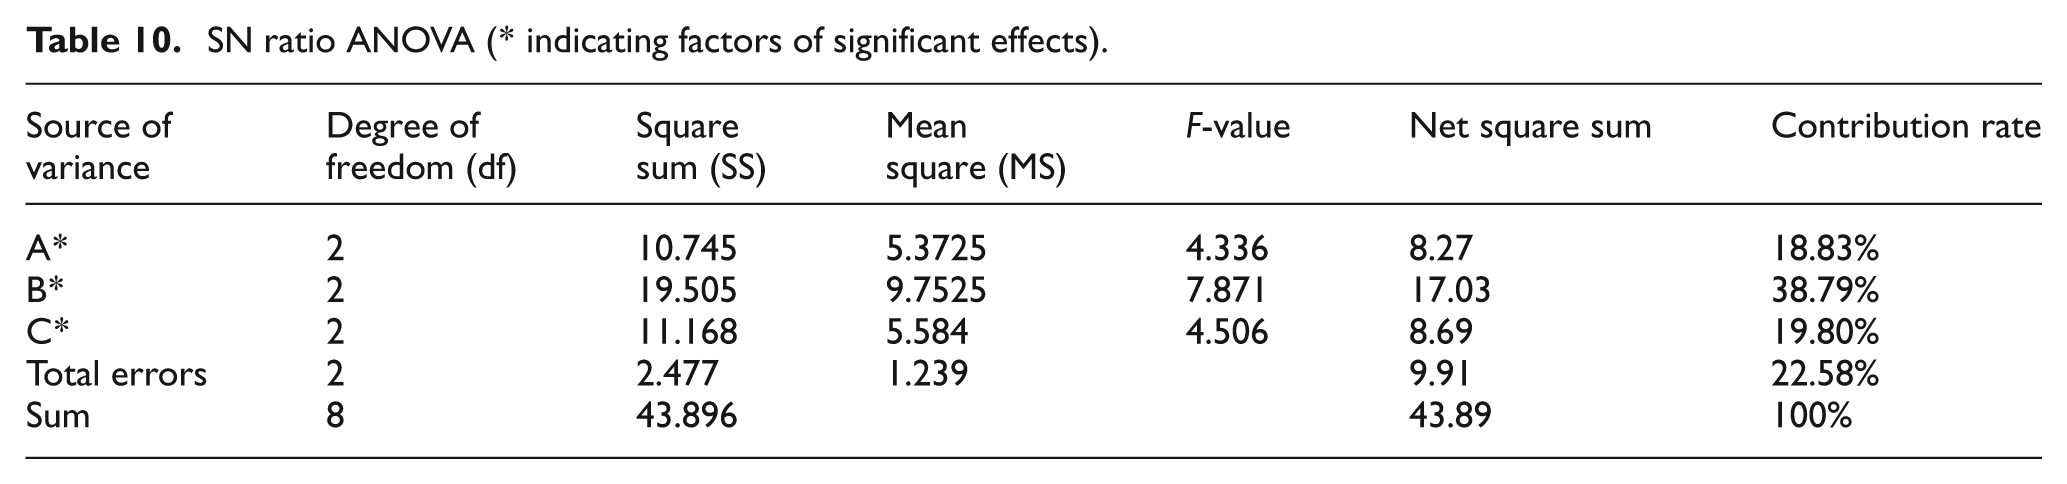
ANOVA can provide objective analysis of the relative effects of various factors. 7 ANOVA finds that factors A, B, and C have significant impact. By experience, if the contributing percentage of an error item is less than 15%, it can be regarded that the experiment has not neglected important factors. If the error item contributing percentage is greater than 50%, it can be assumed that the experimental conditions are not ideal, or major errors have occurred, with some important factors being neglected. The error item contributing percentage of this experiment is 22.58%, and the combined error item contribution rate is greater than 15%. The SN ratio variance analysis suggests that the F-values of factors A, B, and C are all greater than four. It thus can be inferred that they are factors of significant effects, subject to confirmation of experiments. The analysis results are as shown in Table 10.
SN ratio ANOVA (* indicating factors of significant effects).
Presumption of optimal conditions
Calculation of the expected SN ratio and CI1 under optimal conditions. The expected SN ratio scope can be calculated according to the expected SN ratio and CI1 value under the optimal conditions as [89.268±0.01878] = [89.24922, 89.28678].
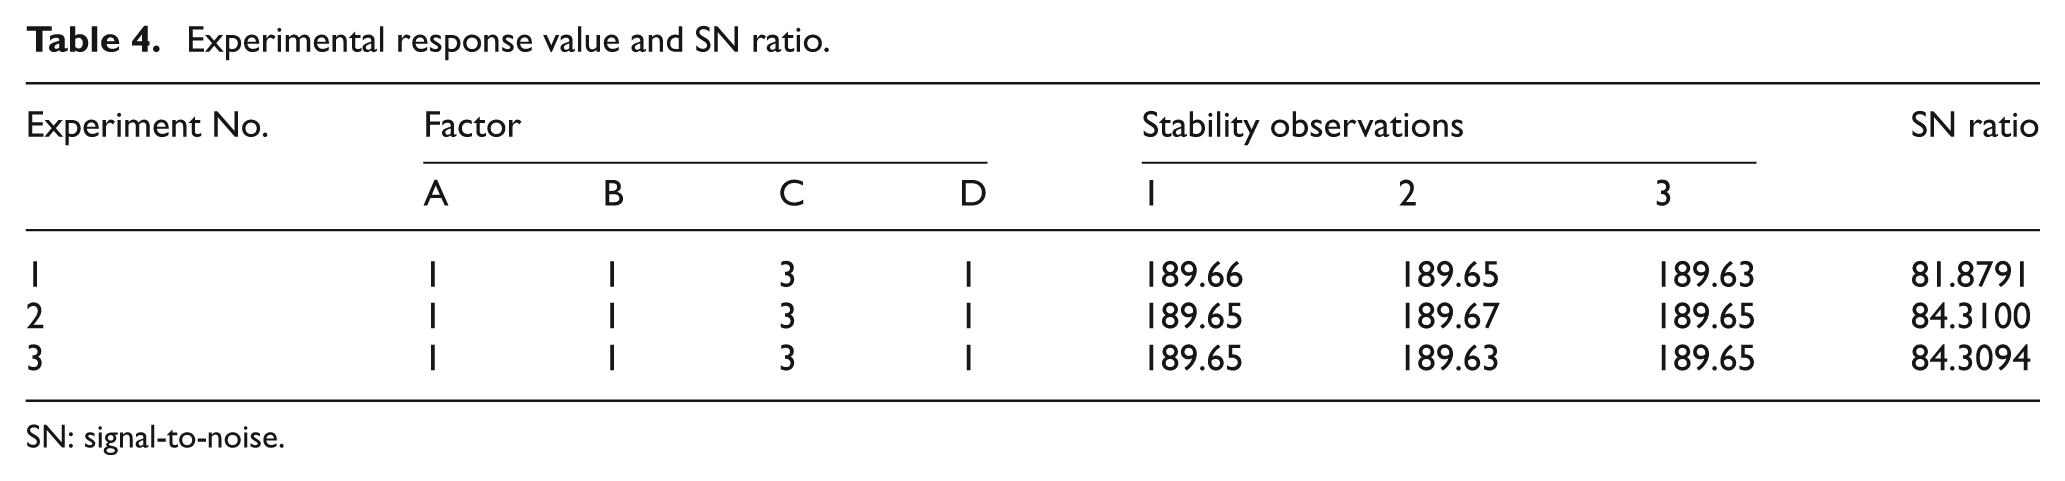
Confirmation experiment
The confirmation experiment can validate whether the average values estimated under the optimal conditions are effective. The results of three trials of this experiment are as shown in Table 4. Hence, the confidence interval (CI2) of the expected SN ratio of the confirmation experiment is [89.268±0.02245] = [89.24555, 89.29045]. According to the above confirmation experiments, all SN ratios are in the 95% confidence interval, indicating the success of experimental results. Since the confirmation and conformation experiments mentioned in Table 9 are successful, there is no interaction between control factors. 7
Calculation of process capability
The C pk value, obtained using the nine response values as determined by the confirmation experiments (Table 4) for the calculation of the process capability, is 0.6, which is improved over the qualification standard of C pk = 1.33, suggesting the combination of conditions A1-B1-C3-D1 (i.e. holding pressure at 58 bar, length measurement of 13 mm, back pressure at 31 bar, and PMMA temperature at 260 °C) can improve the quality stability of injection molding size, as shown in Figure 5.
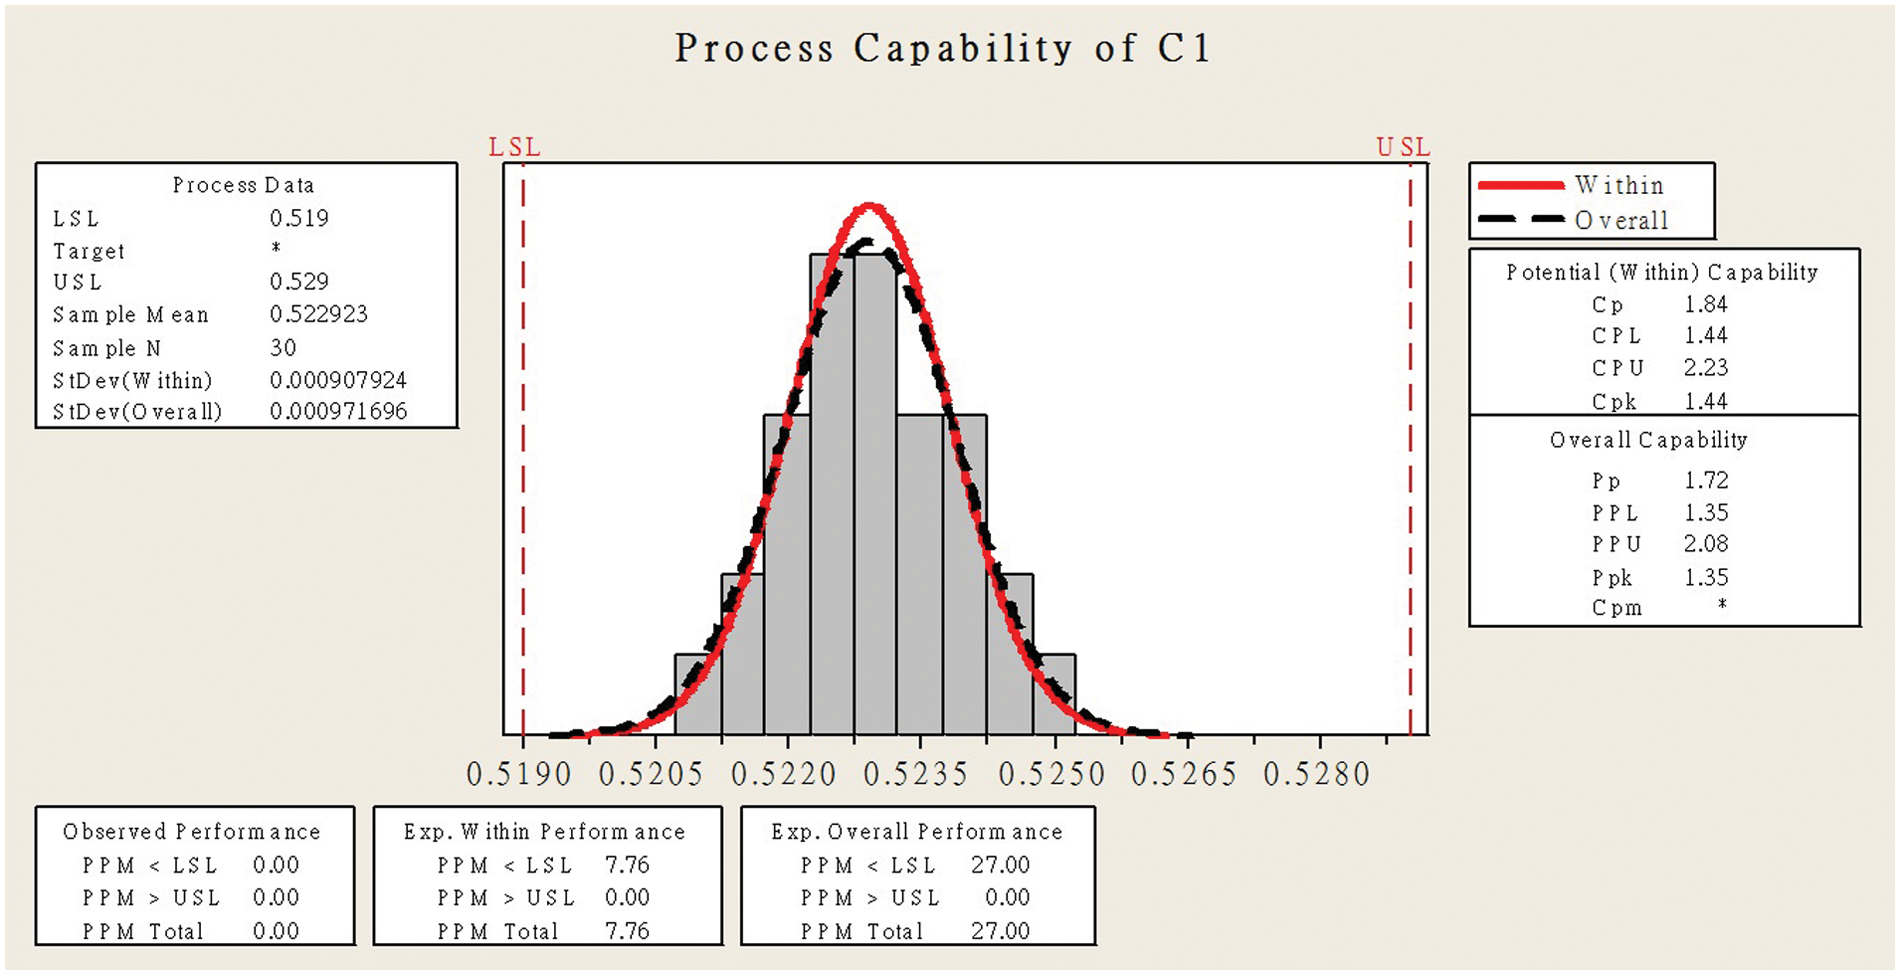
Calculation results of improved process capability.
Control
This study obtained the optimal conditions by employing the Taguchi and gray sequencing methods, and obtained optimization process conditions by confirmation experiments. In addition to achieving the expected results, it has reduced the variance in the injection molding size of the LGP and improves size stability quality. Hence, when modifying the mold injection operating process conditions, the molding parameter combination of A1-B1-C3-D1, namely the holding pressure, is modified from 59 bar to 58 bar, length measurement from 14 mm to 13 mm, temperature from 230 °C to 260 °C, and back pressure from 32 bar to 31 bar. According to the experimental results, the standardization of the process suggests that Cpk improves from the original 0.6 to 1.44. Hence, using the Taguchi experimental method improvements to determine the optimal parameters can improve the quality stability of the molding size, as well as satisfy customer demands for accuracy.
Comparison of the proposed research method and back-propagation neural network method
As the back-propagation neural network (BPNN) is a non-linear model, it repeatedly approaches the linkage weighted value and bias value in an iterative manner. Therefore, the data computation amount is considerably large, and will require a considerable amount of computer resources. As a result, the modeling cost is high. However, the BPNN has very good effects in the prediction of relevant parameters.16,17 This study selected 10 control factors affecting the prediction model for model construction regarding the prediction of the LGP injection molding stability process capabilities.
System architecture and parameter setting:
using the LM (Levenberg–Marquardt) algorithm as the learning method;
using random sampling, the data segmentation ratio is: learning: testing: verification = 70: 15: 15 (original setting);
the initial value of the increased coefficient = 15, the initial value of the decreased coefficient is = 0.2;
the initial value of the number of cycles = 800.
Regarding the BPNN learning parameters and architecture, this study divided the parameters into two groups by the trial and error method, as shown in Table 11. According to permutation and combination, this study obtained 32 groups of method settings. The group with the minimum values of verification average error rate percentage and learning optimal error mean square root (MSE) is the optimal model to predict the LGP molding stability process capabilities.
Structure and parameter setting of trial and error method.
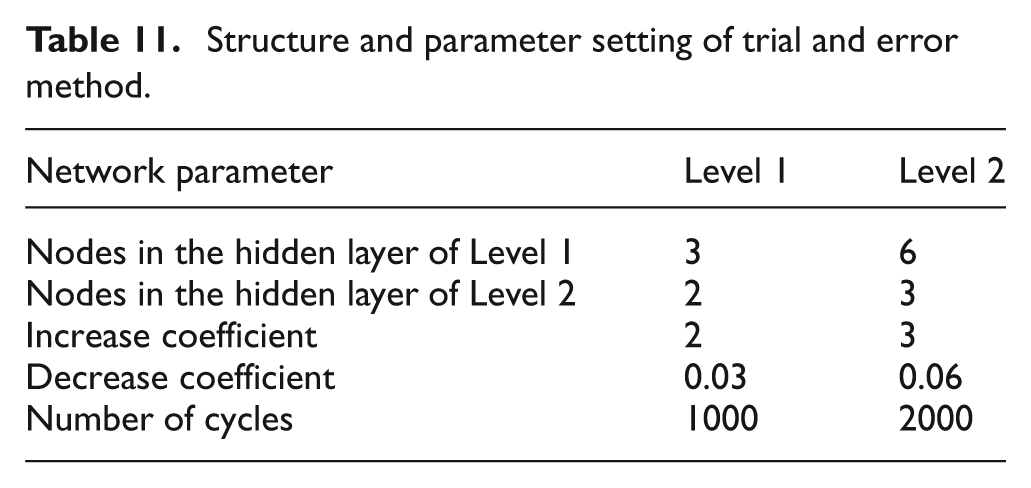
The BPNN prediction structure and parameters are as shown in Table 11. The first hidden layer is 3, the second hidden layer is 2, the increase coefficient is 2, the decrease coefficient is 0.03, and the number of cycles is 150, represented as 11,111, as shown in Table 12. There were 32 combinations of trial and error results obtained. As shown in Table 12, the combination number of 12,112 has the minimum verification average error rate percentage and learning optimal MSE, thus, the optimal process capability (
BPNN and results of parameter trial and error method.
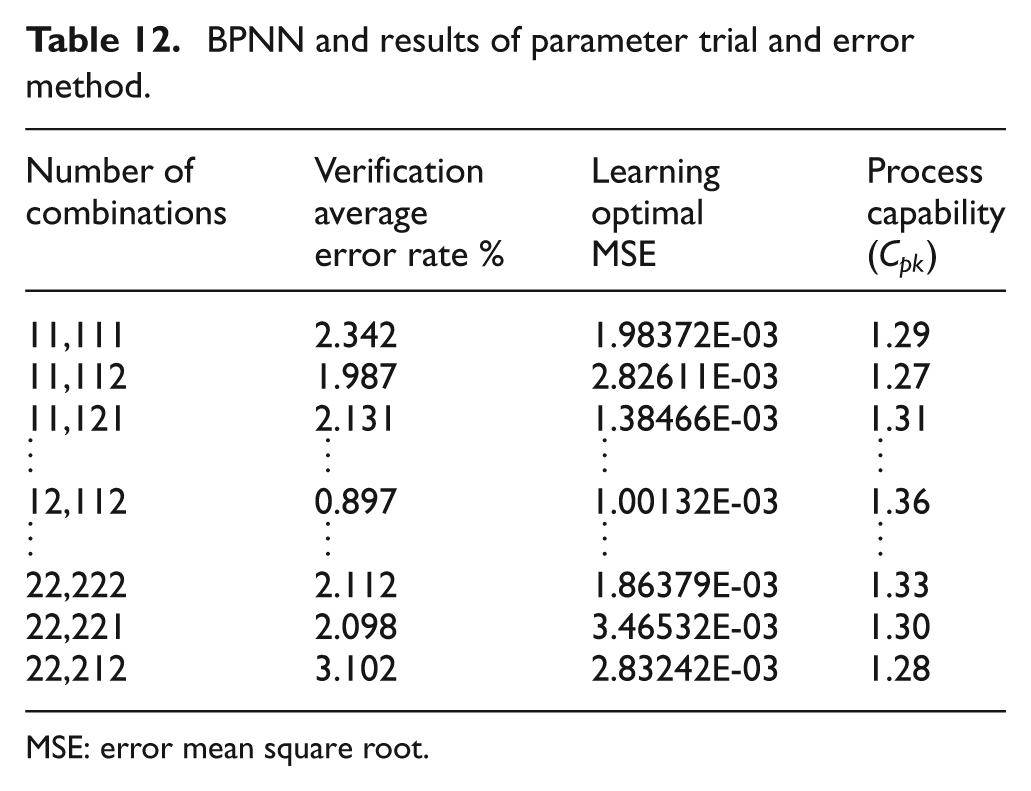
MSE: error mean square root.
The optimal process capability (
Conclusions and suggestions
This study conducted empirical research on a domestic plastic injection processing plant by employing the Taguchi and gray sequencing methods to obtain optimal conditions and solve the quality stability problem of LGP molding size. With the Y-axis of the LGP size as the experimental target, this study developed a LGP processing stability development process. The optimal experimental level combination for processing size is as follows: holding pressure at 58 bar, length measurement of 13 mm, back pressure at 31 bar, and PMMA temperature at 260 °C. The optimal combination can produce the products at a satisfactory level, reduce the waste of additional improper products, and improve the process. After the preliminary adjustments and final process condition analysis, it is found that processing and injection process conditions are significantly correlated. Holding pressure, length measurement, back pressure, and temperature are major control factors of injection processing conditions. The
Footnotes
Funding
This research received no specific grant from any funding agency in the public, commercial, or not-for-profit sectors.