
Abstract
This paper presents a three-dimensional simulation of stationary gas tungsten arc welding which studies the development of the arc and weld pool in three types of joints, namely L-shape, V-shape and open-corner. Temperature, heat flux, current density and gas shear stress are determined in the arc and are used as input to the workpiece to determine the heat, fluid flow and weld pool shape. Buoyancy and surface tension gradient which affect the pool shape are taken into consideration. It is observed that the current density, heat flux and gas shear distribution in the arc domain is the same in all the cases. The electromagnetic force is observed to be the same in L-shape and V-shape joints. In the case of the open-corner joint, some electromagnetic force is also observed on the bottom edge of the weld. The fluid flow and weld pool shape is found to be the same in the case of L-shape and V-shape joints which shows that the orientation of workpiece does not produce any gravity effect. Due to the sharp edge in the open-corner joint, the weld pool is observed to be shallow and wide. In all three cases, the molten metal flows from the sides and the weld pool is formed slightly upwards at the weld centre in the experimental results. This phenomenon is not considered in the numerical analysis and the weld pool depth near the weld centre is a little different from the experimental results; however, the remaining pool shapes are observed to be in good agreement.
Keywords
Introduction
Gas tungsten arc welding (GTAW) is widely used in the industry because of its high-quality weld and joining capability in relation to a greater number of metals and metal alloys than any other arc welding process. 1 Considerable work has been undertaken to study gas tungsten arc welding numerically and experimentally. The objective is to fully understand the welding process by investigating the current density, heat flux, pressure, velocity and gas shear stress in the arc region and fluid flow and weld pool shapes in the pool region. A two-dimensional (2D) model was proposed by Watson and Pegot 2 to solve the combined flow and energy equations in the arc plasma and numerically determine the flow and temperature fields. The arc plasma was assumed to be optically thin, in local thermodynamic equilibrium (LTE) and the arc flow was laminar. The temperature-dependent argon properties were used in the analysis. Quigley 3 investigated different heat transfer mechanisms in GTAW and determined the contribution of conduction, convection, radiation, vaporization, electron potential energy, electron thermal energy and anode fall to the workpiece. The electronic contribution was observed to be the main source of heat transfer from the arc to the workpiece. Lowke 4 developed an analytical model to estimate the arc properties.
Hsu et al.
5
investigated the high-intensity free-burning arc to determine the temperature profiles for 100 A and 200 A currents. The current density distribution at the cathode surface was determined experimentally by measuring the size of the melting cathode tip. The current density distribution was then used as boundary condition to analyse the arc temperatures. The transient development of fluid flow and temperature fields in the weld pool were studied by Oreper and Szekely.
6
They included the electromagnetic, buoyancy and surface tension forces in the analysis and individually studied the effect of these forces on the formation of the weld pool shape. The surface tension gradients were observed to be responsible for high surface velocities. Steady-state 2D computer simulation was performed on a stationary arc by Kou and Sun.
7
In the study, the effects of current density distribution in the workpiece, the thermal expansion coefficient of the liquid metal and the surface tension temperature coefficient of the liquid metal on weld pool fluid flow were investigated. The effect of variation of shielding gas flow on the arc temperatures has been studied by Kovitya and Cram.
8
It was shown that the temperature profiles are slightly affected by the gas flow rates. Wu et al.
9
developed a mathematical model to investigate heat transfer and fluid flow in tungsten inert gas (TIG) welding. The largest arc velocity was observed to be 184 m/s and 235 m/s for 100 A and 200 A arc respectively near the electrode tip. The current density and heat flux on the anode surface was found to be
The weld pool has been investigated by different researchers. Atthey 12 developed a mathematical model for the hemispherical weld pool shape to study the fluid convection due to electromagnetic (Lorentz) force. Downward pool circulations were observed in the weld pool due to the electromagnetic force. Zacharia et al. 13 developed both 2D and 3D weld pool models. Gaussian heat and current flux distributions were assumed in the analysis. The study investigated the heat and fluid flow in aluminium alloy for stationary and moving weld pool. In another study, Zacharia et al. 14 investigated the weld pool with deformable free surface. The calculated results were compared with the experimental results. A Gaussian distribution of the heat and current fluxes were assumed to determine the weld pool. It was observed that the flow fields in the weld pool were mainly controlled by the spatial variation of the surface tension. Kaddani et al. 15 developed a 3D model for the arc to study the arc temperatures and compared the results with a 2D model and experiments. Speckhofer and Schmidt 16 presented a technique for magnetically deflected arcs. Wu et al. 17 used the double ellipsoidal heat source model to predict the transient development of the weld pool. Other effects such as the electromagnetic, buoyancy, and Marangoni forces were not considered in the analysis. The complete process time starting from the arc initiation until the cooling of the weld pool was determined. Zhao et al. 18 analysed the dynamic behaviour of the gas tungsten arc weld pool with full penetration. The 3D transient model was developed with deformed surface to study the complex boundaries resulting from the surface deformation. The total cycle time from the start of the weld pool formation, getting full penetration and then achieving the steady state was calculated. The largest velocity of 7 mm/s was observed in the weld pool with 110 A welding current. A 3D model was developed by Fan and Kovacevic 19 to study the heat and fluid flow of the weld pool with filler material. The surface profiles and melt depth were determined using the volume of fluid (VOF) method. The transient development of deform surface, temperature and velocity distribution were discussed. The effect of Marangoni convection on weld pool shape was studied by Mills et al., 20 Limmaneevichitr and Kou, 21 Lu et al., 22 and Xu et al. 23 These computational results revealed that the weld pool shape strongly depends on the gradient of surface tension coefficient. Unified models were developed by Zhu et al., 24 Lowke et al., 25 Tanaka et al, 26 and Fenggui Lu et al. 27 to study the combined effect of arc and weld pool. A 2D unified theoretical model was developed by Haidar 28 to investigate the gas metal arc welding (GMAW) and gas tungsten arc welding processes. The plasma arc and weld pool properties were studied by including the sheath regions of the electrodes. The volume of fluid method was used to analyse the free surface of anode and predictions were made for the droplet and weld pool formation in GMAW and GTAW respectively. The effect of surface tension, inertia, gravity and Marangoni forces were included in the analysis to determine the droplet and weld pool shape. Three-dimensional studies were performed by different authors to examine stationary and moving arcs. Hu and Tsai 29 developed a 3D model to investigate the transport phenomena in GMAW of thick metals with V-groove. The model investigated the droplet and weld pool by considering the gravity, electromagnetic force, surface tension and arc pressure. The velocity, temperature and sulfur species were determined in the weld pool. The groove was observed to provide a confined channel for the flow of molten metal and it was found that the mixing of filler metal with the weld pool was not as good as compared with the process without a groove. Kohandehghan and Serajzadeh 30 studied 3D weld pool produced by two different heat source schemes: Gaussian and double ellipsoid. Along with the heat source, buoyancy, electromagnetic and surface tension forces were also incorporated in the analysis. The computational fluid dynamic software Fluent® was used and it was concluded that the double ellipsoid model predicted more realistic results than the Gaussian heat flux.
All the works cited above consider the arc welding process on a plate in which the electrode is normal to the workpiece. In the present study, a 3D model is presented to investigate the stationary gas tungsten arc welding of L-shape, V-shape and open-corner joints. The weld groove becomes symmetrical in all three cases; however, the objective is to investigate the effect of workpiece orientation on the arc and weld pool shape using ANSYS CFX®. 31 Temperature, current density, heat flux and gas shear stress are investigated for the arc and the electromagnetic, buoyancy and Marangoni forces and puddle shape are analysed for the weld pool. The effect of free surface is not considered in the analysis because the study is comparative and the net results will have same order of magnitude effect on the weld pool properties. The computed results are observed to be in good agreement with the experimental results.
Governing equations
The following assumptions are made to simulate the arc plasma:
The arc is in local thermodynamic equilibrium (LTE).
The flow is turbulent.
The arc is stationary and is in steady state condition.
The tungsten electrode is at
The computational domain is in planar symmetry.
The following assumptions are made to simulate the weld pool:
The fluid flow is laminar.
The density variation is very small with temperature, therefore Boussinesq approximation is used for buoyancy driven flow.
Heat flux, gas shear and current density are determined in steady state arc.
The governing equations for a 3D configuration are taken from the ANSYS Solver Theory Guide 32 as follows.
Mass, momentum and energy equations
The mass continuity equation:

The conservation of momentum:
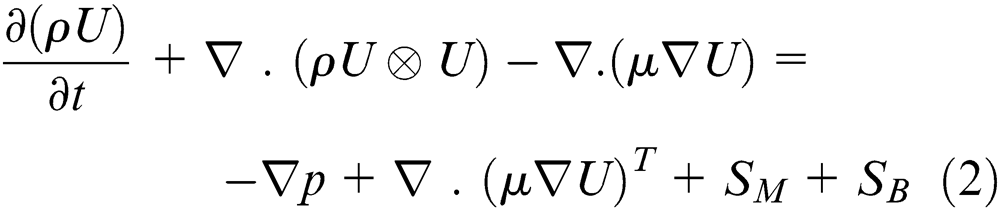
The energy conservation equation:
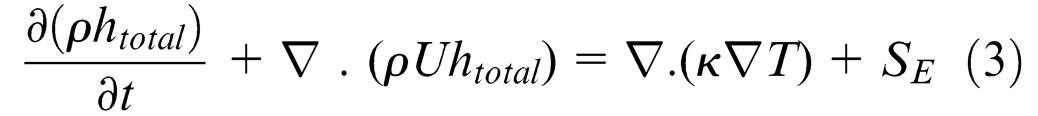
where
The electromagnetic equations
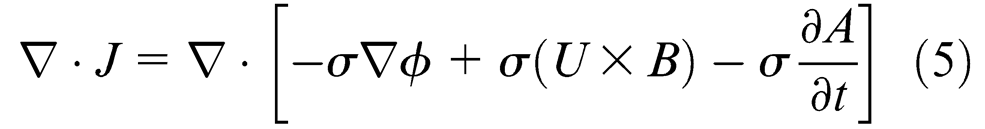
The set of equations used to solve the electromagnetic phenomena is given in equations (4) to (6).
The electric field can be calculated using the potential formulation as

and the current density is determined as
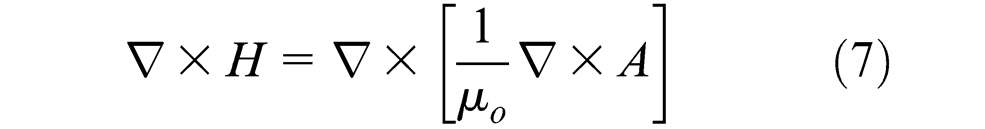
The magnetic induction can be derived using the potential formulation as

and the magnetic field is calculated as
Knowing

The joule heating is calculated as

Simulation procedure
Simulation of the arc
The computational domains for V-shape, L-shape and open-corner joints are shown in Figures 1(a–c) respectively. All the domains are planar symmetric. Although the arc and workpiece are shown together both are solved separately. The arc is solved with steady-state condition and the weld pool is analysed transiently for two seconds.
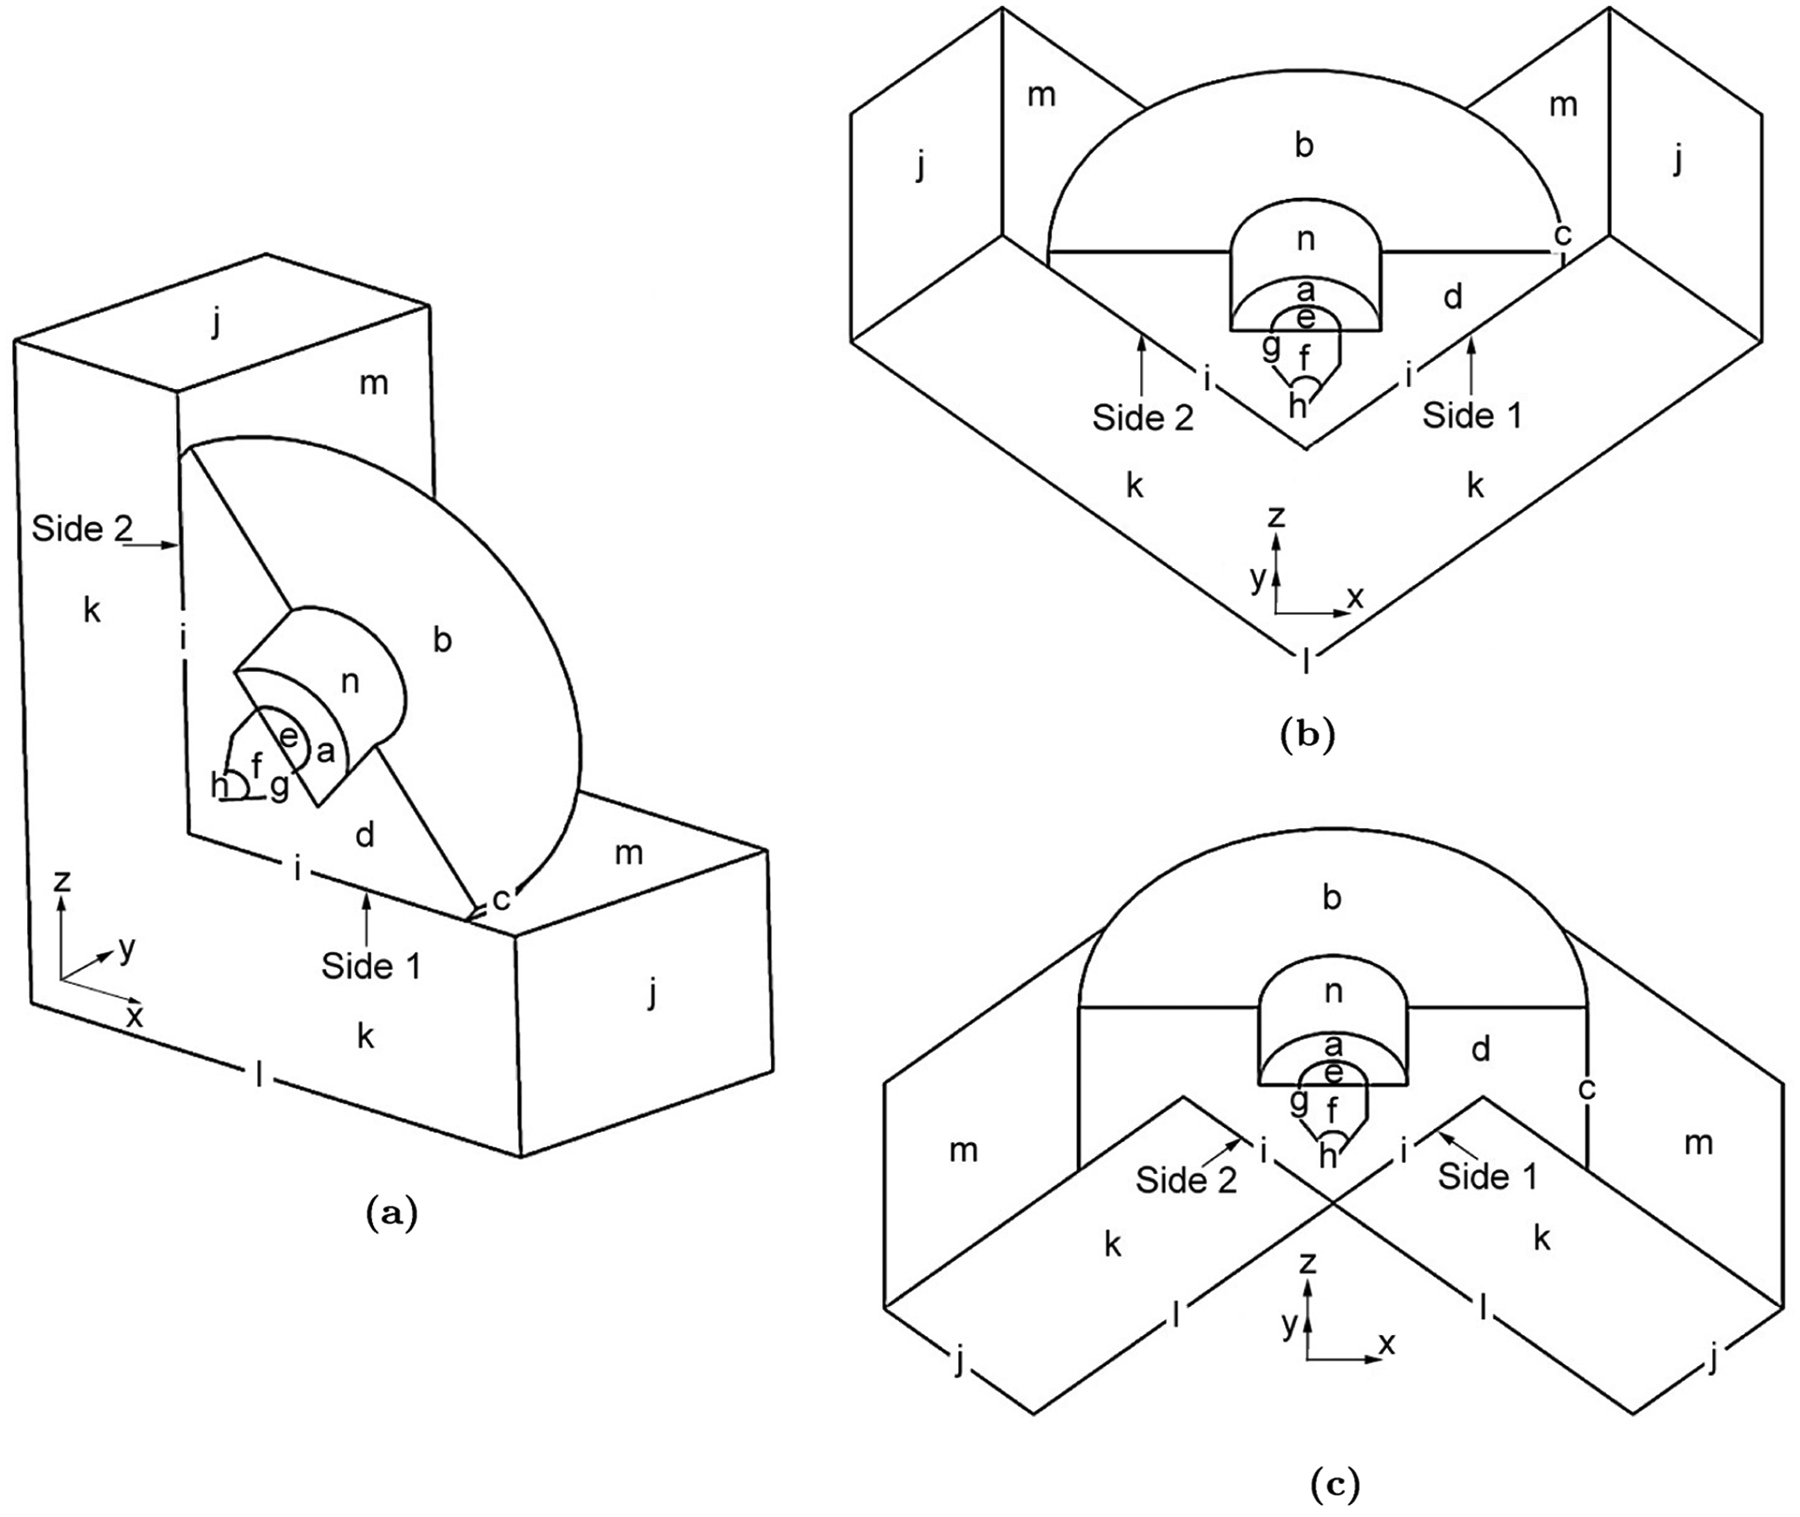
Computational domains (a) L-shape, (b) V-shape, (c) open-corner.
In all of the studies, the arc length is 2 mm from the sides (side 1 and side 2) of the workpiece, electrode diameter is 3.2 mm, electrode tip angle is
Heat flux due to conduction and convection is calculated on the anode surface by the energy equation; however, more than 80% heat transfer to the workpiece is calculated due to the electronic contribution. 35 The total heat flux is thus the summation of the heat flux due to conduction and convection and heat flux due to the electron contribution. Heat flux due to the electronic contribution is calculated using equation (10) and is applied at the interface of the arc plasma and anode surface (surface i in Figure 1) as suggested by Gonzalez et al. 36 Electronic heat flux includes the electron potential energy, electron thermal energy and anode fall.

The values of
Simulation of the weld pool
To simulate the weld pool, current density, heat flux, gas shear and Marangoni convection are applied as boundary condition on the weld pool surface. The variation of density with temperature in the weld pool is assumed to be very small; 37 therefore, the Boussinesq approximation is used to model the buoyancy effects. To simulate the solid and liquid weld pool, both the regions are modelled as a single domain. Large viscosity is defined as being where temperature is less than the solidus temperature and actual viscosity is defined as being where the temperature is above the solidus temperature of the material; this approach is adapted from Fenggui Lu et al. 38 All other properties of SS304 are temperature dependent and are taken from Leibowitz. 39 The weld pool is transiently analysed for two seconds.
Computational aspects
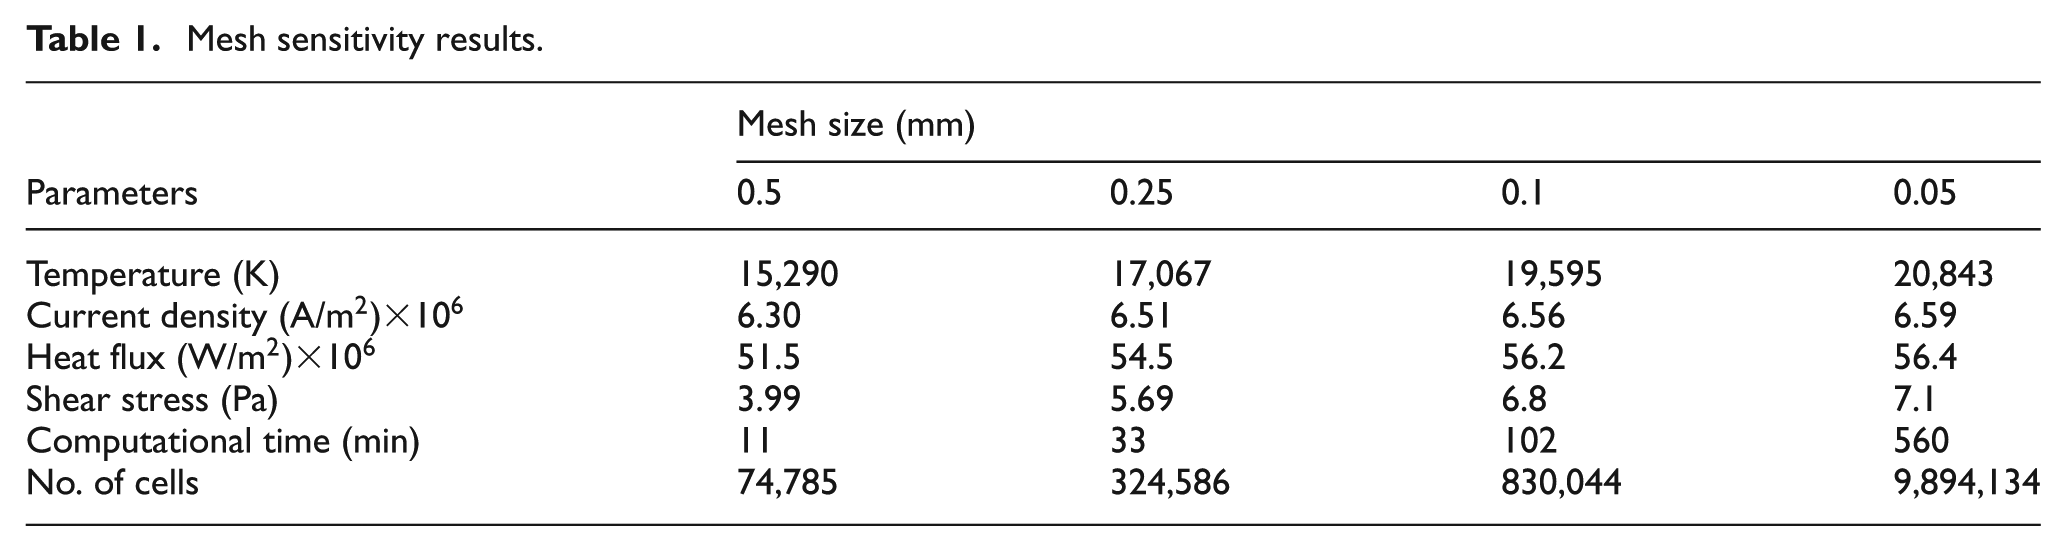
The arc and weld pool are solved separately. A tetrahedral grid system is used for both the arc and weld pool domains. Mesh sensitivity analysis is performed on the steady-state arc to assure the accuracy of the results. The same mesh size is then used for the transient weld pool calculations. Core i7 (8 CPUs) system with 2.80 GHz clock speed and 6.0 GB RAM is used for the analysis. The results of four different mesh sizes are given in Table 1. Due to small change in temperature and other parameters as compared to the computational time, a mesh size of 0.1 mm is selected.
Mesh sensitivity results.
Boundary conditions
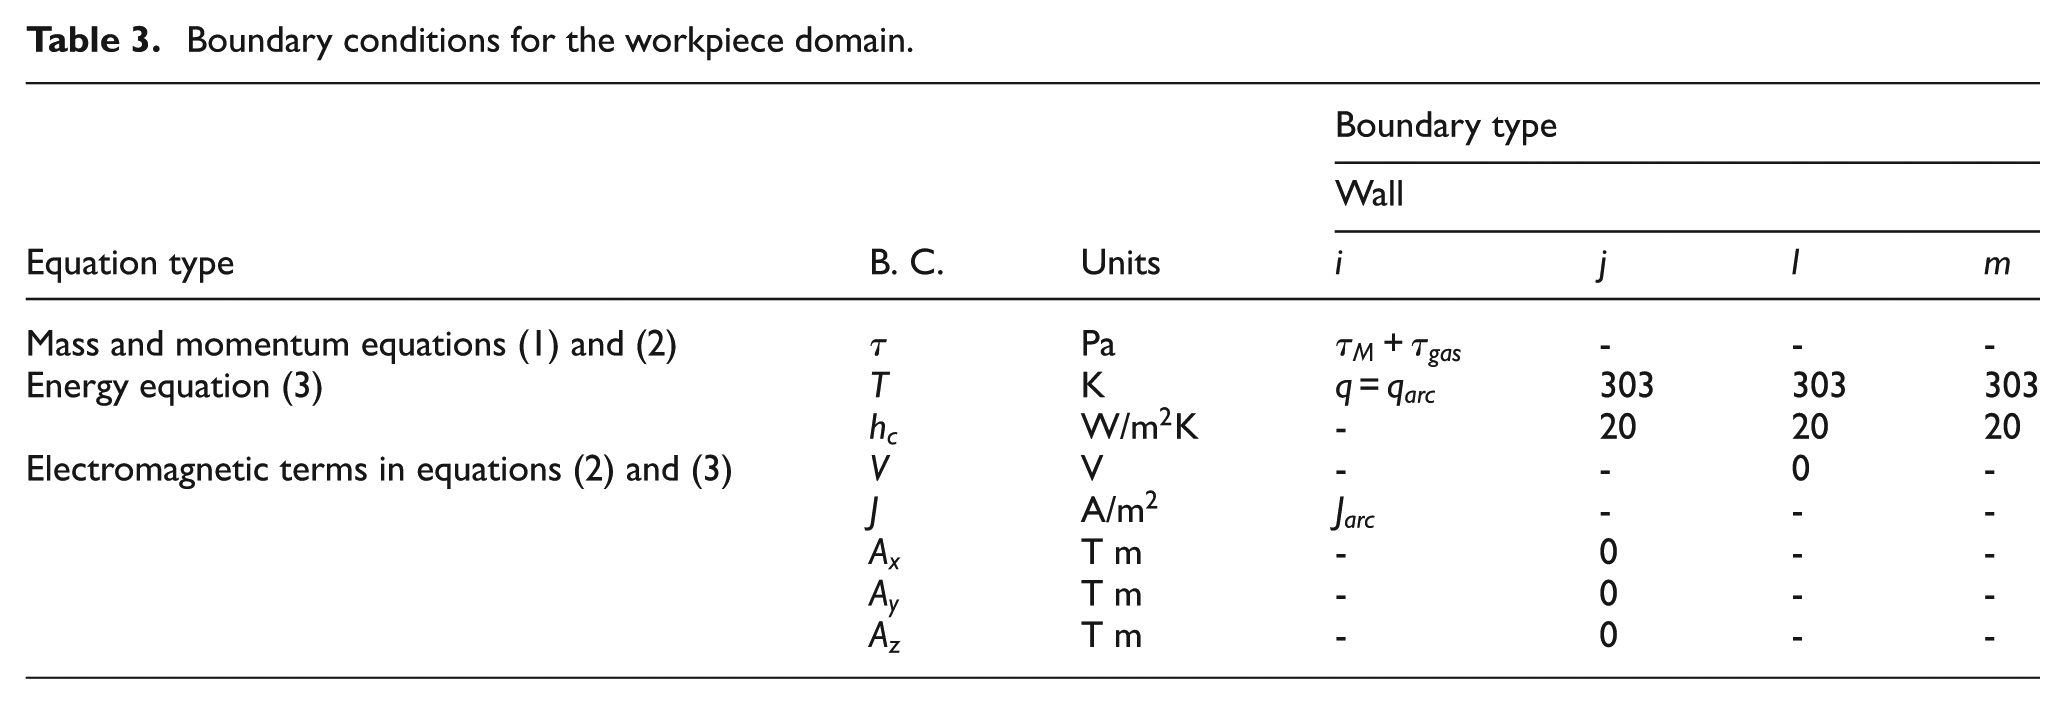
The boundary conditions for the arc and weld pool are given in Tables 2 and 3 respectively. Boundaries
Boundary conditions for the arc domain.
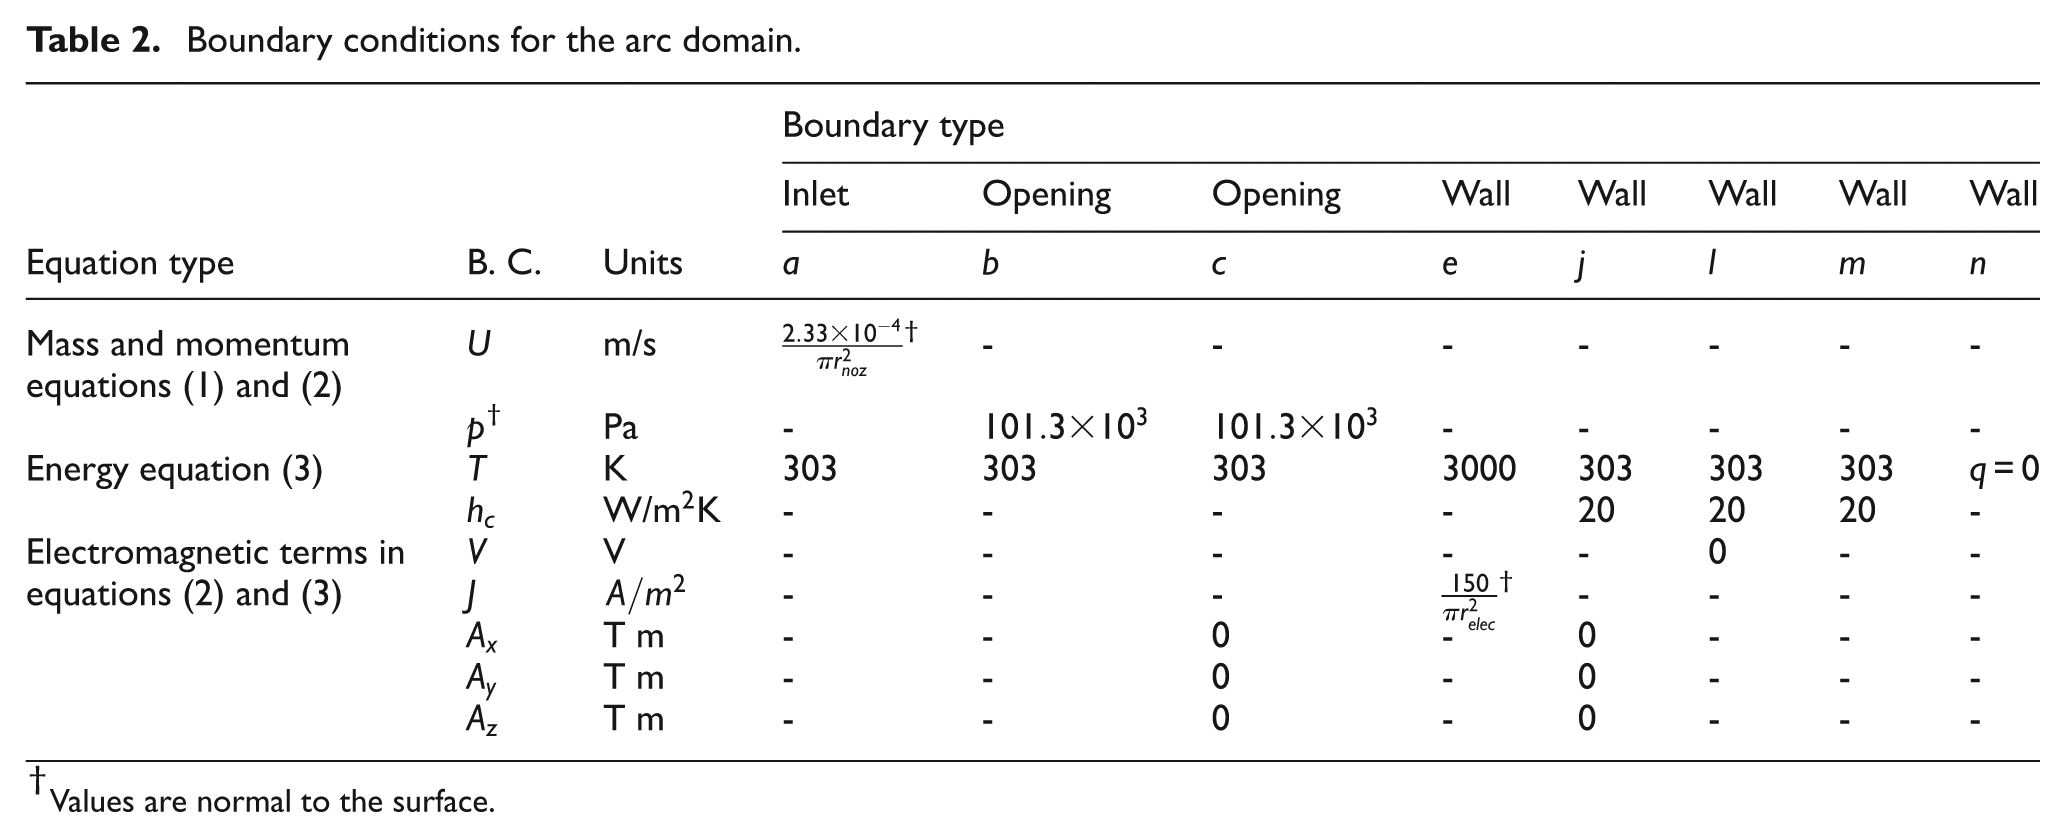
Values are normal to the surface.
Boundary conditions for the workpiece domain.
Heat flux (

The temperature-dependent surface tension is calculated using equation (12), as per Goodarzi et al: 37

where

Experimental setup
Experiments are performed to validate the weld pool shapes. The experimental setup is shown in Figure 2. A timer is attached to the torch to switch off the arc automatically after two seconds. The electrode is thoriated tungsten used with straight polarity (DCEN) power supply. The workpiece material is SS304, 10 mm thick. Other welding parameters are the same as given in the earlier section Simulation of the arc. The tungsten electrode is precisely positioned pointed to the joint and 2 mm from each side of the workpiece. The experimental results are presented in the later section The weld pool.
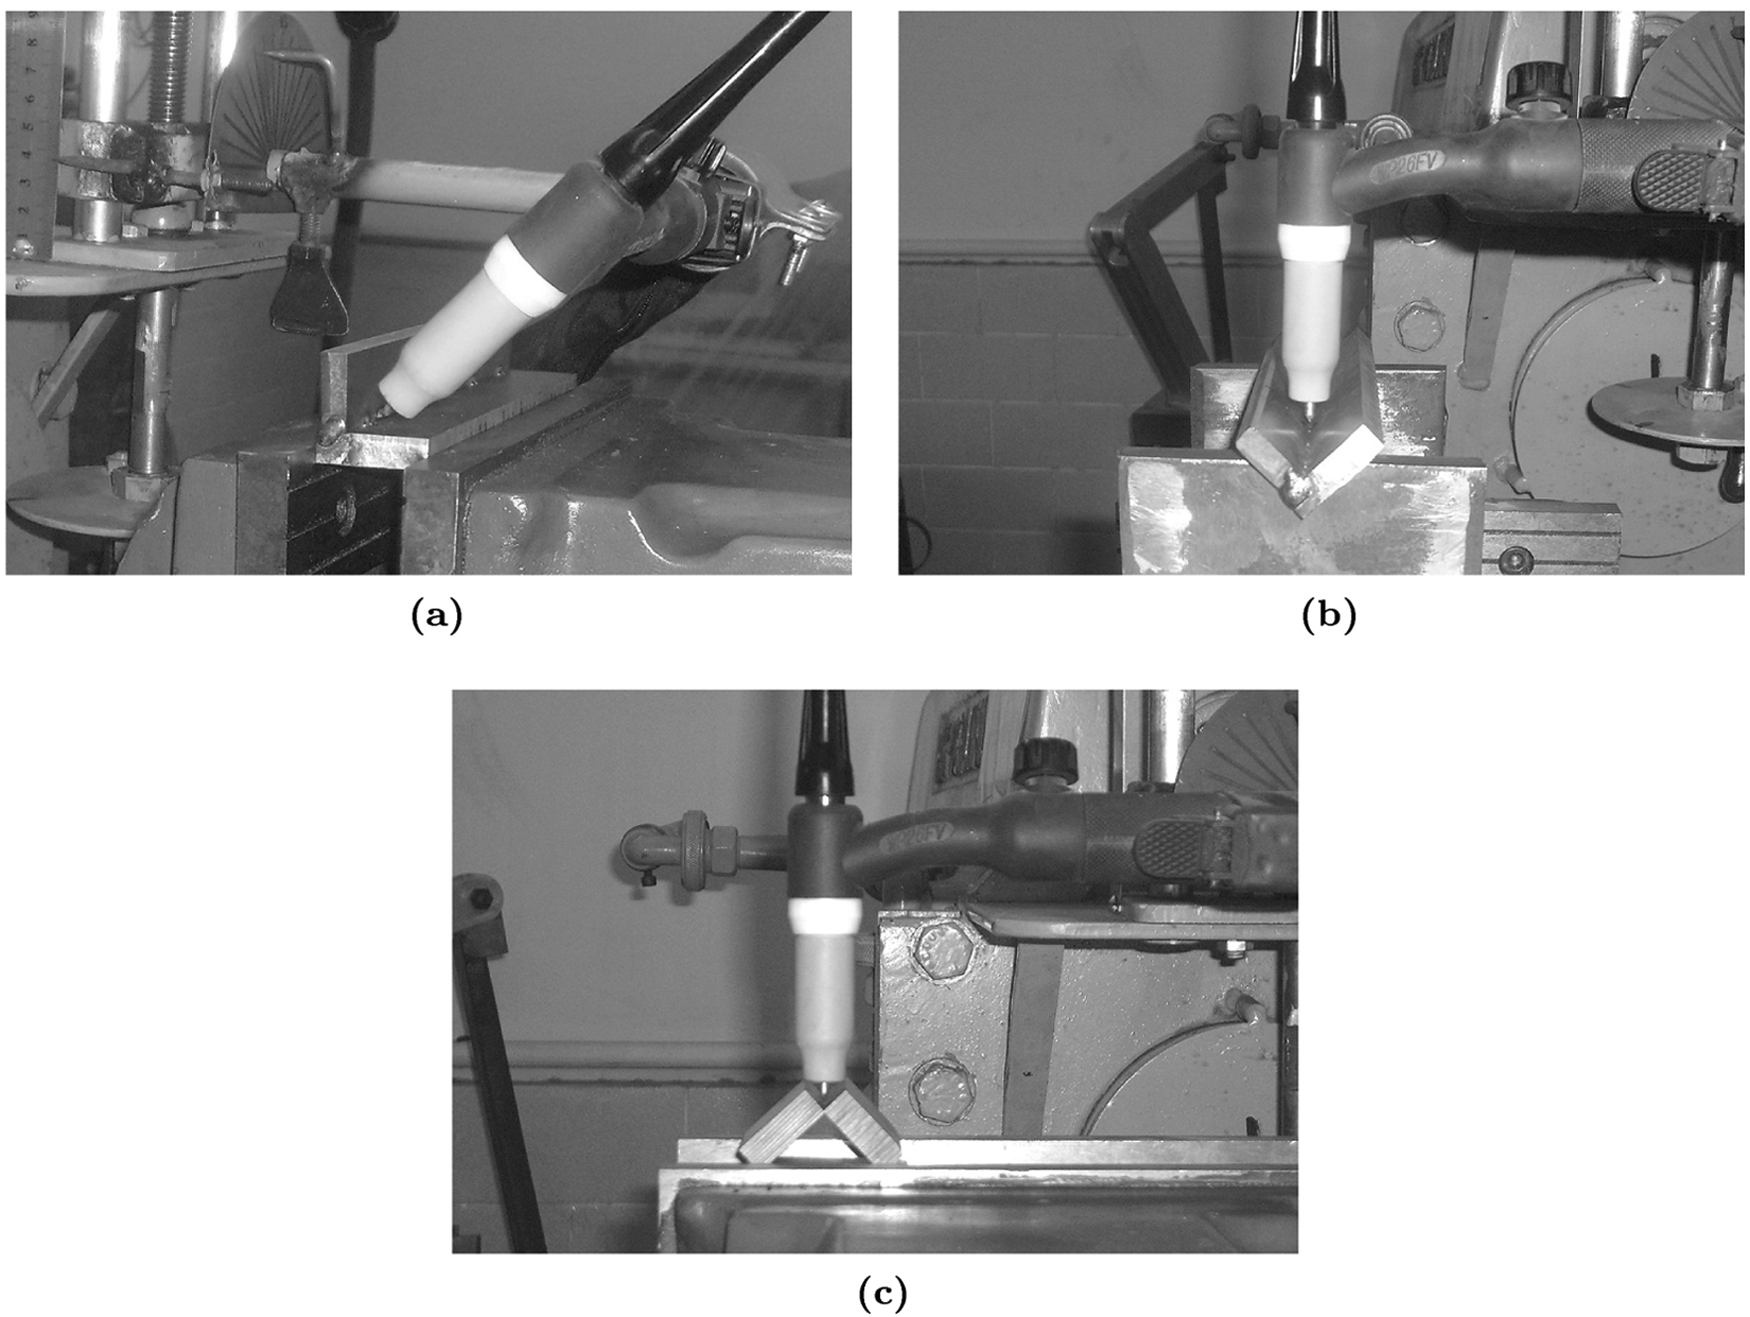
Experimental setup: (a) L-shape, (b) V-shape, (c) open-corner.
Model validation
The numerical model is validated through the available experimental results of weld on plate. Figure 3(a) represents the measured plasma temperatures of Hsu et al.
40
Figure 3(b) shows the computed temperatures in a 3D planar symmetric model of the present study. The welding current is 200 A and the arc length is 10 mm. The electrode is thoriated tungsten of diameter 3.2 mm with
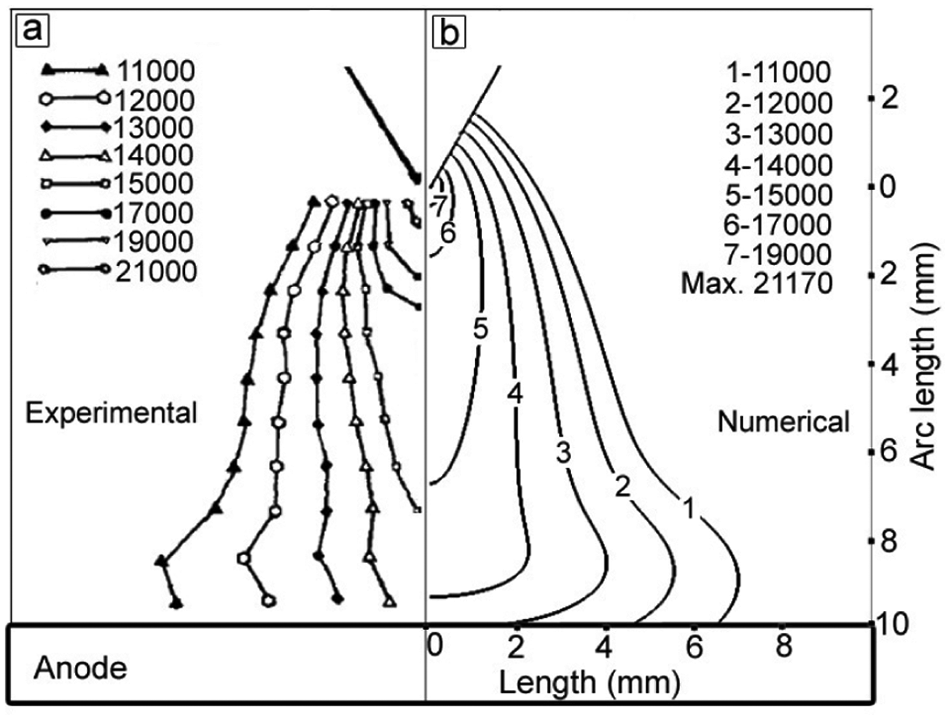
Comparison of arc temperatures: (a) Hsu et al., 40 (b) present study.
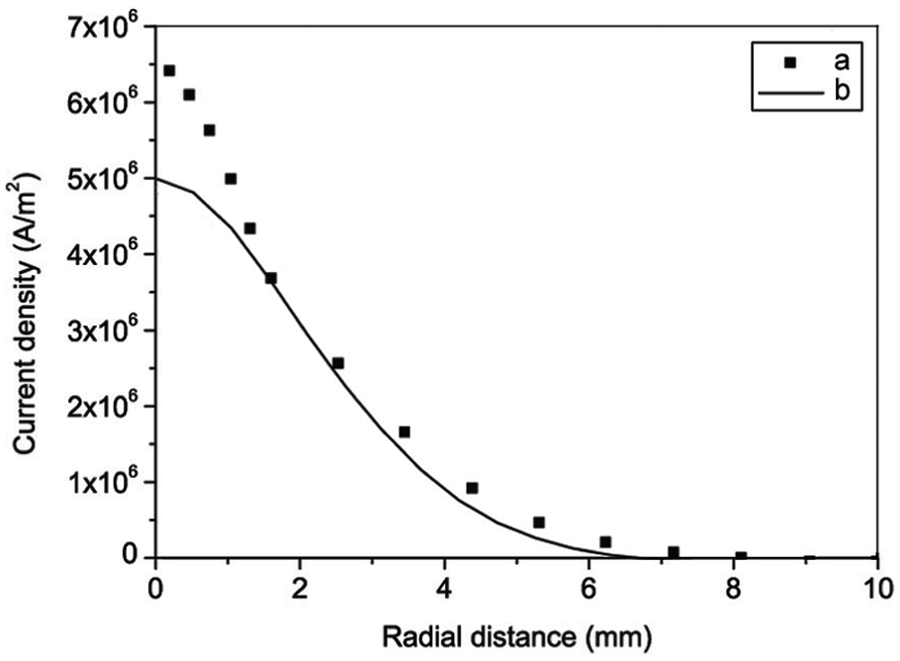
Comparison of current density distribution: (a) Fenggui Lu et al., 27 (b) present study.
Results and discussion
The arc properties in the arc domain are observed to be similar in all the three cases due to similar weld geometry; therefore, only L-shape joint configuration is discussed in what follows.
Arc temperature
The plasma arc temperature in the arc column for L-shape joint is shown in Figure 5 which is in the range of 19,000 K for 150 A current and decreases to 13,000 K at the workpiece surface (Figure 6).
Temperature profiles in the arc column of L-shape joint.
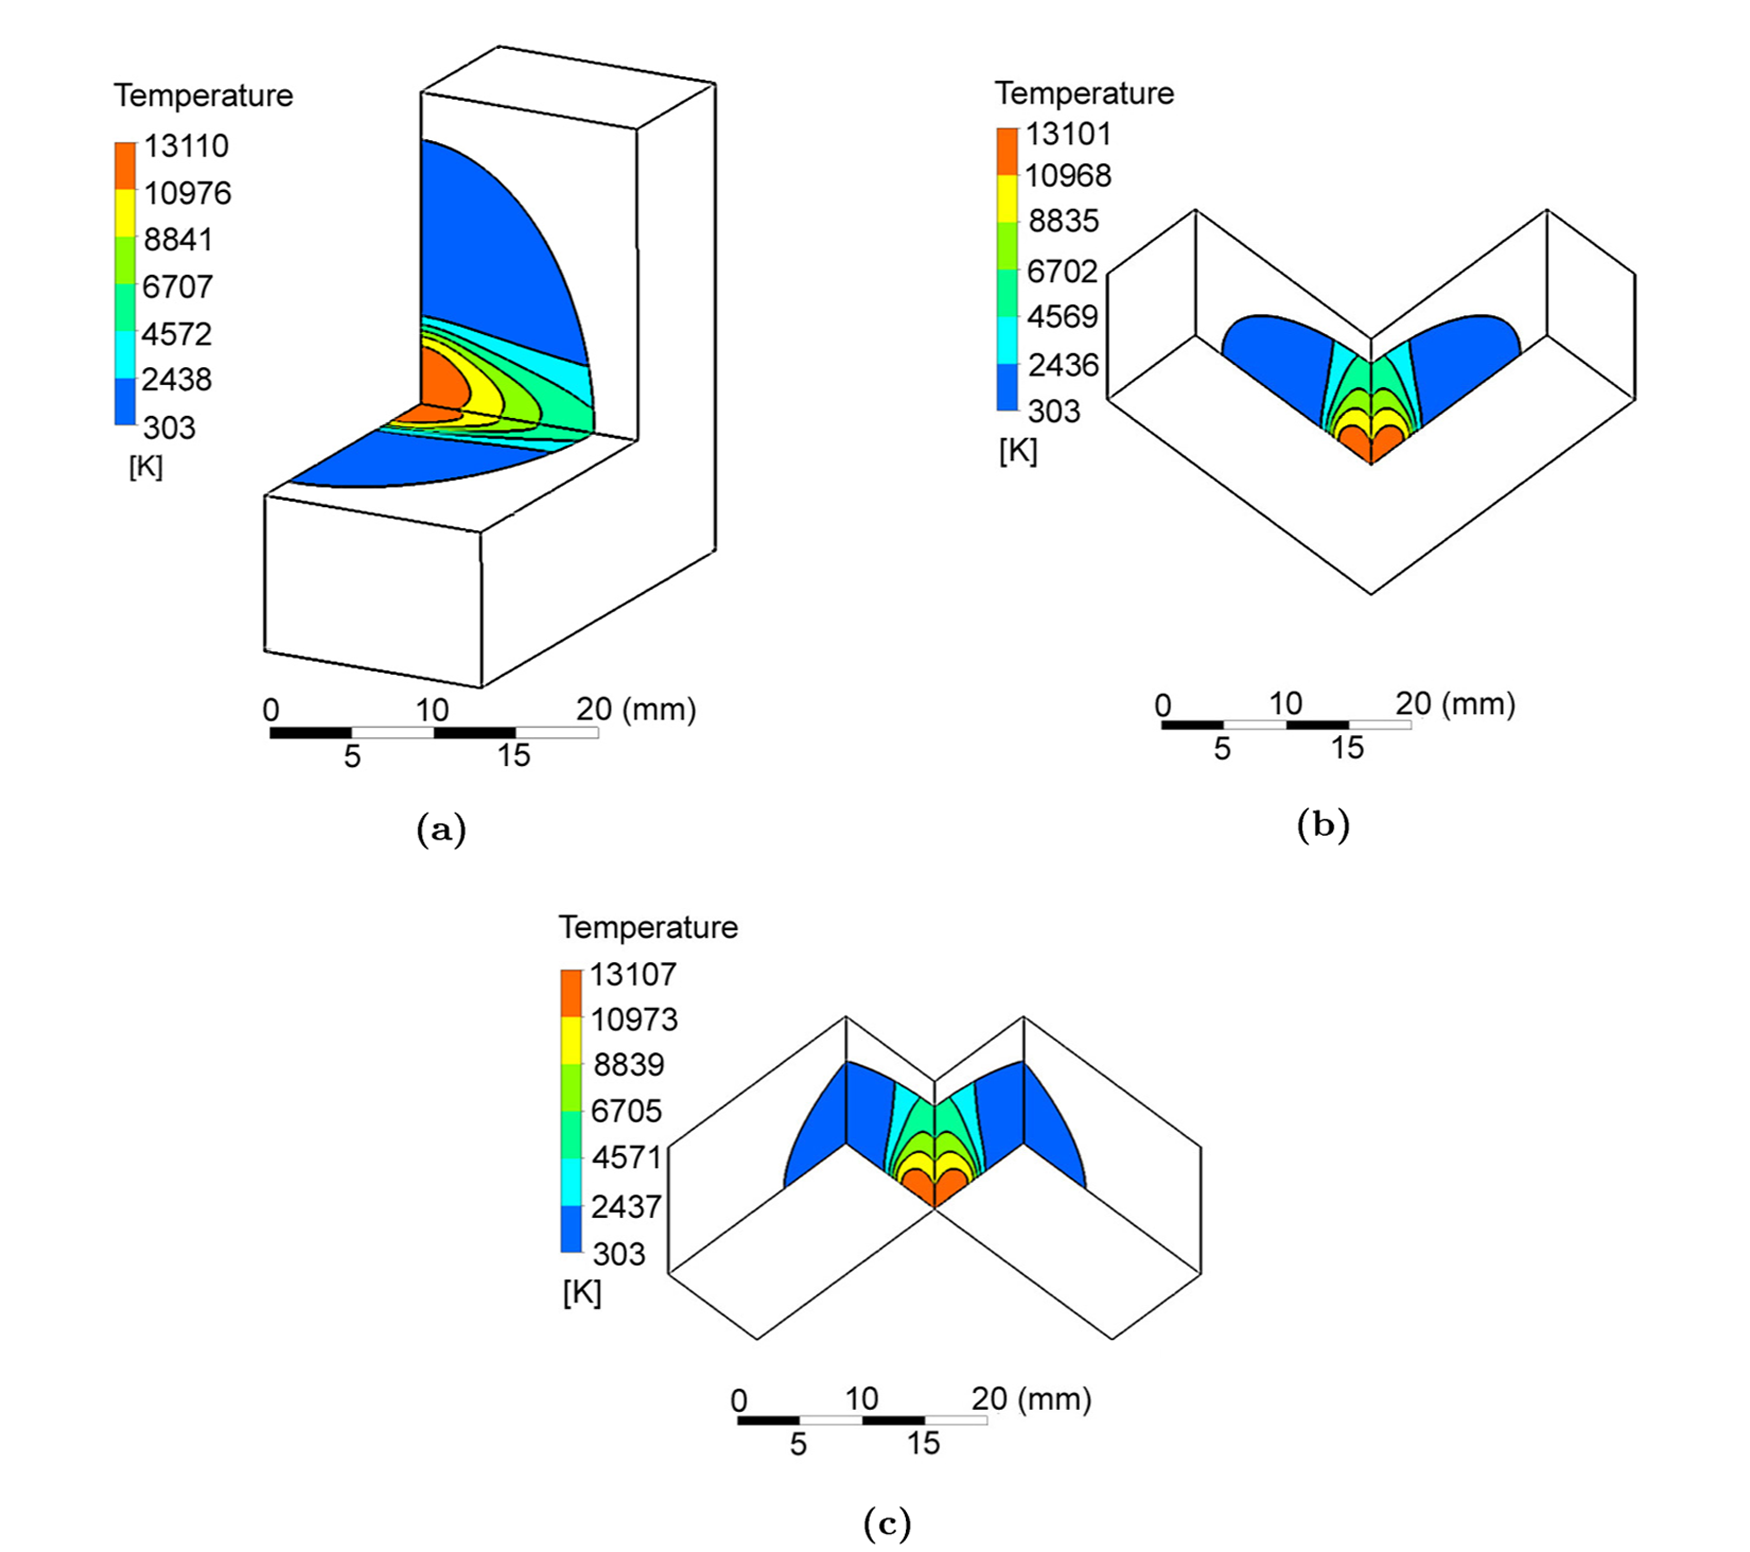
Arc temperature on the surface of (a) L-shape, (b) V-shape, (c) open-corner joints.
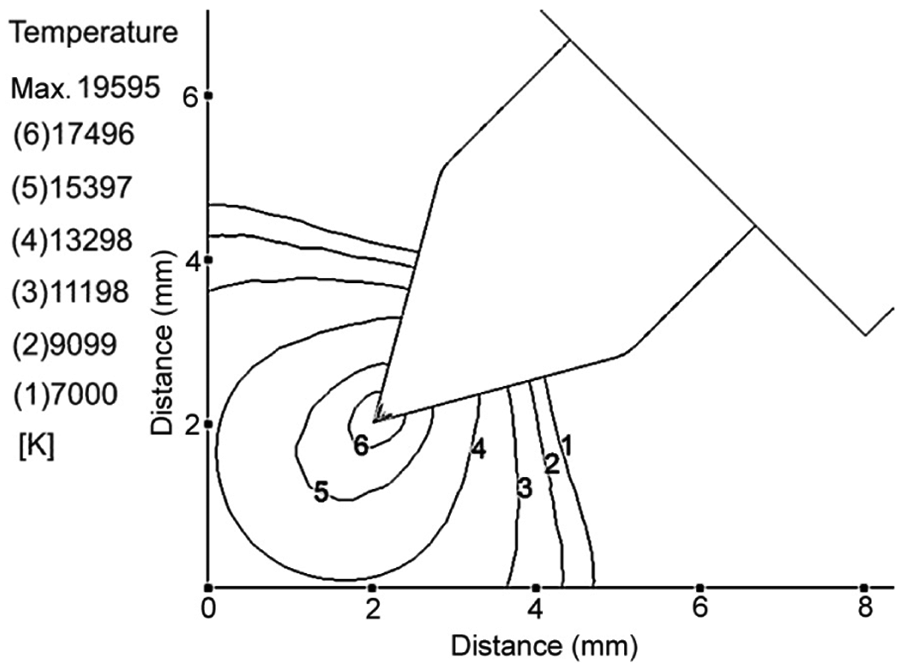
Figure 7 represents the contours of temperature distribution on the L-shape joint by placing the weld sides in one plane. The maximum temperature of 13,110 K is observed to be about 1.6 mm away from the weld centre where the distance between the tip and the workpiece is the minimum. Similarly, the minimum temperature distribution of 7000 K is 38% larger along the weld joint as compared to the weld sides.
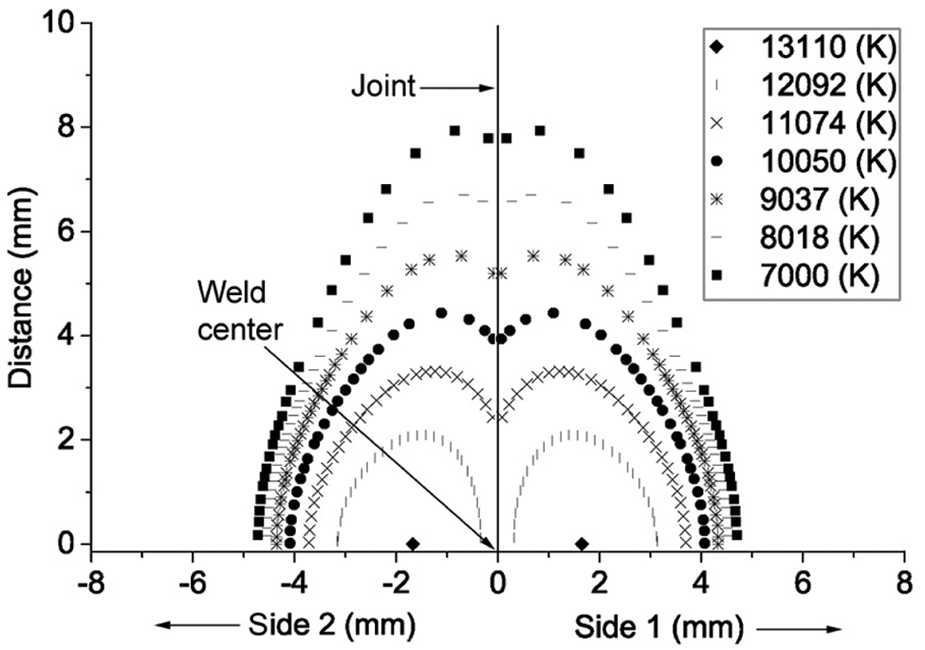
Arc temperature contours on the surface of L-shape joint.
Arc velocity
Figures 8(a) and (b) represent the velocity vectors in the arc column and on the workpiece surface respectively. The arc jet is observed to flow outward along the joint.
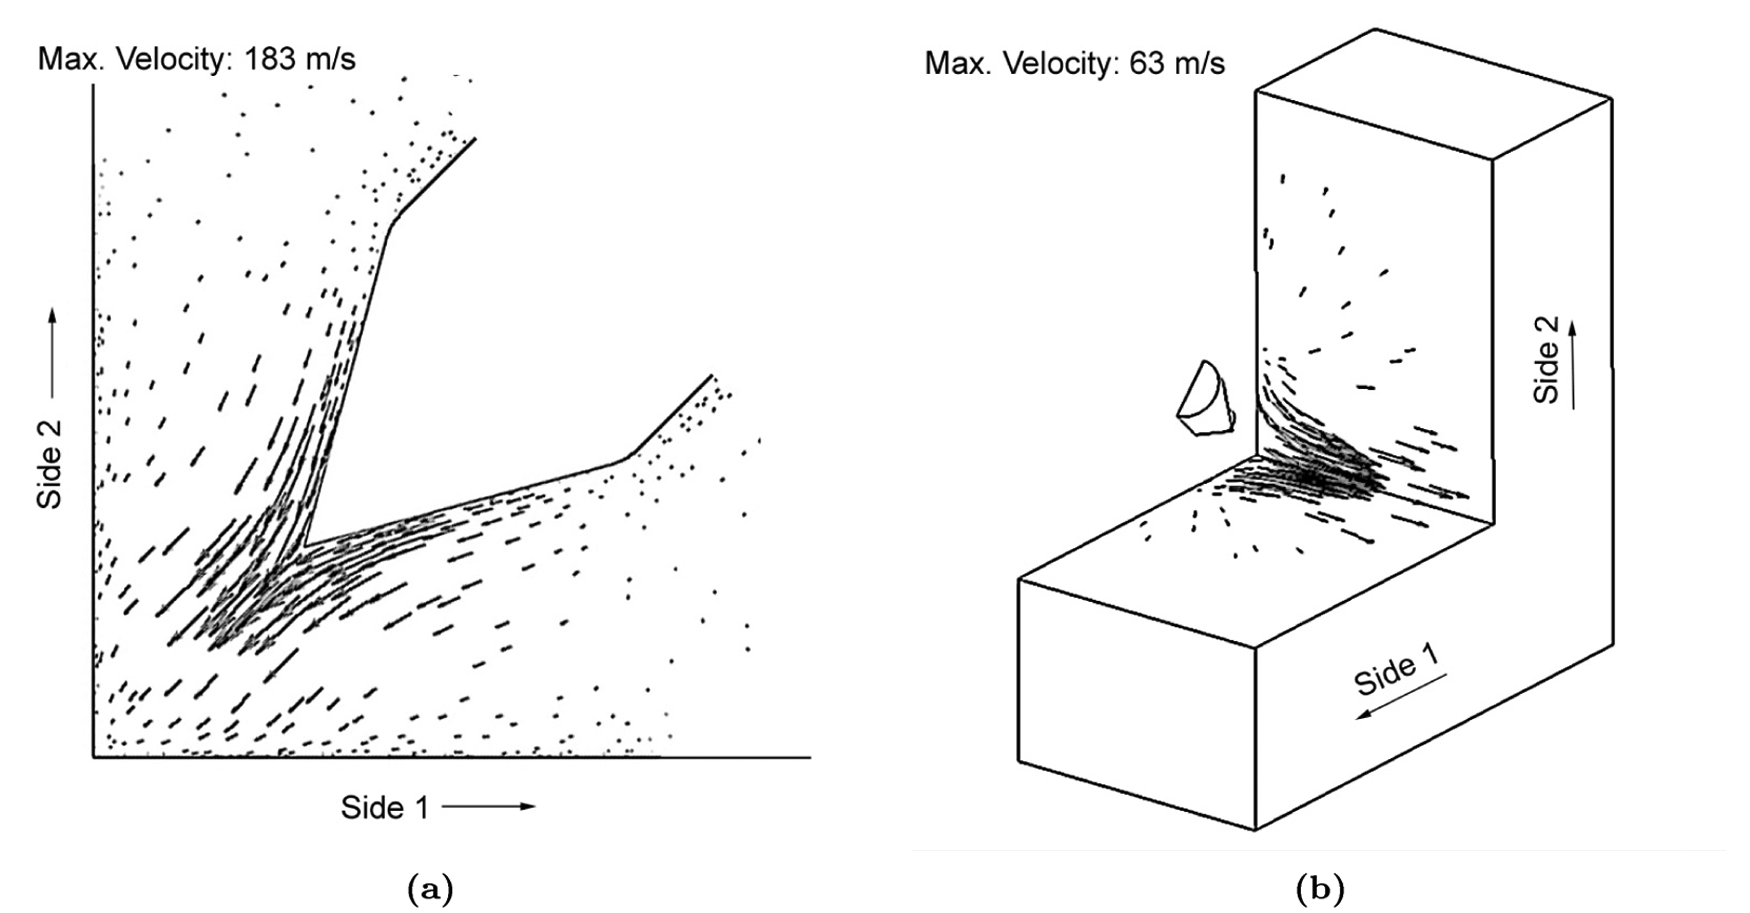
Velocity vectors in L-shape joint (a) in the arc column, (b) on the workpiece surface.
Figure 9 represents the contours of velocity distribution on the workpiece surface. Velocity is the minimum (
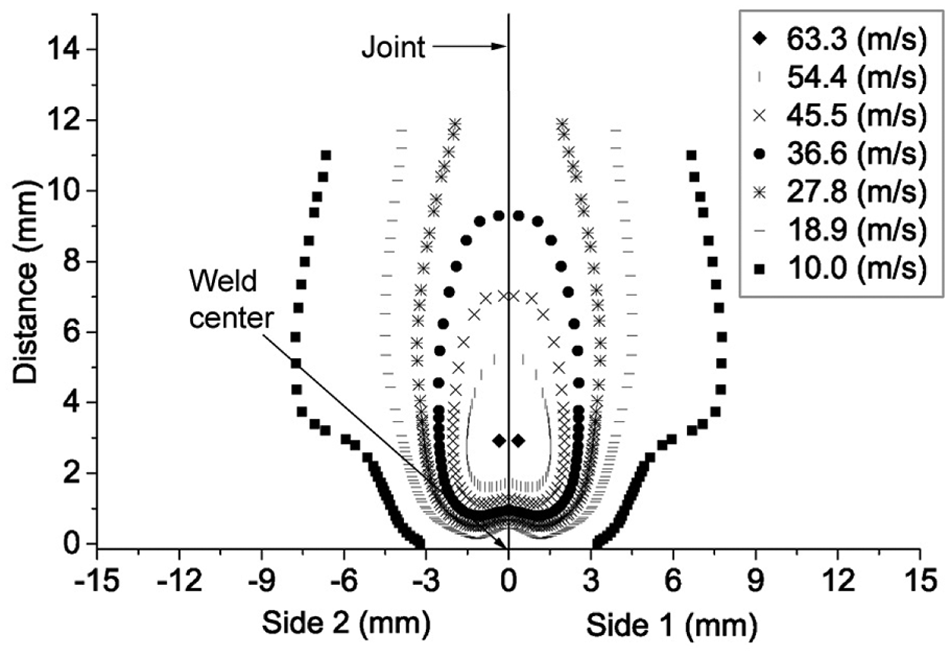
Velocity contours on the surface of L-shape joint.
Current density distribution
Figure 10 shows the current density in the arc column of L-shape joint. The current density is the maximum (9.2E7 A/
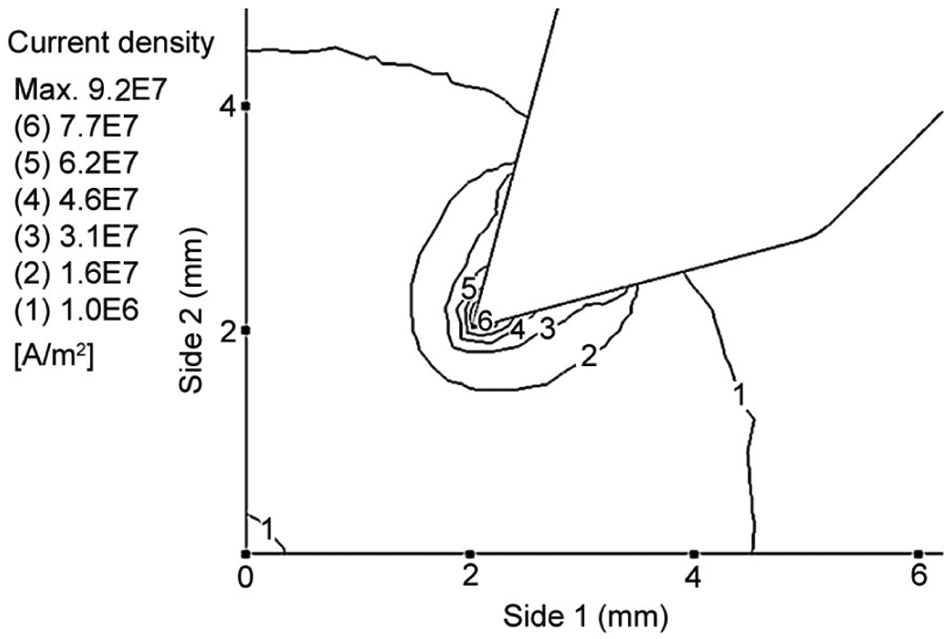
Current density in the arc column of L-shape joint.
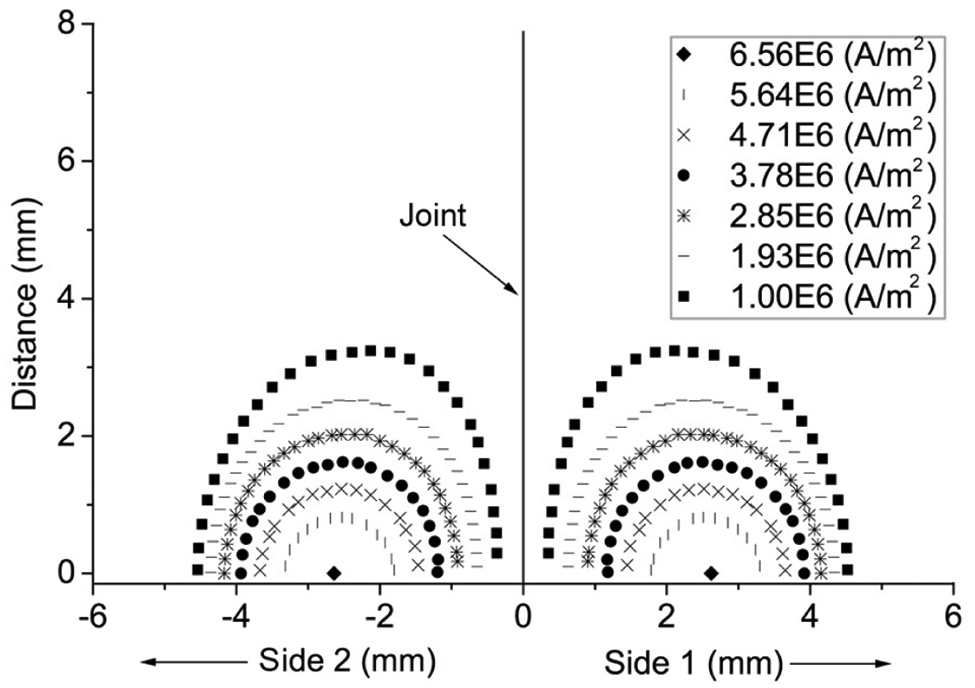
Current density distribution on the surface of L-shape joint.
The heat flux
The distribution of the heat flux due to conduction and convection and electronic contribution is shown in Figures 12 and 13 respectively by placing the weld sides in one plane. In Figure 12(a), the distribution becomes wider along the weld joint for small values (contour of 1.00E6 W/
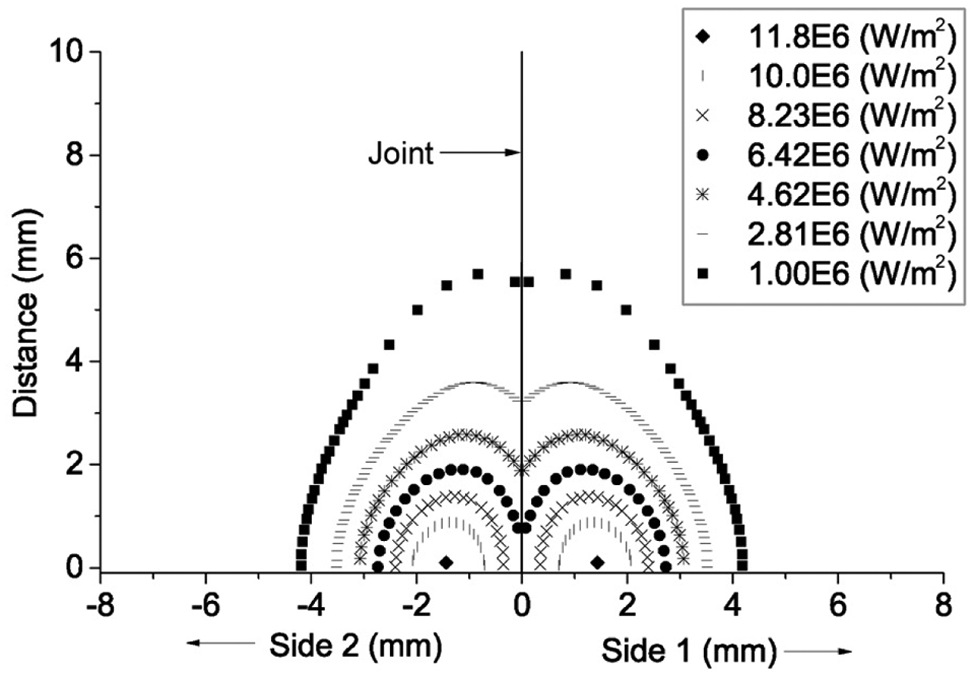
Heat flux due to conduction and convection on the surface of L-shape joint.
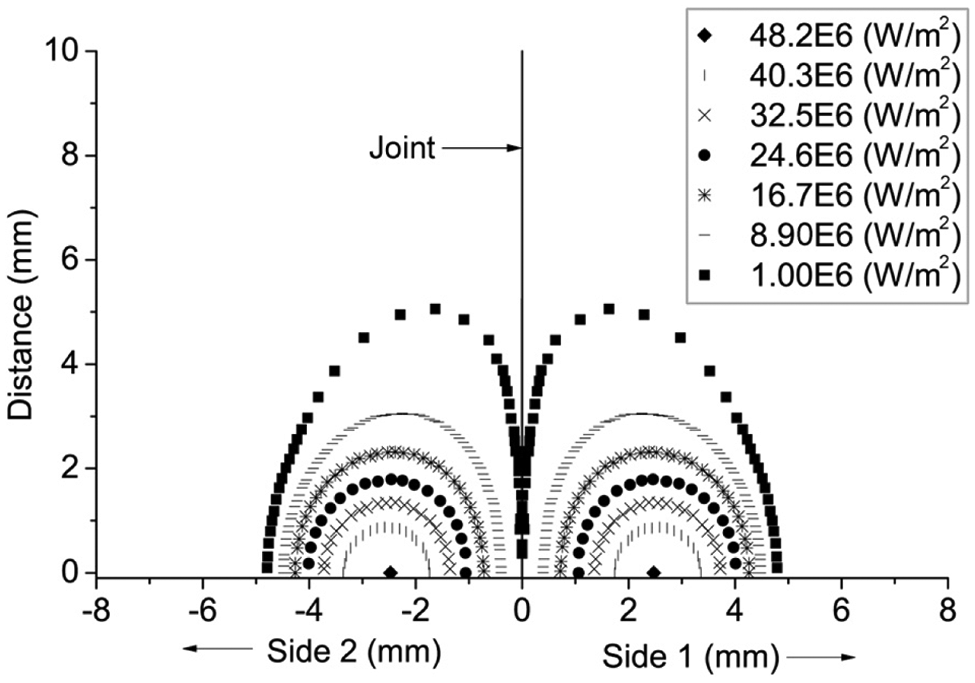
Heat flux due to electronic contribution on the surface of L-shape joint.
Electronic heat flux is observed to be maximum where the distance between the electrode and workpiece is the minimum. Total heat flux is calculated by summing the heat flux due to electronic contribution and conduction and convection and is shown in Figure 14.
Total heat flux on the surface of L-shape joint.
The gas shear stress
Gas shear is the force applied by the plasma jet on the weld pool surface. The gas shear together with the Marangoni convection significantly affects the weld pool shape. Figure 15 shows the distribution of the gas shear stress on the workpiece surface. As the gas shear is primarily calculated from the arc velocity, 41 it is therefore observed to be similar to the velocity distribution of Figure 9. The largest gas shear of 6.8 Pa is observed at a same distance of 2.5 mm from the weld centre as in the case of arc velocity. Gas shear is outward from the weld centre along the joint and tends to increase the width of pool in that direction.
Contours of gas shear stress on the surface of L-shape joint.
Electromagnetic and buoyancy forces in the weld pool
The electromagnetic force enhances the fluid flow, generates downward circulation in the weld pool and increases the depth of the weld pool.
42
Figure 16 represents the distribution of electromagnetic force in V-shape and open-corner joints by placing the weld sides in one plane. The largest force is 1.4E4 N/
The buoyancy force is opposite to the electromagnetic force and produces upward convection which increases the width of the weld pool.
7
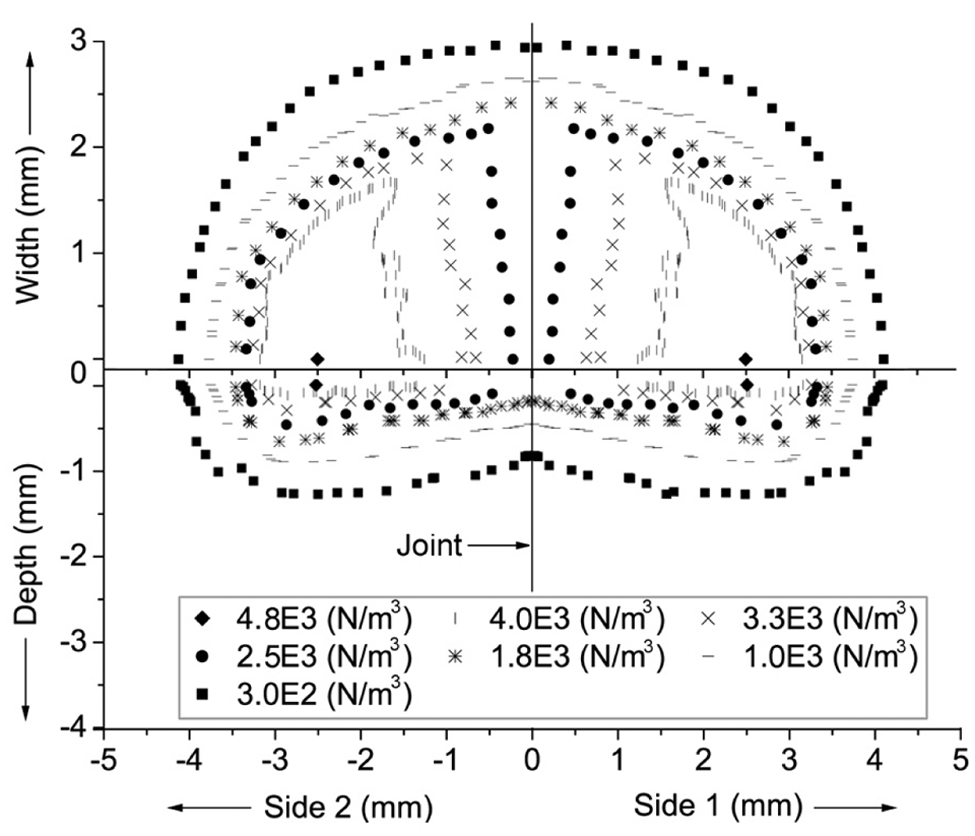
The buoyancy model in this analysis investigates the buoyancy-driven flow (gravity effect) on the weld pool shape due to the workpiece orientation. The contour plots shown in Figures 17 to 19 represent the distribution of the buoyancy force by placing the weld sides in plane. The magnitude of force is found to be almost the same in all the three joints; however the distribution is different. In the L-shape joint, the distribution of buoyancy force is large at side 2 which is vertical. The largest force of 4.9E3 N/
Contours of electromagnetic force in (a) V-shape, (b) open-corner joint; small figures represent the actual contours.
Contours of buoyancy force in L-shape joint.
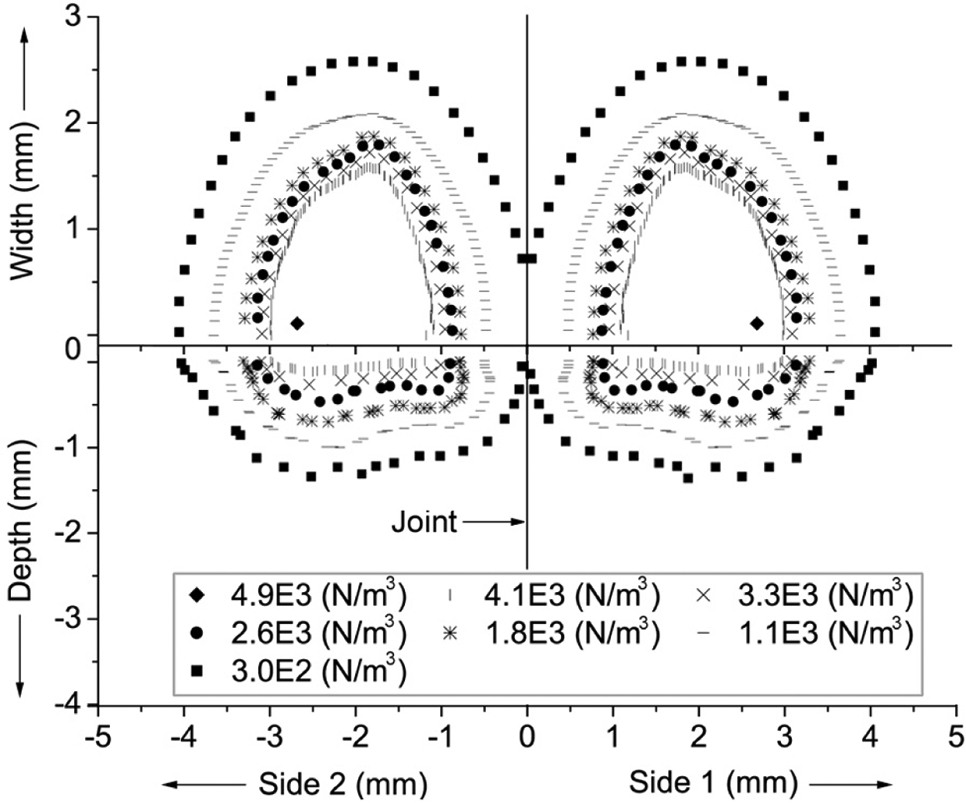
Contours of buoyancy force in V-shape joint.
Contours of buoyancy force in open-corner joint.
Fluid flow in the weld pool
The gas shear and Marangoni convection significantly affect the fluid flow in the weld pool. The sign of the surface tension gradient (
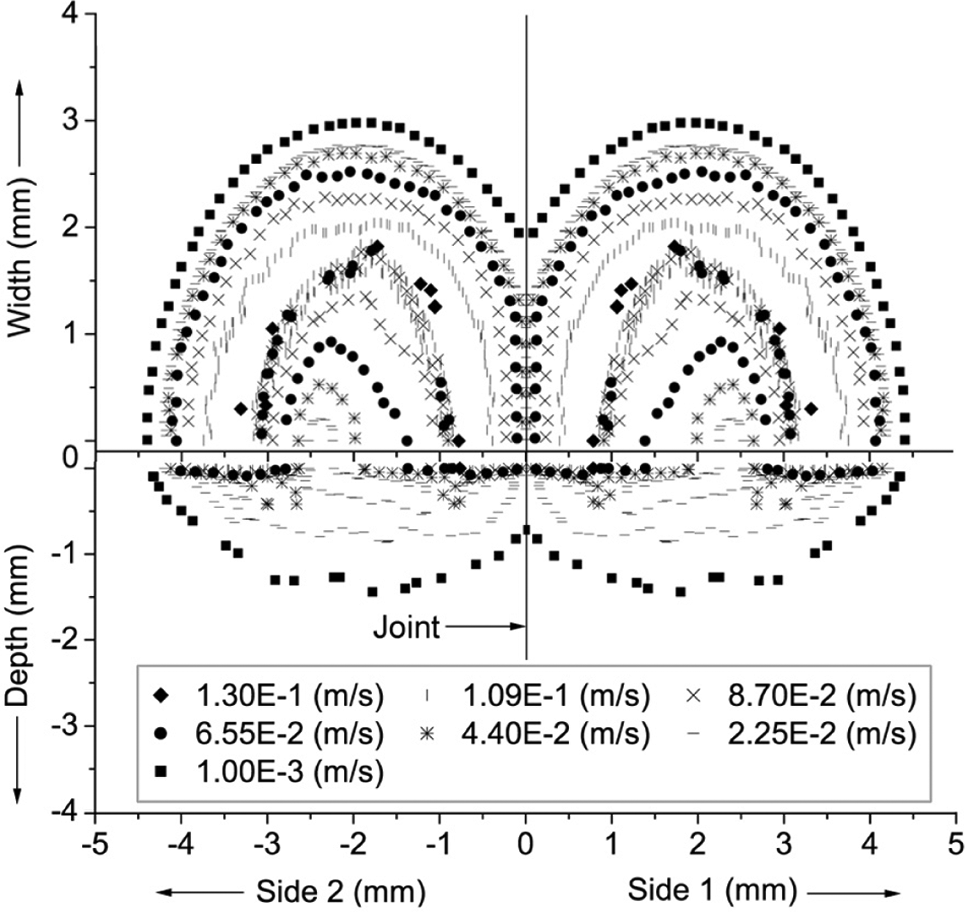
Velocity contours in the weld pool of V-shape joint.
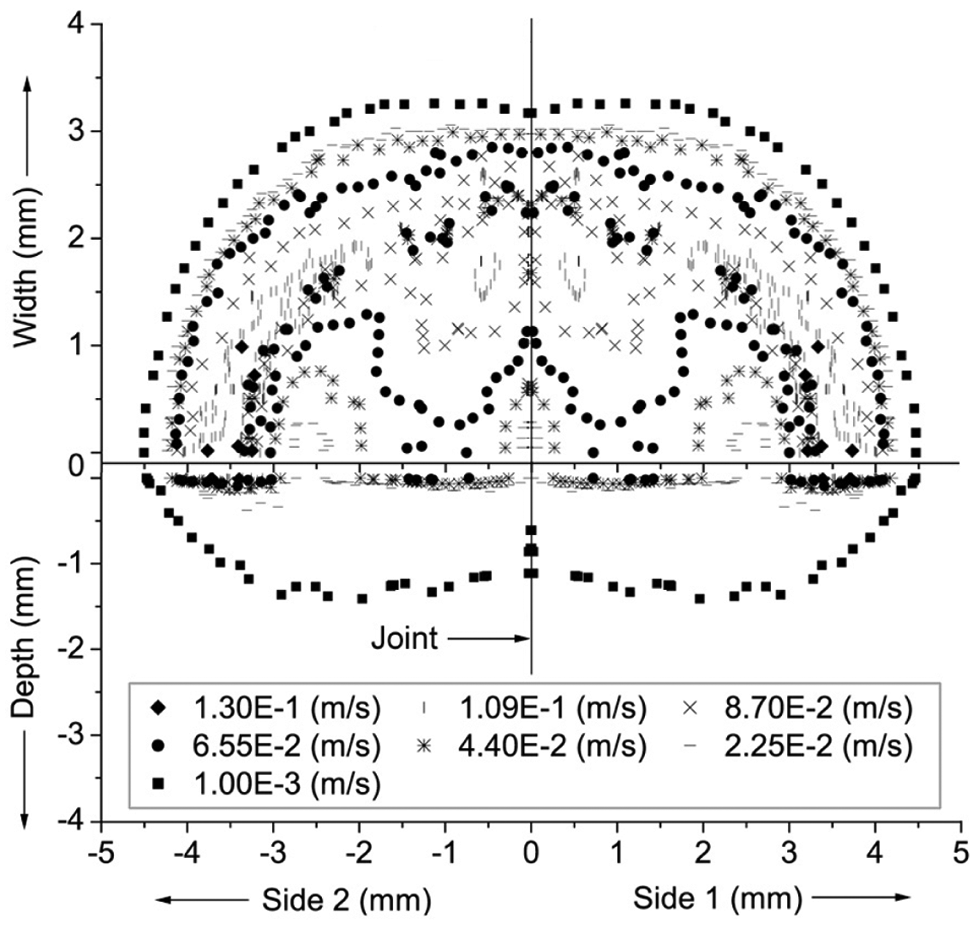
Velocity contours in the weld pool of open-corner joint.
The weld pool
Numerical and experimental weld pool depth and width are shown in Figures 22 and 23 respectively. The width is shown by placing both the weld sides in one plane. The weld pools of L-shape and V-shape joints are observed to be the same, 4.1 mm wide and 1.5 mm deep. This shows that the orientation of the workpiece is not affected by the buoyancy-driven flow (gravity) because the fluid convection due to gas shear and Marangoni force is much larger than the buoyancy and electromagnetic force. 37 In the open-corner joint, although the overall width is the same, the width at the joint is observed to be 50% larger than the L-shape and V-shape joints. This is because the cross-sectional area is small for the same heat input, which produces a shallow and wide weld pool at the edge in the open-corner joint. The depth in the open-corner joint is found 8% less than for the L-shape and V-shape joints.
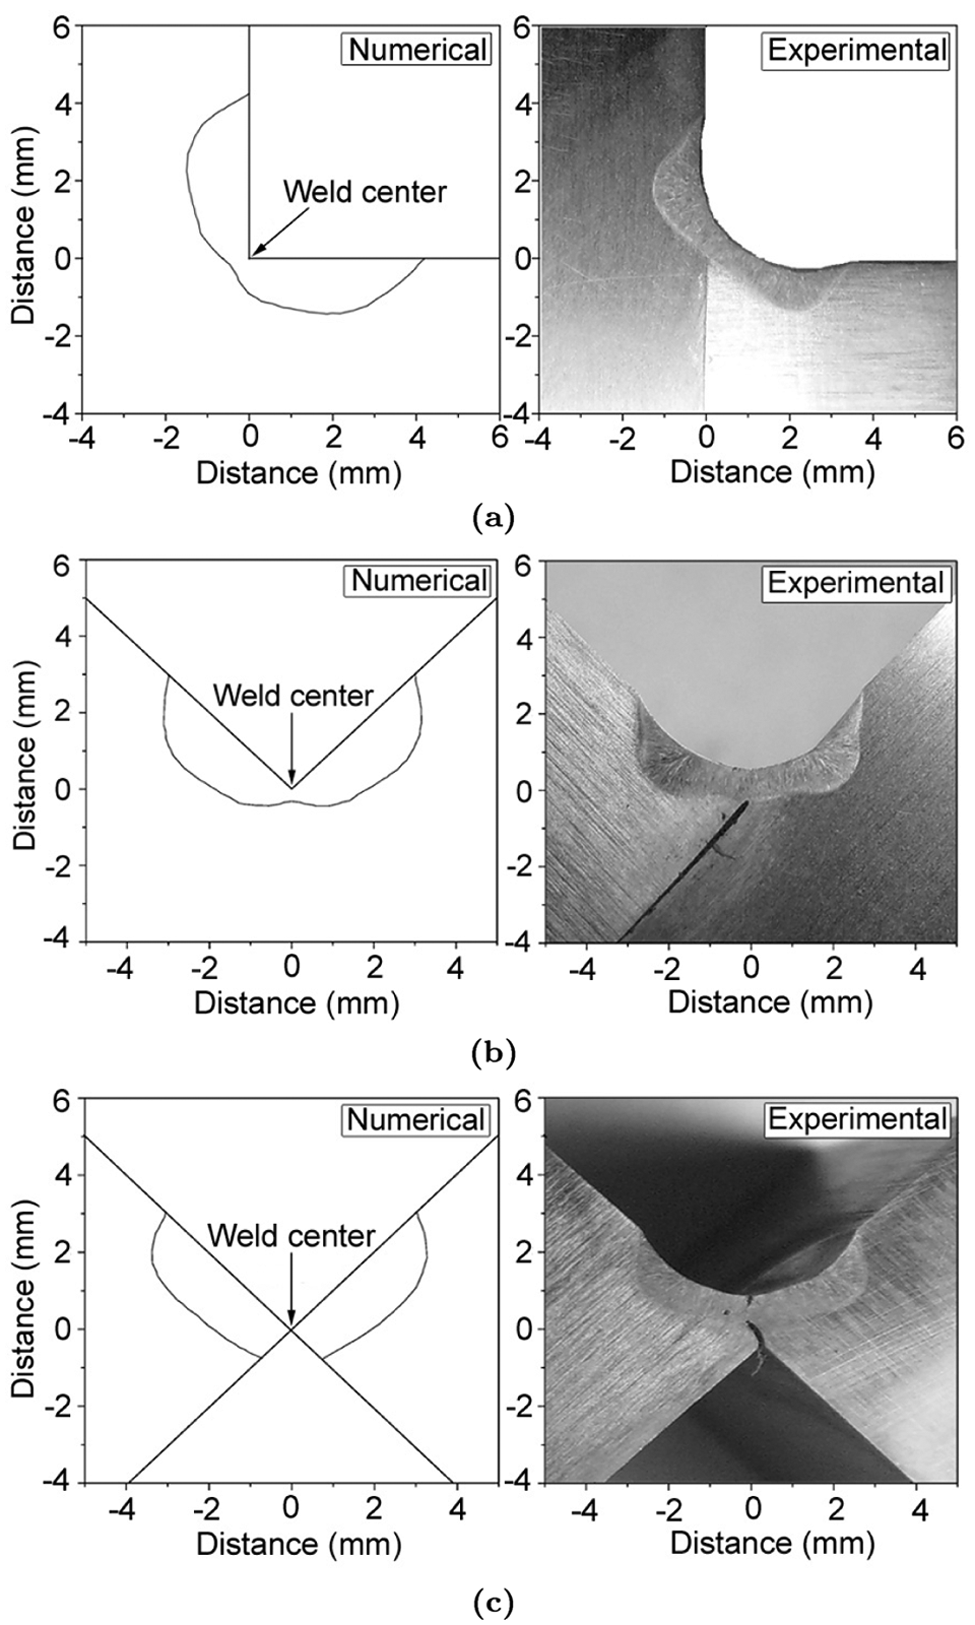
Numerical and experimental weld pool depth: (a) L-shape, (b) V-shape, (c) open-corner.
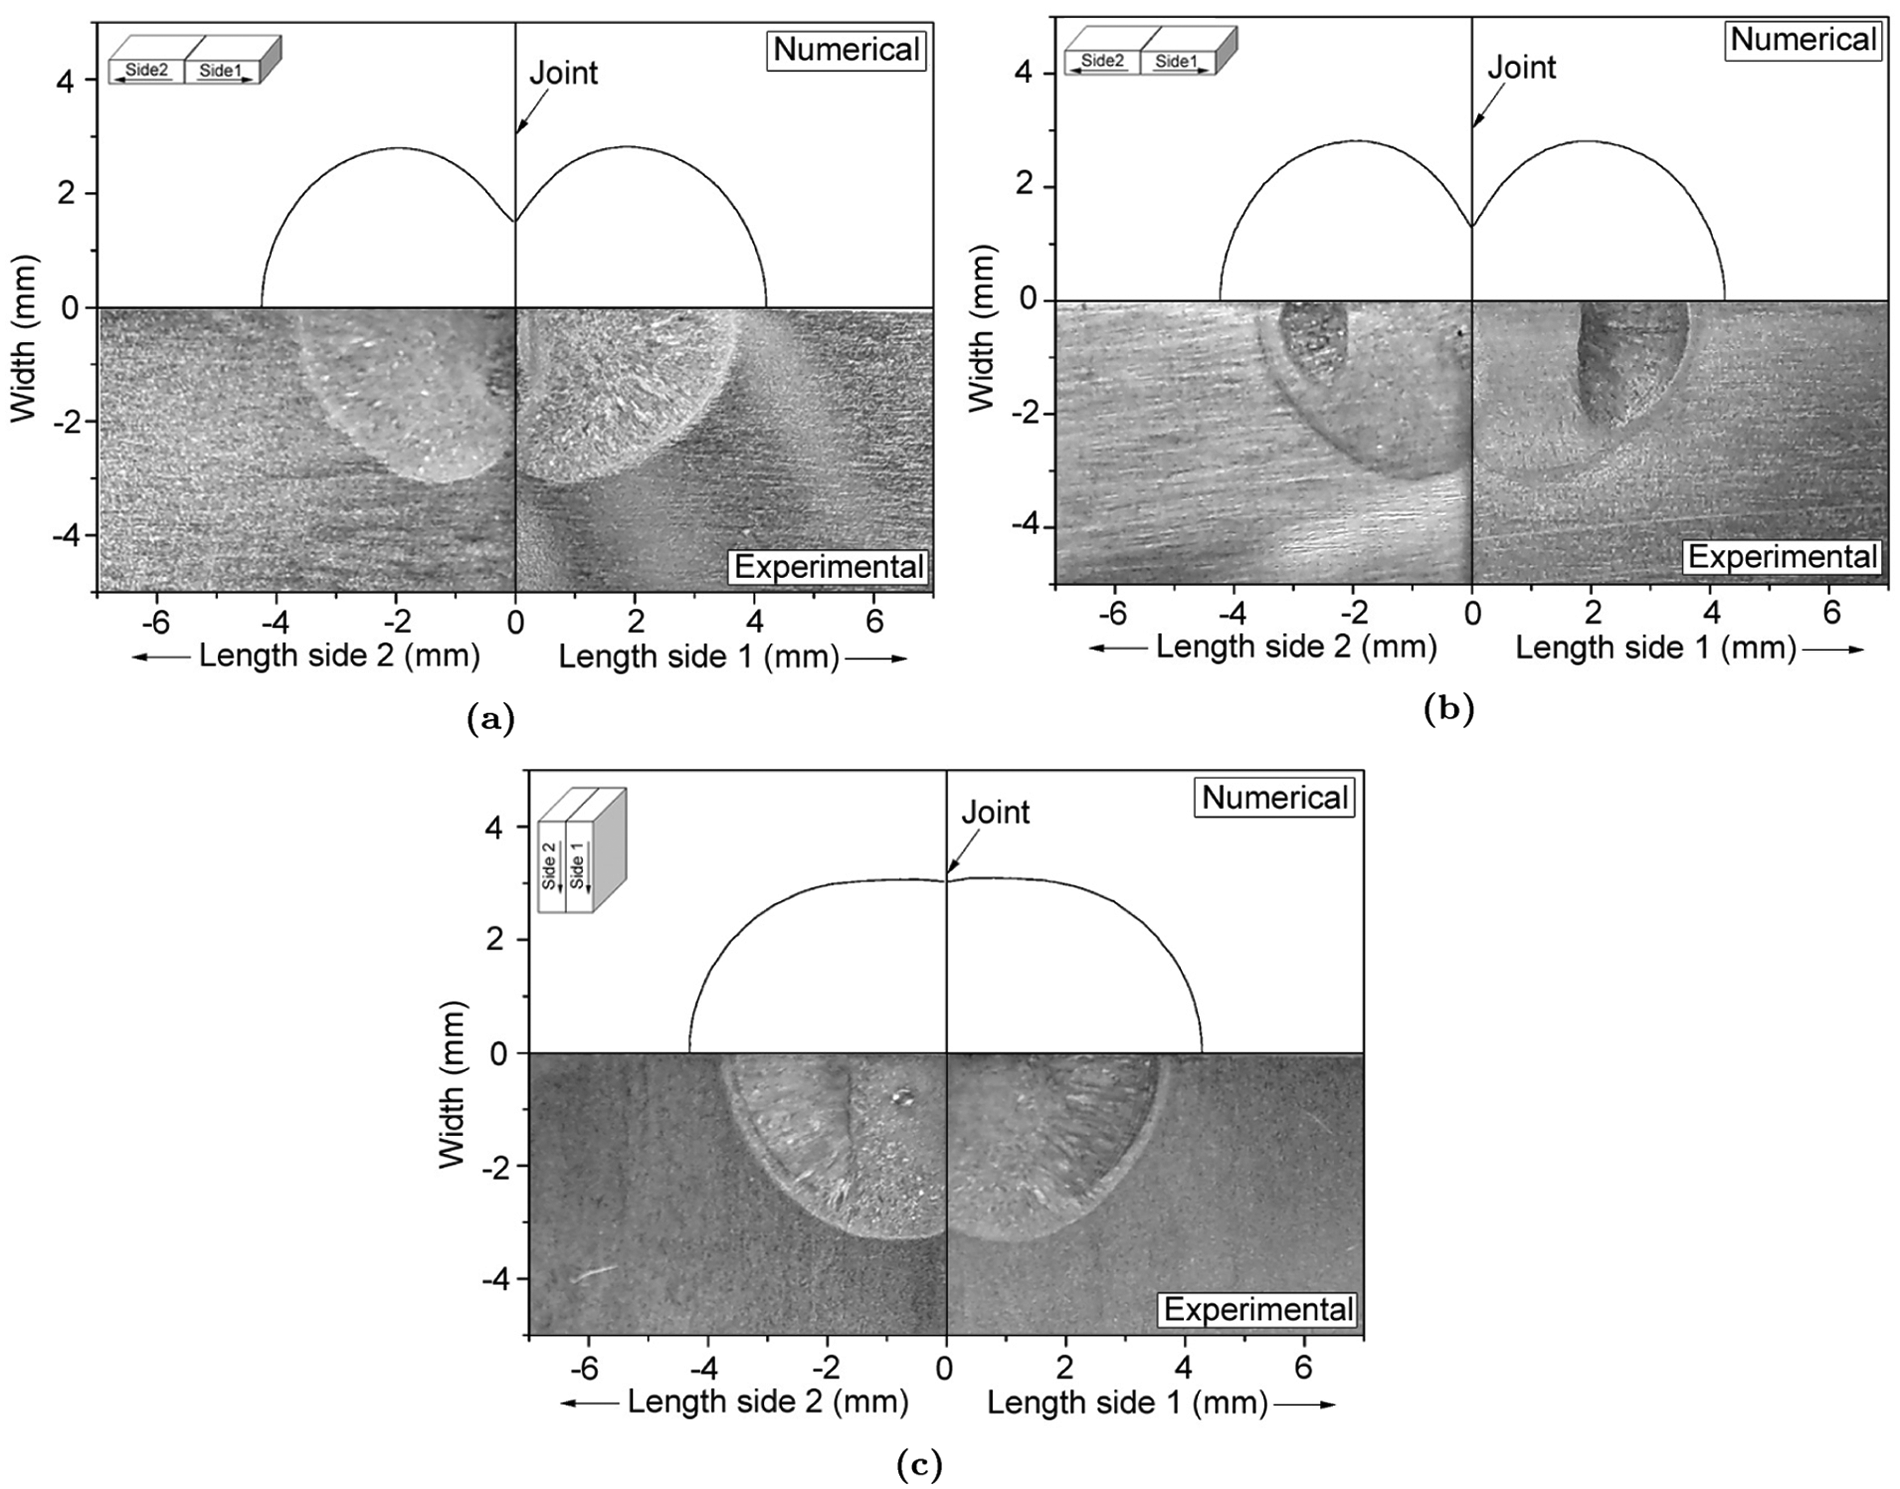
Numerical and experimental weld pool width: (a) L-shape, (b) V-shape, (c) open-corner.
Numerical and experimental results of the pool width are in good agreement and the numerical pool width is found to be 7% larger than the experimental results. Similarly, the overall numerical pool depth is observed to be 13% larger than the experimental results which shows good agreement; however, pool depth at the joint centre is observed to be slightly upwards of the numerical results (Figure 22). This is because in the experiments the molten metal flows from sides which raises the pool surface at the weld centre. This phenomenon is not considered in the analysis.
Conclusions
Three different geometries are studied in stationary GTAW to see the effect of joint orientation on the arc and weld pool. Welding conditions are the same in all three cases. The calculated arc properties such as temperature, velocity, current density, heat flux and gas shear are observed to be the same for all the joints.
Temperature on the workpiece is found to be maximum where the distance between the electrode tip and the workpiece is the minimum. The arc is observed to flow along the weld joint.
Current density and heat flux on the workpiece surface is maximum where the distance between the electrode tip and the workpiece is minimum.
The electromagnetic force in the weld pool is found to be the same in L-shape and V-shape joints. The distribution of buoyancy force is observed to be large where the temperature is large. The buoyancy force in L-shape joint is observed to be maximum on the vertical side.
Due to a wide distribution of temperature, the buoyancy force is wide at the joint in the open-corner as compared to the other two joints.
The overall weld pool width is found to be the same in all three cases; however, width at the joint is large in the open-corner joint as compared to the L-shape and V-shape joints.
The depth of pool is observed to be small in the open-corner as compared to the other two types.
It can be concluded that the arc properties are the same in L-shape, V-shape and open-corner joints and are independent of the workpiece orientation. In the case of stationary arc with no filler material, the orientation of the workpiece does not produce any significant gravity effect in the weld pool because the shear stress and Marangoni convection are much stronger than the buoyancy-driven convection. The weld pool shapes are therefore similar in L-shape and V-shape joints. Weld pool is wide and shallow in the corner-to-corner joint. The numerical results for the pool width are in good agreement with the experiments; however, the numerical results for the pool depth are found to be slightly higher in all three cases as compared to the experimental results.
Footnotes
Appendix
Funding
The authors are grateful to the ASIA-LINK FastAhead project for the financial support of this work under the Contract No. CN/ASIA-LINK/024 (109-093).