
Abstract
This experimental study investigates the effect of process parameters in a powder-mixed electric-discharge machining process on the microhardness of the deposited and the non-deposited region of the machined surface. The microscopic observations using a scanning electron microscopy revealed a transfer of material on to the workpiece during machining, leading to a formation of compounds resulting in improvement of its properties. The X-ray diffraction plots were used to assess the grain size and the micro-strain for each die steel material. The addition of tungsten or graphite powder affected the microhardness significantly, while aluminium or copper had no effect. The grain size was affected by the cooling rate and the powder used during machining besides process parameters, such as current and pulse-off time. The average grain size varied between 18 to 40 nm. Trials conducted with low melting point metallic powders slowed the cooling rate, resulting in finer grains. HCHCr, H13 or H11 die steel workpieces showed a higher average strain as compared with EN31.
Keywords
Introduction
The electric-discharge machining (EDM) process is extensively used for the manufacturing of press tools, dies and punches where a hard and abrasion-resistant machined surface is a major requirement. Many researchers have been conducting studies to modify the conventional EDM process for improving the surface properties of the machined surface. One such modification of the EDM process is to mix metallic powder with the dielectric to improve the material removal rate (MRR), reduce wear ratio (tool wear rate (TWR) to MRR), improve surface finish and alter surface properties. The process is called powder-mixed EDM (PMEDM) and uses the constituents from suspended powder, electrode and even from dielectric deposits on the machined surface under suitable process conditions. The deposition may be in free or compound form resulting in changes in the composition of the surface and impart some desirable properties. The powder may also cause changes in the sparking pattern, thus altering the properties of the machined surface significantly.
Issues related to low MRR, high wear ratio (TWR/MRR) surface finish have been experimentally investigated by many researchers. Detailed reviews of many such studies have been reported.1–3 The effect of the addition of different powders, like silicon, graphite, aluminum, etc., have been investigated for improving MRR, wear ratio (WR) or surface quality.4–6 The presence of powder particles in dielectric fluid and the concentration of powder can create conditions suitable to achieve improved machined surface quality. 7 The surface roughness and surface topography of AISI H13 die steel was affected by the addition of silicon powder and electrode area. 8 Material transfer from the electrode and tungsten powder suspended in the dielectric medium for AISI H13 die steel have been analyzed. 9 Material characterization during EDM of cemented tungsten carbide 10 and Fe–Mn–Al alloy 11 using proper process settings has been reported. A thick layer of titanium carbide or tungsten carbide was deposited, resulting in surface modification using EDM with a green impact electrode. 12 The effect of graphite and boric acid powder mixed with kerosene at different powder concentrations and pulse time settings have been investigated using a prismatic steel workpiece for surface roughness, surface profile powder spectral density, workpiece removal rate, electrode wear rate, relative wear, workpiece surface hardness and workpiece surface microstructure. 13 Experimental investigation for the enhancement of machining efficiency and surface finish of PMEDM in rough machining has been conducted. 14 Use of the right additives can increase the MRR, decrease the TWR and improve the surface quality of work, especially in mid-finish machining and finish machining. 15 The process of PMEDM has been implemented in micro-EDM of tungsten carbide (WC) with graphite, aluminium and alumina nanopowder mixed in dielectric. 16 Like conventional EDM processes, the PMEDM process also leads to residual stress and strain generation. The layer removal method has been used to measure the residual stress along the depth beneath the surface caused by die sinking type EDM. 17 Optimization of the EDM/PMEDM process has been reported using response surface methodology, 18 Taguchi technique, 19 analytic hierarchy process 20 and multi-objective optimization 21 to achieve improved process control.
To sum up, many experimental investigations have been reported in literature with regard to characteristics of the machined surface. However, comprehensive study of the material transfer mechanism and its effect on grain size and micro-strain is needed to evaluate the nature of the machined surface. This article reports the results of an experimental investigation of the PMEDM process to investigate its effect on different die steel machined surfaces. Trials were conducted using the Taguchi design of experiments to measure the effect of parameters on microhardness of the deposited and the non-deposited region. The factors and levels were chosen in such a way so as to explore the effect of different kinds of powders on the machined surface. Selected samples were then taken for detailed microscopic analysis to assess the grain size and the micro-strain for each material.
Materials and methods
Methodology
The objective of the study was to evaluate the effect of various process parameters in a PMEDM process on the microhardness of the machined surface. The resultant changes in the micro-structure have also been studied using a scanning electron microscope (SEM) and X-ray diffraction (XRD), for detailed grain analysis after machining to estimate the changes in grain size and accumulated strain. Four different kinds of commonly used die steel materials were used as the workpiece material. The factors and their associated levels were chosen on the basis of a pilot experiment by varying one factor at a time. Preliminary brainstorming helped to identify many factors and their requisite levels that were believed to influence the responses. Based on the pilot study results, seven factors, some varied at three and others at four levels, were identified as the control factors. These factors and their respective levels used during the study are discussed below. Three different types of dielectric fluids were varied. kerosene (flash boiling temperature between 150 °C and 250 °C), 22 EDM oil and transformer oil (flash point 140 °C, pour point −6 °C) 23 were used during the experimental trials. Three different electrode materials, copper (Cu), graphite (Gr) and tungsten–copper (W–Cu), were used as the tool material. Three other process parameters – current (I), pulse-on (Ton) and off time (Toff) – were also varied at three different levels each. Four metals powders were mixed (with two sets of experiments) with the dielectric fluids, as per trial conditions obtained by Taguchi’s design of experiments methodology. The powder mixed trials were also compared with trials where no powder was mixed, to study the impact of powder mixing on the machined surface properties. The other process parameters, open circuit voltage (135 V), electrode polarities (anode workpiece, cathode tool), machining time (10 min) and powder concentration (10 gm/l) were kept constant during the experimentation. The experiments were conducted for two sets of levels for some of the factors for ease of analysis. Table 1 lists the factors with their designation, units and their respective levels at which these were varied for each of the two sets, set 1 and set 2.20,24–27
Factors studied and their levels.
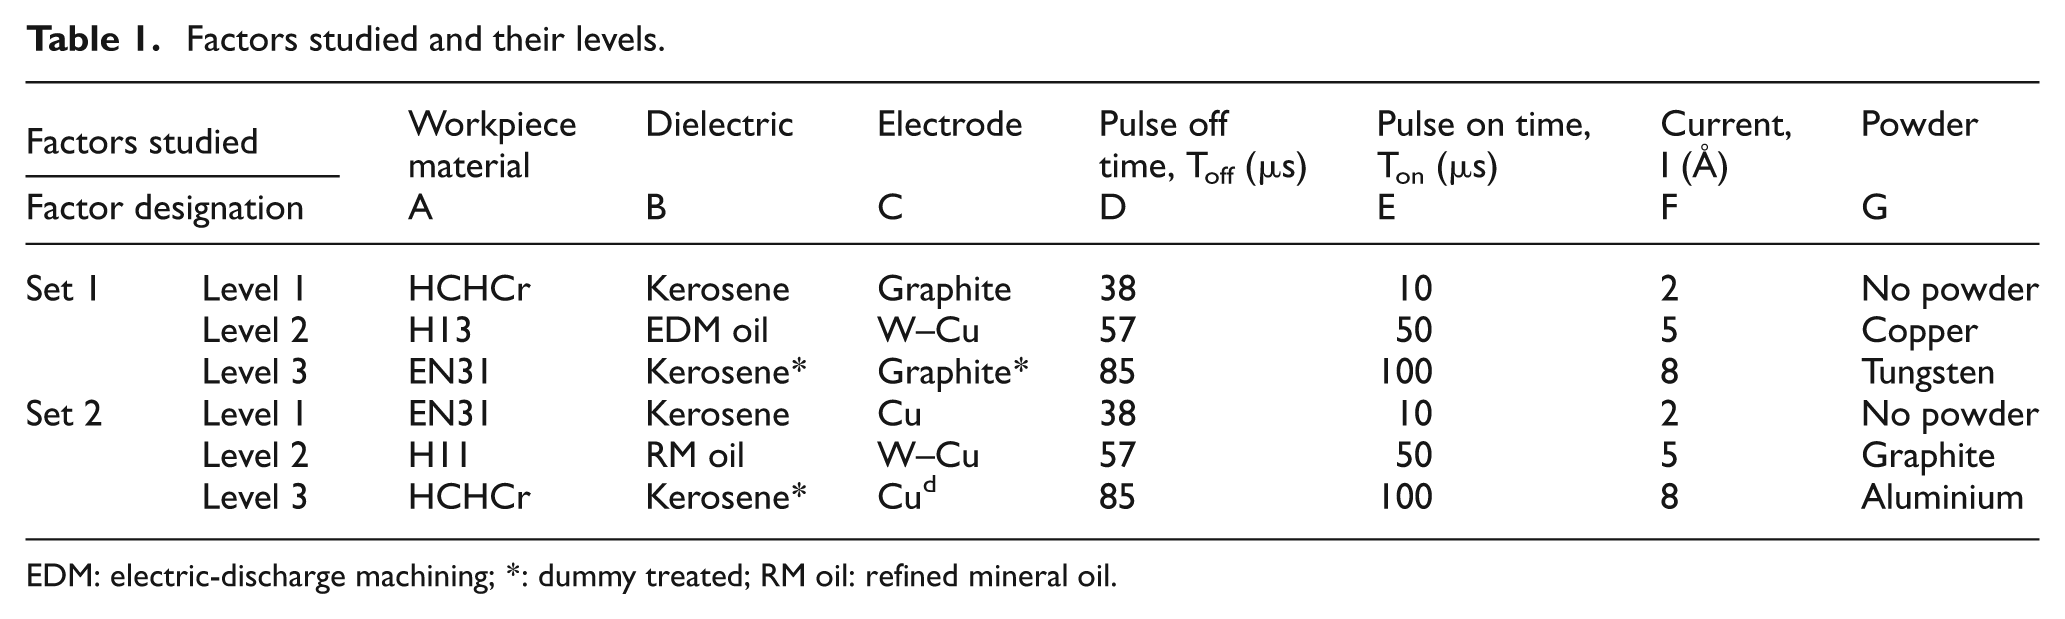
EDM: electric-discharge machining; *: dummy treated; RM oil: refined mineral oil.
Set 1
The first set provides trial conditions for three workpiece materials, namely: (i) high carbon, high chromium (HCHCr, composition: 1.6%C, 0.5%Si, 0.55%Mn, 0.03%P, 0.03%S, 13.3%Cr, 0.05%Mo, 0.07%Ni, 0.01%Co, 0.05%Cu, 0.02%Ti, 0.02%W, rest Fe); (ii) H13 (0.4%C, 1.0%Si, 0.39%Mn, 0.03%P, 0.02%S, 5.32%Cr, 1.1%Mo, 0.36%Ni, 0.01%Co, 0.01%Cu, 0.01%Ti, 0.3%V, 0.1%W, rest Fe); and (iii) EN31 (0.35%C, 1.0%Si, 0.4%Mn, 0.04%P, 0.02%S, 5.0%Cr, 0.09%Ni, 0.01%Co, 0.03%Cu, 1.0%V, 0.01%W, rest Fe) die steel. The trials were conducted using kerosene and EDM oil as the dielectric medium with two electrode materials, graphite and W–Cu. The three levels for the suspended powder were varied as (i) no powder addition; (ii) Cu powder; and (iii) W powder.
Set 2
The second set of experiments were conducted for EN31, H11 (composition: 0.39%C, 1.0%Si, 0.5%Mn, 0.03%P, 0.02%S, 4.75%Cr, 1.1%Mo, 0.01%Co, 0.01%Cu, 0.5%V, rest Fe) and HCHCr die steels with kerosene and mineral oil as dielectric fluid using Cu and W–Cu electrodes. The three levels for the suspended powder were no powder, graphite and aluminium (Al).
Chemical compositions of the workpiece materials, as mentioned above, were checked using an Optical Emission Spectrometer DV-6. Three measurements were recorded for each of the workpieces and averaged and are mentioned here. The chemical composition of tool materials was similarly measured and noted as follows: W–Cu (80.4%W, 19.46%Cu, 0.121%Ni, 0.014%Ti), Cu (99.9%Cu, 0.045%Ni, 0.029%Ti) and graphite (99.93%C). Three other process parameters (I, Ton and Toff) were varied at three levels each for both sets of experiments. Since this required a mixed experimental design, not available in regular orthogonal designs porposed by Taguchi, a new design with dummy treatment was used. The dummy treatment accommodates a two-level factor in a basic three-level orthogonal array, or vice versa, by using only two of the possible levels for the factor and simply repeating one of the levels from the two levels for the third level. Any one of the two levels for the factor can be repeated, so whichever is easiest, cheapest, or makes more sense should be repeated. 28 The total number of degrees of freedom (DOF) for the seven factors and some of their possible interactions, namely between, (i) workpiece and electrode, (ii) workpiece and powder, and (iii) electrode and powder, were calculated to be 20, which can be easily accomodated in the Taguchi orthogonal array (OA) L27 OA suitable for incorporating three levels with 26 DOF. The factors and interactions were assigned using Taguchi’s linear graph. 28 The final form of the L27 OA, along with the coded treatment conditions for each trial, is given in Table 2.
L27 OA with trial conditions and results of microhardness.
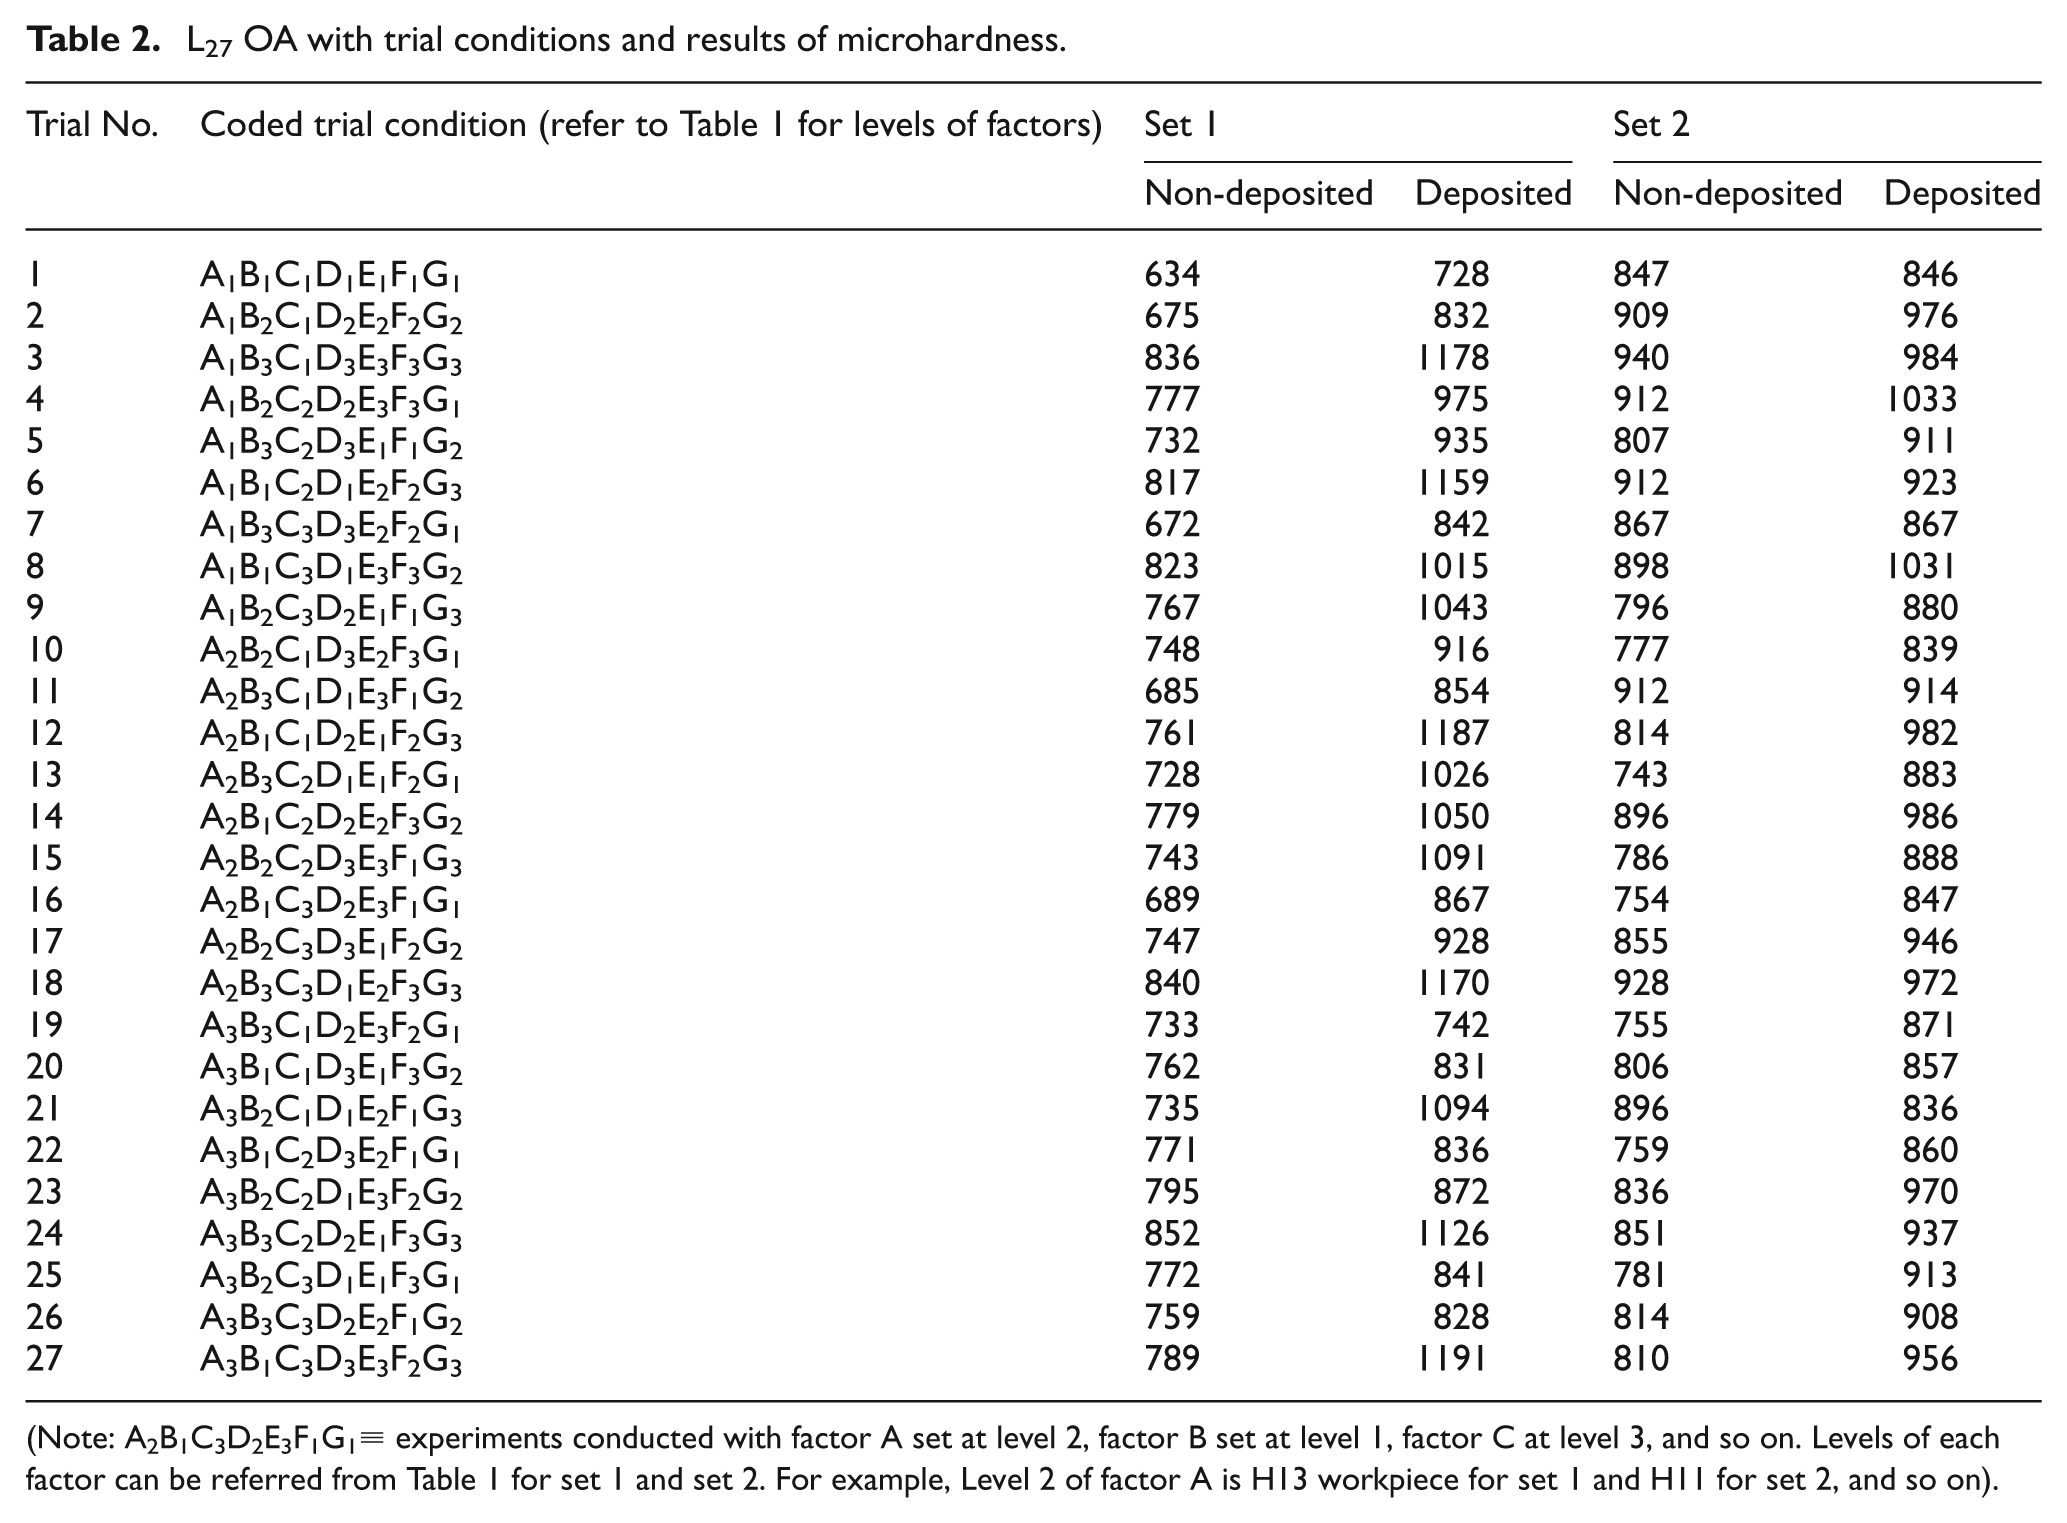
(Note: A2B1C3D2E3F1G1≡ experiments conducted with factor A set at level 2, factor B set at level 1, factor C at level 3, and so on. Levels of each factor can be referred from Table 1 for set 1 and set 2. For example, Level 2 of factor A is H13 workpiece for set 1 and H11 for set 2, and so on).
Some trial conditions, that characterized the variations in the process parameters and are likely to effect the microscopic responses, were selected from each set of experiments for detailed analysis of grain size, strain and detailed microstructure analysis with SEM and XRD. Nine trial conditions were picked from the experiments conducted in set 1 and another eight were selected from set 2.
Experimental and measurement set-up
All the experiments were conducted on an EDM Machine (Model T-3822, Victory Electromech) wherein a specially mounted tank of size 330 × 180 × 187 mm with a capacity of 9 l with motorized stirrer was used for homogeneous mixing of suspended powder particles during machining to prevent settling (Figure 1(a)). Parts of size 100 × 50 × 10 mm for each workpiece material were ground before EDM to generate a parallel surface to the face of the tool. The electrodes of different materials were machined and ground to a diameter of 20 mm (Figure 1(b)).
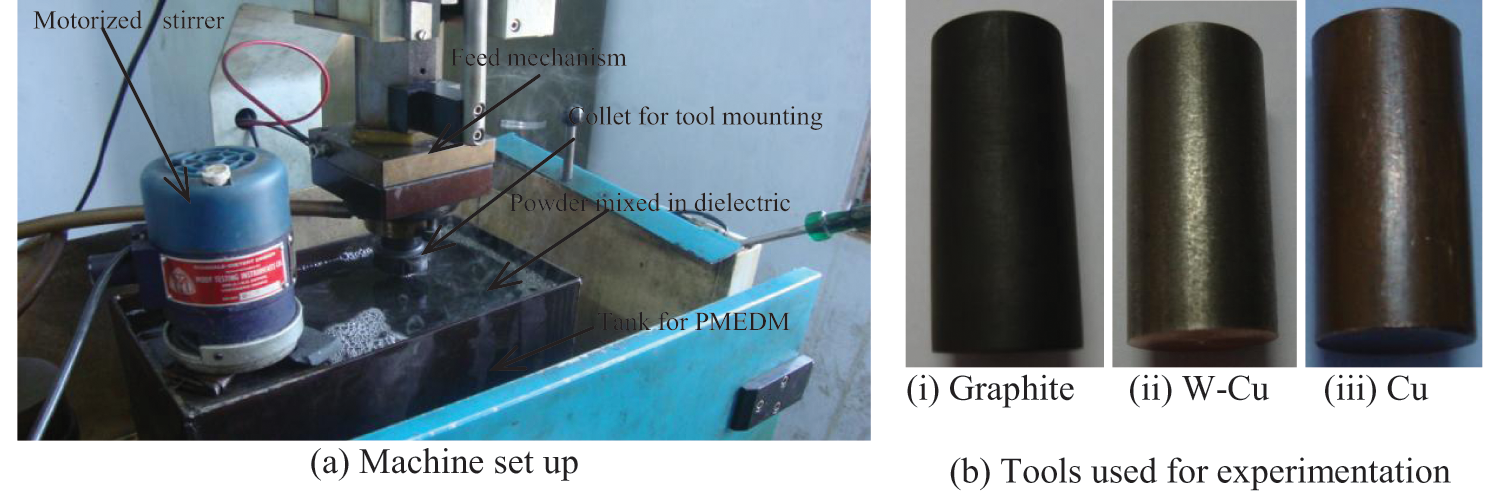
Set-up and tools used for experimentation. (a) Machine set-up and (b) tools used for experimentation.
Microhardness was measured on a computer interfaced Microhardness Tester (Model MVH-2, Metatech Industries, Pune, India) with a pyramidal-shaped diamond indenter with loading of 1 kg and dwell time of 20 s. The dimensions of indentation were measured at 40× magnification with Quantimet software. The microhardness was measured at both the deposited and non-deposited region of the machined samples. The XRD analysis was carried out on an X-ray diffraction machine available in the Material Testing Laboratory of the University. The range of 2θ varied from 5° to 100° scanned at a speed of 5°/min for each test. Microstructure was studied using a SEM.
Results and discussion
Two sets of trials per L27 OA were conducted by varying the factors at their respective levels. Microhardness was recorded for each trial at both the powder deposition region and the non-deposition region by averaging four readings at different locations. The mean microhardness of the deposited and the non-deposited region for each set is given in Table 2.25–26 The results were analyzed using analysis of variance (ANOVA) for identifying the significant factors affecting the microhardness. Since the L27 OA was dummy treated, ANOVA for dummy treated factors, like B and C, was completed using the modified equation for the sum of squares (SS)
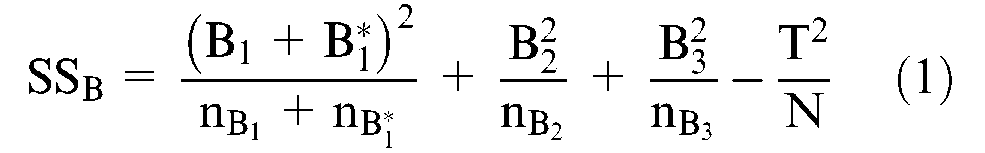
where SSB is the sum of squares owing to dummy treated factor B, B1 is the sum of responses when factor B is set at level 1 and nB1 is the number of tests when factor B is at 1st level and so on. T is the sum of all responses and N is the number of total tests (= 27 for L27 OA).
The sum of squares owing to factor C, SSC, was calculated the same way, by replacing the values related to factor B with C. Since, both B1 and B1* indicate the same factor level, the difference in the values obtained at trial settings of B1 and B1* gives the random error and is given by equation (2). The denominator of the fraction is the total number of tests involved in the comparison. 28

where SSe is the sum of squares owing to the error due to variation of responses with factor B at its 1st level and its repeated dummy level. The total sum of squares for error is the summation of SSe for all dummy treated factors and contribution from the unassigned columns in L27. 28
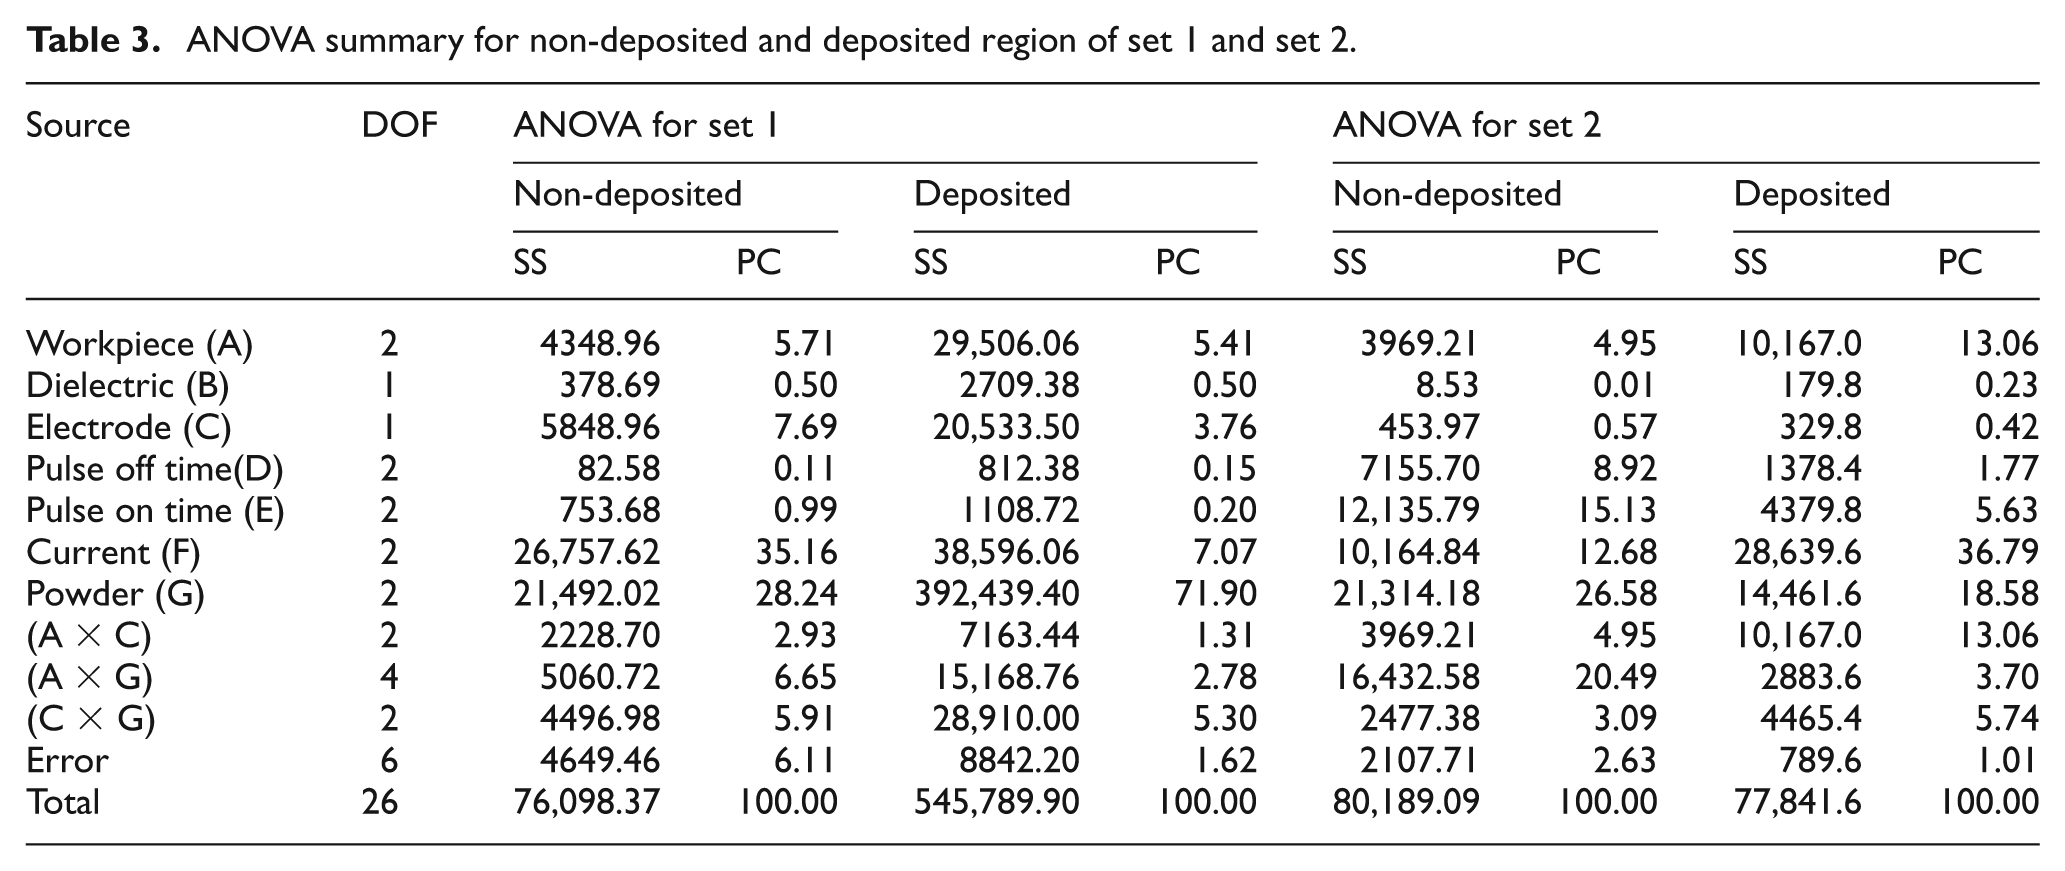
Using the SS values for all factors, interactions and error, the percentage contribution of each factor on microhardness was calculated and is given in Table 3. The percentage contribution has been represented in the form of pie charts (as detailed next) to show their significance.
ANOVA summary for non-deposited and deposited region of set 1 and set 2.
Microhardness at deposited and non-deposited regions
Analysis of trials conducted in set 1
Figure 2(a) shows the contribution owing to factors and interactions on the microhardness at the non-deposited region for trials conducted in set 1. Figure 2(a) shows a large significance of powder mixed in dielectric followed by current effecting the microhardness in the non-deposited region. The microhardness also increased in the region where significant deposition of the powder had not taken place. The increased current setting impacts the heat in the spark, effecting melting, vaporization and re-solidification of the material during machining. All other factors and interactions had little effect on the microhardness of the non-deposited region. The contribution of various factors towards microhardness in the deposited region is shown in Figure 2(b) for trials conducted in set 1. The largest contribution affecting the microhardness is the addition of powder particles in dielectric. Other factors made much smaller contributions. This phenomenon clearly points towards deposition of material from suspended powders leading to the formation of compounds during this process. This deposition of metal and formation of compounds owing to material transfer from either powder, dielectric or electrode, increased the microhardness of the machined surface. Surface modification of the machined surface is clearly seen. In trials conducted with graphite, the XRD analysis showed formation of a harder WC compound. Similarly, in trials conducted with graphite powder, cohenite iron carbide (Fe3C) was observed on the machined surface resulting in an increased microhardness. The increase in microhardness was observed to be greater with graphite powder than copper powder. The microhardness increased with an increase in current. Also, microhardness was found to be higher when machined with a tungsten electrode as compared with graphite electrode.
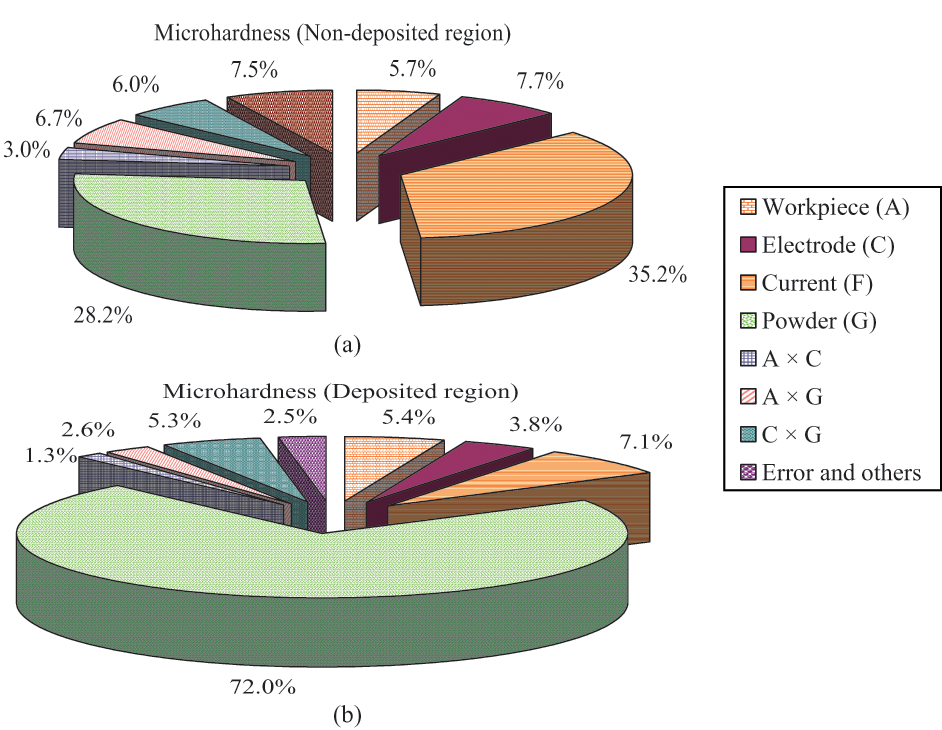
Contribution of factors for microhardness at (a) non-deposited and (b) deposited regions for set 1, using results of the L27 dummy treatment.
Analysis of trials conducted in set 2
The ANOVA results giving the SS and percentage contribution of factors and interactions are given in Table 3 under the results for set 2. The percentage contributions were plotted as pie charts and are presented in Figure 3. Figure 3(a) shows the contribution of factors and interaction in affecting the microhardness for the non-deposited region. In the non-deposited region, the workpiece, pulse-on and off time, current and powder, along with interaction between workpiece and powder, were found to be significant. However, in the case of microhardness for the deposited region shown in Figure 3(b), the significance of added powder was lower than that of current. This is owing to the fact that aluminum, which was added as one of the powders, had little effect on changing the microhardness, although graphite had. The two negated each other’s effect, making current the largest contributor in affecting the microhardness of the deposited region for trials made in set 2.
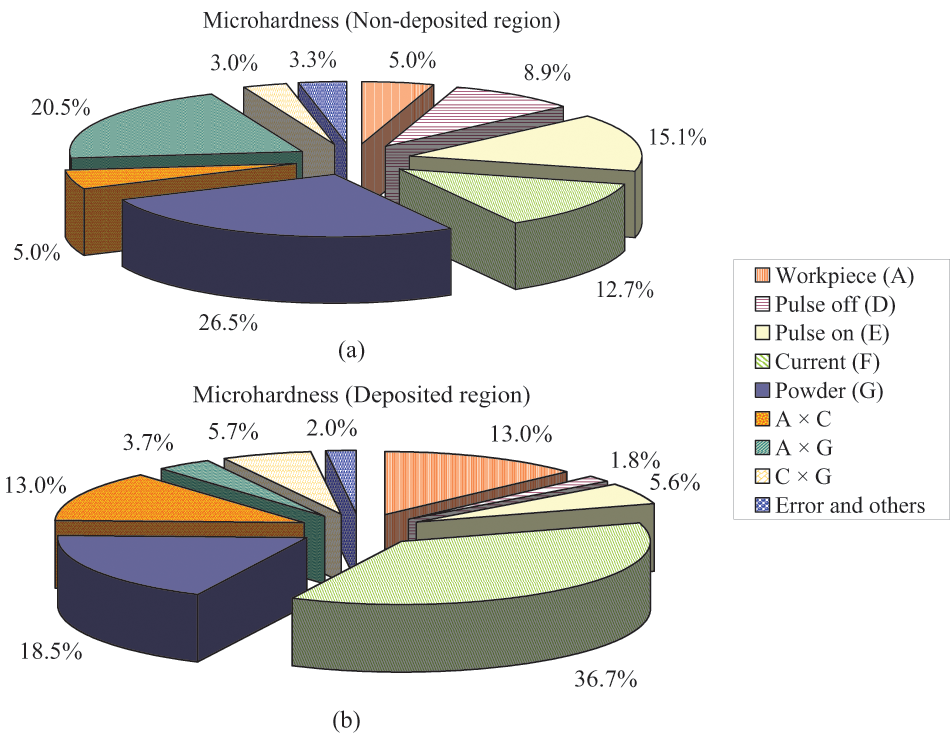
Contribution of factors for microhardness at (a) non-deposited and (b) deposited regions for set 2, using results of the L27 dummy treatment.
From the above discussion, it can be concluded that deposition of material and formation of compounds play a significant role in the increase of microhardness and altering of the surface properties. Graphite and graphite powder had a large effect on microhardness while aluminum had no effect. Using appropriate electrode material in synergetic process conditions, the material transfer from the electrode may also be possible, which can increase the microhardness. Other than powder, current was the other significant parameter in this study.
Microscopic analysis of machined surface
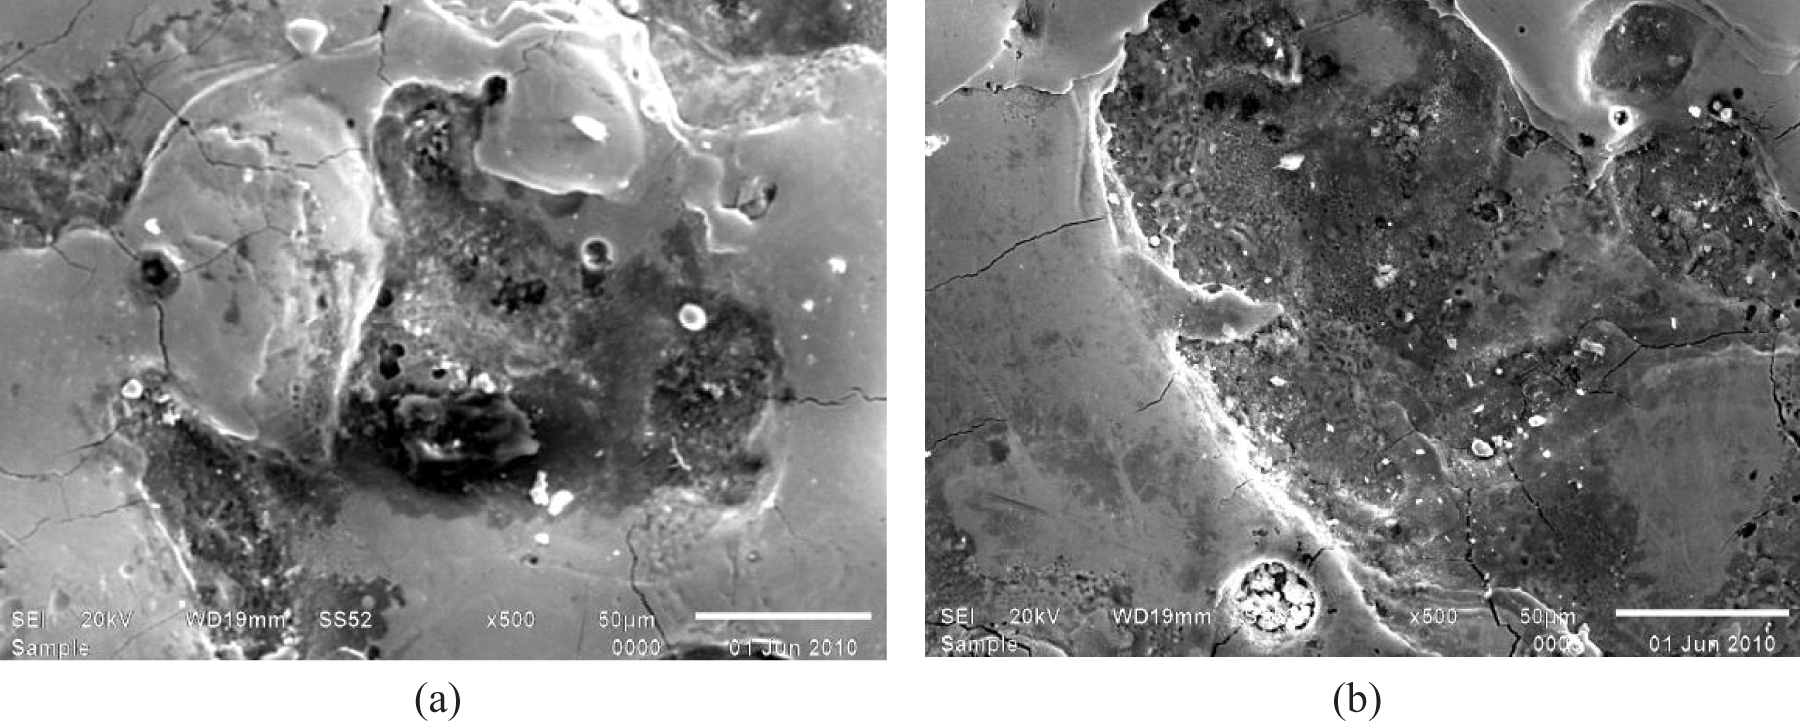
To give a detailed study of the machined surface, microscopy observations were made using a SEM. Figure 4 [adopted from Bhattacharya et al.
25
] shows the SEM (at 500×) of the machined surface of the HCHCr workpiece in two different process conditions. Figure 4(a) shows the SEM picture of the HCHCr workpiece machined with graphite electrode and copper powder mixed in EDM oil at 5
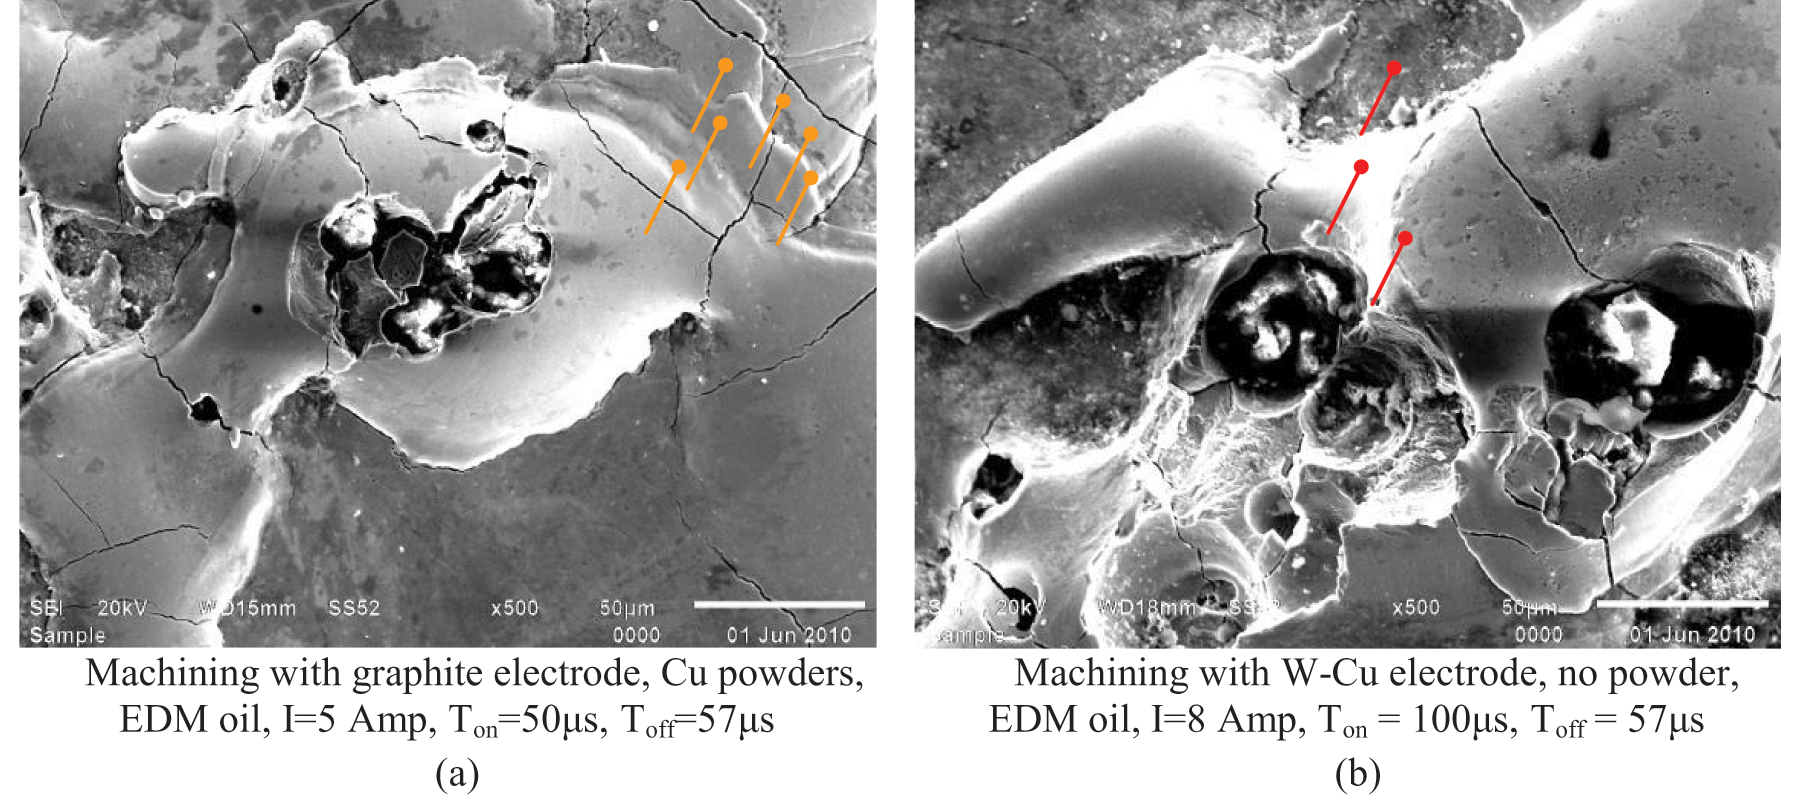
SEM images of PMEDM machined surfaces of HCHCr workpiece at 500×. (a) Machining with a graphite electrode, copper powders, EDM oil, I = 5
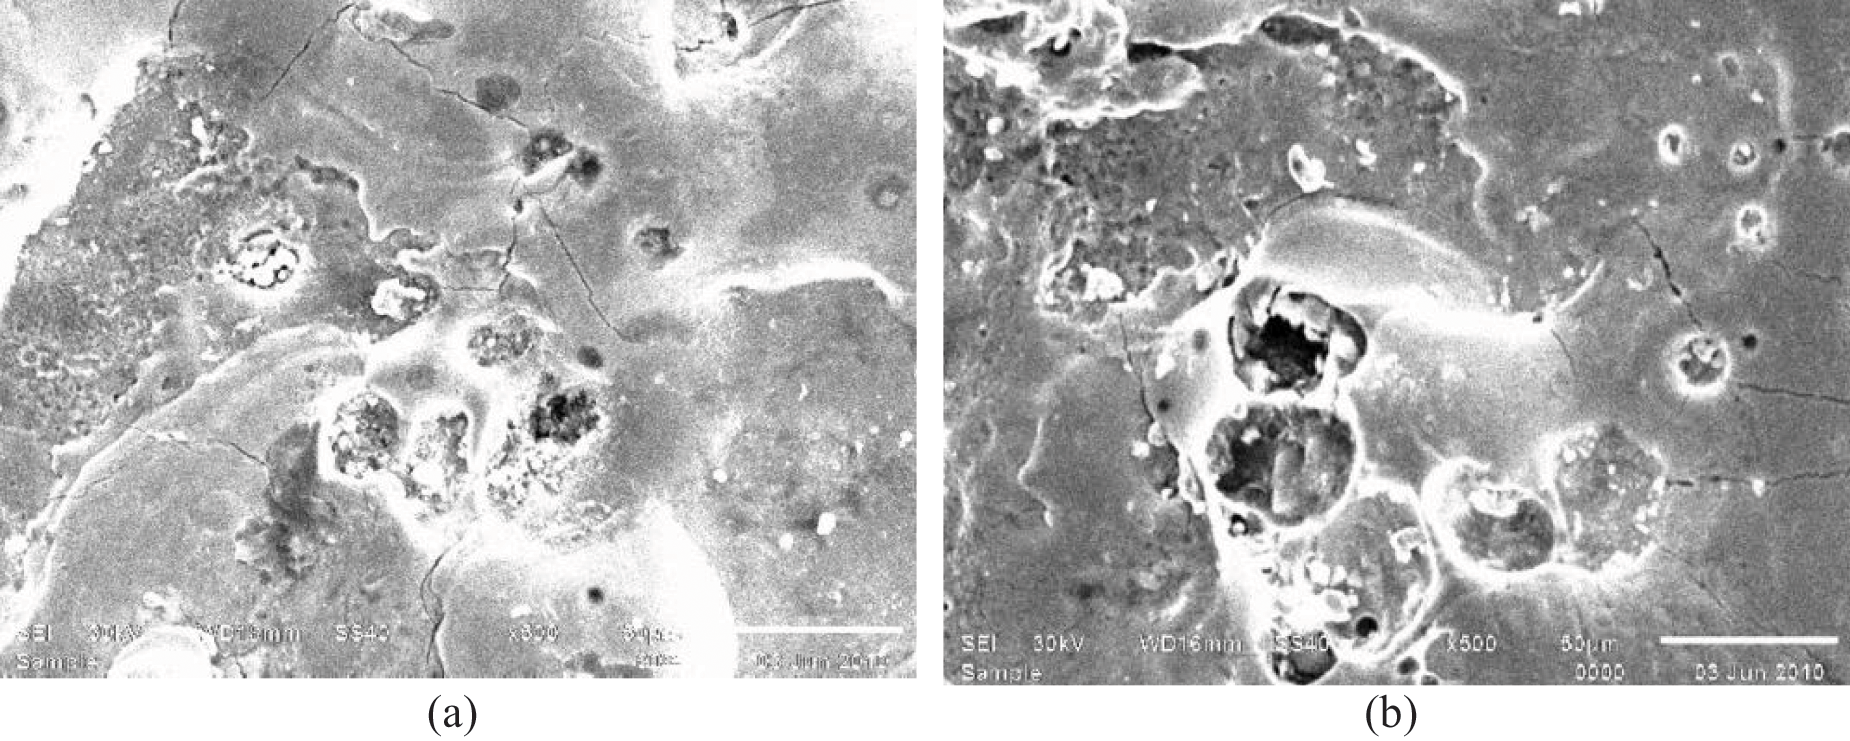
Figure 5 [adapted from Bhattacharya et al. 25 ] shows the SEM image of EN31 machined surfaces (at 500×) at two different process conditions. EN31 machined with the PMEDM process showed a different behavior as compared with HCHCr discussed above. The formation of the white layer was observed to be lower in the case of EN31 as compared with HCHCr, resulting in fewer micro cracks on the machined surface. Further, for the lower pulse-off duration, the white layer formation is more owing to the lower cooling time available within a cycle. The formation of bridging with copper powder is more than graphite powder, owing to its higher conductivity resulting in a superior surface finish. Alternatively, graphite powder resulted in a higher surface microhardness as compared with the copper powder.
SEM images of PMEDM surfaces of an EN31 workpiece at 500×. (a) Machining with a graphite electrode, copper powder, kerosene dielectric, I = 2
Figure 6(a) [adapted from Batish et al.
24
] shows the SEM image of H11 material when machined with graphite powder in kerosene. A uniform formation of white layer was observed, and also, as the machining was carried out at a low current, fine cracks were formed on the surface. Figure 6(b) shows the SEM image of EN31 when machined with mineral oil as a dielectric without powder mixing using a W–Cu electrode at 8
SEM image of H11 and EN31 workpiece at 500×. (a) H11 machined with a copper electrode in graphite mixed in kerosene (I 2
Grain size determination
The grain size was calculated using the Scherrer formula, 29 given by equation (3). As per Scherrer, peak width is inversely proportional to crystallite size (D). Assuming that peak broadening is a result of changes in grain size, and ignoring the inhomogeneous strains, the grain size is

where, D is the relative grain size (perpendicular to surface of specimen), B is the full width at half maximum (FWHM) of the XRD peak (radians), λ is the X-ray wavelength (here, λ = 1.54060
The constant of proportionality, K (the Scherrer constant), depends on several factors, such as, how the width is determined, the shape of the crystal, size distribution, etc. The commonly used value for K is 0.94, whereas it is taken as 0.89 for integral breadth of spherical crystals. Rounding off the value of K, sometimes it is also taken as 1. However, K can actually vary between 0.62 to 2.08. 30 Using K as 0.94 for the present study, the relative grain size is given

It may be noted that the relative grain size (D) is only determined owing to pure diffraction broadening, and the crystallites are measured only in the dimension normal to the surface. Since the instrumental broadening was not considered in the present study, the calculated crystallite sizes at best were used only for relative comparison and not for determining the absolute grain sizes.
XRD analysis of selected trials from each set of trial conditions, referred as set 1 and set 2 earlier, was completed to measure the relative grain size using equation (4). The selected trials for each workpiece material are given in Table 4 for set 1 and Table 5 for set 2, along with their relative grain size and average strain. The grain size for different trials and variation of FWHM with Bragg’s angle, were subsequently plotted (using the XRD data) for each material used in the two sets and are shown as part of Tables 4 and 5.
Variation of grain size and FWHM for different workpiece material under set 1.
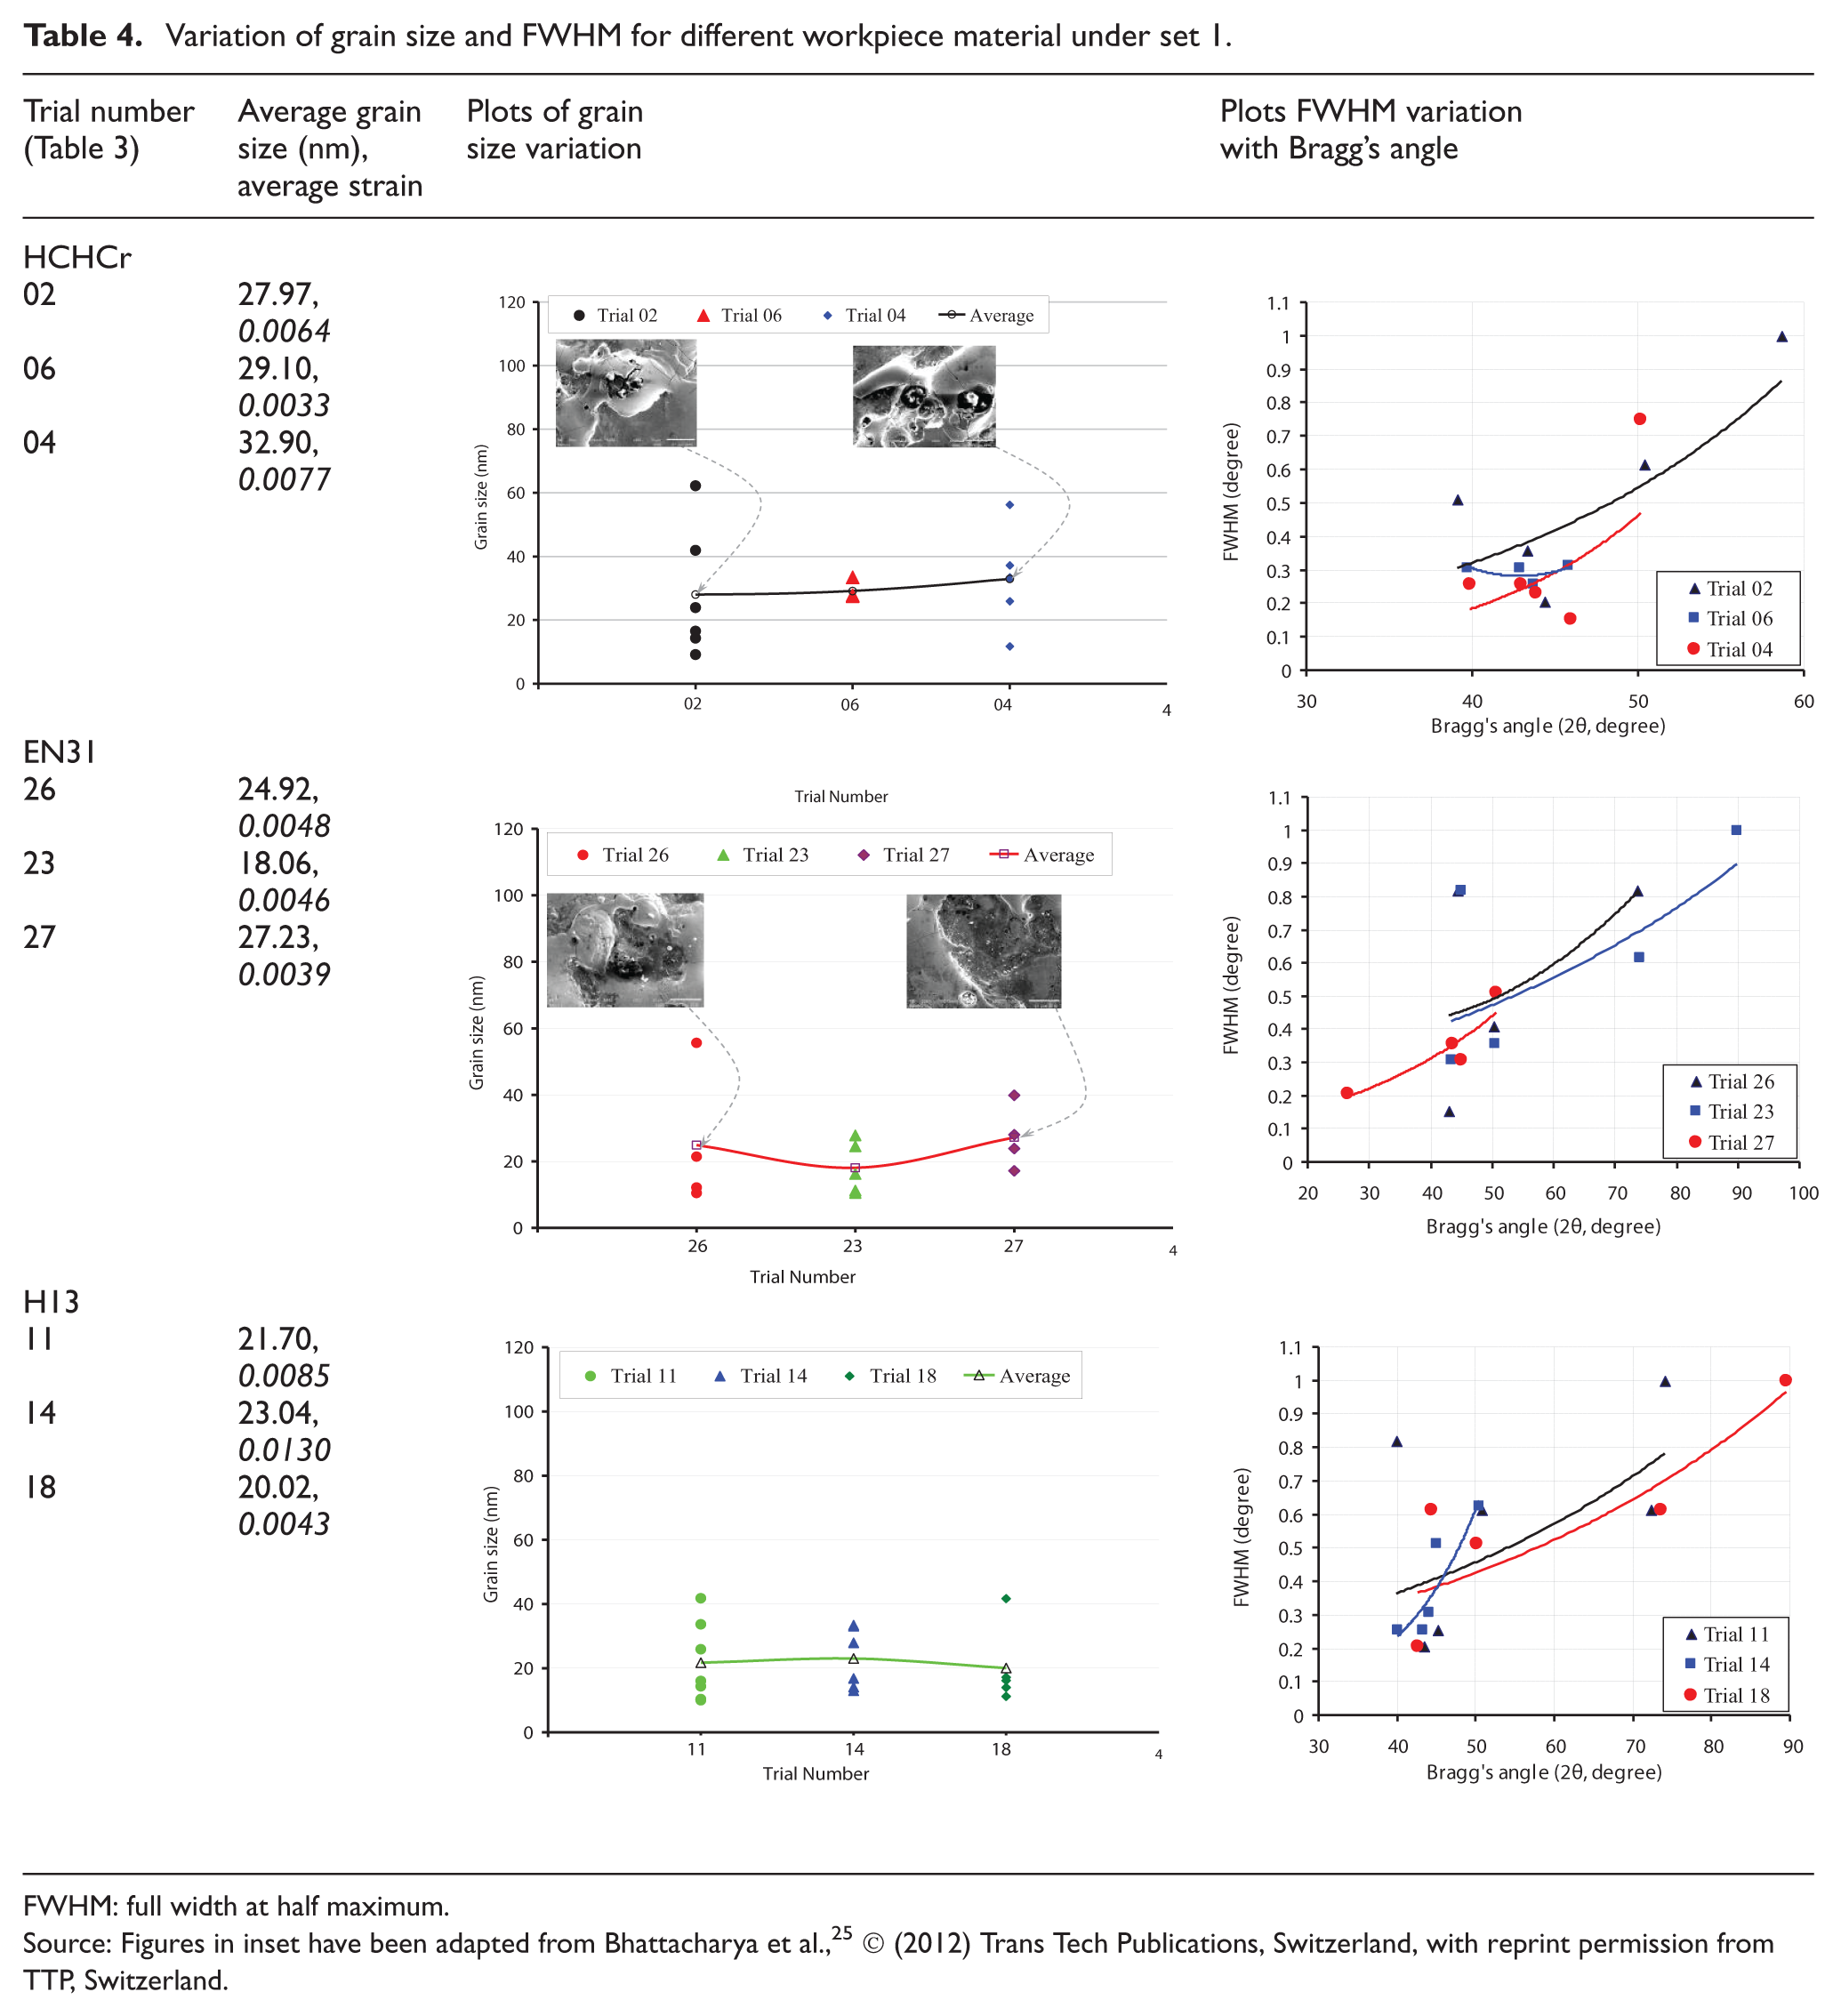
FWHM: full width at half maximum.
Source: Figures in inset have been adapted from Bhattacharya et al., 25 © (2012) Trans Tech Publications, Switzerland, with reprint permission from TTP, Switzerland.
Variation of grain size and FWHM for different workpiece material under set 2.
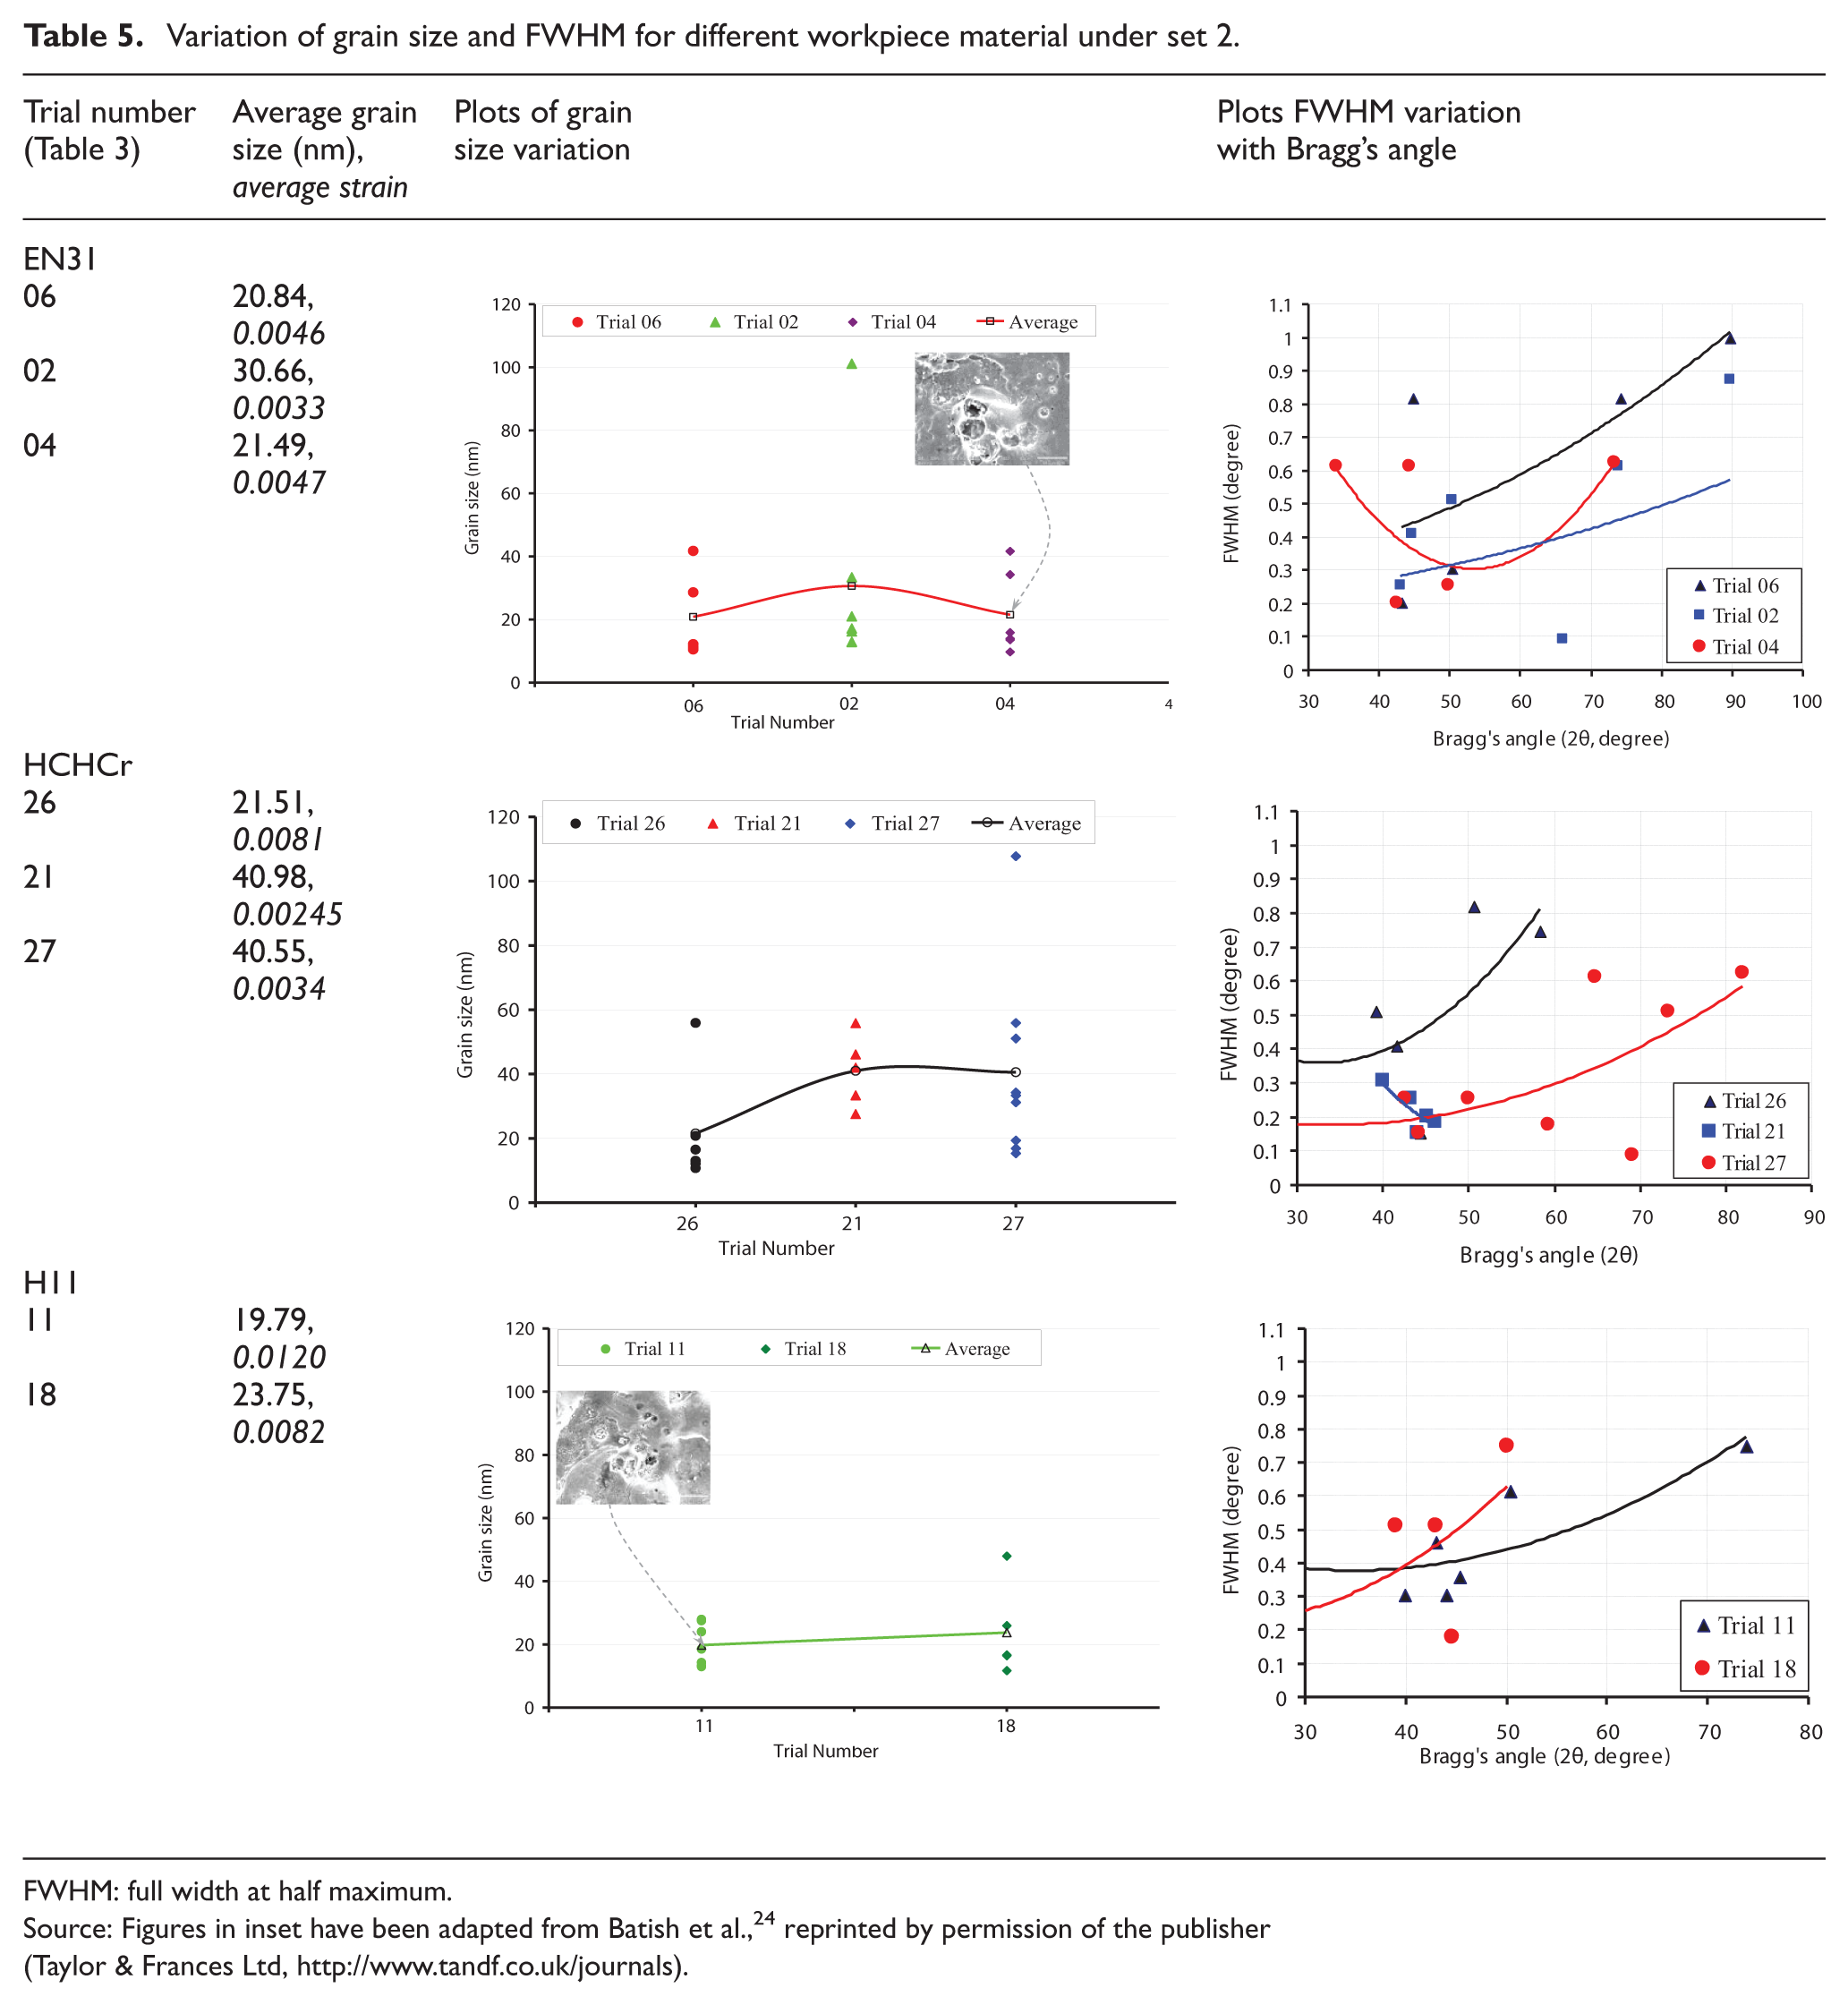
FWHM: full width at half maximum.
Source: Figures in inset have been adapted from Batish et al., 24 reprinted by permission of the publisher (Taylor & Frances Ltd, http://www.tandf.co.uk/journals).
Discussion for set 1
Table 4 shows the calculated grain sizes for set 1 trials where the scattered colored points indicate the relative grain size calculated from XRD peaks for different treatment conditions, as per the trial number in the L27 array given in Table 2. Curves were plotted between the mean values of the grain size for each of the three trials for each material used in set 1. One of the objectives of the PMEDM process is to improve the surface properties of the machined part by addition of powder and use of appropriate process settings. The surfaces with a smaller grain size exhibit superior surface properties and one of the broader objectives of this study was to identify the process conditions that would result in smaller grain sizes. The discussion below, separately for trials conducted in each set, is towards achieving this objective.
HCHCr
Trial 2 (graphite electrode, EDM oil, copper powder, 5
EN31
The smallest grain size (∼18 nm) was seen in part machined as per process conditions of trial 23 (W–Cu electrode, EDM oil, copper powder, 5
H13
The three trials considered for the H13 material showed almost similar grain size values. Trial 18 (Gr, kerosene, graphite powder, 8
Discussion for set 2
Table 5 shows the calculated grain sizes for set 2 trials. The scattered colored points on the plots indicate the relative grain size calculated from plots of XRD peaks, as per the trial number for set 2 in the L27 array given in Table 3. As in set 1, the curves were plotted for the grain size during each of the three trials for each material. As discussed above, for enhanced properties of the machined surfaces, a smaller grain size would be preferable, which can be achieved by attaining a slower rate of cooling. The results for the average grain size for each material are discussed below. In the case of the EN31 workpiece material, trial 6 (W–Cu electrode, kerosene, aluminum powder, 5
To summarize, the grain size is affected by the process parameter settings, especially current and pulse-off time, and the type of powder mixed in the dielectric to a large extent. The rate of cooling also plays a major role in determining the grain size. The average grain size of the PMEDM surface varies between 18 to 40 nm. Other conclusions that can be drawn from this discussion are: (i) kerosene as a dielectric provides better and faster cooling compared with EDM oil or mineral oil owing to its high heat absorption capability for deionization; (ii) the addition of lower melting point metallic powders leads to slower cooling and (iii) a higher pulse-off time setting slows down the cooling rate, resulting in small grain sizes.
Peak broadening, microstrain broadening and strain calculation
Owing to destructive interference and finiteness of the crystal, the diffraction peak is not sharp and appears as a source of line broadening. Other than crystalline broadening, other sources, such as residual strain, instrumental effects and stacking faults, also broaden the XRD peaks. Thus, total broadening B is

where Bi is the instrumental broadening (appears owing to unresolved peaks, non-monochromaticity of the source, imperfect focusing, etc.), Bc is the crystalline broadening, Bs is the broadening owing to residual strain (arising from dislocations, coherent precipitates, etc.), BSF is the broadening owing to stacking fault and Bothers is the broadening owing to other crystalline defects (as any kind of defect contributes some broadening).
Generally, neglecting staking fault and other defects, and subtracting Bi, the broadening effect owing to the sample can be obtained if strain broadening is known. For different peak profiles like Lorentzian or Gaussian, equation (5) is approximated as
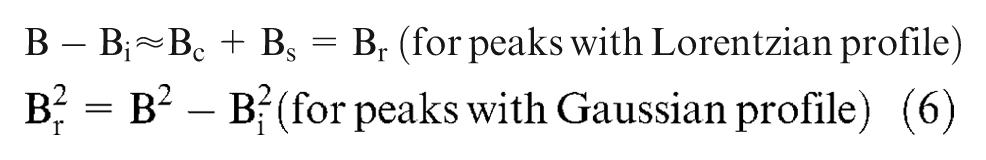
Also using geometric mean

For Gaussian profiles, Scherrer’s formula (
Substituting the crystalline size broadening and strain broadening in equation (6), Br is expressed as under
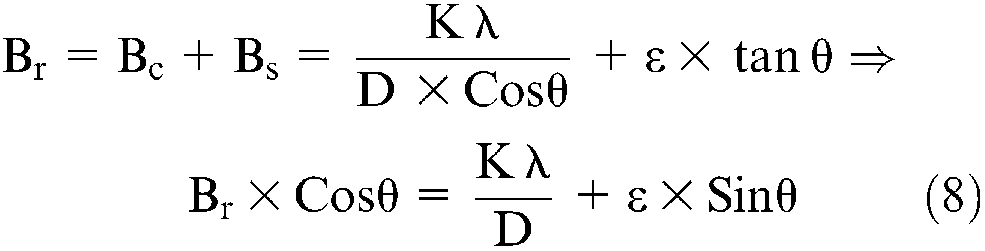
where strain broadening Bs = ε × tanθ, ε being the residual strain. In the plot Br × cosθ versus sinθ, the slope indicates the strain, ε (the larger the slope, the larger the strain), and the larger the intercept Kλ/D, thesmaller the crystalline. The same can also be interpreted from the plots of FWHM versus Bragg’s angle, where a larger slope will denote comparatively larger residual micro-strain.
Micro-strains are lattice strains from displacements of the grains (from their normal positions) that are often produced by dislocations, surfaces and domain boundaries, etc., very common in nano size grain formations. Many of the process parameters, owing to the nature of the process, can lead to micro-strain accumulation. The factors that generally contribute to micro-strain broadening of the XRD peak are quick dislocation, non-uniform lattice distortions, anti-phase domain boundaries and grain surface relaxation. Some other factors, like faulting (stacking fault), solid solution inhomogeneity, temperature variation, etc., also contribute to broadening. In the present study, the grain sizes are above 10 nm, also the temperature factors and anti-phase boundary, owing to the solvent rejection at a high rate of cooling, is usual, which will lead to the micro-strain at the solidified grains of the PMEDM surfaces. The peak broadening, owing to micro-strain, will vary as

where ε is the strain, θ is the Bragg’s angle and B is the FWHM to be calculated in radians.
It is widely believed that, when crystallites are less than approximately 100 nm in size, appreciable broadening in the X-ray diffraction lines will occur. These regions may, in fact, correspond to the actual size of the particles. At other times, however, these regions form domains in the larger particle and may be a distinguishing and important feature. In either case, the observed line broadening can be used to estimate the average size. In the simplest case, where the particles are stress-free, the size is estimated from a single diffraction peak. But in those cases where stress may be present, a more robust method involving several diffraction peaks is required. Considering crystalline broadening, strain broadening and instrumental broadening, the following equation has been used 31
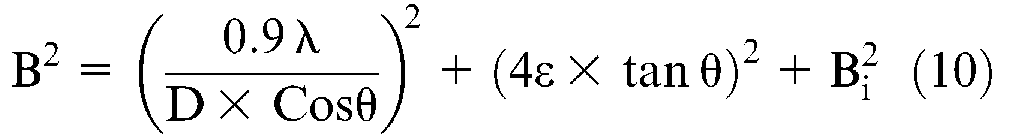
There are many assumptions and simplifications adopted by researchers. Avoiding these complicacies, a simple method can be applied where the micro-strain values can be calculated for a relative comparison of the effect of process parameters using equation (9). Calculating the strain owing to each of the peaks arrived during XRD analysis, the strain values were calculated and are given in Tables 4 and 5 for sets 1 and 2, respectively. The plots against each trial condition in these two tables show the variation of FWHM with the Bragg’s angle for each workpiece. The curves fitted, using the least square method through the points for each workpiece in both sets, are shown in the last column of Tables 4 and 5. In the plots, the slope of the curve gives a relative measure of the strain. The higher the slope, the higher the strain will be. In the set 1 trials, the HCHCr and H13 workpieces showed higher strain as compared with EN31. In set 2 trials also, the residual strain was observed to be higher in HCHCr or H11 die steel material as compared with EN31.
Conclusion
In the present study a detailed experimental investigation of the PMEDM process and its effect on the machined surface for four different kinds of die steel workpiece materials was investigated. A comparison of trials conducted with no powder mixed with dielectric, with trials where different powders were mixed, showed deposition of material and formation of compounds resulting in an increase in microhardness. SEM observations revealed material transfer from suspended powders, electrode material and dielectric, and their presence on the machined samples, was verified by XRD study. Mixing of graphite or graphite powder had the most significant effect on microhardness, whereas aluminum or copper powder had no significant effect in changing the microhardness. From the XRD results of carefully selected trials, the grain size and strain values were obtained for each material. The cooling rate and setting of critical process parameters, besides the use of appropriate powder, played a significant role in the formation of grain size. The average grain size of the PMEDM machined surface varied in the range 18–40 nm. Mixing of low melting point metallic powders slowed the cooling, resulting in finer grains. Higher pulse-off time setting also slows down the cooling rate, thus leading to smaller grain sizes. HCHCr, H13 or H11 die steel workpieces showed higher than average strain as compared with EN31.
Footnotes
Acknowledgements
Authors thank Mr Gurpreet Singh and Mr Gurmail Singh for participating in this experimental study as part of their Masters dissertation under the guidance of the authors.
Funding
The authors sincerely acknowledge the Department of Science and Technology, Government of India for the financial support provided for the study.